indian institute of management calcutta wps no 865 / june 2021
TRANSCRIPT

1
Indian Institute of Management Calcutta
Working Paper Series
WPS No 865 / June 2021
Drivers of Sustainability, Sustainable Business Practices and their Impact on Firm Performance: An Exploratory Study of Indian Manufacturing Small and Medium
Enterprises
Subrata Mitra*
Professor, Operations Management Group IIM Calcutta, Joka, Kolkata 700104, India
Email: [email protected]
*Corresponding author
Indian Institute of Management Calcutta, Joka, D.H. Road, Kolkata 700104
URL: https://www.iimcal.ac.in/faculty/publications/working-papers/

2
Drivers of Sustainability, Sustainable Business Practices and their Impact on Firm
Performance: An Exploratory Study of Indian Manufacturing Small and Medium
Enterprises
Prof. Subrata Mitra1
Abstract
Sustainability and sustainable business practices have become very relevant in today’s context in
the backdrop of growing environmental pollution and social inequity. As far as industrial activities
are concerned, large companies would seem more responsible than small and medium enterprises
(SME) for harming the environment; however, SMEs representing well over 90% of worldwide
businesses cannot shirk their responsibility either. Although the individual impact of SMEs on the
environment may be minimal, collectively they cause a lot more impact on the environment than
large companies. In this paper, an exploratory study of Indian manufacturing SMEs has been
conducted in terms of the causal relationships among the drivers of sustainability, sustainable
environmental and social practices, and firms’ financial/non-financial performance. The study
develops a scale relevant in the context of Indian SMEs, which can be used in future research, not
only for Indian SMEs, but also for SMEs belonging to other developed and developing countries.
One of the most important contributions of the study, which distinguishes it from the extant
literature, is that the study considers all the three dimensions – economic, environmental and social
– of sustainability, and takes an integrative view in exploring the causal relationships among the
drivers of sustainability, sustainable business practices and firm performance.
Exploratory/confirmatory factor analysis and structural equation modelling have been employed
for data analysis. Some of the major findings of the study are as follows. There is a strong positive
impact of the leadership and ethical orientation of owners/managers and employees on sustainable
waste management and human resource management (HRM) practices, environmental benefits
realized by firms due to adoption of sustainable practices and firms’ financial/non-financial
performance. No relationship has been found between sustainable waste management practices
1 Professor, IIM Calcutta, Email: [email protected]

3
and environmental benefits or firm performance. However, a strong positive association has been
found between sustainable HRM practices and eco-friendly waste management. Although no
direct relationship has been found between sustainable HRM practices and firm performance,
sustainable HRM practices have an indirect positive impact on firm performance through the
mediating role of environmental benefits. Further, the effects of moderating variables on the causal
relationships have been explored. The study highlights the managerial implications of the results
for Indian manufacturing SMEs, government/regulatory authorities and industry
associations/chambers of commerce. The study concludes with possible directions for future
research.
Keywords: Sustainability; Manufacturing SME; India; Survey; Factor analysis; Structural
equation modelling

4
Drivers of Sustainability, Sustainable Business Practices and their Impact on Firm
Performance: An Exploratory Study of Indian Manufacturing Small and Medium
Enterprises
Introduction
Sustainability and implementation of sustainable practices in business are growing in importance
day by day. As already known, sustainability has three dimensions – economic, environmental and
social. While the economic dimension has always been important to business for survival, the
environmental and social dimensions are also getting equal, if not more, importance nowadays for
assessing sustainable performance. Environmental sustainability is getting prominence in light of
increased air, water and soil pollution caused by greenhouse gas (GHG) emissions, discharge of
untreated effluents and disposal of hazardous materials. One of the major sources of environmental
pollution is industrial activities that should now focus more on pollution prevention than on
pollution control as pollution control is perceived as an end-of-pipe solution resulting in
inefficiency, rework, loss of time, effort and resources, and loss of goodwill to customers (Porter
and van der Linde, 1995; Sangwan, 2011). Pollution prevention may be achieved by source
reduction, reduction of hazardous materials in product design, use of more bio-degradable and
recyclable components in so-called Design-for-Environment (DfE), lifecycle analysis (LCA) of
products in terms of their energy consumption and generation of waste until the end-of-life or end-
of-use, investment in energy-efficient technology and production processes, and training and
development of employees. Besides environmental sustainability, social sustainability has also
assumed importance in terms of protection of human rights, fulfilling the expectations of various
stakeholders and development of local communities. Social sustainability may be thought of
having two sub-dimensions – internal and external. The internal sub-dimension is related to
providing a safe and healthy working condition to employees, maintaining employee welfare,
dignity and indiscrimination at the workplace, and training and development of employees to help
them achieve personal and professional goals. The external sub-dimension, on the other hand,
relates to entities and objects external to business, such as fulfilling the expectations of the
government, non-government organizations (NGOs), various interest groups, society, community

5
and general public at large by providing direct and indirect employment/earning opportunities,
education, training, infrastructure, safe drinking water, sanitation and medical facilities to local
communities.
So far, in the literature, the focus has been more on large companies than on small and medium
enterprises (SMEs) in terms of implementation of sustainable business practices (Torugsa et al.,
2012; Singh et al., 2015; Leonidou et al., 2017; Courrent et al., 2018; Boakye et al., 2020; Dey et
al., 2020; Eweje, 2020; Sendlhofer, 2020). Compared to SMEs, large companies are more often in
the spotlight on account of their environmental and social practices. Besides government
regulations, there are pressures from stakeholders to improve their environmental and social
performance. Large companies have financial, technical and qualified human resources, which
make it easy for them to acquire different quality, environmental management system (EMS) and
occupational health and safety certifications, invest in green technologies, collaborate with or
enforce strict environmental and social norms on suppliers, and train employees for awareness and
skill development (Singh et al., 2015; Ashton et al., 2017). By adopting sustainable business
practices and pollution prevention opportunities, many large companies have been able to realize
economic benefits, increase competitiveness, and improve brand image and reputation (Hussey
and Eagan, 2007). SMEs, on the other hand, have received less attention than large companies
because of their size and scale of operations. Many SMEs are unaware of the environmental
impacts of their operations and the financial benefits of environment-related investments, and
consider such investments unworthy and exhibit lower adoption rates for environmental practices
(Fleiter et al., 2012; Johnson and Schaltegger, 2016; Boakye et al., 2020). Indeed, taken
individually, an SME contributes less environmental pollution and has less social implications than
a large company (Simpson et al., 2004; Lawrence et al., 2006; Lewis and Cassells, 2010; Williams
and Schaefer, 2013; Johnson and Schaltegger, 2016; Leonidou et al., 2017). However, holistically,
SMEs, taken together, contribute significant amounts to the gross domestic product (GDP) and
exports, and provide direct and indirect employments to the majority of the population of a country
compared to large companies. For example, Hussey and Eagan (2007) mention that worldwide
SMEs represent 70-98% of businesses, with percentages on the higher side (> 95%) for most of
the countries. According to Witjes et al. (2017), SMEs encompass at least 95% of private sector
companies and employ more than two-thirds of the workforce. In the European Union (EU), there
are 22 million SMEs, representing 99 of every 100 businesses and employing 89 million people,

6
i.e. 2 in every 3 employees (Viesi et al., 2017). In the US, SMEs account for approximately 66%
of all employment and 56% of payroll (Ashton et al., 2017). Simpson et al. (2004) and Williams
and Schaefer (2013) note that SMEs are a vital part of the UK economy, representing 99.8% of
businesses and providing 43% of private sector employment. According to Dey et al. (2020), the
total number of SMEs in the UK is 5.7 million and they employ close to 15.8 million people,
contributing 20% of the GDP. They are likely to contribute £250 billion by 2025. In Spain, SMEs
account for 99.9% of businesses, generate 78% of employment and contribute 68% of the gross
value added (Fernandez and Camacho, 2016). In Australia, 97% of all businesses are SMEs
(Caldera et al., 2018) that provide employment to 49% of the private sector workforce (Gadenne
et al., 2009). In New Zealand, SMEs constitute 97-99% of all businesses (Lawrence et al., 2006;
Lewis and Cassells, 2010; Lewis et al., 2015). Chinese SMEs have contributed 48.9% of tax
revenue and created 80% of new jobs (Chen et al., 2017). In Singapore, SMEs constitute 99% of
local enterprises, contributing close to 50% of the GDP (Tan et al., 2015). SMEs in Japan
contribute 70% of total employment and 20% of the GDP (Eweje, 2020).
Collectively, the environmental and social implications of SMEs are much more significant than
large companies for a country (Leonidou et al., 2017; Eweje, 2020). Johnson and Schaltegger
(2016), Johnson (2017), Ashton et al. (2017), Witjes et al. (2017) and Caldera et al. (2018) estimate
that SMEs are responsible for 70% of the global pollution and more than 70% of the industrial
wastewater discharge (Chen et al., 2017). Yet another estimate indicates that SMEs are responsible
for 80% of industry’s adverse environmental impacts and more than 60% of commercial waste
(Aghelie, 2017). In the UK, SMEs contribute 60% of GHG emissions (Simpson et al., 2004).
Therefore, there is an urgent need to focus on SMEs, besides large companies, for improvement
of their environmental and social performance. Compared to large companies, SMEs face hurdles
in accessing financial, technical and qualified human resources such that implementing an EMS
or a quality management system, investing in environment-friendly technologies and processes,
and engaging in community development are not an easy task for them (Lee and Klassen, 2008;
Gadenne et al., 2009; Torugsa et al., 2012; Becherer and Helms, 2014; Tan et al., 2015; Fernandez
and Camacho, 2016; Johnson and Schaltegger, 2016; Jones and de Zubielqui, 2017; Leonidou et
al., 2017; Courrent et al., 2018; Bakos et al., 2020; Dey et al., 2020). Moreover, the employees of
an SME are so hard-pressed for time that there is little time they get for training and skill
development (Gadenne et al., 2009; Lewis and Cassells, 2010; Johnson and Schaltegger, 2016;

7
Eweje, 2020). Implementation of environmental practices usually incurs short-term costs that
outweigh benefits; however, in the long term, benefits are expected to outweigh costs. While large
companies can bear short-term costs, SMEs do not have the financial muscle to incur additional
expenses without commensurate benefits. Therefore, it is proposed that for SMEs, the transition
process should be incremental (Boakye et al., 2020). In this context, the government has a major
role to play. For example, the government may announce economic incentives such as soft loans,
tax exemptions and subsidies, and organize training programmes to encourage SMEs to adopt
sustainable practices (Lee and Klassen, 2008). Industry associations may also raise awareness, and
provide advisory, consultative and informational services to SMEs. A lot also depends on the
vision, values and beliefs of owners/managers since many of the SMEs are family-managed
businesses. Besides compliance with government regulations, pressure from stakeholders and
perceived benefits of economic and competitive advantage, values, beliefs and the ethical nature
of owners/managers also drive SMEs towards adoption of environmental and social sustainability
practices. To encourage SMEs to adopt sustainable business practices, strong cases based on in-
depth qualitative interviews need to be built up demonstrating both short-term and long-term
advantages (Lee and Klassen, 2008; Williams and Schaefer, 2013; Wu et al., 2015; Chen et al.,
2017; Johnson, 2017; Witjes et al., 2017; Caldera et al., 2018). Enforcement and compliance with
regulations will work to some extent in the short term; however, for sustainable practices to
succeed in the long term, financial assistance, collaborative arrangements and willingness on part
of SMEs to voluntarily adopt these practices are necessary. The fact that SMEs are really short of
resources and this impedes their adoption of sustainable practices, cannot be ignored. In many
countries, there are SME clusters where SMEs are co-located and share common resources that
give them economies of scale. A similar model may be useful for SMEs in connection with their
adoption of sustainable practices by sharing technologies, processes, practices, knowledge and
experience with others that will drive down the implementation cost (Chen et al., 2017).
In the literature on sustainability in SMEs, so far there has been more focus on environmental
sustainability than on social sustainability (Lawrence et al., 2006). One reason could be that
environmental sustainability is more visible and objective in nature while social sustainability is
more subjective in nature and it is more difficult to assess social sustainability practices and
performance. The other reason for environmental sustainability receiving more attention than
social sustainability is that in the current context of global warming and climate change, there is

8
more focus on the environmental issues than on the social issues. However, social sustainability is
perceived to be more relevant for SMEs than for large companies since many SMEs are remotely
located away from the big cities where their activities and operations are interconnected with and
influenced by the local socio-cultural and economic context (Lawrence et al., 2006). SMEs not
only generate direct and indirect employment, but also impact the quality of life in the community.
Since remote areas are less economically and socially developed than big cities, SMEs have more
opportunities than large companies to engage in socially responsible activities such as developing
infrastructure, building schools and healthcare facilities, providing safe drinking water and
sanitation facilities, training local people for alternative livelihoods, empowering women, and so
on (Williams and Schaefer, 2013). Therefore, it is imperative that for SMEs, social sustainability
is equally important as environmental sustainability and both these dimensions are needed to be
taken into consideration, besides economic sustainability, while deliberating on sustainability in
SMEs.
The rest of the paper is organized as follows. The next two sections present the objectives and
contributions of this study. Then a review of the relevant literature and the theoretical lenses used
in the literature to explain firm behaviour/attitude/performance are presented. Next, high level
constructs and items gleaned from the literature and considered for this study are explained,
followed by development of propositions. Then the research methodology is presented, followed
by results, discussions of results and managerial implications. Finally, concluding remarks and
directions for future research are presented.
Objectives
According to the World Bank data2, worldwide GHG emissions in 2012 were about 53.5 billion
MT CO2-equivalent to which India’s contribution was about 3 billion MT CO2-equivalent or about
6% of total GHG emissions. Considering a CAGR (Compounded Annual Growth Rate) of 6%,
India’s current emissions would be around 4 billion MT CO2-equivalent, placing the country just
after China, US and EU in terms of total GHG emissions. In light of India’s commitment to various
treaties such as the Paris Climate Treaty (2016) and Kigali (Rwanda) Agreement (2016):
2 www.worldbank.org

9
Amendment to the Montreal Protocol (1987), and voluntary commitment to the Kyoto Protocol
(1997), there is an urgent need to look into ways of reducing GHG emissions. One of the major
sources of GHG emissions is industrial pollution, and as already noted that SMEs collectively
cause more air pollution than all large companies taken together, attention must be given to SMEs,
besides large companies, to sensitize and encourage them to reduce their carbon footprint.
This research intends to conduct an exploratory study of Indian manufacturing SMEs with respect
to the drivers of sustainability, sustainable business practices and their impact on firm
performance. Although the service sector contributes more than the manufacturing sector to the
Indian economy, manufacturing firms have more significant and diverse implications for the
environment and have more opportunities to be socially responsible than service businesses
(Becherer and Helms, 2014). The extant literature also notes that manufacturing-based SMEs are
considered as the most polluting sector, significantly contributing to environmental pollution and
emissions (Singh et al., 2021). Uhlaner et al. (2012) note that firms in the manufacturing sector are
likely to be closely monitored and hence better be aware of environmental issues. They are likely
to benefit from the adoption of high environmental standards and have more opportunities to act
in an environmentally-responsive manner than service-based SMEs. A survey of Indian industries
by Singh et al. (2015) shows that manufacturing firms are more likely to adopt environmental
management practices compared to the service sector. Leonidou et al. (2017) also observe that the
adoption of a green business strategy is more evident in firms operating in harmful industries, such
as manufacturing, than in firms operating in less harmful industries, such as services.
Indian SMEs come under the purview of the Ministry of Micro, Small and Medium Enterprises
(MSME) of the Government of India (GoI). According to the definition of the Ministry3,
enterprises whose investments in plant and machinery or equipment do not exceed INR10 million
and the annual turnover does not exceed INR 50 million, are categorized as micro enterprises. For
small enterprises, the corresponding figures are INR 100 million and INR 500 million, and for
medium enterprises, the corresponding figures are INR 500 million and INR 2.50 billion4.
However, this new definition of MSME came into effect since July, 2020. Prior to July, 2020,
when data collection for this study was being conducted, the definition of MSME was as follows:
3 Ministry of Micro, Small and Medium Enterprises, Government of India, Website: https://msme.gov.in 4 USD 1 ~ INR 74.34 as on June 22, 2021

10
enterprises whose investments in plant and machinery or equipment do not exceed INR 2.50
million, are more than INR 2.50 million but do not exceed INR 50 million, and are more than INR
50 million but do not exceed INR 100 million, are categorized as micro, small and medium
enterprises, respectively, i.e. the old definition did not take the annual turnover into consideration.
The definition of Indian SMEs differs from the definition of SMEs accepted by the European
Commission (EC) and US economy. According to the EC, MSMEs are categorized based on the
number of employees and annual sales/balance sheet total. A micro enterprise has a headcount of
fewer than 10 and annual sales/balance sheet total of €2 million or less, a small enterprise has a
headcount of fewer than 50 and annual sales/balance sheet total of €10 million or less, and a
medium enterprise has a headcount of fewer than 250 and annual sales of €50 million or
less/balance sheet total of €43 million or less5. In the US, firms with fewer than 500 employees
are considered SMEs (Ashton et al., 2017). Therefore, the definition of SMEs varies across
countries. Nonetheless, for every country, SMEs constitute a major percentage of all firms,
contribute significantly to the national economy and employ a large number of the working
population. In India, there are about 63 million SMEs, contributing about 30% to the country’s
GDP and employing about 111 million people. SMEs in the manufacturing sector contribute about
6%, 33% and 45% to the GDP, total manufacturing output and exports, respectively6.
Research on sustainability in Indian SMEs is rather limited. Mittal et al. (2012) and Nulkar (2014)
identify regulatory, economic and competitive factors, pressure from society, public, customers
and competitors, and owners’/managers’ awareness, knowledge and ethical orientation as the
major drivers of and barriers to the implementation of sustainable practices in SMEs. Singh et al.
(2015), in a survey of Indian industries, observe that image, compliance, prevention of
environmental incidents and competitiveness are the significant drivers of implementation of
environmental management systems while innovation and cost saving are not. Thanki et al. (2016)
develop an integrated framework for lean-green implementation practices in SMEs using the
analytical hierarchy process (AHP) approach, and identify ISO 14001 as the most significant green
practice and reduction in emissions as the most significant criterion for greenness. Gandhi et al.
(2018) use the TOPSIS method to rank the drivers of integrated lean-green manufacturing in
5https://ec.europa.eu/growth/smes/business-friendly-environment/sme-definition/ 6Annual Reports, Ministry of Micro, Small and Medium Enterprises, Government of India

11
SMEs. All of the above-mentioned papers consider only the environmental dimension of
sustainability while Nair and Sodhi (2012) consider both the environmental and social dimensions
of sustainability and qualitatively discuss the drivers, practices and performance measures based
on five case studies. Recently, Singh et al. (2021) have developed an SME sustainability disclosure
index for stock exchange-listed manufacturing SMEs in India. The authors note that there is a gap
in sustainability reporting practices among the listed SMEs, particularly in the environmental and
social dimensions, where the disclosures are limited to qualitative descriptions without any
quantification of information. The authors recommend improving sustainability reporting practices
of manufacturing SMEs through strong policies and regulations. However, none of the papers,
mentioned above, explores the causal relationships among drivers, sustainable business practices
and firm performance in the context of Indian SMEs. The proposed research intends to fill this
gap. Moreover, it is also intended to explore the moderating roles of firm size, age, management,
quality and environmental management certifications, technical capability/competency,
awareness/knowledge of owners/managers, employee background, and networking/alliance with
industry associations/peers in the causal relationships among drivers, sustainable business
practices and firm performance. In particular, the following research questions will be addressed:
1. What is the current status of adoption of sustainable practices in Indian manufacturing SMEs?
What are the drivers, internal and external, of adoption of sustainable practices? What metrics
are relevant for measuring firms’ performance on sustainability?
2. How do the drivers of sustainability influence the adoption of sustainable practices? What are
the moderating factors and how do they moderate the causal relationships among the drivers,
sustainable practices and firm performance? Finally, how do sustainable practices mediate the
causal relationships between the drivers and firm performance? Does environmental and social
performance lead to economic performance and long-term competitive advantage?
3. What are the major challenges and opportunities faced by Indian manufacturing SMEs in
connection with the implementation of sustainable practices? What should the government and
industry associations do to help SMEs overcome these challenges? What is the road ahead for
SMEs?
Research hypotheses will be formed based on the above questions.
Contributions

12
The contributions of the present study are as follows:
1. As already mentioned, majority of the extant literature on sustainability in SMEs consider only
the economic and environmental dimensions of sustainability. Only a handful of literature
(See, for example, Torugsa et al., 2012, 2013; Courrent et al., 2018 and Dey et al., 2020)
consider all the three dimensions – economic, environmental and social – of sustainability. In
this paper also, we have taken into consideration all the three dimensions of sustainability, and
for social sustainability, we have considered both workplace/employee-related social
sustainability and community development-related social sustainability.
2. The review of the relevant literature reveals that majority of the literature focus on the causal
relationships either between the internal/external drivers/motivators of sustainability and
sustainable business practices or between sustainable business practices and firms’ financial
and competitive performance. The current paper contributes in terms of taking an integrative
view in exploring the causal relationships among the internal/external drivers of sustainability,
sustainable business practices, environmental and social benefits accrued due to sustainable
business practices, and firms’ financial and non-financial performance.
3. Although scales have been developed for similar studies in the context of other developed and
developing countries, the same have not been tested in Indian SMEs. Therefore, an exploratory
study has been undertaken to develop a scale that would be relevant in the context of Indian
manufacturing SMEs. The same scale may be used for future research not only on Indian
SMEs, but also on SMEs belonging to other developed and developing countries.
4. No study has been conducted so far to explore the causal relationships among the drivers of
sustainability, sustainable business practices and firm performance in the context of Indian
manufacturing SMEs. The current study is the first one in this direction which is expected to
pave the way for similar research on Indian SMEs.
Literature Review
This section presents a literature review of articles focusing on the interlinkages among the drivers
of sustainability, sustainable environmental and social practices and firm performance
(financial/non-financial) in the context of SMEs.

13
Based on a study of SMEs in the US wine industry, Cordano et al. (2010) examine the influence
of managers’ attitudes, norms and perceptions of stakeholder pressures on their intention to
implement environmental management programmes. The authors find that managers are
responsive to attitudes, norms and perceptions of stakeholder pressures, and voluntary adoption of
environmental management programmes increases firms’ success in the implementation of energy
conservation and recycling practices.
In a study of Dutch SMEs, Uhlaner et al. (2012) comment that while UK SMEs are more driven
by compliance with regulations and perceived financial benefits of implementation of
environmental practices, Dutch SMEs are more internally driven and have a strong ethical
orientation towards sustainability. UK SMEs consider environmental management as a cost while
Dutch SMEs are strongly marketing-driven in their approach to sustainability and consider the
investment in environmental management as an activity offering a competitive advantage. Based
on the literature on ecological modernization and the theory of planned behavior, the authors show
that the endogenous factors, namely tangibility of sector, firm size, innovation orientation, family
influence and perceived financial benefits from energy conservation, either strongly or
conditionally positively influence the level of SMEs’ engagement in environmental management
practices.
Roxas and Coetzer (2012), based on the institutional theory, examine the relationships among the
three dimensions of the institutional environment, namely regulatory, cognitive and normative,
owners’/managers’ attitudes towards the natural environment, and the environmental sustainability
orientation of small firms. Based on a survey of 166 small manufacturing firms in the Philippines,
the authors find that the three dimensions of the institutional environment are strongly linked to
positive managerial attitudes to environmental sustainability, which in turn positively influence
the firm’s overall environmental sustainability orientation, with owners’/managers’ attitudes
towards the natural environment playing the mediating role. The authors contend that
owners’/managers’ values, beliefs and attitudes strongly influence the environmental strategy and
behaviour of small firms, and the regulatory dimension has the least impact on the managerial
attitudes towards environmental sustainability among the three dimensions of the institutional
environment, especially in the context of a developing country where small firms are usually
deeply embedded in their local communities.

14
Torugsa et al. (2012, 2013) extend the research of Aragon-Correa et al. (2008) to include social
sustainability, besides environmental sustainability, and study the relationships among specified
capabilities (shared vision, stakeholder management and strategic proactivity), proactive corporate
social responsibility (CSR) and financial performance in SMEs in the machinery and equipment
sector of the Australian manufacturing industry. While Torugsa et al. (2012) focus on second-level
constructs related to capabilities, proactive CSR and financial performance, Torugsa et al. (2013)
consider first-level constructs along with the effect of interactions among the economic,
environmental and social dimensions of proactive CSR. Similar to Aragon-Correa et al. (2008),
the authors find that the specified capabilities are positively associated with proactive CSR, and
proactive CSR, in turn, is positively associated with financial performance. The authors also
observe that proactive CSR fully mediates the relationship between capabilities and financial
performance (Torugsa, 2012). Moreover, the effect of interactions among the three dimensions of
sustainability is also found to fully mediate the positive association between capabilities and
performance (Turugsa, 2013). The findings of these studies challenge the pre-conceived notion
that after complying with the mandatory regulatory norms, which is essentially reactive in nature,
SMEs are left with little or no resources to adopt proactive or voluntary CSR practices, such as
sustainable economic, environmental and social practices. In fact, compared to large companies,
SMEs are more flexible and better positioned to adopt voluntary CSR practices owing to their
simple structures, shortened lines of communications and informal cultures.
Contrary to the earlier research findings that family firms have more engagement in pro-
environmental practices than their non-family counterparts (Berrone et al., 2010; Sharma and
Sharma, 2011), Dekker and Hasso (2016), in the context of privately-held Australian SMEs,
observe that family firms have a lower environmental performance focus than nonfamily firms;
however, family firms with strong social embeddedness in their local community have a greater
environmental performance focus than their nonfamily counterparts.
In a study based on focus group interviews in the Madrid region, Fernandez and Camacho (2016)
find that the improvement in working conditions is a significant accelerator for the implementation
of an ethical infrastructure in SMEs. Interviewees highlight that employee involvement and
participation in decision-making, teamwork and recognition of employee contributions not only
improve the working conditions, but also boost employee morale and motivation.

15
Ashton et al. (2017) study the motivations for adopting green business practices based on a survey
of 59 US SMEs in the tool and die manufacturing industry. The authors find that majority of the
firms are driven by internal factors such as cost and competitiveness, rather than by external
pressures exerted by the government and customers. The authors also find that while age of the
firm has no relation with the adoption of green practices, size (number of employees) and sales do
have a positive relationship, i.e. larger firms with higher numbers of employees and sales volumes
are more likely to adopt green practices than smaller firms. The authors further note that incentives
and support from the government and learning from industry associations will help SMEs to ‘go
green’.
Based on data received from 153 manufacturing SMEs in Cyprus, Leonidou et al. (2017) find that
internal factors, such as organizational resources and capabilities, positively influence firms’ green
business strategy, which in turn is positively associated with positional competitive advantage that
is conducive to generating better financial and market performance. The authors also find that the
relationship between internal factors and green business strategy is strongly moderated by high
regulatory intensity, high market dynamism, high public concern and high competitive intensity.
Courrent et al. (2018) study the relationships between entrepreneurial orientation and financial and
non-financial performance, mediated by sustainable practices, namely environmental practices,
social practices in the workplace and social practices in the community, for 406 French SMEs. The
authors find that entrepreneurial orientation has a positive association with sustainable practices,
and social practices in the workplace partially mediate the relationship between entrepreneurial
orientation and firm performance. However, environmental practices and social practices in the
community have been found to hold no significant relationship with firm performance.
Boakye et al. (2020) study the relationships between environmental practices and financial
performance for UK-based listed SMEs. The authors find that environmental practices such as
energy efficiency, pollution prevention and control, waste management, materials and resource
efficiency and stakeholder management have a significant association with financial performance.
Moreover, for practices such as energy efficiency, greenhouse gases and materials and resource
efficiency, financial performance has a non-linear, inverted U-shaped relationship with
environmental practices, meaning thereby that financial performance has a positive relationship

16
with lower levels of environmental engagement and a negative relationship with higher levels of
environmental engagement.
Sendlhofer (2020) observes that there is a dearth of studies on employee involvement in
sustainable practices in SMEs. The author finds, based on the case study of an SME, that besides
owners/managers, employees with strong motivation and ethical and moral responsibility join
forces and drive sustainable practices in the firm. The author opines that unlike in large companies,
SMEs have an informal structure of control and culture, and the ethical behaviour of employees
more or less reflects the moral responsibility of the firms towards sustainable practices,
irrespective of the ethical orientation of owners/managers, which might act as an enabler or a
disabler.
Dey et al. (2020) study the relationships between the circular economy (CE) fields of action,
namely take, make, distribute, use and recover, and firms’ economic, environmental and social
performance based on a survey of 130 UK SMEs. The authors find that all the CE fields of action
are positively correlated with economic performance while only two CE fields of action, namely
make and use, are positively correlated with environmental and social performance. Through a
mixed mode of research (survey, focus groups and case studies), the authors highlight the issues
and challenges, strategies, resources and competences required for implementing CE in SMEs.
Based on a case study of a Japanese SME, and using the managerial discretion theory (Finkelstein
and Peteraf, 2007), Eweje (2020) finds that the owner’s decision-making process, motivation,
philosophy and determination to adopt sustainability practices play a major role in garnering
employee support for the company’s sustainability initiatives, and contribute to positive staff
turnover. The author also finds that if the sustainability initiatives and practices are embedded into
SMEs’ business activities from the outset, their negative environmental and social impacts can be
greatly reduced.
Bakos et al. (2020) conduct a literature review on SMEs’ environmental sustainability. Based on
122 studies from 58 journals published between 2013 and 2019, the authors investigate the trends
in drivers and barriers in sustainability adoption by SMEs. A systematic literature review on
sustainability in SMEs and its impact on firm performance has also been presented by Prashar and
Sunder (2020) and Bartolacci et al. (2020), based on 117 and 62 relevant studies, respectively.
17
Theoretical lenses
The literature review reveals that mainly four theoretical frameworks – resource-based
view/natural resource-based view, stakeholder theory, institutional theory and theory of planned
behaviour – have been used by researchers to explain the relationships among the drivers of
sustainability, sustainable practices and firm performance. Following is a brief description of these
theoretical lenses and their applications in the study’s context.
According to the resource-based view (RBV) (Barney, 1991)/natural resource-based view
(NRBV) (Hart, 1995) of the firm, sustainability may be considered as a valuable, rare, inimitable
and non-substitutable resource that may be a source of competitive advantage. Adoption of
sustainable business practices may not only boost firms’ financial and non-financial performance,
but also provide first-mover advantages, access to new technology and new markets, and an
opportunity to develop innovation capabilities, which will be difficult for the competitors to easily
imitate (Porter and van der Linde, 1995; Shrivastava, 1995). Torugsa et al. (2012, 2013) study the
interrelationships among capabilities, proactive CSR and financial performance for SMEs in the
machinery and equipment sector, and, drawing on the RBV, note that the three dimensions of
capability – shared vision, stakeholder management and strategic proactivity – are not only
valuable, but also their foundations are socially complex, causally ambiguous and deeply
embedded in a firm. These capabilities are also firm-specific and costly to imitate, and are likely
to influence firms’ financial performance through the mediating role of firms’ proactive CSR
strategy. Ashton et al. (2017), based on the RBV, argue that cost reduction, efficient resource
utilization, financial benefits and competitiveness are the most important internal drivers for SMEs
adopting sustainable environmental practices. Leonidou et al. (2017), following the RBV/NRBV,
examine the role of organizational resources and capabilities in achieving a competitive advantage
and superior performance through the mediating role of business strategy in manufacturing SMEs.
Based on the RBV, Courrent et al. (2018) study the mediating role of sustainable environmental
and social practices in the relationship between entrepreneurial orientation of SMEs and their
financial and non-financial performance. The authors believe that the RBV is an ideal theoretical
framework to analyze the structural relationships by recognizing the importance of tangible and
intangible assets as key factors in improving firm performance. The authors also mention that
besides tangible assets, intangible assets, such as human capital, innovation, reputation and brand

18
image, are difficult to imitate or substitute by competitors, thus providing a competitive advantage.
Bartolacci et al. (2020) note that according to the RBV, even SMEs have the potential to pursue
sustainable business strategies if appropriate resources and capabilities are available and the
natural environment is viewed as a competitive opportunity. The authors also note that the
implementation of these strategies help SMEs achieve a competitive advantage and result in
superior business, market and financial performance. Boakye et al. (2020) mention that the NRBV
is an extension of the RBV where the natural environment is taken into consideration. According
to the NRBV, firms’ resources and capabilities with respect to the natural environment, namely
pollution prevention, product stewardship and sustainable development, may provide them with a
sustained competitive advantage and improved financial performance. Based on this theory and
the stakeholder theory (Freeman, 1984), which states that a firm needs to consider the interests of
all the individuals and groups affecting, or affected by, the firm’s activities irrespective of their
having a direct economic interest in the firm or not, the authors explore the relationship between
sustainable environmental practices and financial performance for UK-based SMEs. Gadenne et
al. (2009), based on the stakeholder theory, study the interlinkages among external influences,
environmental awareness and attitudes, and environmental practices for Australian SMEs.
The institutional theory (Scott, 1995) dictates that firms must conform to the rules and norms
prevailing in the external environment in order to survive and earn legitimacy from stakeholders.
According to this theory, firms have to adapt to the social structure within which they operate, and,
rather than optimizing decisions in isolation, they should take a cue from stakeholders, including
their peers, to imitate and imbibe the social behaviour, norms and practices expected of them.
Based on this theory, Roxas and Coetzer (2012) examine the interrelationships among the
regulatory, cognitive and normative dimensions of the institutional environment,
owners’/managers’ attitudes towards the natural environment, and the environmental sustainability
orientation of SMEs. Singh et al. (2015) use the institutional theory to analyze the relationship
between different dimensions of motivations – relational, innovational, operational and
competitiveness – and SMEs’ adoption of environmental management practices. Dekker and
Hasso (2016) also note that the institutional theory is often used in explaining the environmental
performance of SMEs since it can be influenced by non-financial objects such as institutional
legitimacy and social acceptance. Ashton et al. (2017), based on the same theory, posit that
pressures and expectations exerted by the government, society, community, customers,

19
competitors, NGOs and other social organizations act as external drivers for taking environmental
initiatives by SMEs.
Based on the theory of planned behaviour (Ajzen, 1991), Cordano et al. (2010) examine how SME
managers’ positive attitudes influence their environmental decision-making process. Based on the
factors – perceived behavioural control, subjective norms and attitudes about the behaviour –
derived from the same theory, Sharma and Sharma (2011) hypothesize that family firms, owing to
their values, beliefs and positive attitudes towards the natural environment, follow a more
proactive environmental strategy than their non-family counterparts. Some of the motivations,
cited by the authors, for family firms to be more proactive than non-family firms with regard to
environmental initiatives are long-term involvement of family members, firm reputation
associated with the family name, higher motivation to generate socio-emotional wealth for future
generations, embeddedness in local communities and lower levels of relationship conflicts.
Uhlaner et al. (2012) comment that the theory of planned behaviour helps us understand the
conditions under which SMEs adopt environment-friendly practices, and show that the
endogenous factors – tangibility of sector, firm size, innovation orientation, family influence and
perceived financial benefits from energy conservation – positively influence the level of SMEs’
engagement in environmental management practices.
Constructs and items under consideration
Extant research on sustainability in SMEs, based on both detailed case studies and empirical
surveys, has focused on identifying the drivers of sustainability, sustainable business practices and
their impact on firm performance. Drivers of sustainability can be both external or reactive and
internal or proactive (Lewis and Cassells, 2010; Sharma and Sharma, 2011; Ashton et al., 2017;
Bakos et al., 2020; Prashar and Sunder, 2020). External drivers include government regulations,
incentives for adopting sustainable practices, pressure from stakeholders including NGOs,
communities, societies and the general public, pressure from customers (coercive pressure),
adoption of sustainable practices by competitors (mimetic pressure), and standard industry norms
(normative pressure) (Simpson et al., 2004; Gadenne et al., 2009; Roxas and Coetzer, 2012; Singh
et al., 2015; Fernandez and Camacho, 2016; Ashton et al., 2017; Bakos et al., 2020; Prashar and
Sunder, 2020). Internal drivers could be the shared vision, values, beliefs, ethical orientation and
a positive attitude of owners/managers towards the natural environment (Nair and Sodhi, 2012;

20
Roxas and Coetzer, 2012; Singh et al., 2015; Dekker and Hasso, 2016; Fernandez and Camacho,
2016), pressure from employees, and perceived short-term (such as energy efficiency, waste
reduction, cost-effectiveness and higher market share, sales and profits) and long-term benefits
(such as improved customer and employee satisfaction, new product development, new market
opportunities, brand image, reputation and competitiveness) (Simpson et al., 2004; Gadenne et al.,
2009; Cordano et al., 2010; Uhlaner et al., 2012; Williams and Schaefer, 2013; Singh et al., 2015;
Ashton et al., 2017; Johnson, 2017; Leonidou et al., 2017; Witjes et al., 2017; Chasse and Courrent,
2018).
Sustainable business practices may be divided into two dimensions – environmental and social.
The environmental dimension may include collaboration with suppliers for green purchasing,
environment-friendly product and process design (DFE/LCA), energy-efficient manufacturing,
reuse, recycling and environmentally safe treatment of waste, energy-saving transportation and
eco-friendly office practices (Hussey and Eagan, 2007; Lee and Klassen, 2008; Roxas and Coetzer,
2012; Torugsa et al., 2012, 2013; Wu et al., 2015; Caldera et al., 2018; Courrent et al., 2018;
Boakye et al., 2020; Dey et al., 2020). The social dimension, on the other hand, may include human
resource management (HRM) practices, such as employee welfare, health and safety, training and
development, empowerment, teamwork, participation and involvement in decision-making,
promoting idea generation and acknowledging contributions (Nair and Sodhi, 2012; Torugsa et al.,
2012, 2013; Wu et al., 2015; Fernandez and Camacho, 2016; Johnson and Schaltegger, 2016;
Witjes et al., 2017; Courrent et al., 2018; Gandhi et al., 2018), and initiatives for community
development, such as creating opportunities for direct/indirect employment, training local people
for alternative livelihoods, investment in community infrastructure and charitable activities in cash
or kind (Nair and Sodhi, 2012; Torugsa et al., 2012, 2013; Tan et al., 2015; Caldera et al., 2018;
Courrent et al., 2018).
Firm performance may also have several dimensions such as short-term or economic (reduced
cost, sales, profitability, market share, etc.), long-term or strategic (brand image, reputation,
competitiveness, customer loyalty, new products, new markets, etc.) (Simpson et al., 2004; Nair
and Sodhi, 2012; Leonidou et al., 2017; Courrent et al., 2018), environmental (energy
consumption, emissions, effluents, wastes, reuse, recycling, etc.) (Wu et al., 2015) and social
(employee satisfaction and loyalty, employee quality, morale, motivation and commitment, new
21
talent attraction and retention, etc.) (Simpson et al., 2004; Nair and Sodhi, 2012; Chasse and
Courrent, 2018; Courrent et al., 2018). The items mentioned under the dimension of social
performance are related to intra-organizational HRM practices. It is expected that SMEs’
initiatives towards extra-organizational community development would result in strategic
advantages such as enhanced brand image, reputation and competitiveness (Chasse and Courrent,
2018; Courrent et al., 2018).
The extant literature explores the relationships among the drivers of sustainability, sustainable
business practices and firm performance (financial and non-financial). We introduce another
dimension between sustainable business practices and firm performance, i.e. benefits accrued due
to adoption of sustainable business practices because we note SMEs may realize environmental
and social benefits due to adoption of sustainable business practices, but the same may or may not
result in improved financial and non-financial firm performance. Therefore, broadly we study the
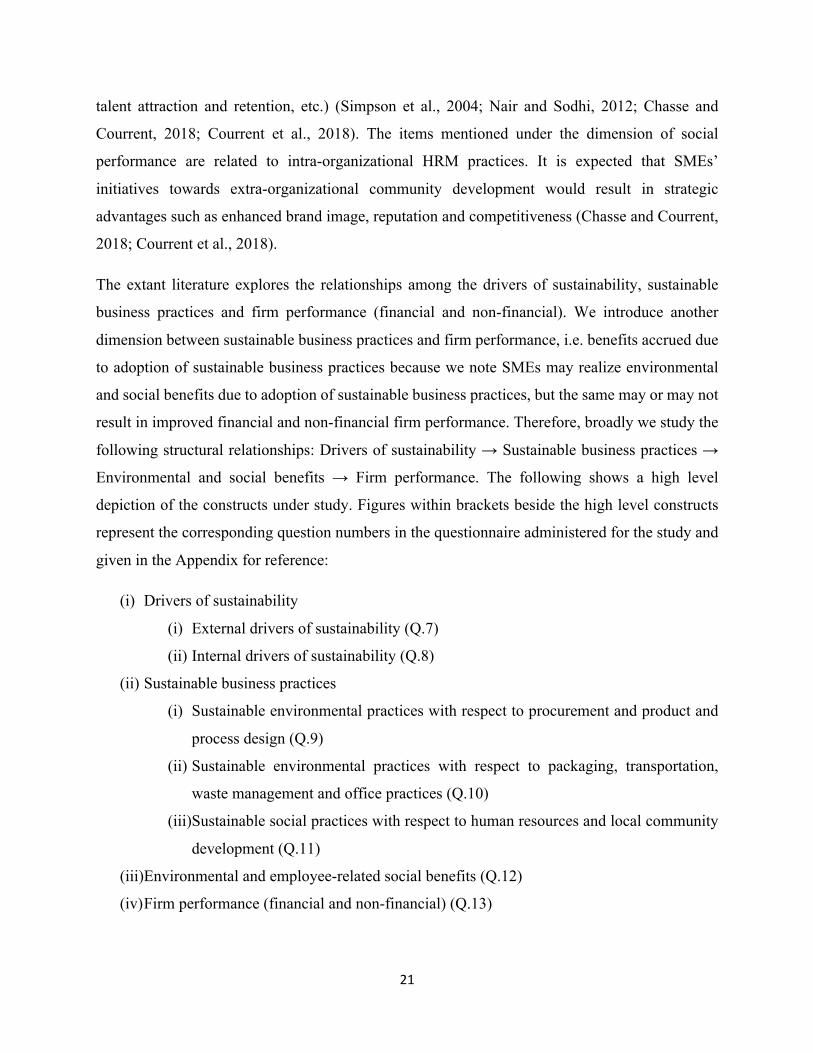
following structural relationships: Drivers of sustainability → Sustainable business practices →
Environmental and social benefits → Firm performance. The following shows a high level
depiction of the constructs under study. Figures within brackets beside the high level constructs
represent the corresponding question numbers in the questionnaire administered for the study and
given in the Appendix for reference:
(i) Drivers of sustainability
(i) External drivers of sustainability (Q.7)
(ii) Internal drivers of sustainability (Q.8)
(ii) Sustainable business practices
(i) Sustainable environmental practices with respect to procurement and product and
process design (Q.9)
(ii) Sustainable environmental practices with respect to packaging, transportation,
waste management and office practices (Q.10)
(iii) Sustainable social practices with respect to human resources and local community
development (Q.11)
(iii) Environmental and employee-related social benefits (Q.12)
(iv) Firm performance (financial and non-financial) (Q.13)

22
The items (observed variables) for the study, which have been gleaned from the extant literature
as noted above, are listed under the corresponding high level constructs in the questionnaire (See
the Appendix).
Development of propositions
This section refers to the relevant literature on the relationships among the drivers of sustainability
(internal/external), sustainable business practices (environmental and social), environmental and
social benefits, and firm performance (financial and non-financial), and develops propositions for
the study. The propositions will be refined into the actual hypotheses to be tested based on the
exploratory/confirmatory factor analysis of the survey data.
(i) Internal drivers of sustainability and sustainable business practices
Hussey and Eagan (2007) find support for the hypothesis that leadership has a positive influence
on socially responsible HRM practices by SMEs.
Gadenne et al. (2009) note that despite SME owners/managers having strong ‘green’ attitudes, the
level of implementation of environment-friendly practices has been low. The authors, in their
study, do not find support for the proposition that SME owners’/managers’ environmental attitudes
are positively associated with firms’ environmental practices.
However, many other researchers argue in favour of positive relationships between the internal
drivers and SMEs’ adoption of sustainable business practices. For example, Cordano et al. (2010)
hypothesize that positive attitudes of SME managers towards the environment and perceptions of
increased pressures from internal stakeholders to improve environmental performance facilitate
the implementation of environmental management programmes and practices. The authors find a
positive relationship between managers’/employees’ values, beliefs and norms, and the
implementation of environmental management practices.
Roxas and Coetzer (2012) comment that owners’/managers’ norms, beliefs, values, attitudes and
mental models influence their strategic choices and hence the behaviour of firms. The authors find

23
that the cognitive and normative dimensions of the institutional environment strongly influence
the positive relationship between owners’/managers’ attitudes towards the natural environment
and the environmental sustainability orientation of SMEs.
Uhlaner et al. (2012) find strong support for the hypothesis that perceived financial benefits out of
energy and resource conservation are positively associated with SMEs’ adoption of environmental
management practices.
Torugsa et al. (2012, 2013) examine the relationships between SMEs’ shared vision and their
proactive CSR strategies. The authors comment that the shared vision capability is a firm’s ability
to embody the collective objectives and aspirations of its members. Such a capability supports
organizational learning and employee creativity. Since CSR activities emphasize employee
involvement, and hence are people-intensive, a shared vision enables a firm to generate an internal
pressure and enthusiasm to adopt sustainable practices. Although SMEs are more resource-
constrained than larger firms, their shorter lines of communication and a more informal
management structure and culture facilitate a greater involvement of employees in sustainable
activities. The authors (2013) hypothesize positive relationships between the shared vision
capability and the three dimensions of proactive CSR strategies, and find that while the relationship
between shared vision and the environmental dimension is supported, there is no support for the
relationships between shared vision and the economic and social dimensions of proactive CSR
strategies.
Dekker and Hasso (2016) note that in family firms, owners’/managers’ values, beliefs and attitudes
towards the natural environment strongly influence their strategic choices and hence the behaviour
of the firm. According to the authors, family firms are more likely to be engaged in environmental
management practices than non-family firms, especially when they are deeply embedded in their
local communities.
Chasse and Courrent (2018), in their study, find that the personal sustainability behaviour of SME
owners/managers is positively associated with firms’ environmental and social practices.
Eweje (2020) notes that SME owners’/managers’ leadership abilities are associated with the
implementation of various environmental and social sustainability practices. The author also notes
that employees of an SME that pursues sustainability strategies will demonstrate loyalty and
24
dedication to their employer, which not only reduces staff turnover, but also leads to improved
financial performance.
(ii) External drivers of sustainability and sustainable business practices
Cordano et al. (2010) show that pressures from external stakeholders on SME managers to improve
environmental performance positively influence the adoption of environmental management
practices.
Roxas and Coetzer (2012) study the impact of the regulatory dimension of the institutional
environment on the relationship between owners’/managers’ attitudes towards the natural
environment and the environmental sustainability orientation of small firms.
Torugsa et al. (2012, 2013) note that an effective stakeholder management, i.e. establishing trust-
based collaborative relationships with a wide variety of stakeholders, can enhance SMEs’ ability
to reduce negative environmental and social impacts. The authors (2013) find support for the
positive relationships between stakeholder management and all the three dimensions – economic,
environmental and social – of proactive CSR strategies.
Leonidou et al. (2017) show that pressures from regulators, competitors, customers and
stakeholders positively moderate the relationship between SMEs’ adoption of green business
strategies and competitive advantage.
However, in developing countries, such as in India, environmental and social regulations for SMEs
are not formally developed, and hence a relationship between regulations and firms’
implementation of sustainable practices may not be expected. Roxas and Coetzer (2012) observe
that the regulatory dimension of the institutional environment has the lowest impact on the
attitudes towards the natural environment of owners/managers in the sample firms. Ashton et al.
(2017) note that the survey firms mention regulations and pressures from external drivers, such as
the government and customers, as weaker motivators than internal drivers for implementation of
environmental practices. Bakos et al. (2020) also note that transitional economies do not have
government regulations similar to developed economies.
The literature on the linkages between the drivers of sustainability and sustainable business
practices directs us to posit the following propositions:

25
Proposition 1 (P1): Drivers of sustainability (internal/external) are positively related to
sustainable environmental practices.
Proposition 2 (P2): Drivers of sustainability (internal/external) are positively related to
sustainable social practices.
(iii) Drivers of sustainability, environmental and social benefits, and firm performance
Hussey and Eagan (2007) do not find support for the hypothesis that leadership has a direct and
positive influence on environmental performance of SMEs.
Gadenne et al. (2009) also report mixed findings in connection with the relationship between SME
owners’/managers’ environmental attitudes and firms’ environmental performance. While some
authors find a positive relationship between environmental attitudes and environmental
performance, other authors either find no relationship or report a gap between owners’/managers’
attitudes and their environmental behaviour.
Hu et al. (2015) note that top management leadership, strategy, commitment and support are
critical factors for implementing Lean Management in SMEs and improving firm performance.
Leonidou et al. (2017) note the moderating role of pressures from external stakeholders in the
relationship between green business strategies and competitiveness, characterized by financial and
non-financial (market) performance.
Chasse and Courrent (2018) argue that owners’/managers’ positive behaviour towards
environmental and social issues can have economic advantages for SMEs.
Bartolacci et al. also (2020) note that most of the extant literature confirm a positive relationship
between SME owners’/managers’ personal values and CSR practices with respect to the
environment, employees and local communities, and firms’ financial performance and
competitiveness (sales, market share, customer satisfaction and profitability). According to the
authors, CSR initiatives not only generate intangible benefits such as employee morale, motivation
and loyalty, but also result in better financial performance due to increased efficiency and
improved company image.

26
Prashar and Sunder (2020) note that the vision, values, leadership and social responsibility of
owners/managers of SMEs impact firms’ financial performance.
Based on the literature, the following propositions have been developed:
Proposition 3 (P3): Drivers of sustainability (internal/external) are positively related to
environmental benefits realized by SMEs due to adoption of sustainable environmental practices.
Proposition 4 (P4): Drivers of sustainability (internal/external) are positively related to social
benefits realized by SMEs due to adoption of sustainable social practices.
Proposition 5 (P5): Drivers of sustainability (internal/external) are positively related to SME firm
performance (financial and non-financial).
(iv) Sustainable environmental and social practices
Torugsa et al. (2013) note that employee participation and involvement in decision-making helps
SMEs minimize their ecological footprints. Employee-related social sustainability practices, such
as employee engagement and providing them with training and development opportunities,
positively influence firms’ adoption of environmental management practices, by building
awareness of and commitment to environmental values and by improving the technical and
managerial skills for adopting such environmental practices, the authors also note.
Hu et al. (2015) note that employee training, motivation, involvement, participation and
empowerment are key success factors for Lean implementation in SMEs.
Therefore, the following proposition is posited:
Proposition 6 (P6): Sustainable social practices are positively related to sustainable
environmental practices.
(v) Sustainable business practices, environmental and social benefits, and firm performance
Thanki et al. (2016) note that the extant literature suggests positive relationships among green
manufacturing practices in SMEs, their improved environmental performance through waste

27
minimization and improved performance in terms of long-term profit, market share, image and
competitive advantage. In a bibliometric study, Prashar and Sunder (2020) mention that scholars
have studied how the environmental and social dimensions of sustainability impact SME firm
performance.
Based on a study of UK SMEs, Simpson et al. (2004) explore whether environmentally good
practices translate into a competitive advantage. While some of the respondents support the causal
relationship between good environmental practices and competitiveness, majority are of the
opinion that either there is no link or there may be some effect in the long term but not in the short
term.
Hussey and Eagan (2007) test the hypothesis that socially responsible HRM practices have a
positive influence on environmental performance of SMEs. However, the authors do not find
support for the hypothesis.
Aragon-Correa et al. (2008) find a significantly positive relationship between SMEs’ adoption of
proactive green business practices and financial performance.
Torugsa et al. (2013) note that SMEs that adopt environmentally sustainable practices may develop
skill and knowledge resources by attracting and retaining highly qualified employees, who are
motivated by environmental sustainability issues. The authors propose that the three dimensions
of sustainability are positively associated with financial performance. However, the authors find
that while the economic dimension of sustainability is positively associated with financial
performance, there is no significant association between the environmental and social dimensions
of sustainability and financial performance.
Lewis et al. (2015) note that the extant literature studies the links between enhanced environmental
performance and firms’ bottom line. Wu et al. (2015) suggest that firms’ lean, green and social
practices have positive effects on firms’ triple bottom line performance. The authors also mention
that the extant literature has reported a positive relationship between firms’ sustainable business
practices and financial performance mediated by enhanced environmental and social performance.
The authors, in their study, have found a significant positive relationship between sustainable
social practices and environmental performance.

28
Dekker and Hasso (2016) observe that the environmental management focus of family firms is
manifested in their environmental performance when firms are embedded in local communities.
Fernandez and Camacho (2016) note from the comments made by one of the participants of their
study that teamwork, participation and involvement in decision-making, and recognition of
contributions do not only generate job satisfaction, but also boost the morale and motivation of
employees.
Leonidou et al. (2017) note that majority of the extant literature observe a positive relationship
between SMEs’ green initiatives and their financial and non-financial (market) performance. The
authors, in their study, find that SMEs’ green business strategies are positively related to
competitive advantage, which in turn results in better financial and market performance.
Courrent et al. (2018) comment that SMEs’ environmental practices are likely to be positively
associated with their financial and non-financial performance. The authors, and also Chasse and
Courrent (2018), note that while social practices in the workplace are likely to boost employee
morale, motivation and commitment, and attract and retain talent, social practices in the
community would improve relationships with stakeholders, and boost company image and
reputation, thereby providing a competitive advantage and indirectly improving financial
performance. However, the authors mention that although most of the empirical studies have
reported positive relationships between SMEs’ sustainable practices and firm performance, the
extant literature is not univocal in support of these relationships, some arguing for no, or even
negative, relationships. Revell and Blackburn (2007), based on a study of SMEs in the UK’s
construction and restaurant sectors, note that many firms are skeptical about embracing
environment-friendly practices, such as energy efficiency and waste minimization, because
although these practices may result in cost savings, the short-term economic benefits may not
outweigh the investments required to be made in these practices. Gadenne et al. (2009), based on
a review of the extant literature, note that many small business owners doubted that investments
in environmental improvements would bring benefits to their businesses. Nulkar (2014) also notes
that many sustainability practices do not result in short-term business benefits rendering them
unattractive for SMEs.

29
In a systematic literature review, Bartolacci et al. (2020) observe that the number of articles
studying the effect of sustainable business practices on financial performance of SMEs is growing
over the years, highlighting the importance of and attention to this emerging field of research. The
authors, in their review, note that environmental management practices by SMEs have a positive
impact on firm performance, positively moderated by HRM practices. The authors also note the
positive relationship between socially responsible management practices towards employees, and,
to a lesser extent, society/community, and firms’ financial/competitive performance.
Boakye et al. (2020) study the relationships between environmental sustainability practices, such
as energy efficiency, materials/resources efficiency, compliance with environmental regulations,
pollution control, waste management practices and stakeholder engagement, and financial
performance for UK-based SMEs. The authors find that except for environmental regulations, all
other practices are positively associated with financial performance.
Dey et al. (2020) note that environmental management practices by SMEs may help enhance
environmental and social performance and in turn firms’ economic and operational performance.
The authors note that very few researchers reveal direct relationships between socially sustainable
practices and environmental/economic performance. However, the authors also note that
environment-friendly SMEs are likely to have satisfied employees with higher economic
performance.
Eweje (2020) notes that employee loyalty and dedication, and reduced staff turnover, in an
environment-friendly SME leads to improved financial performance.
Based on the literature, the following propositions have been developed:
Proposition 7 (P7): Sustainable environmental practices are positively related to environmental
benefits realized by SMEs.
Proposition 8 (P8): Sustainable environmental practices are positively related to social benefits
realized by SMEs.
Proposition 9 (P9): Sustainable environmental practices are positively related to SME firm
performance (financial and non-financial).

30
Proposition 10 (P10): Sustainable social practices are positively related to social benefits realized
by SMEs.
Proposition 11 (P11): Sustainable social practices are positively related to environmental benefits
realized by SMEs.
Proposition 12 (P12): Sustainable social practices are positively related to SME firm performance
(financial and non-financial).
Finally, it is proposed that environmental and social benefits realized by SMEs due to adoption of
sustainable business practices are positively related to SME firm performance (financial and non-
financial).
Proposition 13 (P13): Environmental benefits realized by SMEs due to adoption of sustainable
business practices are positively related to SME firm performance (financial and non-financial).
Proposition 14 (P14): Social benefits realized by SMEs due to adoption of sustainable business
practices are positively related to SME firm performance (financial and non-financial).
Figure 1 pictorially represents the propositions.
Drivers of sustainability
(internal/ external)
Firm performance (financial/
non-financial)
Sustainable social practices
Social benefits
Sustainable environmental
practices
Environmental benefits
P1
P2
P3
P4
P5
P6
P7
P8
P9
P10
P11
P12
P13
P14

31
Fig. 1: High level constructs and propositions
Research methodology
The research is based on a survey of Indian manufacturing SMEs located in the states of West
Bengal, Bihar, Delhi, Haryana, Rajasthan and Maharashtra due to the prevalence of SMEs and
their clusters in these states. The target sectors have been food and beverages, textile, engineering,
leather and chemicals that are way ahead of other sectors in terms of gross economic output, export
and employment generation. A questionnaire for the survey, including both structured and semi-
structured questions, has been designed based on the extant literature, as mentioned before, and
inputs received from academicians, experts and practitioners. The questionnaire contains items to
be rated by respondents on a 5-point Likert scale where ‘1’ means ‘strongly disagree’ and ‘5’
means ‘strongly agree’. Subsequently, the questionnaire has been administered to a select group
of respondents on a pilot basis to receive their views on the wording and understanding of the
items. Based on the feedback received in the pilot study, the questionnaire has been finalized by
rephrasing, rewording, adding and deleting some of the items before it is ready for mass-
administration (The questionnaire is given in the Appendix for reference). Next, prospective
respondents have been identified from SME databases and approached in-person and over
email/phone seeking their cooperation in taking part in the survey. A total of 236 prospective
respondents have been approached out of whom 139 respondents have agreed to take part in the
survey, indicating a response rate of about 59%. Then the questionnaire along with a covering
letter explaining the background and objectives of the survey has been administered in-person to
these 139 respondents, who have been provided with clarifications, if needed, and facilitated in
filling in the questionnaire. Out of the 139 filled-in questionnaires, 136 have been found complete
in all respects and used in data analysis while 3 have been rejected because of missing data. A
sample size of 136 is considered to be adequate for multi-variate data analysis (Hair et al., 2007).
Following is a brief profile of the respondents. Out of 136 respondents, 78 (57.35%) are small
enterprises and 58 (42.65%) are medium-sized enterprises. Respondent firms widely vary in terms
of firm age and number of employees. The firm age varies from 6 months to 600 months with an
average, standard deviation and median of 225.51 months, 157.37 months and 198 months,
respectively. Firms employ from 2 to 800 employees with an average of 74.49 employees, and
standard deviation and median of 133.10 and 27 employees, respectively. Annual sales revenues

32
also vary widely across firms. Many firms being privately held have not disclosed their annual
sales figures. Among the 80 firms that have revealed their annual sales revenues, the figure varies
from INR 0.50 million to INR 13.60 billion, with an average of INR 391.10 million, and standard
deviation and median of INR 1.53 billion and INR 75 million, respectively. Out of 136 firms, 79
(58.09%) are family-managed and 57 (41.91%) are professionally-managed. Food and beverages,
textile, engineering, leather and chemicals sectors are represented by 28 (20.59%), 27 (19.85%),
31 (22.79%), 24 (17.65%) and 26 (19.12%) respondents, respectively. Forty five firms (33.09%)
are ISO 9000-certified while the rest 91 (66.91%) are not. In terms of ISO 14000 certification and
implementation of an EMS, respondent firms lag far behind their larger counterparts and SMEs in
developed countries. Only 7 (5.15%) firms are ISO 14000-certified while 14 (10.29%) have
implemented an EMS. Among the 136 respondents, 112 (82.35%) have identified themselves as
owners/managers and the rest 24 (17.65%) are vice presidents, directors, and executives in
different functional areas such as accounts, purchase, sales, IT and public relations. The
distributions of respondent firm age, number of employees and annual sales have been given in
the Appendix.
Data collected have been collated in MS Excel and analyzed using multi-variate techniques such
as exploratory/confirmatory factor analysis and structural equation modelling. Although scales
have been developed in the extant literature, they have not been tested in the Indian context so far.
Moreover, scales used in the extant studies have not been uniform in terms of definitions of items
and constructs and assignments of items to different constructs. Therefore, it has become
imperative to define a scale for the present study and use exploratory factor analysis to identify the
constructs (latent variables) and items that load on these constructs relevant in the Indian context.
Further, the scale developed in this study can be used in future research on Indian SMEs as well
as on SMEs belonging to other developed and developing countries. As already discussed, scale
items have been developed based on the extant literature and inputs received from academicians,
experts and practitioners, and finalized after receiving feedback from a pilot study. Content/face
validity, unidimensionality and reliability have been assessed through exploratory factor analysis.
Confirmatory factor analysis has been used to assess convergent and discriminant validity,
construct reliability and the overall fit of the measurement model. Structural equation modelling
has been employed to test the proposed hypotheses. As far as the application packages are

33
concerned, SPSS has been used for exploratory factor analysis and AMOS has been used for
confirmatory factor analysis and structural equation modelling.
Results
In this section, we present the results of exploratory/confirmatory factor analysis and structural
equation modelling. We have followed Hair et al. (2007) for factor analysis and structural equation
modelling.
Exploratory factor analysis
For exploratory factor analysis, we have assumed normality, linearity, homoscedasticity and
homogeneity of the sample. The sample size exceeds the minimum sample size of 50. Also, the
ratio of the sample size to the number of variables exceeds the minimum suggested ratio of 5:1.
Significant correlations exist among many of the variables and partial correlations among most of
the variables are insignificant. Also, Bartlett’s test of sphericity shows statistical significance
indicating sufficient correlations among the variables. Measures of sampling adequacy (MSA) are
at least 0.50 for both the overall test and each individual variable. Common method bias is checked
by Harman’s single-factor test, which reveals no single factor in the unrotated factor solution that
accounts for more than 50% of the variance, indicating the non-existence of common method bias
(Leonidou et al., 2017; Courrent et al., 2018).
For factor analysis, principal components analysis with varimax rotation is employed. The number
of factors is decided based on the following: eigenvalues of factors should be more than 1 and
variance explained by the factors should be at least 70% of the total variance. Factor loadings of
0.60 or more are considered for variables to load on a factor and also communalities of variables
should be at least 0.50.
Content/face validity is maintained in terms of taking the questionnaire items from the extant
literature, soliciting expert opinions on the questionnaire and pre-testing the questionnaire before
the actual survey. Majority of the items loading on a single factor and the non-existence of
significant cross-loadings ensure unidimensionality. Reliability is assessed by the following
criteria: item-to-item correlation is more than 0.30, item-to-total (summated scale) correlation is
more than 0.50, and Cronbach’s alpha is at least 0.70.

34
(i) External drivers of sustainability
Q.7 of the questionnaire lists the items related to the external drivers of sustainability. Factor
analysis of the items reveals 4 distinct factors. Items 7(b), 7(f), 7(g) and 7(n) have been dropped
because either MSA or communality is less than 0.50. Table 1 shows the factors, items, item
statistics, factor loadings and Cronbach’s alpha for each factor. Factor names reflect the items that
load on them. Since Factor 4: Pressure of Compliance has a Cronbach’s alpha less than 0.70, it
will be dropped from subsequent analyses.
Table 1: Item statistics and factor loadings for the external drivers of sustainability (Q.7 of
the questionnaire)
Item Item
Mean
Item
Std.
Dev.
Factor 1:
Customer
Pressure and
Industry
Facilitation
Factor 2:
Government
Facilitation
Factor 3:
Customer
facilitation
Factor 4:
Pressure of
Compliance
7(i): Supplier environmental
audit by customers 3.26 1.07 0.832
7(j): Customer requirement of
disclosure of material
composition data for product(s)
3.43 1.21 0.806
7(h): Customers’ consideration
of environmental/social criteria
for supplier selection
3.45 1.04 0.684
7(p): Awareness and training
programmes conducted by
industry associations/chambers
of commerce
3.59 1.03 0.655
7(d): Technical support/
facilitation provided by govt. 3.84 1.24 0.901
7(e): Awareness/training
programmes organized by govt. 3.84 1.27 0.893
7(c): Financial incentives
provided by govt. (soft loan/tax
exemption/subsidy)
4.11 1.08 0.648

35
7(l): Collaboration/joint R&D
with customers 3.18 1.10 0.804
7(k): Financial incentive/
preference given by customers 2.78 0.99 0.752
7(m): Supplier training
organized by customers 2.99 1.14 0.730
7(a): Govt. regulations/
legislations 4.07 1.01 0.877
7(o): Pressure of compliance
with industry norms 3.73 0.95 0.741
Cronbach’s alpha based on
standardized items 0.780 0.810 0.705 0.655
Note: Only factor loadings of 0.60 or more are shown in the table.
Items are arranged in the descending order of their factor loadings.
(ii) Internal drivers of sustainability
Q.8 of the questionnaire lists the items related to the internal drivers of sustainability. Factor
analysis of the items reveals 3 distinct factors. Items 8(e), 8(h)-8(m), 8(p), 8(r) and 8(u) have been
dropped because of insignificant factor loadings or significant cross-loadings. Table 2 shows the
factors, items, item statistics, factor loadings and Cronbach’s alpha for each factor. Factor names
reflect the items that load on them.
Table 2: Item statistics and factor loadings for the internal drivers of sustainability (Q.8 of
the questionnaire)
Item
Item
Mean
Item
Std.
Dev.
Factor 1:
Leadership,
Motivation,
Commitment and
Ethical Orientation
of Owners/
Managers and
Employees
Factor 2:
Perceived
Economic and
Strategic
Advantages
Factor 3:
Perceived
Marketing and
HR
Competitive
Advantages
8(b): Leadership abilities of
owners/managers 4.40 0.89 0.886

36
8(c): Ethical orientation of
owners/managers 4.35 0.92 0.842
8(a): Owners’/managers’
vision, values and beliefs 4.35 0.93 0.832
8(d): Owners’/managers’
commitment to environmental/
social responsibility
4.25 0.72 0.822
8(f): Ethical orientation of
company employees 4.10 0.76 0.693
8(g): Motivation and
commitment of employees 4.28 0.76 0.683
8(o): Improved brand
image/reputation of company 4.45 0.73 0.888
8(n): Increase in sales, revenue
and profitability 4.30 0.71 0.885
8(q): Improved customer
satisfaction/loyalty 4.26 0.68 0.751
8(t): Development of new
products 4.29 0.75 0.795
8(s): Better talent attraction
and retention 4.07 0.82 0.789
8(v): Access to new
customers/new markets 4.21 0.82 0.710
Cronbach’s Alpha based on
Standardized Items 0.917 0.853 0.787
Note: Only factor loadings of 0.60 or more are shown in the table.
Items are arranged in the descending order of their factor loadings.
(iii) Procurement and product and process design
Q.9 of the questionnaire lists the items related to procurement and product and process design.
Factor analysis of the items reveals 5 distinct factors. Items 9(a), 9(d), 9(i), 9(k), 9(o), 9(p) and
9(s) have been dropped because of low MSA (< 0.50), insignificant factor loadings or significant
cross-loadings. Table 3 shows the factors, items, item statistics, factor loadings and Cronbach’s
alpha for each factor. Factor names reflect the items that load on them. Since Cronbach’s alpha is
less than 0.70 for Factor 3: Supplier Collaboration, Incentive and Training Programme and
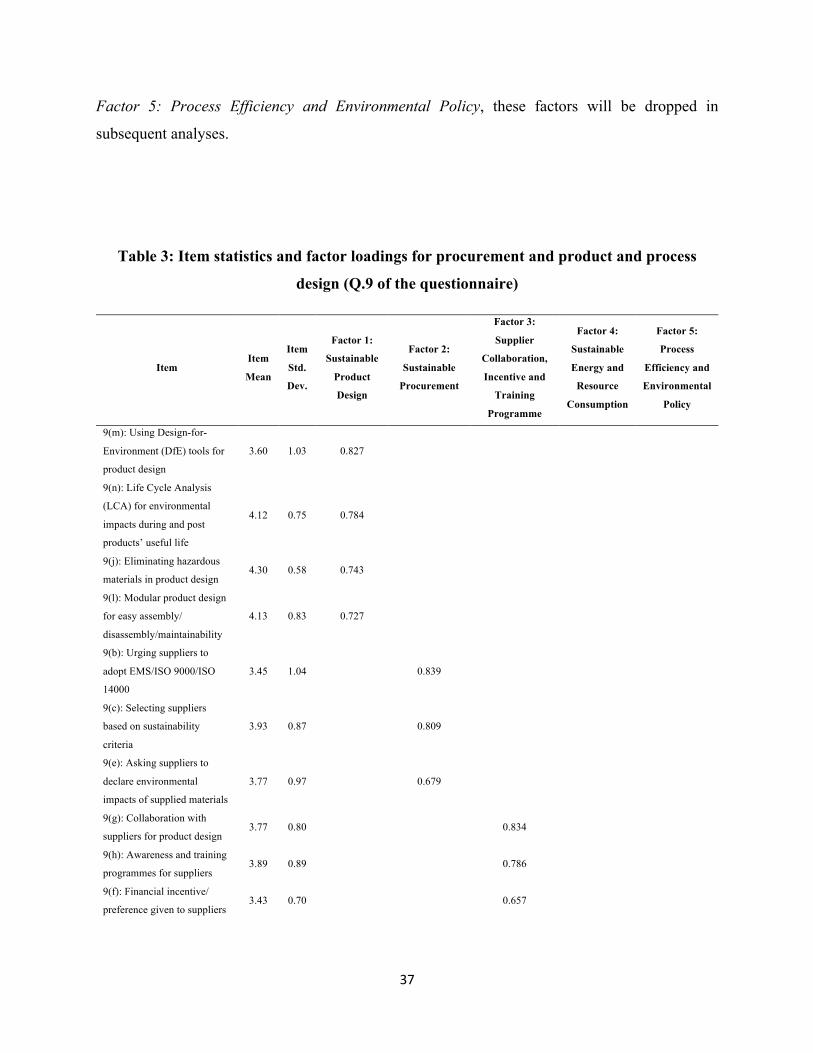
37
Factor 5: Process Efficiency and Environmental Policy, these factors will be dropped in
subsequent analyses.
Table 3: Item statistics and factor loadings for procurement and product and process
design (Q.9 of the questionnaire)
Item Item
Mean
Item
Std.
Dev.
Factor 1:
Sustainable
Product
Design
Factor 2:
Sustainable
Procurement
Factor 3:
Supplier
Collaboration,
Incentive and
Training
Programme
Factor 4:
Sustainable
Energy and
Resource
Consumption
Factor 5:
Process
Efficiency and
Environmental
Policy
9(m): Using Design-for-
Environment (DfE) tools for
product design
3.60 1.03 0.827
9(n): Life Cycle Analysis
(LCA) for environmental
impacts during and post
products’ useful life
4.12 0.75 0.784
9(j): Eliminating hazardous
materials in product design 4.30 0.58 0.743
9(l): Modular product design
for easy assembly/
disassembly/maintainability
4.13 0.83 0.727
9(b): Urging suppliers to
adopt EMS/ISO 9000/ISO
14000
3.45 1.04 0.839
9(c): Selecting suppliers
based on sustainability
criteria
3.93 0.87 0.809
9(e): Asking suppliers to
declare environmental
impacts of supplied materials
3.77 0.97 0.679
9(g): Collaboration with
suppliers for product design 3.77 0.80 0.834
9(h): Awareness and training
programmes for suppliers 3.89 0.89 0.786
9(f): Financial incentive/
preference given to suppliers 3.43 0.70 0.657

38
meeting/exceeding
sustainability criteria
9(q): Using alternative/non-
conventional energy sources 3.58 1.00 0.896
9(r): Reducing resource
consumption in
manufacturing
3.95 0.65 0.842
9(u): Having a formal
environmental management
policy
3.87 0.77 0.798
9(t): Reducing waste and
spill-over in processes 3.99 0.73 0.744
Cronbach’s Alpha based on
Standardized Items 0.793 0.718 0.691 0.846 0.512
Note: Only factor loadings of 0.60 or more are shown in the table.
Items are arranged in the descending order of their factor loadings.
(iv) Packaging, transportation, waste management and office practices
Q.10 of the questionnaire lists the items related to packaging, transportation, waste management
and office practices. Factor analysis of the items reveals 5 distinct factors. Items 10(a), 10(e), 10(l),
10(m), 10(s), 10(t) and 10(v) have been dropped because of low communality (< 0.50),
insignificant factor loadings or significant cross-loadings. Table 4 shows the factors, items, item
statistics, factor loadings and Cronbach’s alpha for each factor. Factor names reflect the items that
load on them. Since Cronbach’s alpha is less than 0.70 for Factor 3: Economic Packaging and
Transportation, Factor 4: Water and Energy Efficiency in Office and Factor 5: Environment-
friendly Transportation, these factors will be dropped in subsequent analyses.
Table 4: Item statistics and factor loadings for packaging, transportation, waste
management and office practices (Q.10 of the questionnaire)
Item Item
Mean
Item
Std.
Dev.
Factor 1:
Eco-friendly
Waste
Management
Factor 2:
Sustainable
Office
Environment
Factor 3:
Economic
Packaging and
Transportation
Factor 4:
Water and
Energy
Efficiency in
Office
Factor 5:
Environment-
friendly
Transportation
10(j): Treatment of effluents
before discharging 4.14 0.75 0.921
10(h): Segregation of
hazardous and non-4.07 0.86 0.817

39
hazardous waste before
disposal
10(i): Environmentally safe
disposal of solid waste 4.13 0.76 0.746
10(k): Separation of
recyclable and non-
recyclable materials from
waste
3.95 0.81 0.726
10(q): Ensuring a safe and
healthy working
environment
4.15 0.92 0.800
10(u): Eco-friendly design
and layout of office space 4.18 0.64 0.799
10(r): Periodic checking of
internal air and water quality 4.17 0.83 0.777
10(p): Using alternative/non-
conventional energy sources 3.57 1.13 0.683
10(b): Reducing the quantity
of packaging materials 3.66 0.86 0.839
10(d): Ensuring economies
of scale in transportation 3.67 0.85 0.684
10(c): Taking back and
recycling packaging
materials
3.51 0.91 0.679
10(n): Recycling of used
toilet water post treatment 3.43 1.11 0.903
10(o): Installation of water-
/energy-efficient equipment 3.50 0.98 0.618
10(g): Optimizing
distribution networks/vehicle
routes
3.65 0.96 0.846
10(f): Using alternate fuels
(e.g. CNG) for transportation 3.40 1.09 0.701
Cronbach’s Alpha based on
Standardized Items 0.897 0.832 0.686 0.653 0.647
Note: Only factor loadings of 0.60 or more are shown in the table.
Items are arranged in the descending order of their factor loadings.
(v) Human resources practices and local community development
Q.11 of the questionnaire lists the items related to human resources practices and local community
development. Factor analysis of the items reveals 4 distinct factors. Item 11(l) has been dropped

40
due to low communality (< 0.50). Table 5 shows the factors, items, item statistics, factor loadings
and Cronbach’s alpha for each factor. Factor names reflect the items that load on them.
Table 5: Item statistics and factor loadings for human resources practices and local
community development (Q.11 of the questionnaire)
Item Item
Mean
Item
Std.
Dev.
Factor 1:
Working
Condition and
Employee
Involvement
Factor 2:
Services
rendered to
Local
Community
Factor 3:
Employee
Development
and Community
Employment
Generation
Factor 4:
Local
Community
Development
11(e): Meeting training/
development needs of
employees
4.17 0.95 0.837
11(d): Ensuring fair
compensation/pay to
employees
4.07 0.91 0.830
11(a): Ensuring a safe
and healthy working
condition
4.13 0.90 0.810
11(f): Encouraging
employees for
participation/teamwork
4.26 0.76 0.795
11(g): Encouraging
employees for
creativity/ innovation
4.15 0.69 0.778
11(b): Ensuring rights,
dignity and equal
opportunities
4.32 0.73 0.656

41
11(o): Arranging for
health check-up/medical
facilities
3.60 1.01 0.872
11(p): Improving
sanitation facilities in
local community
3.32 1.09 0.831
11(r): Rendering
voluntary services to
local community
3.38 1.05 0.825
11(q): Engaging in
charitable activities in
cash or kind
3.40 0.96 0.824
11(n): Building schools
for education of local
children
3.30 1.12 0.732
11(h): Empowering
employees for decision-
making
4.04 0.67 0.755
11(j): Direct/indirect
employment generation/
earning opportunities
for local community
3.62 0.97 0.738
11(c): Ensuring welfare
of employees and their
families
4.20 0.73 0.709
11(i): Motivating
employees by job
rotation
3.63 1.01 0.662
11(m): Building
infrastructure/roads for
local community
3.47 1.05 0.776
11(k): Training local
people for alternative
livelihoods
3.32 1.13 0.759
Cronbach’s Alpha based
on Standardized Items 0.926 0.907 0.841 0.760
Note: Only factor loadings of 0.60 or more are shown in the table.

42
Items are arranged in the descending order of their factor loadings.
(vi) Environmental and employee-related social benefits
Q.12 of the questionnaire lists the items related to environmental and employee-related social
benefits. Factor analysis of the items reveals 2 distinct factors. Item 12(e) has been dropped due to
low MSA (< 0.50). Table 6 shows the factors, items, item statistics, factor loadings and Cronbach’s
alpha for each factor. Factor names reflect the items that load on them.
Table 6: Item statistics and factor loadings for environmental and employee-related
social benefits (Q.12 of the questionnaire)
Item Item
Mean
Item
Std. Dev.
Factor 1:
Environmental
Benefits
Factor 2:
Employee-
related Social
Benefits
12(a): Improved energy
efficiency of operations 4.02 0.82 0.923
12(b): Reduced material and
water consumption 4.13 0.66 0.840
12(c): Reduced emissions,
effluents and wastes 4.14 0.73 0.838
12(d): Reduced disposal and
increased recycling 3.85 0.90 0.809
12(h): Higher employee
productivity and quality 4.38 0.58 0.897
12(g): Improved morale/
motivation/commitment 4.18 0.59 0.853
12(f): Improved satisfaction/
loyalty of employees 4.07 0.55 0.737
12(i): Better talent
acquisition and retention 4.24 0.75 0.711
Cronbach’s Alpha based on
Standardized Items 0.904 0.841
Note: Only factor loadings of 0.60 or more are shown in the table.
Items are arranged in the descending order of their factor loadings.

43
(vii) Economic and strategic benefits
Q.13 of the questionnaire lists the items related to economic and strategic benefits. Factor analysis
of the items reveals 3 distinct factors. Items 13(g) and 13(h) have been dropped because of
insignificant factor loadings or significant cross-loadings. Table 7 shows the factors, items, item
statistics, factor loadings and Cronbach’s alpha for each factor. Factor names reflect the items that
load on them.
Table 7: Item statistics and factor loadings for economic and strategic benefits (Q.13 of
the questionnaire)
Item Item
Mean
Item
Std.
Dev.
Factor 1:
Marketing and
Economic
Performance
Factor 2:
Improved Quality
and Operational
Efficiency
Factor 3:
Long-term
Strategic
Advantages
13(n): Access to new customers/
new markets 4.34 0.77 0.839
13(d): Innovation in product and
process design 4.29 0.86 0.830
13(e): Increased sales volume
and sales revenue 4.38 0.77 0.807
13(m): Development of new
products 4.50 0.75 0.738
13(l): Improved customer
satisfaction/loyalty 4.41 0.61 0.630
13(f): Increased market share of
products 4.35 0.88 0.622
13(b): Improved product and
process quality 4.13 0.58 0.886
13(a): Reduced cost of
operations and products 3.88 0.86 0.779
13(c): Improved efficiency and
productivity 4.31 0.55 0.717
13(i): Increased competitive
advantage 4.17 0.57 0.811

44
13(k): Improved
image/reputation /media
coverage
3.83 1.03 0.689
13(j): Improved relationship
with stakeholders 4.26 0.81 0.661
Cronbach’s Alpha based on
Standardized Items 0.913 0.859 0.762
Note: Only factor loadings of 0.60 or more are shown in the table.
Items are arranged in the descending order of their factor loadings.
Confirmatory factor analysis
For confirmatory factor analysis (CFA), factors with Cronbach’s alpha less than 0.70 have been
dropped. Also, factors having less than three items have not been considered to avoid the problem
of under-identification. Therefore, we are left with 18 factors with their associated items for CFA.
Convergent validity has been tested by the following: factor loadings have to be statistically
significant and standardized loading estimates should be at least 0.60, average variance extracted
(AVE) should be at least 0.50 and construct reliability (CR) should be at least 0.70. Discriminant
validity has been established by the fact that between two constructs, AVE for either construct
should exceed the squared coefficient of correlation between the two constructs. Also, absolute
values of standardized residuals should be less than 2.50.
For convergent validity and an overall model fit, 13 factors and a number of items are needed to
be dropped, and the measurement model is respecified. Table 8 shows the constructs and items
with descriptive statistics, standardized loading estimates and critical ratios for the items, and AVE
and CR for the constructs. Table 9 shows the construct correlation matrix. The 5 constructs (The
first factor has been renamed to clearly reflect the items loaded on it while the names of the other
factors have remained the same) and 15 items, as shown in Table 8, have been retained for testing
the structural model.
It is observed from Table 8 that all the factor loadings are statistically significant and the
standardized loading estimates exceed 0.60. Also, AVE and CR for the constructs exceed 0.50 and
0.70, respectively, confirming convergent validity. Discriminant validity has been confirmed by

45
the criterion stated above. Also, the absolute values of all standardized residuals are less than 2.50.
The overall model fit statistics are as follows: Chi-square ( ) = 140.056, degrees of freedom (df)
= 80, relative chi-square ( ) = 1.75 (< 3 recommended for a good fit), GFI = 0.89, AGFI =
0.84, CFI = 0.95, RMR = 0.034 and RMSEA: 0.075 (< 0.08), which indicate a reasonably good fit
(Hair et al., 2007, p. 777).
Table 8: Results of confirmatory factor analysis
Construct Construct
Acronym
Construct
Mean
Construct
Std. Dev. Item
Item
Mean
Item
Std.
Dev.
Std.
Loading
Estimate
Critical
Ratio AVE CR
Leadership
and ethical
orientation of
owners/mana
gers and
employees
LE_ME 4.68 0.76
8(b): Leadership abilities
of owners/managers 4.40 0.89 0.902 ---*
0.69 0.91 8(c): Ethical orientation
of owners/managers 4.35 0.92 0.875 13.383
8(f): Ethical orientation
of company employees 4.10 0.76 0.696 9.424
Eco-friendly
waste
management
EF_WM 3.94 0.61
10(i): Environmentally
safe disposal of solid
waste
4.13 0.76 0.868 ---*
0.63 0.89
10(j): Treatment of
effluents before
discharging
4.14 0.75 0.751 8.893
10(k): Separation of
recyclable and non-
recyclable materials
from waste
3.95 0.81 0.750 8.874
Working
condition and
employee
involvement
WC_EI 4.42 0.71
11(a): Ensuring a safe
and healthy working
condition
4.13 0.90 0.820 ---*
0.76 0.94
11(f): Encouraging
employees for
participation/teamwork
4.26 0.76 0.927 12.920
11(g): Encouraging
employees for
creativity/innovation
4.15 0.69 0.866 12.004
2c
df2c

46
Environment
al benefits EN_BF 3.82 0.57
12(b): Reduced material
and water consumption 4.13 0.66 0.912 ---*
0.67 0.90
12(c): Reduced
emissions, effluents and
wastes
4.14 0.73 0.882 12.552
12(d): Reduced disposal
and increased recycling 3.85 0.90 0.644 8.340
Marketing
and
economic
performance
MK_EP 3.71 0.61
13(e): Increased sales
volume and sales
revenue
4.38 0.77 0.811 ---*
0.70 0.94 13(l): Improved
customer satisfaction/
loyalty
4.41 0.61 0.704 9.114
13(n): Access to new
customers/new markets 4.34 0.77 0.973 12.219
Note: * indicates the items for which the factor loading estimates have been set to 1 by the application package
(AMOS)
Table 9: Construct Correlation Matrix
Construct LE_ME EF_WM WC_EI EN_BF MK_EP
LE_ME 1
EF_WM 0.491++ 1
WC_EI 0.636++ 0.545++ 1
EN_BF 0.576++ 0.337++ 0.490++ 1
MK_EP 0.608++ 0.268++ 0.320++ 0.482++ 1
Note: Superscript (++) represents significance at 0.01 level
Structural equation modelling
Since Factor 2: Employee-related Social Benefits of Table 6 has been dropped to obtain a good fit
for CFA, propositions P4, P8, P10 and P14 are not relevant for the study. The rest of the
propositions have been rephrased to reflect the renamed and retained factors, and the following
hypotheses are being proposed:
Hypothesis 1 (H1): Leadership and ethical orientation of owners/managers and employees is
positively related to eco-friendly waste management.

47
Hypothesis 2 (H2): Leadership and ethical orientation of owners/managers and employees is
positively related to working condition and employee involvement.
Hypothesis 3 (H3): Leadership and ethical orientation of owners/managers and employees is
positively related to environmental benefits.
Hypothesis 4 (H4): Leadership and ethical orientation of owners/managers and employees is
positively related to marketing and economic performance.
Hypothesis 5 (H5): Working condition and employee involvement is positively related to eco-
friendly waste management.
Hypothesis 6 (H6): Eco-friendly waste management is positively related to environmental benefits.
Hypothesis 7 (H7): Eco-friendly waste management is positively related to marketing and
economic performance.
Hypothesis 8 (H8): Working condition and employee involvement is positively related to
environmental benefits.
Hypothesis 9 (H9): Working condition and employee involvement is positively related to marketing
and economic performance.
Hypothesis 10 (H10): Environmental benefits are positively related to marketing and economic
performance.
It may be noted that hypotheses H1-H10 broadly correspond to propositions P1-P3, P5-P7, P9
and P11-P13, respectively.
Maximum likelihood estimation (MLE) has been used for structural equation modelling (SEM).
Figure 2 shows the path diagram corresponding to the SEM results. The overall model fit statistics
for SEM match exactly with the corresponding statistics for CFA, i.e. change in chi-square,
= 0 with = 0, which indicates a good fit. Figure 2 shows that H1-H5, H8 and H10 are supported
while H6, H7 and H9 are not supported. Table 10 summarizes the results of hypothesis testing.
2cD
dfD

48
Fig. 2: Path diagram corresponding to the SEM results
Note: Solid and dashed lines represent the hypotheses that are supported and not supported,
respectively. Figures within brackets show the standardized path estimates for the
hypotheses that are supported. Superscripts (+) and (++) represent significance at 0.05 level
and 0.01 level, respectively.
Table 10: Summary results of hypothesis testing
Hypothesis Description Result
LE_ME
EN_BF WC_EI
EF_WM MK_EP
H1
H2
H3
H4
H6
H7
H5
H8
H9
H10
(0.24)+
(0.64)++
(0.44)++
(0.58)++ (0.39)++
(0.20)+
(0.23)+

49
H1 Leadership and ethical orientation of owners/managers and
employees is positively related to eco-friendly waste
management
Supported
H2 Leadership and ethical orientation of owners/managers and
employees is positively related to working condition and
employee involvement
Supported
H3 Leadership and ethical orientation of owners/managers and
employees is positively related to environmental benefits
Supported
H4 Leadership and ethical orientation of owners/managers and
employees is positively related to marketing and economic
performance
Supported
H5 Working condition and employee involvement is positively
related to eco-friendly waste management
Supported
H6 Eco-friendly waste management is positively related to
environmental benefits
Not supported
H7 Eco-friendly waste management is positively related to
marketing and economic performance
Not supported
H8 Working condition and employee involvement is positively
related to environmental benefits
Supported
H9 Working condition and employee involvement is positively
related to marketing and economic performance
Not supported
H10 Environmental benefits are positively related to marketing and
economic performance
Supported
Moderating variables
Literature suggests that there are various factors that moderate the relationships among the drivers
of sustainability, sustainable business practices and firm performance. For example, size (annual
sales, number of permanent employees, etc.), age and experience of an enterprise (Cordano et al.
2010; Lewis and Cassells, 2010; Roxas and Coetzer, 2012; Torugsa et al., 2012, 2013; Uhlaner et
al., 2012; Becherer and Helms, 2014; Singh et al., 2015; Wu et al., 2015; Dekker and Hasso, 2016;
50
Ashton et al., 2017; Chasse and Courrent, 2018; Courrent et al., 2018), family- or professionally-
managed enterprise (Nair and Sodhi, 2012; Lewis et al., 2015), quality and environmental
management certifications, technical ability/competency in terms of manufacturing and
information technology, quality of human resources (educational background, training,
development, awareness, motivation, etc.), knowledge/awareness of owners/managers of
sustainability issues, and networking/forming alliances with industry associations and peers to
share knowledge and resources (Lawrence et al., 2006; Gadenne et al., 2009; Lewis et al., 2015;
Johnson and Schaltegger, 2016; Chen et al., 2017; Johnson, 2017) are perceived to influence the
strength of relationships among the drivers, sustainable practices and firm performance.
The effect on the structural model has been studied for the following moderating variables:
(i) Size of the firm (small or medium and number of employees)
(ii) Age of the firm
(iii) Management of the firm (family- or professionally-managed)
(iv) ISO 9000 certification
(v) Awareness of owners/managers
(vi) Owners’/managers’ educational qualification
(vii) Education level of employees
The effect of the moderating variables, technical ability/competency and networking/alliances with
industry associations/peers could not be studied because of inadequate sample sizes for the
underlying groups.
To study the effect of the moderating variables, the multi-group analysis in SEM is followed. The
same structural model is tested for two groups to check whether the model statistics are
significantly different for the two groups to infer that the underlying variable associated with the
formation of the groups has a significant moderating effect on the structural relationships.
To ascertain any difference between two groups, it is checked whether the difference between the
statistics for the two groups is statistically significant when the path estimates for the
corresponding structural relationships are constrained to be equal, taking one relationship at a time.
Only those structural relationships have been considered for which at least one of the groups has
a significant non-zero path estimate.
2c

51
(i) Size
For firm size, whether the firm is small or medium, and the number of employees, have been
considered. Annual sales have not been taken due to an inadequate sample size (As mentioned
before, only 80 firms have revealed their annual sales figures).
(a) Small/Medium
Table 11 shows the results for SEM multi-group analysis for small/medium-sized firms.
Table 11: SEM multi-group analysis results for small/medium-sized firms
Direction of Causality Standardized Path
Estimate Significant (S)/
Not Significant (NS) From To
Small
(78)
Medium
(58)
LE_ME WC_EI 0.61 0.72 NS
LE_ME EF_WM 0.33 -- NS
LE_ME EN_BF 0.47 0.44 NS
LE_ME MK_EP 0.74 -- S
( = 6.76, = 1, p-value = 0.009)
WC_EI EF_WM 0.32 -- NS
WC_EI EN_BF -- -- --
WC_EI MK_EP -- -- --
EF_WM EN_BF -- -- --
EF_WM MK_EP -- -- --
EN_BF MK_EP -- 0.29 NS
Note: Figures within brackets for groups represent sample sizes
(b) Number of employees
To group the firms based on the number of employees, the median value (27) has been taken. Table
12 shows the results of SEM multi-group analysis for the number of employees.
Table 12: SEM multi-group analysis results for the number of employees
2cD dfD

52
Direction of Causality Standardized Path Estimate
Significant (S)/
Not Significant (NS) From To
No. of
employees <=
27 (68)
No. of
employees >
27 (68)
LE_ME WC_EI 0.58 0.79 NS
LE_ME EF_WM 0.35 -- NS
LE_ME EN_BF 0.48 0.69 NS
LE_ME MK_EP 0.95 -- S
( = 16.25, = 1, p-value = 0.000)
WC_EI EF_WM 0.36 -- NS
WC_EI EN_BF -- -- --
WC_EI MK_EP -- -- --
EF_WM EN_BF -- -- --
EF_WM MK_EP -- -- --
EN_BF MK_EP -- 0.75 S
( = 17.22, = 1, p-value = 0.000)
Note: Figures within brackets for groups represent sample sizes
It is observed that simultaneously constraining all the path estimates of the corresponding
structural relationships to be equal, as per H1-H10, results in a significantly worse fit with
=27.905, =10, and p-value = 0.002, vis-à-vis the unconstrained model, which means the
number of employees has a significant moderating effect on the overall structural model.
The extant literature presents a contradictory view of the effect of firm size on the adoption of
environment-friendly practices and firms’ financial performance. Cordano et al. (2010) use the
number of employees as a control variable and observe that the same has a significantly positive
relationship with the adoption of environmental management programmes and practices. Uhlaner
et al. (2012) also find that the higher the number of employees, the higher the likelihood of SMEs
engaging in environmental management practices, although the effect of size is indirect rather than
direct. However, none of the authors has tested the structural relationship between environmental
management practices and firm performance. Boakye et al. (2020) use firm size as a control
variable and observe that it has a positive effect on the relationship between sustainable
environmental practices and financial performance. On the other hand, Fleiter et al. (2012) do not
2cD dfD
2cD dfD
2cD
dfD

53
find any significant effect of firm size (number of employees) on the adoption of energy efficiency
measures.
In this study, for both the variables, size and number of employees, the multi-group analysis reveals
statistically significant differences for the relationship between LE_ME and MK_EP, indicating
that smaller firms show a stronger effect of the leadership and ethical orientation of
owners/managers and employees on firms’ financial and non-financial performance than for larger
firms. Although the multi-group analysis does not show statistically significant differences for the
relationships between LE_ME and EF_WM, and also between WC_EI and EF_WM, the
standardized path estimates for both the variables, size and number of employees, indicate that for
smaller firms the relationships between the leadership and ethical orientation of owners/managers
and employees and environment-friendly waste management practices, and between employee-
related social sustainability practices and environment-friendly waste management practices, are
more pronounced than for larger firms. Nair and Sodhi (2012) also note that the smaller the
enterprise, the greater would be the relative role of ethical and moral considerations as drivers for
CSR. On the other hand, the standardized path estimates for the relationship between LE_ME and
WC_EI for both the variables, size and number of employees, indicate that for larger firms, the
leadership and ethical orientation of owners/managers is more positively associated with
employee-related social sustainability practices than for smaller firms. This result corroborates the
finding of Chasse and Courrent (2018), who note that size (number of employees) has a significant
moderating effect on the positive relationship between SME owners’/managers’ personal
sustainability behaviour and firms’ workplace practices. Also, for the relationship between EN_BF
and MK_EP, both the variables, size and number of employees, indicate that larger firms have a
stronger impact of environmental benefits on firm performance than for smaller firms. For the
number of employees, the difference between the two groups is also statistically significant. From
the results it seems that while for smaller firms, the leadership and ethical orientation of
owners/managers and employees and socially responsible HRM practices are manifested in
environment-friendly waste management practices, larger firms have a better ability to convert the
environmental benefits realized as a result of adoption of environment-friendly practices into
firms’ financial and non-financial performance. Torugsa et al. (2012, 2013) find a positive role of
the number of employees in the relationship between proactive CSR and financial performance,
lending support to the RBV theory. Singh et al. (2015) also note from the extant literature that

54
larger firms have more resources to realize a higher environmental and financial performance than
smaller firms.
(ii) Age of the firm
To group the firms based on their age, the median value (198 months) has been taken. Table 13
shows the results of SEM multi-group analysis for the age of the firm.
Table 13: SEM multi-group analysis results for the age of the firm
Direction of Causality Standardized Path Estimate
Significant (S)/
Not Significant (NS) From To
Firm age <=
198 months
(68)
Firm age >
198 months
(68)
LE_ME WC_EI 0.53 0.72 NS
LE_ME EF_WM -- -- --
LE_ME EN_BF 0.35 0.48 NS
LE_ME MK_EP 0.57 0.60 NS
WC_EI EF_WM 0.42 0.35 NS
WC_EI EN_BF -- -- --
WC_EI MK_EP -- -- --
EF_WM EN_BF -- -- --
EF_WM MK_EP -- -- --
EN_BF MK_EP -- 0.25 NS
Note: Figures within brackets for groups represent sample sizes
Although the difference between the two groups is not statistically significant for none of the
relationships, it may be seen that the relationships among the leadership and ethical orientation of
owners/managers and employees, employee-related social sustainability practices, environmental
benefits and firm performance are stronger for older firms than for younger firms. The results
indicate that the older and more mature a firm is, the stronger is the impact of adoption of
sustainable practices on firm performance, generally supporting the observation of the extant
literature.

55
Roxas and Coetzer (2012) examine the moderating roles of age and size (number of employees)
of a firm in the structural relationships among the institutional environment, owners’/managers’
attitudes towards the natural environment and environmental sustainability orientation of small
firms. The authors find that while the regulatory dimension of the institutional environment has a
stronger effect on owners’/managers’ attitudes towards the natural environment for younger and
smaller firms, the normative dimension of the institutional environment has a stronger effect on
owners’/managers’ attitudes towards the natural environment for older and larger firms. The
association between owners’/managers’ attitudes towards the natural environment and firms’
environmental sustainability orientation remains strong irrespective of their age and size.
However, the authors have not tested the moderating roles of age and size of a firm on the
relationship between environmental management practices and environmental/firm performance.
While Singh et al. (2015) note from the literature that larger firms are more likely to adopt
environment-friendly practices than smaller firms, their hypothesis, i.e. younger firms are more
likely to adopt environment-friendly practices than older firms is not supported.
Dekker and Hasso (2016) observe that size (annual sales and number of employees) and age of a
family firm are positively related to the firm’s environmental performance focus, i.e. the larger the
size and the older the firm is, the higher is the focus of the firm on environmental performance.
However, the authors do not consider actual environmental performance outcomes, nor do they
test the moderating role of age and size of a firm on the structural relationship between
environmental practices and environmental performance. In the authors’ own words, they posit
that family firms will have a greater desire than non-family firms for improved environmental
performance; however, whether this desire translates into improved environmental performance is
a separate issue.
Ashton et al. (2017) note that while age of the firm is unrelated to the adoption of green practices,
size (number of employees) and sales are indeed positively related to the adoption of green
practices by SMEs. However, the authors do not test any structural relationship, as is done in this
study.
Courrent et al. (2018) find that firm size (number of employees) has a slightly negative impact on
firm performance while the effect of firm age is insignificant. Chasse and Courrent (2018) also do

56
not find any significant effect of firm age on the environmental, workplace and community
dimensions of corporate sustainability practices.
(iii) Management of the firm
The firms have been grouped based on whether they are family-managed or professionally-
managed. Table 14 shows the results of SEM multi-group analysis based on management of the
firm.
Table 14: SEM multi-group analysis results based on management of the firm
Direction of Causality Standardized Path Estimate Significant (S)/
Not Significant (NS) From To Family-
managed (79)
Professionally-
managed (57)
LE_ME WC_EI 0.70 0.42 NS
LE_ME EF_WM 0.39 -- NS
LE_ME EN_BF 0.47 0.28 NS
LE_ME MK_EP 0.58 0.50 NS
WC_EI EF_WM 0.27 0.54 NS
WC_EI EN_BF -- 0.47 S
( = 2.71, = 1, p-value = 0.100)
WC_EI MK_EP -- -- --
EF_WM EN_BF -- -0.33 S
( = 4.87, = 1, p-value = 0.027)
EF_WM MK_EP -- -- --
EN_BF MK_EP -- 0.32 NS
Note: Figures within brackets for groups represent sample sizes
Dekker and Hasso (2016) note that the extant literature highlights more positive relationships
among SME owners’/managers’ values, beliefs and attitudes towards the natural environment,
adoption of environmental management practices and environmental performance in family firms
than in non-family firms. The authors observe that the relationships are stronger when family firms
are embedded in their local communities.
2cD dfD
2cD dfD

57
If we compare the standardized path estimates between LE_ME and EF_WM for the two groups,
it definitely supports the proposition of Berrone et al. (2010) and Sharma and Sharma (2011) that
the leadership, attitude and ethical orientation of owners/managers and employees of a family-
managed SME more strongly and positively influence the adoption of proactive environmental
strategies than for a non-family, professionally-managed SME. The same conclusion may be
drawn for the relationship between LE_ME and WC_EI that the leadership and ethical orientation
of owners/managers and employees has a stronger positive effect on employee-related social
sustainability practices for a family-managed SME than for a professionally-managed SME.
Moreover, the relationships between LE_ME and EN_BF, and between LE_ME and MK_EP,
show that for a family-managed SME, leadership and ethical orientation has a more positive
influence on environmental benefits and firm performance than for a professionally-managed
SME. Uhlaner et al. (2012) also note that SMEs with higher family influence are more likely to
engage in environmental management practices and the effect becomes stronger for SMEs with
more number of owners. On the other hand, a significant difference between the two groups is
observed in terms of the relationship between WC_EI and EN_BF indicating that professionally-
managed SMEs are better able to realize environmental benefits as a result of their socially
sustainable HRM practices than family-managed SMEs. However, the significant difference
between the two groups in terms of the relationship between EF_WM and EN_BF reveals that for
professionally-managed SMEs, investments in environment-friendly waste management practices
have an adverse impact on environmental benefits.
(iv) ISO 9000 certification
Table 15 shows the results of SEM multi-group analysis based on whether the firms are ISO 9000-
certified or not.
Table 15: SEM multi-group analysis results based on ISO 9000 certification
Direction of
Causality
Standardized Path
Estimate Significant (S)/
Not Significant (NS) From To Yes (45) No (91)
LE_ME WC_EI 0.60 0.65 NS
LE_ME EF_WM 0.32 -- NS
LE_ME EN_BF -- 0.58 S

58
( = 3.41, = 1, p-value = 0.065)
LE_ME MK_EP 0.66 0.62 NS
WC_EI EF_WM 0.38 0.42 NS
WC_EI EN_BF 0.30 -- NS
WC_EI MK_EP -- -- --
EF_WM EN_BF -0.19 -- NS
EF_WM MK_EP -- -- --
EN_BF MK_EP -- -- --
Note: Figures within brackets for groups represent sample sizes
Although, in their study, Dey et al. (2020) mention that ISO 9000 certifications help in achieving
environmental sustainability, the same is not revealed in the present study. In fact, a significant
positive relationship is observed between the leadership and ethical orientation of
owners/managers and employees and environmental benefits for SMEs that are not ISO 9000-
certified vis-à-vis SMEs that are ISO 9000-certified. This result corroborates the observation of
Gadenne et al. (2009), i.e. SMEs may engage in waste management and recycling activities, and
realize environmental benefits; however, they may not formally engage in environmental
certification processes. Therefore, the present study does not support the proposition that SMEs’
ISO 9000 certifications positively influence their adoption of sustainable environmental and social
practices and the consequent influence on firm performance.
(v) Awareness of owners/managers
Respondents have been asked about their awareness of sustainability/regulatory issues on a scale
of ‘low’, ‘moderate’ and ‘high’. The numbers of respondents, who have indicated ‘low’,
‘moderate’ and ‘high’ awareness, are 6, 74 and 56, respectively. For the purpose of SEM multi-
group analysis, respondents, who have marked ‘low’ and ‘moderate’, have been clubbed and thus
two groups have been formed – ‘low to moderate’ and ‘high’ awareness. Table 16 shows the results
of SEM multi-group analysis for these two groups.
Table 16: SEM multi-group analysis results with respect to the awareness of
owners/managers
Direction of Causality Standardized Path
Estimate
Significant (S)/
Not Significant (NS)
2cD dfD

59
From To Low to
Moderate (80)
High
(56)
LE_ME WC_EI 0.66 0.49 NS
LE_ME EF_WM 0.37 -- NS
LE_ME EN_BF 0.48 0.41 NS
LE_ME MK_EP 0.73 0.38 NS
WC_EI EF_WM 0.27 0.52 S
( = 3.57, = 1, p-value = 0.059)
WC_EI EN_BF -- 0.39 NS
WC_EI MK_EP -- -- --
EF_WM EN_BF -- -- --
EF_WM MK_EP -- -- --
EN_BF MK_EP -- 0.40 NS
Note: Figures within brackets for groups represent sample sizes
The difference between the two groups is statistically significant for the relationship between
WC_EI and EF_WM, indicating that for SMEs with high awareness of owners/managers,
employee-related social sustainability practices have a stronger effect on environment-friendly
waste management practices than for SMEs with low-to-moderate awareness of owners/managers.
Although the difference between the two groups is not statistically significant for the relationships
between WC_EI and EN_BF, and between EN_BF and MK_EP, it may be inferred from the
standardized path estimates for the two groups that while the relationships are insignificant for
SMEs with low-to-moderate awareness of owners/managers, they are significant for SMEs with
high awareness of owners/managers, implying the indirect relationship between employee-related
social sustainability practices and firm performance through the mediating role of environmental
benefits. Prashar and Sunder (2020) also mention the moderating role of firm’s awareness of
sustainability in the positive relationship between sustainable practices and financial performance.
For other structural relationships, the benefits of high awareness over low-to-moderate awareness
are not observed. Although Gadenne et al. (2009) find support for the proposition that
owners’/managers’ awareness is positively associated with a higher level of environmental
practices such as waste reduction and recycling, the same has not received consistent support in
the literature. In a study of Indian SMEs, Nulkar (2014) notes that high awareness may not always
lead to adoption of environmental practices because SMEs may lack the required expertise to
2cD dfD

60
explore the opportunities and recognize the business gains from environmental initiatives, and also
competitive pressure may deter them from making investments in areas where they do not see any
immediate business benefits. Fernandez and Camacho (2016) note from the comments made by
one of the interviewees of their study that people say they are aware of sustainability issues, but
the awareness is not always reflected in actions. Lack of knowledge and low awareness (Revell
and Blackburn, 2007; Gadenne et al., 2009), particularly in developing countries (Bakos et al.,
2020), has been cited as a major hindrance to implementing sustainable practices by SMEs.
(vi) Owners’/managers’ educational qualification
Respondents have been asked to indicate the educational qualification of owners/managers. Based
on their responses, two groups have been formed – ‘graduate or below’ and ‘post-graduate or
above’. Table 17 shows the results of SEM multi-group analysis for the educational qualification
of owners/managers.
Table 17: SEM multi-group analysis results for the educational qualification of
owners/managers
Direction of Causality Standardized Path
Estimate Significant (S)/
Not Significant (NS) From To
Graduate or
below (79)
Post-
Graduate or
above (57)
LE_ME WC_EI 0.66 0.54 NS
LE_ME EF_WM 0.34 -- NS
LE_ME EN_BF 0.60 -- NS
LE_ME MK_EP 0.48 0.80 NS
WC_EI EF_WM -- 0.64 S
( = 3.90, = 1, p-value = 0.048)
WC_EI EN_BF -- 0.38 NS
WC_EI MK_EP -- -- --
EF_WM EN_BF -- -- --
EF_WM MK_EP -- -- --
EN_BF MK_EP 0.27 0.28 NS
Note: Figures within brackets for groups represent sample sizes
2cD dfD

61
The difference between the two groups is statistically significant for the relationship between
WC_EI and EF_WM. While the relationship is not statistically significant for the group with
educational qualification: graduate or below, for the group with educational qualification: post-
graduate or above, there is a strong positive association between socially responsible HRM
practices and eco-friendly waste management practices. Although the difference between the two
groups is not statistically significant, the relationships between LE_ME and MK_EP, and also
between WC_EI and EN_BF, are stronger for the group with higher educational qualifications
than for the other group, indicating that the leadership abilities and ethical orientation of, and
socially responsible HRM practices by, SME owners/managers with higher educational
qualifications are possibly more strongly associated with improved firm performance, and
environmental benefits, respectively, than for owners/managers with lower educational
qualifications. However, although the difference between the two groups is not statistically
significant, LE_ME has stronger relationships with WC_EI, EF_WM and EN_BF for
owners/managers with lower educational qualifications than for owners/managers with higher
educational qualifications. In fact, for owners/managers with higher educational qualifications,
LE_ME has no significant relationships with EF_WM and EN_BF. This result points to the fact
that the leadership and ethical orientation of owners/managers with lower educational
qualifications may possibly be more strongly associated with sustainable waste management and
socially responsible HRM practices and environmental benefits than for owners/managers with
higher educational qualifications. This observation is in line with the comment made by Gadenne
et al. (2009), i.e. higher education has been shown to be associated with a higher level of
environmental concern, but not necessarily with environmental behaviour. In their study, Gadenne
et al. (2009) also do not find support for the propositions that firms with highly educated
owners/mangers are more likely to have positive environmental attitudes and a higher level of
environmental awareness.
(vii) Education level of employees
Respondents have been asked about the general education level of employees. Based on the
responses, two groups have been formed – ‘school level or below’ and ‘high school or above’.
Table 18 shows the results of SEM multi-group analysis for the two groups.
Table 18: SEM multi-group analysis results for the education level of employees

62
Direction of Causality Standardized Path Estimate Significant (S)/
Not Significant (NS) From To School level
or below (44)
High school
or above (92)
LE_ME WC_EI -- 0.76 NS
LE_ME EF_WM -- -- --
LE_ME EN_BF 0.34 0.27 S
( = 3.16, = 1, p-value = 0.076)
LE_ME MK_EP 0.47 0.54 NS
WC_EI EF_WM -- 0.66 S
( = 12.85, = 1, p-value = 0.000)
WC_EI EN_BF -0.22 0.51 S
( = 9.56, = 1, p-value = 0.002)
WC_EI MK_EP -0.29 -- NS
EF_WM EN_BF -0.33 -- S
( = 4.47, = 1, p-value = 0.034)
EF_WM MK_EP -- -- --
EN_BF MK_EP -- 0.43 S
( = 9.75, = 1, p-value = 0.002)
Note: Figures within brackets for groups represent sample sizes
It is observed that simultaneously constraining all the path estimates of the corresponding
structural relationships to be equal, as per H1-H10, results in a significantly worse fit with
=33.182, =10 and p-value = 0.000, vis-à-vis the unconstrained model, which means the
education level of employees has a significant moderating effect on the overall structural model.
It is observed that the education level of employees has a significant moderating effect on the
structural relationships. The higher the education level of employees, the stronger the relationships
owners’/managers’ leadership abilities and ethical orientation share with socially responsible
HRM practices and firm performance, socially responsible HRM practices share with
environment-friendly waste management practices and environmental benefits, and environmental
benefits share with firm performance realized by SMEs due to adoption of sustainable business
practices. As observed in Table 18, the maximum number of significant multi-group differences
is realized for the education level of employees among all the moderating variables under
2cD dfD
2cD dfD
2cD dfD
2cD dfD
2cD dfD
2cD
dfD

63
consideration, indicating that the general education level of employees may have a significant
influence on SMEs’ adoption of sustainable environmental and social practices and their impact
on firms’ financial/non-financial performance. Bakos et al. (2020) and Dey et al. (2020) also
mention the lack of educated workers and qualified professionals as one of the major barriers to
implementation of sustainable practices in SMEs.
Discussion of results
The present study finds a strong association between the leadership and ethical orientation of
owners/managers and employees, environmental and social practices, environmental benefits and
firms’ financial and non-financial performance. In the context of Indian manufacturing SMEs,
Gandhi et al. (2018) note that strong leadership, as part of top management commitment, outranks
all other drivers of sustainability. The authors also note that strong leadership ensures effective
skill development and knowledge enhancement among employees, which facilitates the
implementation of sustainable business practices and improves firm performance.
The study does not find any significant influence of external drivers on either sustainable business
practices or firm performance. Table 1 also reveals low item means for the external drivers of
sustainability. In fact, for Factor 1: Customer Pressure and Industry Facilitation and Factor 3:
Customer Facilitation, the corresponding item means are among the lowest. This is consistent with
the observation of Revell and Blackburn (2007), who cite the lack of customer and supply chain
pressure and awareness of regulations as a major cause for low adoption of environmental practices
among SMEs. Nulkar (2014) notes that in developing countries like India, enforcement of
regulations is generally inconsistent, making it easy for some firms to evade compliance. Roxas
and Coetzer (2012) find that the regulatory dimension of the institutional environment has the least
impact on owners’/managers’ attitudes towards the natural environment. Lewis et al. (2015),
quoting from the extant literature, comment that external pressure is rarely reported by SMEs as
having any influence on their environmental practices, and the lack of pressure may be traced to
the lack of visibility of small firms in comparison to large firms. Ashton et al. (2017) note that
SMEs are motivated to adopt green business practices more by internal factors than by external
pressures from the government and customers. Table 2 also shows that all the item means for the
internal drivers of sustainability are above 4 and much higher than the item means for the external
drivers of sustainability, as shown in Table 1. In a study on Indian manufacturing SMEs, Gandhi

64
et al. (2018) find that public pressure in the form of pressures from local communities, local
administration, NGOs and media is ranked very low in a list of drivers of sustainability, the
possible reason being that in emerging countries like India, there is a lack of awareness and
understanding about the importance of green products and processes, the authors note. Bakos et
al. (2020) also note that regulations in transitional/developing economies are not as stringent as in
developed economies. Further, Boakye et al. (2020) find that there is no significant relationship
between compliance with regulations and financial performance for UK-based SMEs.
Dey et al. (2020) note that waste management practices may enhance SMEs’ environmental, social
and economic performance. However, this study does not reveal any relationship between waste
management practices and environmental/social benefits and firm performance. Gadenne et al.
(2009) note that SMEs may be expected to reduce waste although there might not be an economic
return to their businesses. SME owners/managers may voluntarily adopt environment-friendly
practices because of their beliefs, attitudes and ethical orientation without giving due consideration
to financial implications. In a study of UK SMEs, Dey et al. (2020) do not find any significant
relationship between waste management practices and environmental performance. In a study of
French SMEs, Courrent et al. (2018) do not find any significant relationship between
environmental practices and firms’ financial and non-financial performance. In a study of
Australian SMEs, Torugsa et al. (2013) also do not find any positive association between the
environmental dimension of proactive CSR strategies and financial performance. The reason may
be that for Indian manufacturing SMEs, investments made in waste management practices may
not commensurately enhance firms’ environmental benefits/financial performance. In fact, as
noted in the multi-group analysis, for some of the groups (e.g. when firms are professionally-
managed rather than family-managed, firms are ISO 9000-certified and the education level of
employees is school level or below), waste management practices have adversely impacted firms’
environmental benefits.
The study does not find a direct relationship between socially responsible HRM practices and
firms’ financial and non-financial performance; however, it is observed that the relationship
between firms’ employee-related social sustainability practices and performance is fully mediated
by the environmental benefits realized by firms as a result of their adoption of environmental
management practices. This result supports the observation of Wu et al. (2015) that the extant

65
literature finds a positive relationship between firms’ sustainable business practices and financial
performance mediated by environmental and social performance. This result is also consistent with
the observation of Dey et al. (2020) that very few researchers find direct relationships between
socially responsible practices and firm performance (e.g. Courrent et al. (2018) find a significantly
positive relationship between SMEs’ social practices in the workplace and their financial and non-
financial performance). However, it is also noted that environment-friendly SMEs have satisfied
employees with higher environmental/economic performance. Torugsa et al. (2013) also do not
find support for the hypothesis that social sustainability practices are positively associated with
SME financial performance. However, the authors do find support for the hypothesis that the
interaction effect of all the three dimensions – economic, environmental and social – of
sustainability is positively associated with financial performance. The authors comment that SMEs
with a limited availability of resources may not wish to invest heavily in environmental and social
sustainability practices if the gap between investments and financial returns is significant,
especially in the short term. However, the positive effect of the interaction of the dimensions of
sustainability on financial performance shows that SMEs need to identify and adopt the
sustainability practices for which they are best equipped.
The study also does not find relationships among the leadership and ethical orientation of
owners/managers, firms’ community-related social sustainability practices and financial and non-
financial performance. Gadenne et al. (2009) do not find support for the proposition that
owners’/managers’ environmental attitudes are positively associated with community-related
environmental support practices. Courrent et al. (2018) also do not find a significant relationship
between SMEs’ social practices in the community and firms’ financial and non-financial
performance, probably because investments in local communities do not translate into firms’
financial performance and competitiveness, at least in the short term. It is to be seen whether these
investments bear fruit in the long term, through a longitudinal study. Bartolacci et al. (2020) also
note that while firms’ sustainable management practices towards employees may have a positive
impact on firm performance, the same may be true for community practices only to a lesser extent.

66
Managerial implications
In this section, the implications of this research for Indian manufacturing SMEs,
government/regulatory authorities and industry associations/chambers of commerce are presented.
Implications for Indian manufacturing SMEs
The survey reveals that only about 33% and 5% of the respondents are ISO 9000 and ISO 14000-
certified, respectively, and about 10% of them have implemented an EMS. As evidenced from the
extant literature, the level of adoption of ISO 9000 and ISO 14000 certifications and
implementation of an EMS in Indian SMEs is extremely low compared to large companies in India
(See, for example, Mitra and Datta, 2014) and SMEs in developed countries. Although the current
study does not find any association between ISO 9000 certifications and SMEs’ adoption of
sustainable practices and the consequent impact on firm performance, Dey et al. (2020) note that
ISO 9000 certifications may help in achieving environmental sustainability. Since quality control
and pollution prevention and control are interlinked (zero defect ≡ zero waste), and quality control
tools are equally applicable to pollution prevention and control (Porter and van der Linde, 1995;
Corbett and Klassen, 2006), Indian SMEs must proactively embrace ISO 9000 and ISO 14000
certifications. This is particularly relevant in the context of the GoI’s ‘make in India’ initiative
with ‘zero defect and zero effect’, which means better quality products with lower environmental
pollution. Some of the respondents have also highlighted the pollution factor and emphasized that
the environmental issues should be given due consideration.
The survey data show that currently Indian manufacturing SMEs pay minimal attention to supplier
collaboration for sustainable procurement, and environment-friendly energy/resource
consumption, manufacturing processes, packaging, transportation and office practices. As Table 3
shows, the means of the items related to Factor 2: Sustainable Procurement, Factor 3: Supplier
Collaboration, Incentive and Training Programme, Factor 4: Sustainable Energy and Resource
Consumption and Factor 5: Process Efficiency and Environmental Policy, are all below 4.
Similarly, Table 4 shows that all the item means related to Factor 3: Economic Packaging and
Transportation, Factor 4: Water and Energy Efficiency in Office and Factor 5: Environment-
friendly Transportation, are below 4. Further, none of the factors appears in the structural model.

67
In order to ensure environmental sustainability, SMEs need to focus more on supplier collaboration
and environment-friendly manufacturing, logistics and office practices.
Indian manufacturing SMEs are also not very active in serving the local community. As shown in
Table 5, all items related to Factor 2: Services rendered to Local Community and Factor 4: Local
Community Development have means less than 4. Although investments in the local community
may not bring in immediate financial gains, they are expected to enhance the image and reputation
of firms, build a strong leadership and competitive position for them, and thereby ensure a better
financial performance in the long term. Therefore, expenses incurred in community projects must
be viewed by SMEs as investments, not as costs, with a long-term view.
The results of SEM multi-group analysis in Table 18 show that the education level of employees
has a strong positive association among the leadership and ethical orientation of owners/managers
and employees, firms’ adoption of sustainable environmental and social practices, environmental
benefits realized by firms and firms’ financial/non-financial performance. Therefore, firms should
give due importance to employee selection, satisfaction and retention. As already discussed, and
also evidenced in the extant literature, better talent acquisition, employee satisfaction, loyalty and
retention have a significant effect on firms’ adoption of sustainable practices, and their competitive
positioning and financial performance.
From the survey data, it has been observed that 97, i.e. 71.32%, of the respondents have rated their
networking/alliances with industry associations/peers as ‘low-to-moderate’. Since networking and
forming alliances with industry associations and peers help generate awareness of regulatory and
sustainability issues, and share knowledge and resources, SMEs must join associations and form
alliances with their peers in industry.
Implications for government/regulatory authorities
Environmental regulations are poorly developed, especially for SMEs, in developing countries.
Lee and Klassen (2008) note that SMEs are rarely subjected to the intense scrutiny that large
companies face from governments and environmental activists. The present study also does not
find any role of regulations and government interventions in the relationship between sustainable
business practices and firm performance. Gadenne et al. (2009) note that owners/managers of
SMEs have poor knowledge of environmental legislations and standards, and this may explain the

68
low level of environmental management practices in SMEs. Table 16 shows that 80, i.e. 58.82%,
of the respondents have low-to-moderate awareness of regulatory and sustainability issues. Also,
Item 7(e): Awareness/training programmes organized by govt. in Table 1, having a mean below
4, reveals that there is a lack in awareness of regulations among SMEs and training programmes
organized by the government. Regulations/training programmes organized by the government may
raise awareness and provide SMEs with a clear guideline for implementation of environmental
practices. This is important since the results of SEM multi-group analysis in Table 16 indicate that
SMEs with high awareness of regulatory and sustainability issues are in a better position than their
counterparts with low-to-moderate awareness in terms of translating socially responsible HRM
practices into eco-friendly waste management practices, environmental benefits and firm
performance. Johnson and Schaltegger (2016) note that on the one hand, SMEs face little
regulatory pressure, on the other, environmental and social sustainability tools that have been
developed keeping mainly large companies in mind, are not relevant for SMEs. The authors
suggest that these sustainability tools must be simple, user-friendly, cost-effective, flexible and
customizable for SMEs to understand, accept and operationalize. This is particularly relevant in
the context of the response received from some of the respondents that government rules and
regulations should be made simpler and should not be revised frequently. As far as taxation is
concerned, India came under the goods and services tax (GST) from July 1, 2017. While most of
the respondents have appreciated the introduction of GST in terms of getting payments in time,
reducing volumes of bad debts, etc., some of them have also mentioned problems such as high
GST rates, lengthy paperwork, increasing manufacturing costs, cash flow issues, lack of awareness
and adoption of GST among suppliers and customers, among others. The issues faced by SMEs
due to the introduction of GST may be looked into by the government.
Besides regulations, the government must also think of extending technical and financial support
in the form of subsidies, easy credit facilities, soft loans and tax exemptions to SMEs because
many SMEs lack adequate financial resources to effectively implement environmental
management practices (Gadenne et al., 2009; Fleiter et al., 2012; Nair and Sodhi, 2012; Ashton et
al., 2017; Bakos et al., 2020). That item 7(a): Govt. regulations/legislations and item 7(c):
Financial incentives provided by govt. (soft loan/tax exemption/subsidy) have the highest means,
4.07 and 4.11, respectively, as shown in Table 1, supports the role of the government in framing
regulations and providing financial assistance to SMEs. Some respondents have indeed mentioned

69
their expectation of financial support, soft loans and reduced interest rates on bank loans from the
government. On the other hand, item 7(d): Technical support/facilitation provided by govt. in
Table 1, with a mean below 4, indicates that the government needs to do more in terms of extending
technical support to SMEs. One of the respondents has highlighted the need for training and
introduction of modern technologies to help set up more manufacturing SMEs, reduce dependence
on imports and make the GoI’s ‘make in India’ initiative a reality.
In addition, the government might exert an indirect pressure on SMEs by imposing stringent
environmental and social regulations on large companies, who would in turn put pressure on their
suppliers, many of which happen to be SMEs, to adopt sustainable business practices. Lee and
Klassen (2008) mention that buyer pressure may initiate and enable the improvement of SME
suppliers’ environmental capabilities. Nair and Sodhi (2012) note that currently customer/supply
chain pressure on SMEs is indeed low and increasing customer requirements in terms of
compliance with environmental and social norms is a positive way of promoting sustainability
among SMEs. Johnson and Schaltegger (2016) also note that many large companies have made a
precondition for their SME suppliers to adopt an EMS or conduct social audits for doing business.
Implications for industry associations/chambers of commerce
Industry associations and chambers of commerce have a role to play in organizing training
programmes for generation of awareness of sustainability among SMEs and helping them form
networks/alliances with their peers in industry for sharing of knowledge and resources. A below-
4 mean rating for item 7(p): Awareness and training programmes conducted by industry
associations/chambers of commerce, as shown in Table 1, indicates that currently the effort put in
by industry associations and chambers of commerce towards conducting training programmes and
generating awareness for SMEs is inadequate.
The literature is abuzz with the importance of training, networks and alliances. For example, in the
Indian context, Nulkar (2014) prescribes that industry associations and leading chambers of
commerce, such as Confederation of Indian Industry (CII) and Federation of Indian Chambers of
Commerce and Industry (FICCI), should step in to increase SME awareness, and provide them
with training and assistance in greening, which are otherwise not available to SMEs.

70
Lawrence et al. (2006) note that networks and alliances encourage organizational learning and
influence the adoption of sustainable environmental and social practices by SMEs. Lewis and
Cassells (2010) mention that inter-firm relationships and networks can play a key role in informing
and influencing SMEs to be more active in terms of implementing environmental practices. Nair
and Sodhi (2012) also mention that SMEs should exploit networking opportunities to access new
information.
Network membership is positively associated with adopting sustainably-oriented practices and
inter-firm collaboration is an enabler of environmentally responsible behaviour in small firms.
Collaborative and cooperative relationships help SMEs overcome some of the barriers to
implementing environmental management practices and simplify the implementation process
(Lewis et al., 2015; Johnson and Schaltegger, 2016). Chen et al. (2017) also note that inter-firm
alliances develop new competencies and promote future growth in SMEs.
Active participation in networks and involvement in strategic alliances help SMEs acquire and
share knowledge on sustainability (Johnson and Schaltegger, 2016; Johnson, 2017). Also, peer
learning via industry associations appears to be effective in helping SMEs adopt environment-
friendly practices (Ashton et al., 2017).
As already mentioned, given that 71.32% of the respondents have indicated a low-to-moderate
level of networking/alliances with industry associations/peers, there is a lot that industry
associations and chambers of commerce can do to organize training programmes for SMEs to raise
their awareness of regulatory and sustainability issues and facilitate forming networks/alliances
with their peers in industry for sharing of knowledge and resources.
Conclusions and directions for future research
In this paper, an exploratory study of Indian manufacturing SMEs has been conducted in terms of
the causal relationships among the drivers of sustainability, sustainable business practices and firm
performance. Majority of the extant literature on sustainability in SMEs consider only the
economic and environmental dimensions of sustainability while this paper considers all the three
dimensions – economic, environmental and social – of sustainability. Also, most of the literatures
explore the causal relationships either between the drivers of sustainability and sustainable
business practices or between sustainable business practices and firms’ financial/non-financial

71
performance. This paper takes an integrative view, and simultaneously explores the causal
relationships among the drivers of sustainability, sustainable environmental and social practices
and firms’ financial/non-financial performance. Research on sustainability in Indian SMEs has
been few and far between. A scale, relevant to the Indian context, has been developed in this paper,
which can be used for future research on Indian SMEs. Results indicate that the leadership and
ethical orientation of owners/managers and employees has a strong positive association with
sustainable waste management and HRM practices, environmental benefits realized by firms due
to adoption of sustainable practices, and firms’ financial/non-financial performance. While no
association has been found between sustainable waste management practices and environmental
benefits or firm performance, a strong positive association has been found between socially
sustainable HRM practices and eco-friendly waste management. Although no direct relationship
has been found between socially sustainable HRM practices and firm performance, an indirect
relationship has been found between them through the mediating role of environmental benefits.
The role of moderating variables in the causal relationships has also been explored and SEM multi-
group analyses, based on the moderating variables, have been conducted. Managerial implications
have been drawn for SMEs, government/regulatory authorities and industry associations/chambers
of commerce, which are expected to provide a guideline for removing the roadblocks and facilitate
adoption of sustainable environmental and social practices to a greater extent by Indian
manufacturing SMEs.
As far as the directions of future research are concerned, a longitudinal study (Leonidou et al.,
2017; Chasse and Courrent, 2018), using the scale developed in this paper, may be an opportunity
that can be explored, especially in view of the new definition of MSME coming into effect since
July, 2020. The present cross-sectional study had been conducted before COVID-19 set in.
Therefore, exploring whether there is a change in the measurement and structural models post
COVID-19 can be an interesting direction for future research. Locations of SMEs for this study
have been limited to a few Indian states, as mentioned before, based on the prevalence of SMEs
and SME clusters, which is akin to convenience sampling. Future studies may be more broad-
based and may cover pan-India with a much larger sample size for generalizability of results. Also,
the survey instrument may be administered to SMEs in other developed and developing countries
and the results compared for identifying the similarities and differences for SMEs belonging to
different countries (Courrent et al., 2018). The results of the study are based on responses and

72
interviews of the survey participants. A triangulation method involving multiple sources of
primary and secondary information and direct observations by researchers would address the social
desirability bias, if any, and provide more validity to the results (Roxas and Coetzer, 2012; Chasse
and Courrent, 2018).
The study has focused on five sectors of manufacturing, namely food and beverages, textile,
engineering, leather and chemicals. Nulkar (2014) notes that Indian SMEs are highly
heterogeneous, and hence it is impossible to generalize the results of a study. Bakos et al. (2020)
also note that so far, most of the studies have been generic in nature that hardly can be generalized.
Sector-specific studies (Bakos et al., 2020) will provide additional insights and highlight inter-
sectoral differences in adoption of sustainable practices and their impact on firm performance.
Therefore, more sector-specific studies, e.g. for the service sector (Prashar and Sunder, 2020), or
within the manufacturing sector, more industry-specific studies may be conducted in future
research.
Further, the same instrument may be administered to large companies and the results compared
with those of the present study, which will indicate the similarities and differences across
companies of all sizes and may highlight the learning for SMEs with a view to effectively
incorporating sustainable operations and practices in their businesses. Gleaning insights from
comparative studies into the fundamentals of sustainability and how the roadblocks can be
overcome for an effective implementation of sustainable business practices in SMEs would be an
interesting direction for future research.
Acknowledgement
The author thankfully acknowledges the research grant (Work Order No. 3770/RP: DSSBPIFP:
AESIMSME) received from Indian Institute of management Calcutta for the project.

73
References
1. Aghelie, A. (2017), “Exploring Drivers and Barriers to Sustainability Green Business Practices
within Small and Medium Sized Enterprises: Primary Findings”, International Journal of
Business and Economic Development, Vol. 5, No. 1, pp. 41-48.
2. Ajzen, I. (1991), “The Theory of Planned Behavior”, Organizational Behavior and Human
Decision Processes, Vol. 50, pp. 179-211.
3. Aragon-Correa, J.A., Hurtado-Torres, N., Sharma, S. and Garcia-Morales, J.V. (2008),
“Environmental Strategy and Performance in Small Firms: A Resource-Based Perspective”,
Journal of Environmental Management, Vol. 86, No. 1, pp. 88-103.
4. Ashton, W., Russell, S. and Futch, E. (2017), “The Adoption of Green Business Practices
among Small US Midwestern Manufacturing Enterprises”, Journal of Environmental Planning
and Management, Vol. 60, Iss. 12, pp. 2133-2149.
5. Bakos, J., Siu, M., Orengo, A. and Kasiri, N. (2020), “An Analysis of Environmental
Sustainability in Small & Medium-Sized Enterprises: Patterns and Trends”, Business Strategy
and the Environment, Vol. 29, pp. 1285-1296.
6. Barney, J. (1991), “Firm Resources and Sustained Competitive Advantage”, Journal of
Management, Vol. 17, pp. 99-120.
7. Bartolacci, F., Caputo, A. and Soverchia, M. (2020), “Sustainability and Financial
Performance of Small and Medium Sized Enterprises: A Bibliometric and Systematic
Literature Review”, Business Strategy and the Environment, Vol. 29, pp. 1297-1309.
8. Becherer, R.C. and Helms, M.M. (2014), “Green Goals in Organizations: Do Small Businesses
Engage in Environmentally Friendly Strategies?”, Journal of Small Business Strategy, Vol. 24,
No. 1, pp. 1-18.
9. Berrone, P., Cruz, C., Gomez-Mejia, L.R. and Larraza-Kintana, M. (2010), “Socioemotional
Wealth and Corporate Responses to Institutional Pressures: Do Family-Controlled Firms
Pollute Less?”, Administrative Science Quarterly, Vol. 55, Iss. 1, pp. 82-113.
10. Boakye, D.J., Tlngbani, I., Ahinful, G., Damoah, I. and Tauringana, V. (2020), “Sustainable
Environmental Practices and Financial Performance: Evidence from Listed Small and
Medium-Sized Enterprise in the United Kingdom”, Business Strategy and the Environment,
Vol. 29, pp. 2583-2602.

74
11. Caldera, H.T.S., Desha, C. and Dawes, L. (2018), “Exploring the Characteristics of Sustainable
Business Practice in Small and Medium-Sized Enterprises: Experiences from the Australian
Manufacturing Industry”, Journal of Cleaner Production, Vol. 177, pp. 338-349.
12. Chasse, S. and Courrent, J-M. (2018), “Linking Owner-Managers’ Personal Sustainability
Behaviours and Corporate Practices in SMEs: The Moderating Roles of Perceived Advantages
and Environmental Hostility”, Business Ethics: A European Review, Vol. 27, pp. 127-143.
13. Chen, L., Xu, J. and Zhou, Y. (2017), “Regulating the Environmental Behaviour of
Manufacturing SMEs: Inter-firm Alliance as a Facilitator”, Journal of Cleaner Production,
Vol. 165, pp. 393-404.
14. Corbett, C.J. and Klassen, R.D. (2006), “Extending the Horizons: Environmental Excellence
as Key to Improving Operations”, Manufacturing & Service Operations Management, Vol. 8,
No. 1, pp. 5-22.
15. Cordano, M., Marshall, R.S. and Silverman, M. (2010), “How do Small and Medium
Enterprises Go ‘Green’? A Study of Environmental Management Programs in the U.S. Wine
Industry”, Journal of Business Ethics, Vol. 92, pp. 463-478.
16. Courrent, J-M., Chasse, S. and Omri, W. (2018), “Do Entrepreneurial SMEs Perform Better
Because They are More Responsible?”, Journal of Business Ethics, Vol. 153, pp. 317-336.
17. Dekker, J. and Hasso, T. (2016), “Environmental Performance Focus in Private Family Firms:
The Role of Social Embeddedness”, Journal of Business Ethics, Vol. 136, pp. 293-309.
18. Dey, P.K., Malesios, C., De, D., Budhwar, P., Chowdhury, S. and Cheffi, W. (2020), “Circular
Economy to Enhance Sustainability of Small and Medium-Sized Enterprises”, Business
Strategy and the Environment, Vol. 29, pp. 2145-2169.
19. Eweje, G. (2020), “Proactive Environmental and Social Strategies in a Small-to-Medium-
Sized Company: A Case Study of a Japanese SME”, Business Strategy and the Environment,
Vol. 29, pp. 2927-2938.
20. Fernandez, J.L. and Camacho, J. (2016), “Effective Elements to Establish an Ethical
Infrastructure: An Exploratory Study of SMEs in the Madrid Region”, Journal of Business
Ethics, Vol. 138, pp. 113-131.
21. Finkelstein, S. and Peteraf, M.A. (2007), “Managerial Activities: A Missing Link in
Managerial Discretion Theory”, Strategic Organization, Vol. 5, No. 3, pp. 237-248.

75
22. Fleiter, T., Schleich, J. and Ravivanpong, P. (2012), “Adoption of Energy-Efficiency Measures
in SMEs – An Empirical Analysis based on Energy Audit Data from Germany”, Energy Policy,
Vol. 51, pp. 863-875.
23. Freeman, E.R. (1984), “Strategic Management: A Stakeholder Approach”, Pitman/Ballinger:
Boston, MA.
24. Gadenne, D.L., Kennedy, J. and McKeiver, C. (2009), “An Empirical Study of Environmental
Awareness and Practices in SMEs”, Journal of Business Ethics, Vol. 84, pp. 45-63.
25. Gandhi, N.S., Thanki, S.J. and Thakkar, J.J. (2018), “Ranking of Drivers for Integrated Lean-
Green Manufacturing for Indian Manufacturing SMEs”, Journal of Cleaner Production, Vol.
171, pp. 675-689.
26. Hair Jr., J.F., Black, W.C., Babin, B.J., Anderson, R.E. and Tatham, R.L. (2007), “Multivariate
Data Analysis”, 6th Ed., Pearson Education: New Delhi.
27. Hart, S.L. (1995), “A Natural-Resource-Based View of the Firm”, The Academy of
Management Review, Vol. 20, No. 4, pp. 986-1014.
28. Hu, Q., Mason, R., Williams, S.J. and Found, P. (2015), “Lean Implementation within SMEs:
A Literature Review”, Journal of Manufacturing Technology Management, Vol. 26, No. 7, pp.
980-1012.
29. Hussey, D.M. and Eagan, P.D. (2007), “Using Structural Equation Modelling to Test
Environmental Performance in Small and Medium-Sized Manufacturers: Can SEM help
SMEs?”, Journal of Cleaner Production, Vol. 15, pp. 303-312.
30. Johnson, M.P. (2017), “Knowledge Acquisition and Development in Sustainability-Oriented
Small and Medium-Sized Enterprises: Exploring the Practices, Capabilities and Cooperation”,
Journal of Cleaner Production, Vol. 142, pp. 3769-3781.
31. Johnson, M.P. and Schaltegger, S. (2016), “Two Decades of Sustainability Management Tools
for SMEs: How Far Have We Come?”, Journal of Small Business Management, Vol. 54, No.
2, pp. 481-505.
32. Jones, J. and de Zubielqui, G.C. (2017), “Doing Well by Doing Good: A Study of University-
Industry Interactions, Innovativeness and Firm Performance in Sustainability-Oriented
Australian SMEs”, Technological Forecasting and Social Change, Vol. 123, pp. 262-270.
76
33. Lawrence, S.R., Collins, E., Pavlovich, K. and Arunachalam, M. (2006), “Sustainability
Practices of SMEs: The Case of NZ”, Business Strategy and the Environment, Vol. 15, 242-
257.
34. Lee, S-Y. and Klassen, R.D. (2008), “Drivers and Enablers that Foster Environmental
Management Capabilities in Small- and Medium-Sized Suppliers in Supply Chains”,
Production and Operations Management, Vol. 17, No. 6, pp. 573-586.
35. Leonidou, L.C., Christodoulides, P., Kyrgidou, L.P. and Palihawadana, D. (2017), “Internal
Drivers and Performance Consequences of Small Firm Green Business Strategy: The
Moderating Role of External Forces”, Journal of Business Ethics, Vol. 140, pp. 585-606.
36. Lewis, K. and Cassells, S. (2010), “Barriers and Drivers for Environmental Practice Uptake in
SMEs: A New Zealand Perspective”, International Journal of Business Studies, Vol. 18, No.
1, pp. 7-21.
37. Lewis, K.V., Cassells, S. and Roxas, H. (2015), “SMEs and the Potential for a Collaborative
Path to Environmental Responsibility”, Business Strategy and the Environment, Vol. 24, pp.
750-764.
38. Mitra, S. and Datta, P.P. (2014), “Adoption of Green Supply Chain Management Practices and
their Impact on Performance: An Exploratory Study of Indian Manufacturing Firms”,
International Journal of Production Research, Vol. 52, No. 7, pp. 2085-2107.
39. Mittal, V.K., Sangwan, K.S., Herrmann, C., Egede, P. and Wulbusch, C. (2012), “Drivers and
Barriers of Environmentally Conscious Manufacturing: A Comparative Study of Indian and
German Organizations”, In: Dornfeld, D. and Linke, B. (Eds.), Leveraging Technology for a
Sustainable World, Springer, Berlin, Heidelberg, pp. 97-102.
40. Nair, N.K. and Sodhi, J.S. (2012), “CSR Practices by SMEs in India: Lessons from Five Case
Studies”, The Indian Journal of Industrial Relations, Vol. 47, No. 4, pp. 583-597.
41. Nulkar, G. (2014), “Does Environmental Sustainability matter to Small and Medium
Enterprises? Empirical Evidence from India”, International Journal of Environmental Studies,
Vol. 71, Iss. 4, pp. 481-489.
42. Prashar, A. and Sunder, M.V. (2020), “A Bibliometric and Content Analysis of Sustainable
Development in Small and Medium-Sized Enterprises”, Journal of Cleaner Production, Vol.
245, pp. 1-19.

77
43. Porter, M. and van der Linde, C. (1995), “Green and Competitive”, Harvard Business Review,
September-October, pp. 120-134.
44. Revell, A. and Blackburn, R. (2007), “The Business Case for Sustainability? An Examination
of Small Firms in the UK’s Construction and Restaurant Sectors”, Business Strategy and the
Environment, Vol. 16, pp. 404-420.
45. Roxas, B. and Coetzer, A. (2012), “Institutional Environment, Managerial Attitudes and
Environmental Sustainability Orientation of Small Firms”, Journal of Business Ethics, Vol.
111, Iss. 4, pp. 461-476.
46. Sangwan, K.S. (2011), “Quantitative and Qualitative Benefits of Green Manufacturing: An
Empirical Study of Indian Small and Medium Enterprises”, In: Hesselbach, J. and Herrmann,
C. (Eds.), Glocalized Solutions for Sustainability in Manufacturing, Springer, Berlin,
Heidelberg, pp. 371-376.
47. Scott, R.W. (1995), Institutions and Organizations, Thousand Oaks, CA: Sage Publications.
48. Sendlhofer, T. (2020), “Decoupling from Moral Responsibility for CSR: Employees’
Visionary Procrastination at a SME”, Journal of Business Ethics, Vol. 167, pp. 361-378.
49. Sharma, P. and Sharma, S. (2011), “Drivers of Proactive Environmental Strategy in Family
Firms”, Business Ethics Quarterly, Vol. 21, Iss. 2, pp. 309-334.
50. Shrivastava, P. (1995), “The Role of Corporations in Achieving Ecological Sustainability”,
The Academy of Management Review, Vol. 20, No. 4, pp. 936-960.
51. Simpson, M., Taylor, N. and Barker, K. (2004), “Environmental Responsibility in SMEs: Does
it Deliver Competitive Advantage?”, Business Strategy and the Environment, Vol. 13, No. 3,
pp. 156-171.
52. Singh, M.P., Chakraborty, A., Roy, M. and Tripathi, A. (2021), “Developing SME
Sustainability Disclosure Index for Bombay Stock Exchange (BSE) Listed Manufacturing
SMEs in India”, Environment, Development and Sustainability, Vol. 23, pp. 399-422.
53. Singh, N., Jain, S. and Sharma, P. (2015), “Motivations for Implementing Environmental
Management Practices in Indian Industries”, Ecological Economics, Vol. 109, pp. 1-8.
54. Tan, H.X., Yeo, Z., Ng, R., Tjandra, T.B. and Song, B. (2015), “A Sustainability Indicator
Framework for Singapore Small and Medium-Sized Manufacturing Enterprises”, Procedia
CIRP, Vol. 29, pp. 132-137.

78
55. Torugsa, N.A., O’Donohue, W. and Hecker, R. (2012), “Capabilities, Proactive CSR and
Financial Performance in SMEs: Empirical Evidence from an Australian Manufacturing
Industry Sector”, Journal of Business Ethics, Vol. 109, pp. 483-500.
56. Torugsa, N.A., O’Donohue, W. and Hecker, R. (2013), “Proactive CSR: An Empirical
Analysis of the Role of its Economic, Social and Environmental Dimensions on the
Association between Capabilities and Performance”, Journal of Business Ethics, Vol. 115, pp.
383-402.
57. Thanki, S., Govindan, K. and Thakkar, J. (2016), “An Investigation on Lean-Green
Implementation Practices in Indian SMEs using Analytical Hierarchical Process (AHP)
Approach”, Journal of Cleaner Production, Vol. 135, pp. 284-298.
58. Uhlaner, L.M., Berent-Braun, M.M., Jeurissen, R.J.M. and de Wit, G. (2012), “Beyond Size:
Predicting Engagement in Environmental Management Practices of Dutch SMEs”, Journal of
Business Ethics, Vol. 109, pp. 411-429.
59. Viesi, D., Pozzar, F., Federici, A, Crema, L. and Mahbub, M.S. (2017), “Energy Efficiency
and Sustainability Assessment of about 500 Small and Medium-Sized Enterprises in Central
Europe Region”, Energy Policy, Vol. 105, pp. 363-374.
60. Williams, S. and Schaefer, A. (2013), “Small and Medium-Sized Enterprises and
Sustainability: Managers’ Values and Engagement with Environmental and Climate Change
Issues”, Business Strategy and the Environment, Vol. 22, pp. 173-186.
61. Witjes, S., Vermeulen, W.J.V. and Cramer, J.M. (2017), “Exploring Corporate Sustainability
Integration into Business Activities: Experiences from 18 Small and Medium Sized Enterprises
in the Netherlands”, Journal of Cleaner Production, Vol. 153, pp. 528-538.
62. Wu, L., Subramanian, N., Abdulrahman, M.D., Liu, C., Lai, K-H. and Pawar, K.S. (2015),
“The Impact of Integrated Practices of Lean, Green and Social Management Systems on Firm
Sustainability Performance – Evidence from Chinese Fashion Auto-Parts Suppliers”,
Sustainability, Vol. 7, pp. 3838-3858.

79
Appendix
Questionnaire for a survey of sustainable business practices in Indian manufacturing SMEs
Q.1-6 and Q.14-16 are open-ended questions that ask for demographic information about the firm and solicit
qualitative comments from the respondent.
Q.7-13 are structured questions that seek the respondent’s response on a 5-point Likert scale as follows:
1: Strongly disagree, 2: Disagree, 3: Neither agree nor disagree, 4: Agree, 5: Strongly agree
Following are the descriptions of the questions, Q7-13, and related items:
Q.7 We have adopted sustainable business practices due to the following external drivers:
(a) Govt. regulations/legislations
(b) Penalty/fines imposed by govt. for non-compliance
(c) Financial incentives provided by govt. (soft loan/tax exemption/subsidy)
(d) Technical support/facilitation provided by govt.
(e) Awareness/training programmes organized by govt.
(f) Pressure from NGOs, activists, community, public
(g) Pressure from customers to implement EMS /ISO 9000/ISO 14000
(h) Customers’ consideration of environmental/ social criteria for supplier selection
(i) Supplier environmental audit by customers
(j) Customer requirement of disclosure of material composition data for product(s)
(k) Financial incentive/preference given by customers
(l) Collaboration/joint R&D with customers
(m) Supplier training organized by customers
(n) Pressure from competitors/peers in industry
(o) Pressure of compliance with industry norms
(p) Awareness and training programmes conducted by industry associations/chambers of commerce
Q.8 We have adopted sustainable business practices due to the following internal drivers:
(a) Owners’/managers’ vision, values and beliefs
(b) Leadership abilities of owners/managers
(c) Ethical orientation of owners/managers
(d) Owners’/managers’ commitment to environmental/social responsibility
(e) Owners’/managers’ philanthropic activities

80
(f) Ethical orientation of company employees
(g) Motivation and commitment of employees
(h) Employee aspiration, pride and ownership
(i) Creativity exhibited by employees
(j) Volunteerism exhibited by employees
(k) Reduced energy consumption in operations
(l) Reduced cost of manufacturing/operations
(m) Improved quality of products and processes
(n) Increase in sales, revenue and profitability
(o) Improved brand image/reputation of company
(p) Improved/healthy relations with stakeholders
(q) Improved customer satisfaction/loyalty
(r) Improved employee satisfaction/loyalty
(s) Better talent attraction and retention
(t) Development of new products
(u) Development of innovation capability
(v) Access to new customers/new markets
Q.9 We engage in the following sustainable environmental practices with respect to procurement and product and
process design in our company:
(a) Encouraging suppliers to adopt sustainable practices
(b) Urging suppliers to adopt EMS/ISO 9000/ISO 14000
(c) Selecting suppliers based on sustainability criteria
(d) Auditing suppliers’ sustainability performance
(e) Asking suppliers to declare environmental impacts of supplied materials
(f) Financial incentive/preference given to suppliers meeting/exceeding sustainability criteria
(g) Collaboration with suppliers for product design
(h) Awareness and training programmes for suppliers
(i) Reducing material variety in design of products
(j) Eliminating hazardous materials in product design
(k) Using bio-degradable/recyclable materials in product design
(l) Modular product design for easy assembly/ disassembly/maintainability
(m) Using Design-for-Environment (DfE) tools for product design
(n) Life Cycle Analysis (LCA) for environmental impacts during and post products’ useful life
(o) Ensuring energy efficiency in process design
(p) Energy/environmental audit from time to time

81
(q) Using alternative/non-conventional energy sources
(r) Reducing resource consumption in manufacturing
(s) Practising lean manufacturing, Total Quality Management (TQM) and Just-in-Time (JIT)
(t) Reducing waste and spill-over in processes
(u) Having a formal environmental management policy
Q.10 We engage in the following sustainable environmental practices with respect to packaging, transportation,
waste management and office practices in our company:
(a) Using environment-friendly packaging materials
(b) Reducing the quantity of packaging materials
(c) Taking back and recycling packaging materials
(d) Ensuring economies of scale in transportation
(e) Using alternate modes (railways/waterways) of transportation
(f) Using alternate fuels (e.g. CNG) for transportation
(g) Optimizing distribution networks/vehicle routes
(h) Segregation of hazardous and non-hazardous waste before disposal
(i) Environmentally safe disposal of solid waste
(j) Treatment of effluents before discharging
(k) Separation of recyclable and non-recyclable materials from waste
(l) Reducing energy consumption in office (lighting, heating, cooling, ventilation)
(m) Reducing water consumption (potable/toilet)
(n) Recycling of used toilet water post treatment
(o) Installation of energy-/water-efficient equipment
(p) Using alternative/non-conventional energy sources
(q) Ensuring a safe and healthy working environment
(r) Periodic checking of internal air and water quality
(s) Periodic cleaning and solid waste management
(t) Recycling of paper/stationeries/office supplies
(u) Eco-friendly design and layout of office space
(v) Awareness and training of company employees
Q.11 We engage in the following sustainable social practices with respect to human resources and local community
development in our company:
(a) Ensuring a safe and healthy working condition
(b) Ensuring rights, dignity and equal opportunities
82
(c) Ensuring welfare of employees and their families
(d) Ensuring fair compensation/pay to employees
(e) Meeting training/development needs of employees
(f) Encouraging employees for participation/teamwork
(g) Encouraging employees for creativity/innovation
(h) Empowering employees for decision-making
(i) Motivating employees by job rotation
(j) Direct/indirect employment generation/earning opportunities for local community
(k) Training local people for alternative livelihoods
(l) Providing safe drinking water to local community
(m) Building infrastructure/roads for local community
(n) Building schools for education of local children
(o) Arranging for health check-up/medical facilities
(p) Improving sanitation facilities in local community
(q) Engaging in charitable activities in cash or kind
(r) Rendering voluntary services to local community
Q.12 By adopting sustainable business practices, our company has achieved the following environmental and
employee-related social benefits:
(a) Improved energy efficiency of operations
(b) Reduced material and water consumption
(c) Reduced emissions, effluents and wastes
(d) Reduced disposal and increased recycling
(e) Reduced penalty/fines for non-compliance
(f) Improved satisfaction/loyalty of employees
(g) Improved morale/motivation/commitment
(h) Higher employee productivity and quality
(i) Better talent acquisition and retention
Q.13 By adopting sustainable environmental and social practices, our company has achieved the following
economic and strategic benefits:
(a) Reduced cost of operations and products
(b) Improved product and process quality
(c) Improved efficiency and productivity
(d) Innovation in product and process design

83
(e) Increased sales volume and sales revenue
(f) Increased market share of products
(g) Increased organizational profits
(h) Increased organizational growth
(i) Increased competitive advantage
(j) Improved relationship with stakeholders
(k) Improved image/reputation/media coverage
(l) Improved customer satisfaction/loyalty
(m) Development of new products
(n) Access to new customers/new markets

84
Distributions of age, number of employees and annual sales of respondent firms
No. of
respondents
% of
respondents Max Min Average Std. Dev. Median
Firm age (Months)
<= 120 51 37.50
600 6 225.51 157.37 198
> 120, <= 240 32 23.53
> 240, <= 360 27 19.85
> 360, <= 480 17 12.50
> 480 9 6.62
Total 136 100
No. of employees
<= 10 28 20.60
800 2 74.49 133.10 27
> 10, <= 50 67 49.26
> 50, <= 100 19 13.97
> 100, <= 250 12 8.82
> 250 10 7.35
Total 136 100
Annual Sales (INR
Million)
<= 50 37 46.25
13,600 0.50 391.10 1,527.70 75
> 50, <= 250 22 27.50
> 250, <= 500 8 10.00
> 500, <= 750 7 8.75
> 750 6 7.50
Total 80 100