indiana college completion report - in.gov introduction 2015 indiana college completion report...
TRANSCRIPT
INDIANA College completion Report
2015
2015 Indiana College Completion Report
w
2015 Indiana College Completion Report
Introduction 2
Key Takeaways 3
Data-at-a-Glance - Four Year Colleges 5
Data-at-a-Glance - Two Year Colleges 6
Dashboard, Gaps & Trends - Four Year Colleges 7
Dashboard, Gaps & Trends - Two Year Colleges 9
Ball State University 11
Indiana State University 13
Indiana University - Bloomington 15
Indiana University - East 17
Indiana University - Kokomo 19
Indiana University - Northwest 21
Indiana University - Purdue University - Fort Wayne 23
Indiana University - Purdue University - Indianapolis 25
Indiana University - South Bend 27
Indiana University - Southeast 29
Purdue University - Calument 31
Purdue University - North Central 33
Purdue University - West Lafayette 35
University of Southern Indiana 37
Ivy Tech Community College 39
Vincennes University 41
Frequently Asked Questions 43
Appendix 45
Table of Contents
Table of Contents
w
introduction
2015 Indiana College Completion Report
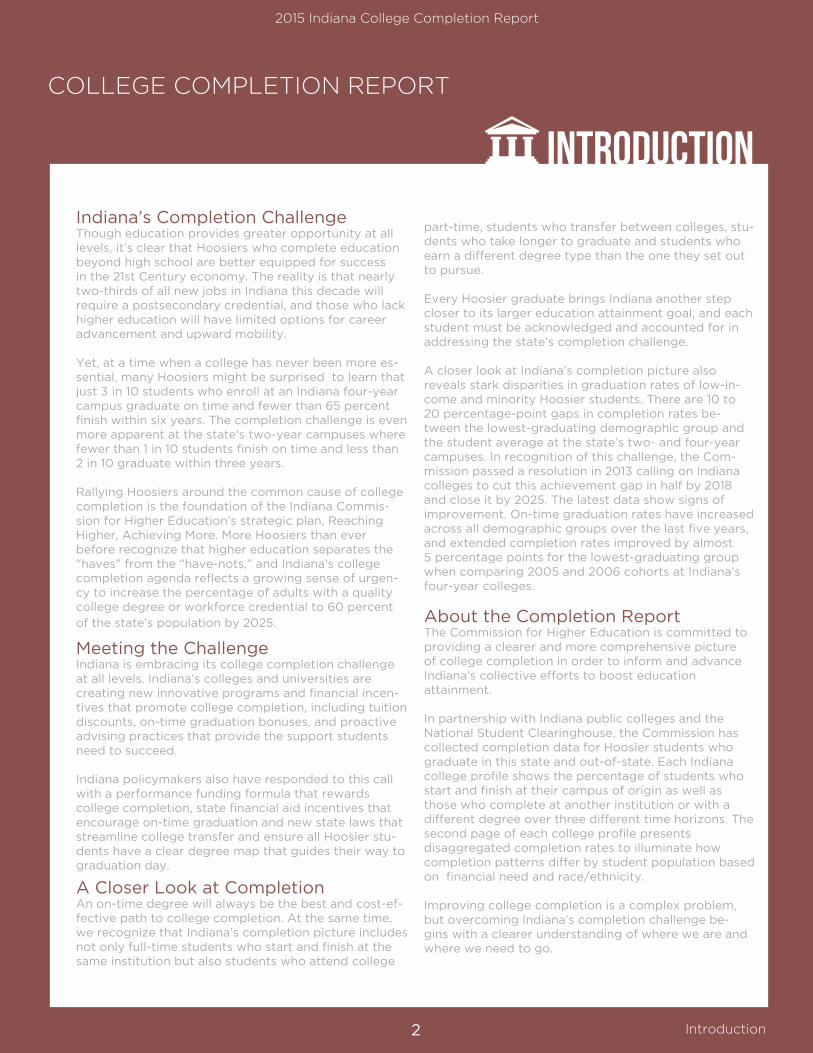
IntroductionIndiana’s Completion ChallengeThough education provides greater opportunity at all levels, it’s clear that Hoosiers who complete education beyond high school are better equipped for success in the 21st Century economy. The reality is that nearly two-thirds of all new jobs in Indiana this decade will require a postsecondary credential, and those who lack higher education will have limited options for career advancement and upward mobility.
Yet, at a time when a college has never been more es-sential, many Hoosiers might be surprised to learn that just 3 in 10 students who enroll at an Indiana four-year campus graduate on time and fewer than 65 percent finish within six years. The completion challenge is even more apparent at the state’s two-year campuses where fewer than 1 in 10 students finish on time and less than 2 in 10 graduate within three years.
Rallying Hoosiers around the common cause of college completion is the foundation of the Indiana Commis-sion for Higher Education’s strategic plan, Reaching Higher, Achieving More. More Hoosiers than ever before recognize that higher education separates the “haves” from the “have-nots,” and Indiana’s college completion agenda reflects a growing sense of urgen-cy to increase the percentage of adults with a quality college degree or workforce credential to 60 percent of the state’s population by 2025.
Meeting the ChallengeIndiana is embracing its college completion challenge at all levels. Indiana’s colleges and universities are creating new innovative programs and financial incen-tives that promote college completion, including tuition discounts, on-time graduation bonuses, and proactive advising practices that provide the support students need to succeed.
Indiana policymakers also have responded to this call with a performance funding formula that rewards college completion, state financial aid incentives that encourage on-time graduation and new state laws that streamline college transfer and ensure all Hoosier stu-dents have a clear degree map that guides their way to graduation day.
A Closer Look at CompletionAn on-time degree will always be the best and cost-ef-fective path to college completion. At the same time, we recognize that Indiana’s completion picture includes not only full-time students who start and finish at the same institution but also students who attend college
part-time, students who transfer between colleges, stu-dents who take longer to graduate and students who earn a different degree type than the one they set out to pursue.
Every Hoosier graduate brings Indiana another step closer to its larger education attainment goal, and each student must be acknowledged and accounted for in addressing the state’s completion challenge.
A closer look at Indiana’s completion picture also reveals stark disparities in graduation rates of low-in-come and minority Hoosier students. There are 10 to 20 percentage-point gaps in completion rates be-tween the lowest-graduating demographic group and the student average at the state’s two- and four-year campuses. In recognition of this challenge, the Com-mission passed a resolution in 2013 calling on Indiana colleges to cut this achievement gap in half by 2018 and close it by 2025. The latest data show signs of improvement. On-time graduation rates have increased across all demographic groups over the last five years, and extended completion rates improved by almost 5 percentage points for the lowest-graduating group when comparing 2005 and 2006 cohorts at Indiana’s four-year colleges.
About the Completion ReportThe Commission for Higher Education is committed to providing a clearer and more comprehensive picture of college completion in order to inform and advance Indiana’s collective efforts to boost education attainment.
In partnership with Indiana public colleges and the National Student Clearinghouse, the Commission has collected completion data for Hoosier students who graduate in this state and out-of-state. Each Indiana college profile shows the percentage of students who start and finish at their campus of origin as well as those who complete at another institution or with a different degree over three different time horizons. The second page of each college profile presents disaggregated completion rates to illuminate how completion patterns differ by student population based on financial need and race/ethnicity.
Improving college completion is a complex problem, but overcoming Indiana’s completion challenge be-gins with a clearer understanding of where we are and where we need to go.
Introduction
COLLEGE COMPLETION REPORT
2

Key Takeaways
2015 Indiana College Completion Report
Key Takeaways
The data show slight progress in on-time
graduation rates for students who completed
college within the last five years (2009-2014).
Four-year public colleges saw an increase of
approximately 7 percentage points, while
two-year campuses experienced a one
percentage point gain.
An additonal year of college can cost Hoosiers nearly $50,000 in extra tuition, lost wages and related costs.
2-Year4-Year
5.1%
5.0%
4.5%
3.8%
4.9%
5.9%
29.5%
31.5%
32.5%
34.4%
35.7% 36.2%
Completion rates represent first-time, full-time students seeking a bachelor’s (four-year colleges) or an associate or certificate (two-year colleges).
0%
5%
10%
15%
20%
25%
30%
35%
40%
201420132012201120102009
77%extended (3-6 years)
23%on-time (2 years)
Timeframe for Indiana Two-Year College Graduates (2008 Cohort)
51% on-time
(4 years)
49% extended
(5-8 years)
Timeframe for Indiana Four-Year College Graduates (2006 Cohort)
qMore Indiana college students are graduating on time…
wBut…on-time completion remains the exception in Indiana.
Half of Indiana four-year college students who complete a bachelor’s degree do so in 5-8 years.
Statewide, more than 75 percent of community college students who complete an associate degree do so in 3-6 years.
eTaking longer to complete means students pay more for their degrees… and it decreases their chances of graduating at all.
3
2015 Indiana College Completion Report
Key Takeaways
Key Takeaways
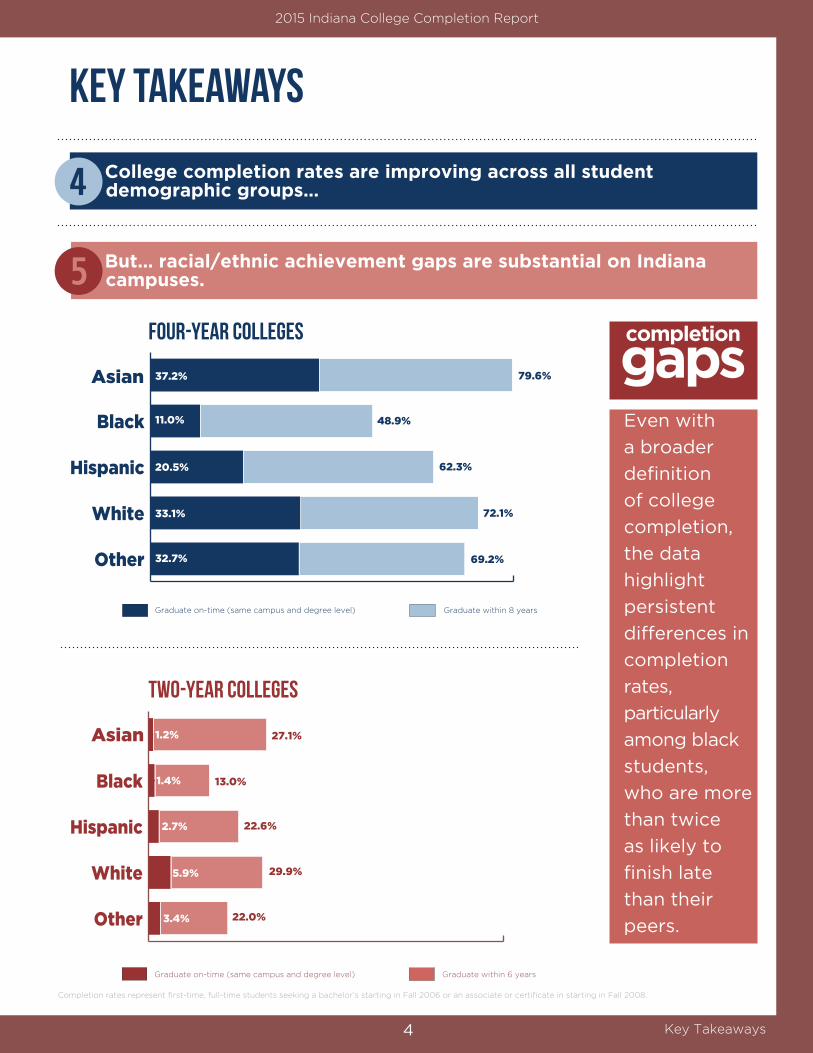
Even with
a broader
definition
of college
completion,
the data
highlight
persistent
differences in
completion
rates,
particularly
among black
students,
who are more
than twice
as likely to
finish late
than their
peers.
completion
gaps
Completion rates represent first-time, full-time students seeking a bachelor’s starting in Fall 2006 or an associate or certificate in starting in Fall 2008.
Other
White
Hispanic
Black
Asian 79.6%
48.9%
62.3%
72.1%
69.2%
37.2%
11.0%
20.5%
33.1%
32.7%
FOUR-year colleges
Graduate within 8 yearsGraduate on-time (same campus and degree level)
Other
White
Hispanic
Black
Asian 27.1%
13.0%
22.6%
29.9%
22.0%
1.2%
1.4%
2.7%
5.9%
3.4%
TWO-year colleges
Graduate on-time (same campus and degree level) Graduate within 6 years
rCollege completion rates are improving across all student demographic groups…
tBut… racial/ethnic achievement gaps are substantial on Indiana campuses.
4
PAG
E TI
TLE
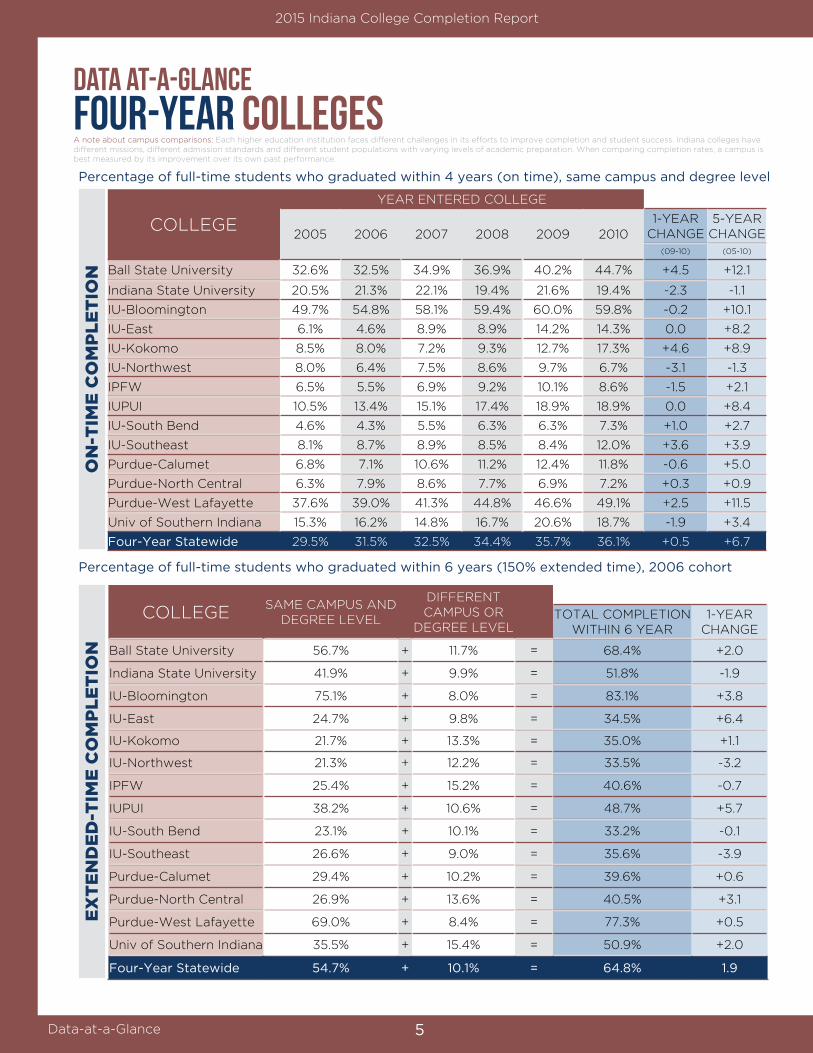
Data at-a-glance four-year CollegesPercentage of full-time students who graduated within 4 years (on time), same campus and degree level
Percentage of full-time students who graduated within 6 years (150% extended time), 2006 cohort
COLLEGE
YEAR ENTERED COLLEGE
2005 2006 2007 2008 2009 20101-YEAR
CHANGE5-YEAR
CHANGE(09-10) (05-10)
Ball State University 32.6% 32.5% 34.9% 36.9% 40.2% 44.7% +4.5 +12.1
Indiana State University 20.5% 21.3% 22.1% 19.4% 21.6% 19.4% -2.3 -1.1
IU-Bloomington 49.7% 54.8% 58.1% 59.4% 60.0% 59.8% -0.2 +10.1
IU-East 6.1% 4.6% 8.9% 8.9% 14.2% 14.3% 0.0 +8.2
IU-Kokomo 8.5% 8.0% 7.2% 9.3% 12.7% 17.3% +4.6 +8.9
IU-Northwest 8.0% 6.4% 7.5% 8.6% 9.7% 6.7% -3.1 -1.3
IPFW 6.5% 5.5% 6.9% 9.2% 10.1% 8.6% -1.5 +2.1
IUPUI 10.5% 13.4% 15.1% 17.4% 18.9% 18.9% 0.0 +8.4
IU-South Bend 4.6% 4.3% 5.5% 6.3% 6.3% 7.3% +1.0 +2.7
IU-Southeast 8.1% 8.7% 8.9% 8.5% 8.4% 12.0% +3.6 +3.9
Purdue-Calumet 6.8% 7.1% 10.6% 11.2% 12.4% 11.8% -0.6 +5.0
Purdue-North Central 6.3% 7.9% 8.6% 7.7% 6.9% 7.2% +0.3 +0.9
Purdue-West Lafayette 37.6% 39.0% 41.3% 44.8% 46.6% 49.1% +2.5 +11.5
Univ of Southern Indiana 15.3% 16.2% 14.8% 16.7% 20.6% 18.7% -1.9 +3.4
Four-Year Statewide 29.5% 31.5% 32.5% 34.4% 35.7% 36.1% +0.5 +6.7
COLLEGESAME CAMPUS AND
DEGREE LEVEL
DIFFERENT CAMPUS OR
DEGREE LEVELTOTAL COMPLETION
WITHIN 6 YEAR1-YEAR
CHANGE
Ball State University 56.7% + 11.7% = 68.4% +2.0
Indiana State University 41.9% + 9.9% = 51.8% -1.9
IU-Bloomington 75.1% + 8.0% = 83.1% +3.8
IU-East 24.7% + 9.8% = 34.5% +6.4
IU-Kokomo 21.7% + 13.3% = 35.0% +1.1
IU-Northwest 21.3% + 12.2% = 33.5% -3.2
IPFW 25.4% + 15.2% = 40.6% -0.7
IUPUI 38.2% + 10.6% = 48.7% +5.7
IU-South Bend 23.1% + 10.1% = 33.2% -0.1
IU-Southeast 26.6% + 9.0% = 35.6% -3.9
Purdue-Calumet 29.4% + 10.2% = 39.6% +0.6
Purdue-North Central 26.9% + 13.6% = 40.5% +3.1
Purdue-West Lafayette 69.0% + 8.4% = 77.3% +0.5
Univ of Southern Indiana 35.5% + 15.4% = 50.9% +2.0
Four-Year Statewide 54.7% + 10.1% = 64.8% 1.9
A note about campus comparisons: Each higher education institution faces different challenges in its efforts to improve completion and student success. Indiana colleges have different missions, different admission standards and different student populations with varying levels of academic preparation. When comparing completion rates, a campus is best measured by its improvement over its own past performance.
2015 Indiana College Completion Report
Data-at-a-Glance
ON
-TIM
E C
OM
PL
ET
ION
EX
TE
ND
ED
-TIM
E C
OM
PL
ET
ION
5

PAG
E TI
TLE
COLLEGE
YEAR ENTERED COLLEGE
2007 2008 2009 2010 2011 20121-YEAR
CHANGE5-YEAR
CHANGE(11-12) (07-12)
Ivy Tech System 3.8% 3.3% 3.6% 2.6% 3.1% 4.0% +0.9 +0.3
IVT-Bloomington 5.6% 3.5% 2.2% 1.6% 0.8% 2.5% +1.7 -3.1
IVT-Central Indiana 2.2% 1.8% 1.6% 2.6% 4.1% 3.6% -0.5 +1.5
IVT-Columbus 4.8% 6.5% 4.1% 3.1% 2.7% 3.4% +0.7 -1.4
IVT-East Central 4.5% 2.3% 3.6% 2.1% 1.4% 1.2% -0.3 -3.3
IVT-Kokomo 1.9% 6.2% 6.3% 2.4% 4.3% 1.3% -3.0 -0.6
IVT-Lafayette 4.5% 3.6% 2.1% 2.7% 5.3% 7.2% +1.9 +2.7
IVT-Northcentral 3.5% 2.2% 3.4% 3.6% 1.5% 1.6% +0.1 -1.9
IVT-Northeast 1.9% 1.6% 4.4% 2.6% 3.7% 3.9% +0.2 +2.0
IVT-Northwest 3.2% 2.6% 4.4% 2.3% 4.0% 10.0% +6.0 +6.8
IVT-Richmond 3.8% 8.4% 7.2% 4.4% 0.8% 1.5% +0.7 -2.3
IVT-South Central 5.0% 6.0% 5.9% 3.2% 2.8% 3.7% +0.9 -1.3
IVT-Southeast 4.0% 2.4% 7.3% 4.8% 4.4% 1.6% -2.8 -2.4
IVT-Southwest 5.0% 4.9% 2.9% 3.1% 3.5% 6.2% +2.7 +1.2
IVT-Wabash Valley 3.2% 3.7% 2.7% 1.3% 2.9% 2.0% -0.9 -1.2
Vincennes University 12.6% 13.3% 9.4% 9.9% 12.7% 15.6% +2.9 +3.0
Two-Year Statewide 5.1% 5.0% 4.5% 3.8% 4.9% 5.9% +1.0 +0.8
COLLEGESAME CAMPUS AND
DEGREE LEVEL
DIFFERENT CAMPUS OR
DEGREE LEVELTOTAL COMPLETION
WITHIN 3 YEARS1-YEAR
CHANGE
Ivy Tech System 10.0% + 2.7% = 12.7% -0.7
IVT-Bloomington 9.9% + 2.8% = 12.6% -1.3
IVT-Central Indiana 4.9% + 1.8% = 6.8% -0.3
IVT-Columbus 14.0% + 6.5% = 20.5% +5.8
IVT-East Central 8.1% + 2.8% = 10.9% -5.0
IVT-Kokomo 17.3% + 4.2% = 21.5% +9.5
IVT-Lafayette 10.6% + 4.9% = 15.5% -2.1
IVT-Northcentral 7.0% + 1.8% = 8.7% -2.2
IVT-Northeast 8.0% + 1.9% = 9.9% -2.8
IVT-Northwest 11.8% + 1.7% = 13.4% +1.9
IVT-Richmond 19.9% + 4.9% = 24.8% +2.9
IVT-South Central 17.5% + 2.2% = 19.7% -1.8
IVT-Southeast 15.2% + 3.0% = 18.2% +1.4
IVT-Southwest 12.5% + 2.5% = 14.9% -0.4
IVT-Wabash Valley 8.6% + 1.1% = 9.7% -2.3
Vincennes University 19.7% + 1.2% = 20.9% +0.6
Two-Year Statewide 11.6% + 2.5% = 14.1% -0.4
Data at-a-glance two-year collegesPercentage of full-time students who graduated within 2 years (on time), same campus and degree level
Percentage of full-time students who graduated within 3 years (150% extended time), 2008 cohort
2015 Indiana College Completion Report
Data-at-a-Glance
A note about campus comparisons: Each higher education institution faces different challenges in its efforts to improve completion and student success. Indiana colleges have different missions, different admission standards and different student populations with varying levels of academic preparation. When comparing completion rates, a campus is best measured by its improvement over its own past performance.
ON
-TIM
E C
OM
PL
ET
ION
EX
TE
ND
ED
-TIM
E C
OM
PL
ET
ION
6
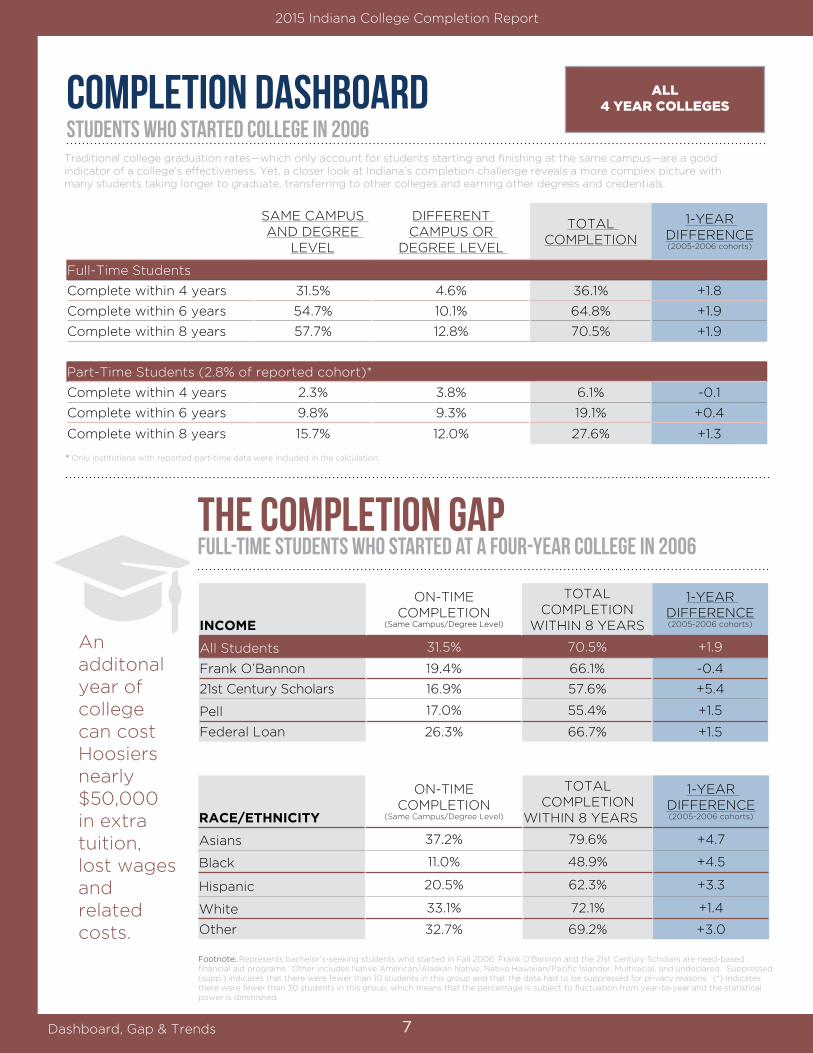
Completion dashboardStudents who started college in 2006
the completion gapfull-time Students who started at A Four-YEAR college in 2006
2015 Indiana College Completion Report
Dashboard, Gap & Trends
SAME CAMPUS AND DEGREE
LEVEL
DIFFERENT CAMPUS OR
DEGREE LEVEL
TOTAL COMPLETION
1-YEAR DIFFERENCE(2005-2006 cohorts)
Full-Time Students
Complete within 4 years 31.5% 4.6% 36.1% +1.8
Complete within 6 years 54.7% 10.1% 64.8% +1.9
Complete within 8 years 57.7% 12.8% 70.5% +1.9
Part-Time Students (2.8% of reported cohort)*
Complete within 4 years 2.3% 3.8% 6.1% -0.1
Complete within 6 years 9.8% 9.3% 19.1% +0.4
Complete within 8 years 15.7% 12.0% 27.6% +1.3
INCOME
ON-TIME COMPLETION
(Same Campus/Degree Level)
TOTAL COMPLETION
WITHIN 8 YEARS
1-YEAR DIFFERENCE(2005-2006 cohorts)
All Students 31.5% 70.5% +1.9
Frank O’Bannon 19.4% 66.1% -0.4
21st Century Scholars 16.9% 57.6% +5.4
Pell 17.0% 55.4% +1.5
Federal Loan 26.3% 66.7% +1.5
RACE/ETHNICITY
ON-TIMECOMPLETION
(Same Campus/Degree Level)
TOTAL COMPLETION
WITHIN 8 YEARS
1-YEAR DIFFERENCE(2005-2006 cohorts)
Asians 37.2% 79.6% +4.7
Black 11.0% 48.9% +4.5
Hispanic 20.5% 62.3% +3.3
White 33.1% 72.1% +1.4
Other 32.7% 69.2% +3.0
An additonal year of college can cost Hoosiers nearly $50,000 in extra tuition, lost wages and related costs.
ALL 4 YEAR COLLEGES
Footnote: Represents bachelor’s-seeking students who started in Fall 2006. Frank O’Bannon and the 21st Century Scholars are need-based financial aid programs. Other includes Native American/Alaskan Native, Native Hawaiian/Pacific Islander, Multiracial, and undeclared. Suppressed (supp.) indicates that there were fewer than 10 students in this group and that the data had to be suppressed for privacy reasons. (*) Indicates there were fewer than 30 students in this group, which means that the percentage is subject to fluctuation from year-to-year and the statistical power is diminished.
Traditional college graduation rates—which only account for students starting and finishing at the same campus—are a good indicator of a college’s effectiveness. Yet, a closer look at Indiana’s completion challenge reveals a more complex picture with many students taking longer to graduate, transferring to other colleges and earning other degrees and credentials.
* Only institutions with reported part-time data were included in the calculation.
7
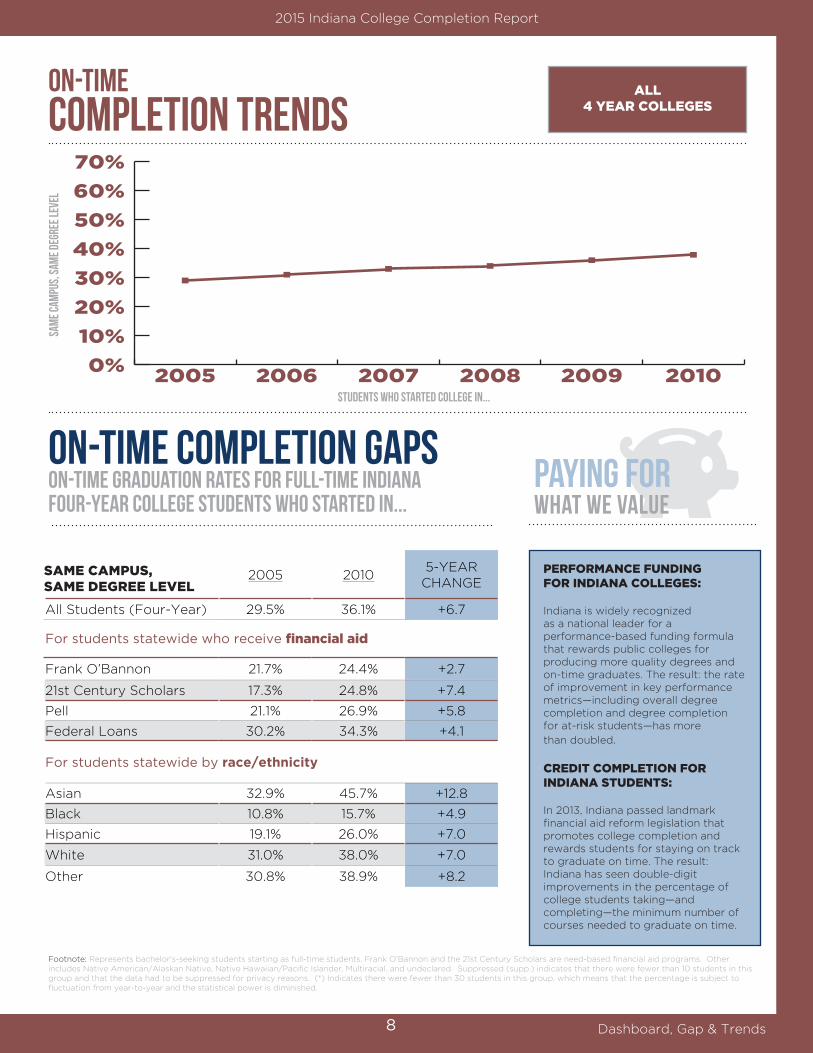
on-time Completion Trends
ON-TIME COMPLETION GAPSon-time graduation rates for full-time indianaFour-YEAR COLLEGE students who started in...
PAYING FOR WHAT WE VALUE
2015 Indiana College Completion Report
Dashboard, Gap & Trends
Students who started college in...
sam
e cam
pus,
sam
e deg
ree L
evel
2005 20105-YEAR
CHANGE
All Students (Four-Year) 29.5% 36.1% +6.7
For students statewide who receive financial aid
Frank O’Bannon 21.7% 24.4% +2.7
21st Century Scholars 17.3% 24.8% +7.4
Pell 21.1% 26.9% +5.8
Federal Loans 30.2% 34.3% +4.1
For students statewide by race/ethnicity
Asian 32.9% 45.7% +12.8
Black 10.8% 15.7% +4.9
Hispanic 19.1% 26.0% +7.0
White 31.0% 38.0% +7.0
Other 30.8% 38.9% +8.2
Footnote: Represents bachelor’s-seeking students starting as full-time students. Frank O’Bannon and the 21st Century Scholars are need-based financial aid programs. Other includes Native American/Alaskan Native, Native Hawaiian/Pacific Islander, Multiracial, and undeclared. Suppressed (supp.) indicates that there were fewer than 10 students in this group and that the data had to be suppressed for privacy reasons. (*) Indicates there were fewer than 30 students in this group, which means that the percentage is subject to fluctuation from year-to-year and the statistical power is diminished.
ALL 4 YEAR COLLEGES
PERFORMANCE FUNDING FOR INDIANA COLLEGES: Indiana is widely recognized as a national leader for a performance-based funding formula that rewards public colleges for producing more quality degrees and on-time graduates. The result: the rate of improvement in key performance metrics—including overall degree completion and degree completion for at-risk students—has more
than doubled. CREDIT COMPLETION FOR INDIANA STUDENTS: In 2013, Indiana passed landmark financial aid reform legislation that promotes college completion and rewards students for staying on track to graduate on time. The result: Indiana has seen double-digit improvements in the percentage of college students taking—and completing—the minimum number of courses needed to graduate on time.
0%
10%
20%
30%
40%
50%
60%
70%
201020092008200720062005
SAME CAMPUS, SAME DEGREE LEVEL
8
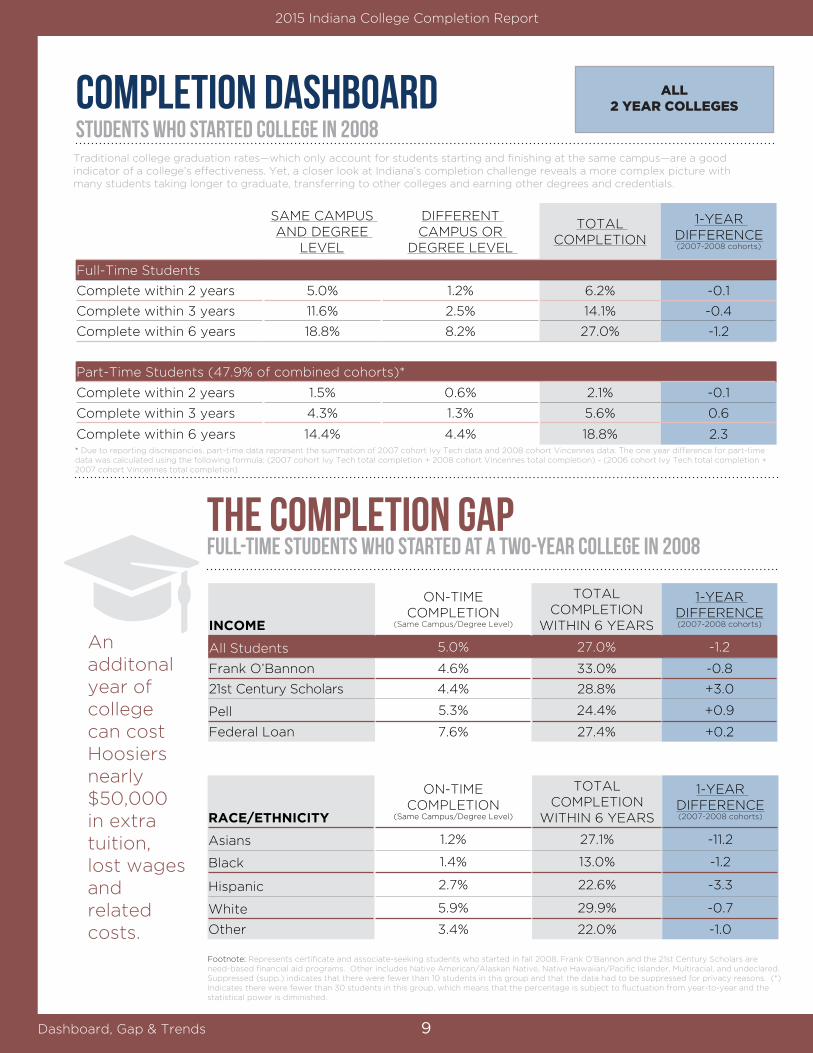
Completion dashboardStudents who started college in 2008
the completion gapfull-time Students who started at A TWO-YEAR college in 2008
2015 Indiana College Completion Report
Dashboard, Gap & Trends
SAME CAMPUS AND DEGREE
LEVEL
DIFFERENT CAMPUS OR
DEGREE LEVEL
TOTAL COMPLETION
1-YEAR DIFFERENCE(2007-2008 cohorts)
Full-Time Students
Complete within 2 years 5.0% 1.2% 6.2% -0.1
Complete within 3 years 11.6% 2.5% 14.1% -0.4
Complete within 6 years 18.8% 8.2% 27.0% -1.2
Part-Time Students (47.9% of combined cohorts)*
Complete within 2 years 1.5% 0.6% 2.1% -0.1
Complete within 3 years 4.3% 1.3% 5.6% 0.6
Complete within 6 years 14.4% 4.4% 18.8% 2.3
INCOME
ON-TIME COMPLETION
(Same Campus/Degree Level)
TOTAL COMPLETION
WITHIN 6 YEARS
1-YEAR DIFFERENCE(2007-2008 cohorts)
All Students 5.0% 27.0% -1.2
Frank O’Bannon 4.6% 33.0% -0.8
21st Century Scholars 4.4% 28.8% +3.0
Pell 5.3% 24.4% +0.9
Federal Loan 7.6% 27.4% +0.2
RACE/ETHNICITY
ON-TIME COMPLETION
(Same Campus/Degree Level)
TOTAL COMPLETION
WITHIN 6 YEARS
1-YEAR DIFFERENCE(2007-2008 cohorts)
Asians 1.2% 27.1% -11.2
Black 1.4% 13.0% -1.2
Hispanic 2.7% 22.6% -3.3
White 5.9% 29.9% -0.7
Other 3.4% 22.0% -1.0
An additonal year of college can cost Hoosiers nearly $50,000 in extra tuition, lost wages and related costs.
ALL 2 YEAR COLLEGES
Footnote: Represents certificate and associate-seeking students who started in fall 2008. Frank O’Bannon and the 21st Century Scholars are need-based financial aid programs. Other includes Native American/Alaskan Native, Native Hawaiian/Pacific Islander, Multiracial, and undeclared. Suppressed (supp.) indicates that there were fewer than 10 students in this group and that the data had to be suppressed for privacy reasons. (*) Indicates there were fewer than 30 students in this group, which means that the percentage is subject to fluctuation from year-to-year and the statistical power is diminished.
* Due to reporting discrepancies, part-time data represent the summation of 2007 cohort Ivy Tech data and 2008 cohort Vincennes data. The one year difference for part-time data was calculated using the following formula: (2007 cohort Ivy Tech total completion + 2008 cohort Vincennes total completion) - (2006 cohort Ivy Tech total completion + 2007 cohort Vincennes total completion)
Traditional college graduation rates—which only account for students starting and finishing at the same campus—are a good indicator of a college’s effectiveness. Yet, a closer look at Indiana’s completion challenge reveals a more complex picture with many students taking longer to graduate, transferring to other colleges and earning other degrees and credentials.
9
on-time Completion Trends
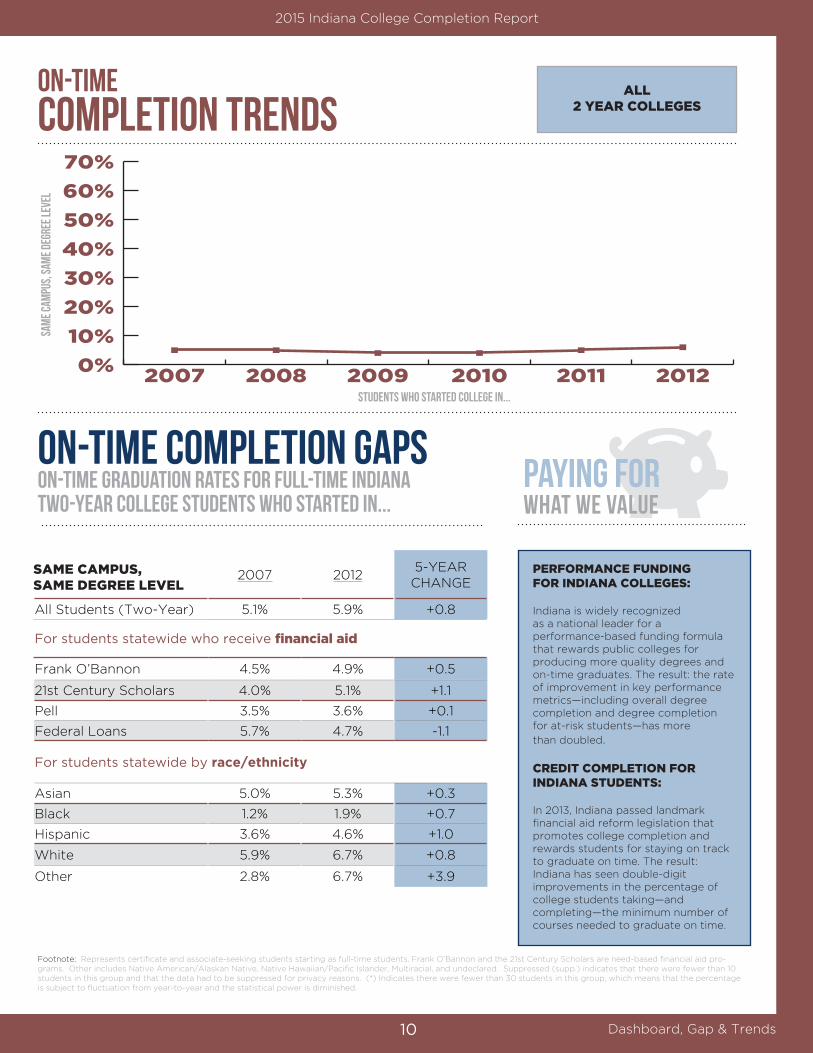
ON-TIME COMPLETION GAPSon-time graduation rates for full-time indianaTWO-YEAR COLLEGE students who started in...
PAYING FOR WHAT WE VALUE
2015 Indiana College Completion Report
Dashboard, Gap & Trends
Students who started college in...
sam
e cam
pus,
sam
e deg
ree L
evel
2007 20125-YEAR
CHANGE
All Students (Two-Year) 5.1% 5.9% +0.8
For students statewide who receive financial aid
Frank O’Bannon 4.5% 4.9% +0.5
21st Century Scholars 4.0% 5.1% +1.1
Pell 3.5% 3.6% +0.1
Federal Loans 5.7% 4.7% -1.1
For students statewide by race/ethnicity
Asian 5.0% 5.3% +0.3
Black 1.2% 1.9% +0.7
Hispanic 3.6% 4.6% +1.0
White 5.9% 6.7% +0.8
Other 2.8% 6.7% +3.9
Footnote: Represents certificate and associate-seeking students starting as full-time students. Frank O’Bannon and the 21st Century Scholars are need-based financial aid pro-grams. Other includes Native American/Alaskan Native, Native Hawaiian/Pacific Islander, Multiracial, and undeclared. Suppressed (supp.) indicates that there were fewer than 10 students in this group and that the data had to be suppressed for privacy reasons. (*) Indicates there were fewer than 30 students in this group, which means that the percentage is subject to fluctuation from year-to-year and the statistical power is diminished.
ALL 2 YEAR COLLEGES
PERFORMANCE FUNDING FOR INDIANA COLLEGES: Indiana is widely recognized as a national leader for a performance-based funding formula that rewards public colleges for producing more quality degrees and on-time graduates. The result: the rate of improvement in key performance metrics—including overall degree completion and degree completion for at-risk students—has more
than doubled. CREDIT COMPLETION FOR INDIANA STUDENTS: In 2013, Indiana passed landmark financial aid reform legislation that promotes college completion and rewards students for staying on track to graduate on time. The result: Indiana has seen double-digit improvements in the percentage of college students taking—and completing—the minimum number of courses needed to graduate on time.
0%
10%
20%
30%
40%
50%
60%
70%
201220112010200920082007
SAME CAMPUS, SAME DEGREE LEVEL
10

College completion Report
Indiana UniversityThe rate at which full-time students complete
college within two year for an associate degree and four years for a bachelor’s degree is
increasing:
1Completion dashboardStudents who started college in 2006
the completion gapFULL-TIME Students who started AT THIS college in 2006
2015 Indiana College Completion Report
Dashboard, Gap & Trends
SAME CAMPUS AND DEGREE
LEVEL
DIFFERENT CAMPUS OR
DEGREE LEVEL
TOTAL COMPLETION
1-YEAR DIFFERENCE(2005-2006 cohorts)
Full-Time Students
Complete within 4 years 32.5% 3.9% 36.3% -0.8
Complete within 6 years 56.7% 11.7% 68.4% +2.0
Complete within 8 years 58.7% 14.6% 73.3% + 1.6
Part-Time Students (% of total cohort not available)
Complete within 4 years not available not available not available not available
Complete within 6 years not available not available not available not available
Complete within 8 years not available not available not available not available
INCOME
ON-TIME COMPLETION
(Same Campus/Degree Level)
TOTAL COMPLETION
WITHIN 8 YEARS
1-YEAR DIFFERENCE(2005-2006 cohorts)
All Students 32.5% 73.3% +1.6
Frank O’Bannon 25.8% 72.1% +2.5
21st Century Scholars 22.4% 63.0% +8.5
Pell 23.0% 64.0% +5.2
Federal Loan 29.9% 72.2% +3.2
RACE/ETHNICITY
ON-TIMECOMPLETION
(Same Campus/Degree Level)
TOTAL COMPLETION
WITHIN 8 YEARS
1-YEAR DIFFERENCE(2005-2006 cohorts)
Asians 5.0%* 80.0%* +3.8*
Black 18.6% 61.0% +4.8
Hispanic 26.9% 65.7% +3.6
White 33.6% 74.1% +1.3
Other 29.0% 75.0% +7.7
Footnote: Represents bachelor’s-seeking students who started in Fall 2006. Frank O’Bannon and the 21st Century Scholars are need-based financial aid programs. Other includes Native American/Alaskan Native, Native Hawaiian/Pacific Islander, Multiracial, and undeclared. Suppressed (supp.) indicates that there were fewer than 10 students in this group and that the data had to be suppressed for privacy reasons. (*) Indicates there were fewer than 30 students in this group, which means that the percentage is subject to fluctuation from year-to-year and the statistical power is diminished.
Traditional college graduation rates—which only account for students starting and finishing at the same campus—are a good indicator of a college’s effectiveness. Yet, a closer look at Indiana’s completion challenge reveals a more complex picture with many students taking longer to graduate, transferring to other colleges and earning other degrees and credentials.
An additonal year of college can cost Hoosiers nearly $50,000 in extra tuition, lost wages and related costs.
Ball State University
11

on-time Completion Trends
ON-TIME COMPLETION GAPSon-time graduation rates for full-time indianafour-year college students who started in...
2015 Indiana College Completion Report
Dashboard, Gap & Trends
Students who started college in...
sam
e cam
pus,
sam
e deg
ree
Leve
l
2005 20105-YEAR
CHANGE
All Students (Four-Year) 29.5% 36.1% +6.7
All Students This College 32.6% 44.7% +12.1
For students at this college who receive financial aid
Frank O’Bannon 26.4% 37.8% +11.3
21st Century Scholars 17.2% 37.7% +20.5
Pell 20.4% 35.2% +14.8
Federal Loans 30.1% 41.5% +11.4
For students at this college by race/ethnicity
Asian 19.0%* 54.5%* +35.5*
Black 18.1% 32.6% +14.6
Hispanic 30.3% 38.1% +7.8
White 33.3% 45.9% +12.6
Other 36.4% 38.8% +2.3
Footnote: Represents bachelor’s-seeking students starting as full-time students. Frank O’Bannon and the 21st Century Scholars are need-based financial aid programs. Other includes Native American/Alaskan Native, Native Hawaiian/Pacific Islander, Multiracial, and undeclared. Suppressed (supp.) indicates that there were fewer than 10 students in this group and that the data had to be suppressed for privacy reasons. (*) Indicates there were fewer than 30 students in this group, which means that the percentage is subject to fluctuation from year-to-year and the statistical power is diminished.
PAYING FOR WHAT WE VALUE
PERFORMANCE FUNDING FOR INDIANA COLLEGES: Indiana is widely recognized as a national leader for a performance-based funding formula that rewards public colleges for producing more quality degrees and on-time graduates. The result: the rate of improvement in key performance metrics—including overall degree completion and degree completion for at-risk students—has more
than doubled. CREDIT COMPLETION FOR INDIANA STUDENTS: In 2013, Indiana passed landmark financial aid reform legislation that promotes college completion and rewards students for staying on track to graduate on time. The result: Indiana has seen double-digit improvements in the percentage of college students taking—and completing—the minimum number of courses needed to graduate on time.
0%
10%
20%
30%
40%
50%
60%
70%
201020092008200720062005
This College
Statewide - Four-Year Colleges
Ball State University
SAME CAMPUS, SAME DEGREE LEVEL
12

College completion Report
Indiana UniversityThe rate at which full-time students complete
college within two year for an associate degree and four years for a bachelor’s degree is
increasing:
1Completion dashboardStudents who started college in 2006
the completion gapFULL-TIME Students who started AT THIS college in 2006
2015 Indiana College Completion Report
Dashboard, Gap & Trends
SAME CAMPUS AND DEGREE
LEVEL
DIFFERENT CAMPUS OR
DEGREE LEVEL
TOTAL COMPLETION
1-YEAR DIFFERENCE(2005-2006 cohorts)
Full-Time Students
Complete within 4 years 21.3% 3.4% 24.7% -0.5
Complete within 6 years 41.9% 9.9% 51.8% -1.9
Complete within 8 years 44.4% 14.0% 58.4% -0.6
Part-Time Students (1.4% of total cohort)
Complete within 4 years 4.8%* 9.5%* 14.3%* -1.1
Complete within 6 years 23.8%* 14.3%* 38.1%* -0.4
Complete within 8 years 23.8%* 14.3%* 38.1%* -0.4
INCOME
ON-TIME COMPLETION
(Same Campus/Degree Level)
TOTAL COMPLETION
WITHIN 8 YEARS
1-YEAR DIFFERENCE(2005-2006 cohorts)
All Students 21.3% 58.4% -0.6
Frank O’Bannon 16.8% 59.7% +1.5
21st Century Scholars 15.7% 53.0% +2.1
Pell 13.4% 48.1% -1.2
Federal Loan 16.2% 54.6% -1.5
RACE/ETHNICITY
ON-TIME COMPLETION
(Same Campus/Degree Level)
TOTAL COMPLETION
WITHIN 8 YEARS
1-YEAR DIFFERENCE(2005-2006 cohorts)
Asians 16.7%* 44.4%* +2.7*
Black 5.7% 42.9% -0.6
Hispanic 5.3%* 47.4%* -0.9*
White 25.1% 63.0% +1.9
Other 17.6% 43.2% -23.9
Footnote: Represents bachelor’s-seeking students who started in Fall 2006. Frank O’Bannon and the 21st Century Scholars are need-based financial aid programs. Other includes Native American/Alaskan Native, Native Hawaiian/Pacific Islander, Multiracial, and undeclared. Suppressed (supp.) indicates that there were fewer than 10 students in this group and that the data had to be suppressed for privacy reasons. (*) Indicates there were fewer than 30 students in this group, which means that the percentage is subject to fluctuation from year-to-year and the statistical power is diminished.
Traditional college graduation rates—which only account for students starting and finishing at the same campus—are a good indicator of a college’s effectiveness. Yet, a closer look at Indiana’s completion challenge reveals a more complex picture with many students taking longer to graduate, transferring to other colleges and earning other degrees and credentials.
An additonal year of college can cost Hoosiers nearly $50,000 in extra tuition, lost wages and related costs.
Indiana State University
13
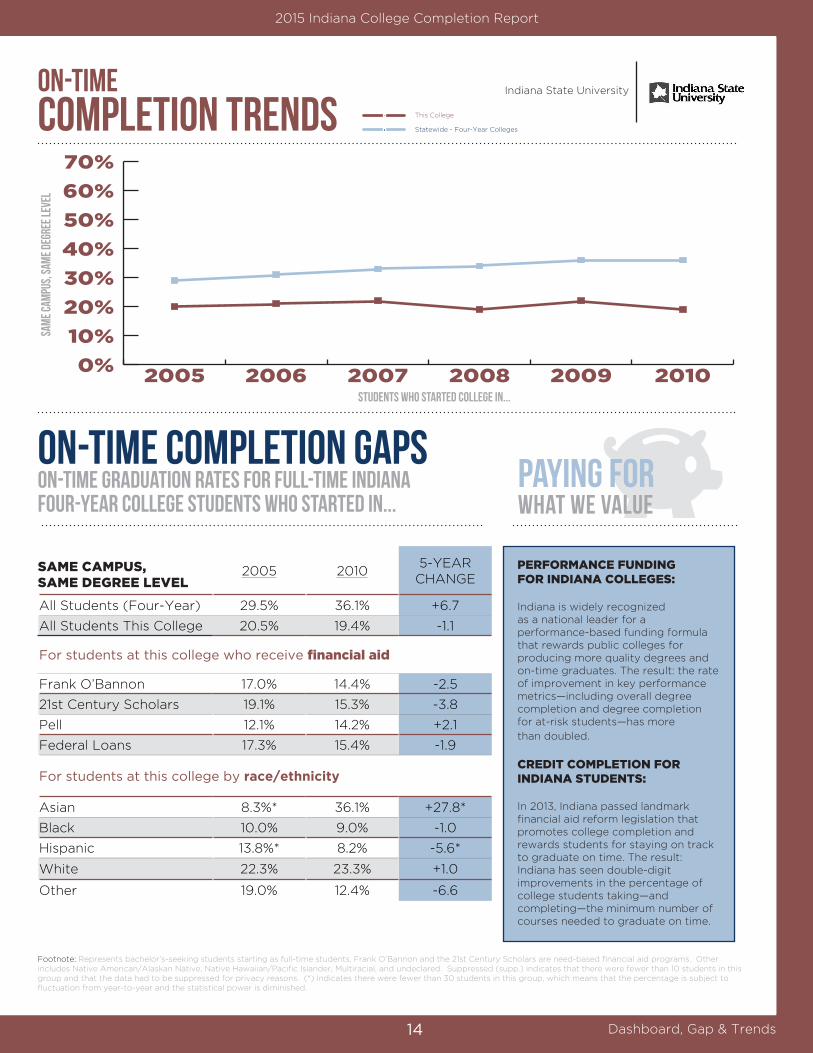
on-time Completion Trends
ON-TIME COMPLETION GAPSon-time graduation rates for full-time INDIANA FOUR-YEAR COLLEGE students who started in...
2015 Indiana College Completion Report
Dashboard, Gap & Trends
Students who started college in...
sam
e cam
pus,
sam
e deg
ree L
evel
2005 20105-YEAR
CHANGE
All Students (Four-Year) 29.5% 36.1% +6.7
All Students This College 20.5% 19.4% -1.1
For students at this college who receive financial aid
Frank O’Bannon 17.0% 14.4% -2.5
21st Century Scholars 19.1% 15.3% -3.8
Pell 12.1% 14.2% +2.1
Federal Loans 17.3% 15.4% -1.9
For students at this college by race/ethnicity
Asian 8.3%* 36.1% +27.8*
Black 10.0% 9.0% -1.0
Hispanic 13.8%* 8.2% -5.6*
White 22.3% 23.3% +1.0
Other 19.0% 12.4% -6.6
Footnote: Represents bachelor’s-seeking students starting as full-time students. Frank O’Bannon and the 21st Century Scholars are need-based financial aid programs. Other includes Native American/Alaskan Native, Native Hawaiian/Pacific Islander, Multiracial, and undeclared. Suppressed (supp.) indicates that there were fewer than 10 students in this group and that the data had to be suppressed for privacy reasons. (*) Indicates there were fewer than 30 students in this group, which means that the percentage is subject to fluctuation from year-to-year and the statistical power is diminished.
PAYING FOR WHAT WE VALUE
PERFORMANCE FUNDING FOR INDIANA COLLEGES: Indiana is widely recognized as a national leader for a performance-based funding formula that rewards public colleges for producing more quality degrees and on-time graduates. The result: the rate of improvement in key performance metrics—including overall degree completion and degree completion for at-risk students—has more
than doubled. CREDIT COMPLETION FOR INDIANA STUDENTS: In 2013, Indiana passed landmark financial aid reform legislation that promotes college completion and rewards students for staying on track to graduate on time. The result: Indiana has seen double-digit improvements in the percentage of college students taking—and completing—the minimum number of courses needed to graduate on time.
0%
10%
20%
30%
40%
50%
60%
70%
201020092008200720062005
This College
Statewide - Four-Year Colleges
Indiana State University
SAME CAMPUS, SAME DEGREE LEVEL
14

College completion Report
Indiana UniversityThe rate at which full-time students complete
college within two year for an associate degree and four years for a bachelor’s degree is
increasing:
1Completion dashboardStudents who started college in 2006
the completion gapFULL-TIME Students who started AT THIS college in 2006
2015 Indiana College Completion Report
Dashboard, Gap & Trends
SAME CAMPUS AND DEGREE
LEVEL
DIFFERENT CAMPUS OR
DEGREE LEVEL
TOTAL COMPLETION
1-YEAR DIFFERENCE(2005-2006 cohorts)
Full-Time Students
Complete within 4 years 54.8% 4.1% 58.8% +6.0
Complete within 6 years 75.1% 8.0% 83.1% +3.8
Complete within 8 years 77.0% 9.3% 86.3% +3.2
Part-Time Students (0.5% of total cohort)
Complete within 4 years 30.3% 0.0% 30.3% +12.4
Complete within 6 years 48.5% 3.0% 51.5% -5.6
Complete within 8 years 54.5% 6.1% 60.6% -0.1
INCOME
ON-TIME COMPLETION
(Same Campus/Degree Level)
TOTAL COMPLETION
WITHIN 8 YEARS
1-YEAR DIFFERENCE(2005-2006 cohorts)
All Students 54.8% 86.3% +3.2
Frank O’Bannon 35.3% 77.1% -0.2
21st Century Scholars 30.9% 68.4% +7.9
Pell 35.6% 71.0% +2.0
Federal Loan 48.7% 82.5% +1.8
RACE/ETHNICITY
ON-TIME COMPLETION
(Same Campus/Degree Level)
TOTAL COMPLETION
WITHIN 8 YEARS
1-YEAR DIFFERENCE(2005-2006 cohorts)
Asians 54.1% 88.6% +3.6
Black 24.4% 62.9% +5.1
Hispanic 44.8% 79.4% +0.6
White 57.2% 87.9% +2.5
Other 47.7% 83.2% +7.2
Footnote: Represents bachelor’s-seeking students who started in Fall 2006. Frank O’Bannon and the 21st Century Scholars are need-based financial aid programs. Other includes Native American/Alaskan Native, Native Hawaiian/Pacific Islander, Multiracial, and undeclared. Suppressed (supp.) indicates that there were fewer than 10 students in this group and that the data had to be suppressed for privacy reasons. (*) Indicates there were fewer than 30 students in this group, which means that the percentage is subject to fluctuation from year-to-year and the statistical power is diminished.
Traditional college graduation rates—which only account for students starting and finishing at the same campus—are a good indicator of a college’s effectiveness. Yet, a closer look at Indiana’s completion challenge reveals a more complex picture with many students taking longer to graduate, transferring to other colleges and earning other degrees and credentials.
An additonal year of college can cost Hoosiers nearly $50,000 in extra tuition, lost wages and related costs.
Indiana University-Bloomington
15
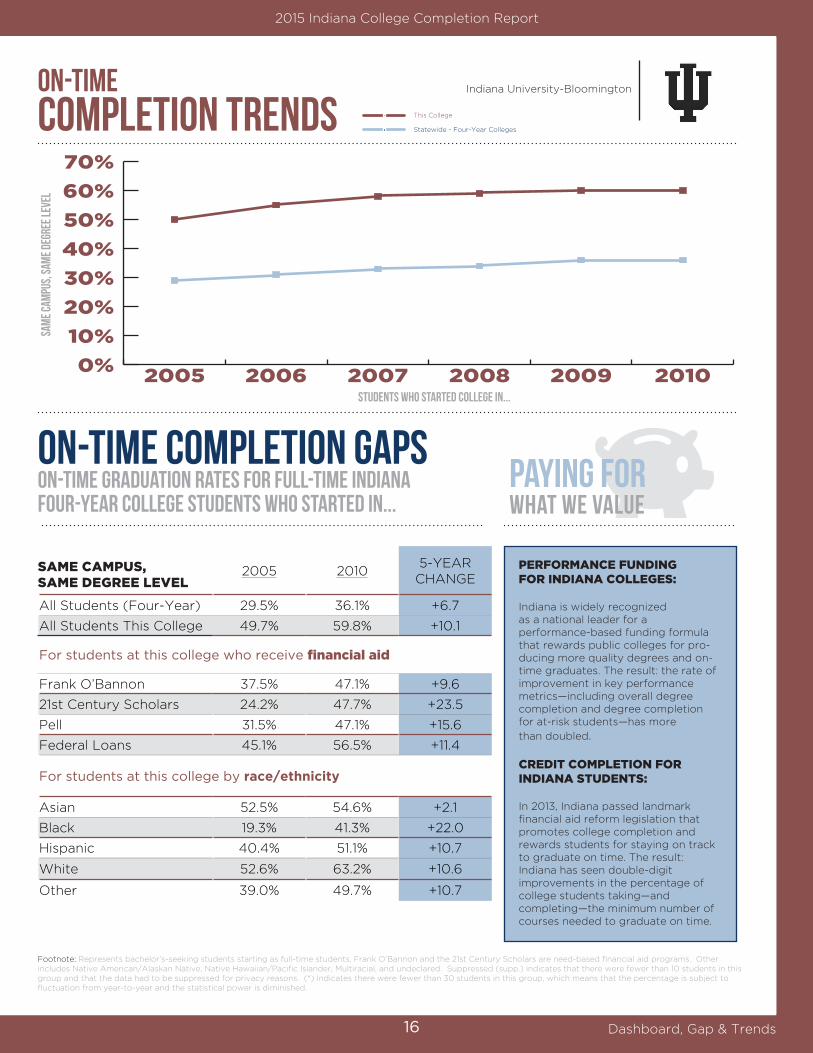
on-time Completion Trends
ON-TIME COMPLETION GAPSon-time graduation rates for full-time indiana four-year college students who started in...
2015 Indiana College Completion Report
Dashboard, Gap & Trends
Students who started college in...
sam
e cam
pus,
sam
e deg
ree L
evel
2005 20105-YEAR
CHANGE
All Students (Four-Year) 29.5% 36.1% +6.7
All Students This College 49.7% 59.8% +10.1
For students at this college who receive financial aid
Frank O’Bannon 37.5% 47.1% +9.6
21st Century Scholars 24.2% 47.7% +23.5
Pell 31.5% 47.1% +15.6
Federal Loans 45.1% 56.5% +11.4
For students at this college by race/ethnicity
Asian 52.5% 54.6% +2.1
Black 19.3% 41.3% +22.0
Hispanic 40.4% 51.1% +10.7
White 52.6% 63.2% +10.6
Other 39.0% 49.7% +10.7
Footnote: Represents bachelor’s-seeking students starting as full-time students. Frank O’Bannon and the 21st Century Scholars are need-based financial aid programs. Other includes Native American/Alaskan Native, Native Hawaiian/Pacific Islander, Multiracial, and undeclared. Suppressed (supp.) indicates that there were fewer than 10 students in this group and that the data had to be suppressed for privacy reasons. (*) Indicates there were fewer than 30 students in this group, which means that the percentage is subject to fluctuation from year-to-year and the statistical power is diminished.
PAYING FOR WHAT WE VALUE
PERFORMANCE FUNDING FOR INDIANA COLLEGES: Indiana is widely recognized as a national leader for a performance-based funding formula that rewards public colleges for pro-ducing more quality degrees and on-time graduates. The result: the rate of improvement in key performance metrics—including overall degree completion and degree completion for at-risk students—has more
than doubled. CREDIT COMPLETION FOR INDIANA STUDENTS: In 2013, Indiana passed landmark financial aid reform legislation that promotes college completion and rewards students for staying on track to graduate on time. The result: Indiana has seen double-digit improvements in the percentage of college students taking—and completing—the minimum number of courses needed to graduate on time.
0%
10%
20%
30%
40%
50%
60%
70%
201020092008200720062005
This College
Statewide - Four-Year Colleges
Indiana University-Bloomington
SAME CAMPUS, SAME DEGREE LEVEL
16

College completion Report
Indiana UniversityThe rate at which full-time students complete
college within two year for an associate degree and four years for a bachelor’s degree is
increasing:
1Completion dashboardStudents who started college in 2006
the completion gapFULL-TIME Students who started AT THIS college in 2006
2015 Indiana College Completion Report
Dashboard, Gap & Trends
SAME CAMPUS AND DEGREE
LEVEL
DIFFERENT CAMPUS OR
DEGREE LEVEL
TOTAL COMPLETION
1-YEAR DIFFERENCE(2005-2006 cohorts)
Full-Time Students
Complete within 4 years 4.6% 4.1% 8.8% -2.1
Complete within 6 years 24.7% 9.8% 34.5% +6.4
Complete within 8 years 28.9% 13.4% 42.3% +7.2
Part-Time Students (22.2% of total cohort)
Complete within 4 years 0.0% 2.3% 2.3% +0.6
Complete within 6 years 2.3% 2.3% 4.7% -5.5
Complete within 8 years 18.6% 7.0% 25.6% +10.3
INCOME
ON-TIME COMPLETION
(Same Campus/Degree Level)
TOTAL COMPLETION
WITHIN 8 YEARS
1-YEAR DIFFERENCE(2005-2006 cohorts)
All Students 4.6% 42.3% +7.2
Frank O’Bannon 7.2% 58.0% +4.5
21st Century Scholars 4.5%* 45.5%* +12.2*
Pell 1.1% 37.8% +7.7
Federal Loan 2.9% 35.2% +7.1
RACE/ETHNICITY
ON-TIME COMPLETION
(Same Campus/Degree Level)
TOTAL COMPLETION
WITHIN 8 YEARS
1-YEAR DIFFERENCE(2005-2006 cohorts)
Asians Supp. Supp. Supp.
Black Supp. Supp. Supp.
Hispanic Supp. Supp. Supp.
White 4.9% 42.6% +5.8
Other Supp. Supp. Supp.
Footnote: Represents bachelor’s-seeking students who started in Fall 2006. Frank O’Bannon and the 21st Century Scholars are need-based financial aid programs. Other includes Native American/Alaskan Native, Native Hawaiian/Pacific Islander, Multiracial, and undeclared. Suppressed (supp.) indicates that there were fewer than 10 students in this group and that the data had to be suppressed for privacy reasons. (*) Indicates there were fewer than 30 students in this group, which means that the percentage is subject to fluctuation from year-to-year and the statistical power is diminished.
Traditional college graduation rates—which only account for students starting and finishing at the same campus—are a good indicator of a college’s effectiveness. Yet, a closer look at Indiana’s completion challenge reveals a more complex picture with many students taking longer to graduate, transferring to other colleges and earning other degrees and credentials.
An additonal year of college can cost Hoosiers nearly $50,000 in extra tuition, lost wages and related costs.
Indiana University-East
17
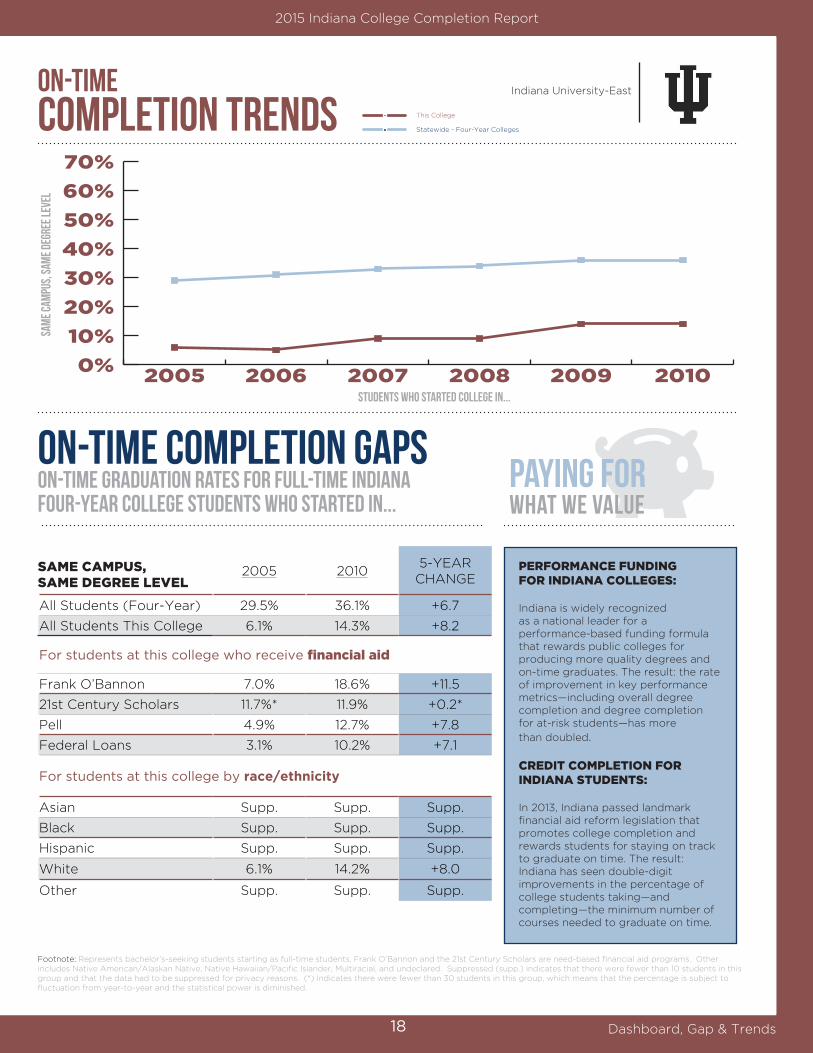
on-time Completion Trends
ON-TIME COMPLETION GAPSon-time graduation rates for full-time indiana four-year college students who started in...
2015 Indiana College Completion Report
Dashboard, Gap & Trends
Students who started college in...
sam
e cam
pus,
sam
e deg
ree L
evel
2005 20105-YEAR
CHANGE
All Students (Four-Year) 29.5% 36.1% +6.7
All Students This College 6.1% 14.3% +8.2
For students at this college who receive financial aid
Frank O’Bannon 7.0% 18.6% +11.5
21st Century Scholars 11.7%* 11.9% +0.2*
Pell 4.9% 12.7% +7.8
Federal Loans 3.1% 10.2% +7.1
For students at this college by race/ethnicity
Asian Supp. Supp. Supp.
Black Supp. Supp. Supp.
Hispanic Supp. Supp. Supp.
White 6.1% 14.2% +8.0
Other Supp. Supp. Supp.
Footnote: Represents bachelor’s-seeking students starting as full-time students. Frank O’Bannon and the 21st Century Scholars are need-based financial aid programs. Other includes Native American/Alaskan Native, Native Hawaiian/Pacific Islander, Multiracial, and undeclared. Suppressed (supp.) indicates that there were fewer than 10 students in this group and that the data had to be suppressed for privacy reasons. (*) Indicates there were fewer than 30 students in this group, which means that the percentage is subject to fluctuation from year-to-year and the statistical power is diminished.
PAYING FOR WHAT WE VALUE
PERFORMANCE FUNDING FOR INDIANA COLLEGES: Indiana is widely recognized as a national leader for a performance-based funding formula that rewards public colleges for producing more quality degrees and on-time graduates. The result: the rate of improvement in key performance metrics—including overall degree completion and degree completion for at-risk students—has more
than doubled. CREDIT COMPLETION FOR INDIANA STUDENTS: In 2013, Indiana passed landmark financial aid reform legislation that promotes college completion and rewards students for staying on track to graduate on time. The result: Indiana has seen double-digit improvements in the percentage of college students taking—and completing—the minimum number of courses needed to graduate on time.
0%
10%
20%
30%
40%
50%
60%
70%
201020092008200720062005
This College
Statewide - Four-Year Colleges
Indiana University-East
SAME CAMPUS, SAME DEGREE LEVEL
18
College completion Report
Indiana UniversityThe rate at which full-time students complete
college within two year for an associate degree and four years for a bachelor’s degree is
increasing:
1Completion dashboardStudents who started college in 2006
the completion gapFULL-TIME Students who started AT THIS college in 2006
2015 Indiana College Completion Report
Dashboard, Gap & Trends
SAME CAMPUS AND DEGREE
LEVEL
DIFFERENT CAMPUS OR
DEGREE LEVEL
TOTAL COMPLETION
1-YEAR DIFFERENCE(2005-2006 cohorts)
Full-Time Students
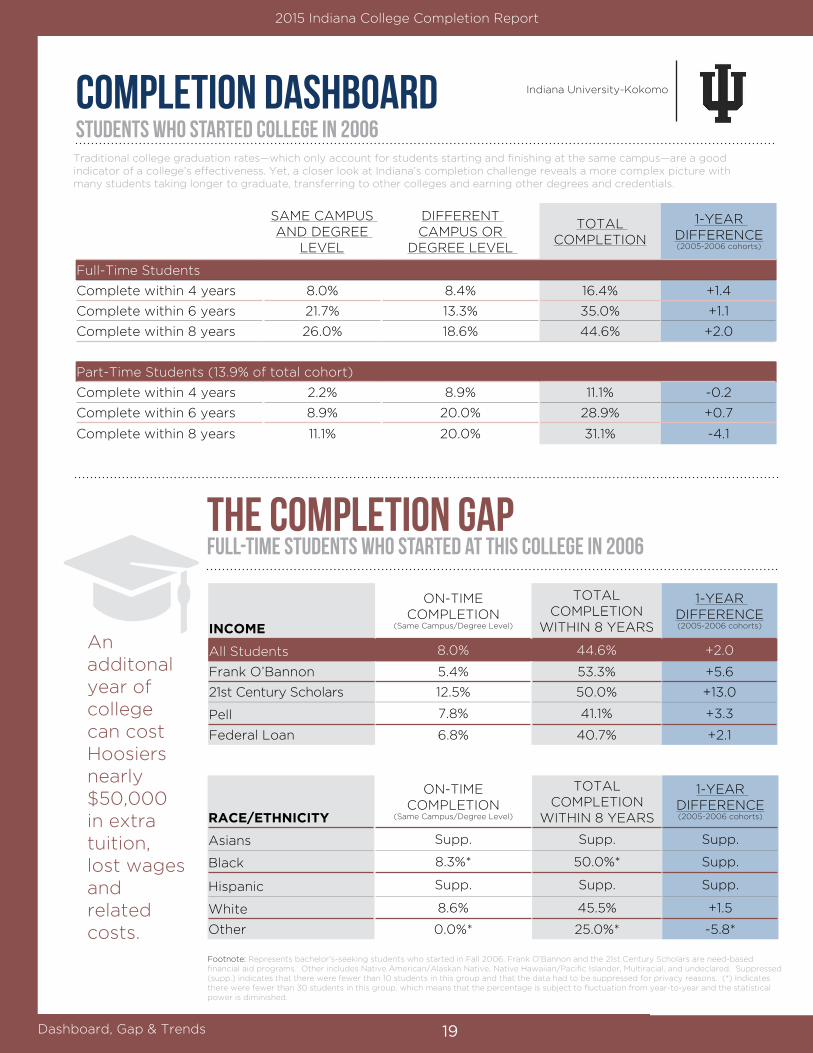
Complete within 4 years 8.0% 8.4% 16.4% +1.4
Complete within 6 years 21.7% 13.3% 35.0% +1.1
Complete within 8 years 26.0% 18.6% 44.6% +2.0
Part-Time Students (13.9% of total cohort)
Complete within 4 years 2.2% 8.9% 11.1% -0.2
Complete within 6 years 8.9% 20.0% 28.9% +0.7
Complete within 8 years 11.1% 20.0% 31.1% -4.1
INCOME
ON-TIME COMPLETION
(Same Campus/Degree Level)
TOTAL COMPLETION
WITHIN 8 YEARS
1-YEAR DIFFERENCE(2005-2006 cohorts)
All Students 8.0% 44.6% +2.0
Frank O’Bannon 5.4% 53.3% +5.6
21st Century Scholars 12.5% 50.0% +13.0
Pell 7.8% 41.1% +3.3
Federal Loan 6.8% 40.7% +2.1
RACE/ETHNICITY
ON-TIME COMPLETION
(Same Campus/Degree Level)
TOTAL COMPLETION
WITHIN 8 YEARS
1-YEAR DIFFERENCE(2005-2006 cohorts)
Asians Supp. Supp. Supp.
Black 8.3%* 50.0%* Supp.
Hispanic Supp. Supp. Supp.
White 8.6% 45.5% +1.5
Other 0.0%* 25.0%* -5.8*
Footnote: Represents bachelor’s-seeking students who started in Fall 2006. Frank O’Bannon and the 21st Century Scholars are need-based financial aid programs. Other includes Native American/Alaskan Native, Native Hawaiian/Pacific Islander, Multiracial, and undeclared. Suppressed (supp.) indicates that there were fewer than 10 students in this group and that the data had to be suppressed for privacy reasons. (*) Indicates there were fewer than 30 students in this group, which means that the percentage is subject to fluctuation from year-to-year and the statistical power is diminished.
Traditional college graduation rates—which only account for students starting and finishing at the same campus—are a good indicator of a college’s effectiveness. Yet, a closer look at Indiana’s completion challenge reveals a more complex picture with many students taking longer to graduate, transferring to other colleges and earning other degrees and credentials.
An additonal year of college can cost Hoosiers nearly $50,000 in extra tuition, lost wages and related costs.
Indiana University-Kokomo
19

on-time Completion Trends
ON-TIME COMPLETION GAPSon-time graduation rates for full-time indiana four-year college students who started in...
2015 Indiana College Completion Report
Dashboard, Gap & Trends
Students who started college in...
sam
e cam
pus,
sam
e deg
reE
Leve
l
2005 20105-YEAR
CHANGE
All Students (Four-Year) 29.5% 36.1% +6.7
All Students This College 8.5% 17.3% +8.9
For students at this college who receive financial aid
Frank O’Bannon 6.4% 18.9% +12.5
21st Century Scholars 12.5%* 17.8% +5.3*
Pell 4.4% 15.9% +11.5
Federal Loans 5.0% 16.0% +11.0
For students at this college by race/ethnicity
Asian Supp. Supp. Supp.
Black Supp. Supp. Supp.
Hispanic Supp. Supp. Supp.
White 8.7% 18.8% +10.0
Other 0.0%* 0.0%* 0.0*
Footnote: Represents bachelor’s-seeking students starting as full-time students. Frank O’Bannon and the 21st Century Scholars are need-based financial aid programs. Other includes Native American/Alaskan Native, Native Hawaiian/Pacific Islander, Multiracial, and undeclared. Suppressed (supp.) indicates that there were fewer than 10 students in this group and that the data had to be suppressed for privacy reasons. (*) Indicates there were fewer than 30 students in this group, which means that the percentage is subject to fluctuation from year-to-year and the statistical power is diminished.
PAYING FOR WHAT WE VALUE
PERFORMANCE FUNDING FOR INDIANA COLLEGES: Indiana is widely recognized as a national leader for a performance-based funding formula that rewards public colleges for producing more quality degrees and on-time graduates. The result: the rate of improvement in key performance metrics—including overall degree completion and degree completion for at-risk students—has more
than doubled. CREDIT COMPLETION FOR INDIANA STUDENTS: In 2013, Indiana passed landmark financial aid reform legislation that promotes college completion and rewards students for staying on track to graduate on time. The result: Indiana has seen double-digit improvements in the percentage of college students taking—and completing—the minimum number of courses needed to graduate on time.
0%
10%
20%
30%
40%
50%
60%
70%
201020092008200720062005
This College
Statewide - Four-Year Colleges
Indiana University-Kokomo
SAME CAMPUS, SAME DEGREE LEVEL
20

College completion Report
Indiana UniversityThe rate at which full-time students complete
college within two year for an associate degree and four years for a bachelor’s degree is
increasing:
1Completion dashboardStudents who started college in 2006
the completion gapFULL-TIME Students who started AT THIS college in 2006
2015 Indiana College Completion Report
Dashboard, Gap & Trends
SAME CAMPUS AND DEGREE
LEVEL
DIFFERENT CAMPUS OR
DEGREE LEVEL
TOTAL COMPLETION
1-YEAR DIFFERENCE(2005-2006 cohorts)
Full-Time Students
Complete within 4 years 6.4% 5.8% 12.2% -5.4
Complete within 6 years 21.3% 12.2% 33.5% -3.2
Complete within 8 years 27.3% 14.9% 42.2% -1.0
Part-Time Students (17.6% of total cohort)
Complete within 4 years 2.4% 3.5% 5.9% -1.3
Complete within 6 years 7.1% 8.2% 15.3% +4.1
Complete within 8 years 12.9% 14.1% 27.1% +10.7
INCOME
ON-TIME COMPLETION
(Same Campus/Degree Level)
TOTAL COMPLETION
WITHIN 8 YEARS
1-YEAR DIFFERENCE(2005-2006 cohorts)
All Students 6.4% 42.2% -1.0
Frank O’Bannon 2.8% 46.6% +0.6
21st Century Scholars 0.0%* 42.1%* +3.6*
Pell 2.5% 35.6% -1.2
Federal Loan 3.2% 41.1% +2.7
RACE/ETHNICITY
ON-TIME COMPLETION
(Same Campus/Degree Level)
TOTAL COMPLETION
WITHIN 8 YEARS
1-YEAR DIFFERENCE(2005-2006 cohorts)
Asians 42.9%* 92.9%* +12.9*
Black 0.0% 19.7% -5.3
Hispanic 3.0% 43.9% +1.3
White 7.0% 45.3% -3.0
Other 9.1%* 36.4%* +11.4*
Footnote: Represents bachelor’s-seeking students who started in Fall 2006. Frank O’Bannon and the 21st Century Scholars are need-based financial aid programs. Other includes Native American/Alaskan Native, Native Hawaiian/Pacific Islander, Multiracial, and undeclared. Suppressed (supp.) indicates that there were fewer than 10 students in this group and that the data had to be suppressed for privacy reasons. (*) Indicates there were fewer than 30 students in this group, which means that the percentage is subject to fluctuation from year-to-year and the statistical power is diminished.
Traditional college graduation rates—which only account for students starting and finishing at the same campus—are a good indicator of a college’s effectiveness. Yet, a closer look at Indiana’s completion challenge reveals a more complex picture with many students taking longer to graduate, transferring to other colleges and earning other degrees and credentials.
An additonal year of college can cost Hoosiers nearly $50,000 in extra tuition, lost wages and related costs.
Indiana University-Northwest
21

on-time Completion Trends
ON-TIME COMPLETION GAPSon-time graduation rates for full-time indianafour-year college students who started in...
2015 Indiana College Completion Report
Dashboard, Gap & Trends
Students who started college in...
sam
e cam
pus,
sam
e deg
ree L
evel
2005 20105-YEAR
CHANGE
All Students (Four-Year) 29.5% 36.1% +6.7
All Students This College 8.0% 6.7% -1.3
For students at this campus who receive financial aid
Frank O’Bannon 7.1% 4.9% -2.2
21st Century Scholars 3.0% 3.4% +0.4
Pell 2.2% 3.8% +1.6
Federal Loans 6.3% 5.7% -0.6
For students at this campus by race/ethnicity
Asian Supp. Supp. Supp.
Black 1.4% 1.4% 0.0
Hispanic 7.4% 3.4% -4.0
White 9.2% 9.1% -0.1
Other 0.0%* 10.3%* +10.3*
Footnote: Represents bachelor’s-seeking students starting as full-time students. Frank O’Bannon and the 21st Century Scholars are need-based financial aid programs. Other includes Native American/Alaskan Native, Native Hawaiian/Pacific Islander, Multiracial, and undeclared. Suppressed (supp.) indicates that there were fewer than 10 students in this group and that the data had to be suppressed for privacy reasons. (*) Indicates there were fewer than 30 students in this group, which means that the percentage is subject to fluctuation from year-to-year and the statistical power is diminished.
PAYING FOR WHAT WE VALUE
PERFORMANCE FUNDING FOR INDIANA COLLEGES: Indiana is widely recognized as a national leader for a performance-based funding formula that rewards public colleges for producing more quality degrees and on-time graduates. The result: the rate of improvement in key performance metrics—including overall degree completion and degree completion for at-risk students—has more
than doubled. CREDIT COMPLETION FOR INDIANA STUDENTS: In 2013, Indiana passed landmark financial aid reform legislation that promotes college completion and rewards students for staying on track to graduate on time. The result: Indiana has seen double-digit improvements in the percentage of college students taking—and completing—the minimum number of courses needed to graduate on time.
0%
10%
20%
30%
40%
50%
60%
70%
201020092008200720062005
This College
Statewide - Four-Year Colleges
Indiana University-Northwest
SAME CAMPUS, SAME DEGREE LEVEL
22
College completion Report
Indiana UniversityThe rate at which full-time students complete
college within two year for an associate degree and four years for a bachelor’s degree is
increasing:
1Completion dashboardStudents who started college in 2006
the completion gapFULL-TIME Students who started AT THIS college in 2006
2015 Indiana College Completion Report
Dashboard, Gap & Trends
INCOME
ON-TIMECOMPLETION
(Same Campus/Degree Level)
TOTAL COMPLETION
WITHIN 8 YEARS
1-YEAR DIFFERENCE(2005-2006 cohorts)
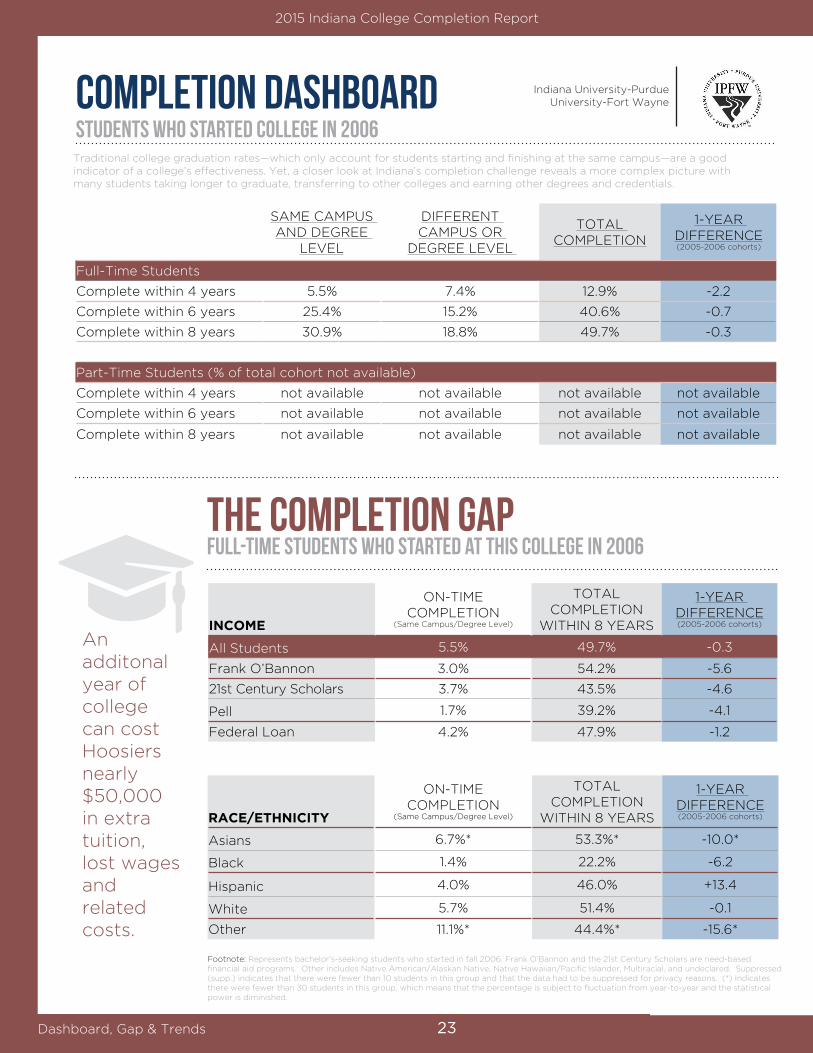
All Students 5.5% 49.7% -0.3
Frank O’Bannon 3.0% 54.2% -5.6
21st Century Scholars 3.7% 43.5% -4.6
Pell 1.7% 39.2% -4.1
Federal Loan 4.2% 47.9% -1.2
RACE/ETHNICITY
ON-TIME COMPLETION
(Same Campus/Degree Level)
TOTAL COMPLETION
WITHIN 8 YEARS
1-YEAR DIFFERENCE(2005-2006 cohorts)
Asians 6.7%* 53.3%* -10.0*
Black 1.4% 22.2% -6.2
Hispanic 4.0% 46.0% +13.4
White 5.7% 51.4% -0.1
Other 11.1%* 44.4%* -15.6*
Footnote: Represents bachelor’s-seeking students who started in fall 2006. Frank O’Bannon and the 21st Century Scholars are need-based financial aid programs. Other includes Native American/Alaskan Native, Native Hawaiian/Pacific Islander, Multiracial, and undeclared. Suppressed (supp.) indicates that there were fewer than 10 students in this group and that the data had to be suppressed for privacy reasons. (*) Indicates there were fewer than 30 students in this group, which means that the percentage is subject to fluctuation from year-to-year and the statistical power is diminished.
Traditional college graduation rates—which only account for students starting and finishing at the same campus—are a good indicator of a college’s effectiveness. Yet, a closer look at Indiana’s completion challenge reveals a more complex picture with many students taking longer to graduate, transferring to other colleges and earning other degrees and credentials.
An additonal year of college can cost Hoosiers nearly $50,000 in extra tuition, lost wages and related costs.
SAME CAMPUS AND DEGREE
LEVEL
DIFFERENT CAMPUS OR
DEGREE LEVEL
TOTAL COMPLETION
1-YEAR DIFFERENCE(2005-2006 cohorts)
Full-Time Students
Complete within 4 years 5.5% 7.4% 12.9% -2.2
Complete within 6 years 25.4% 15.2% 40.6% -0.7
Complete within 8 years 30.9% 18.8% 49.7% -0.3
Part-Time Students (% of total cohort not available)
Complete within 4 years not available not available not available not available
Complete within 6 years not available not available not available not available
Complete within 8 years not available not available not available not available
Indiana University-Purdue University-Fort Wayne
23
on-time Completion Trends
ON-TIME COMPLETION GAPSon-time graduation rates for full-time INDIANA FOUR-YEAR COLLEGE students who started in...
2015 Indiana College Completion Report
Dashboard, Gap & Trends
Students who started college in...
sam
e cam
pus,
sam
e deg
ree L
evel
2005 20105-YEAR
CHANGE
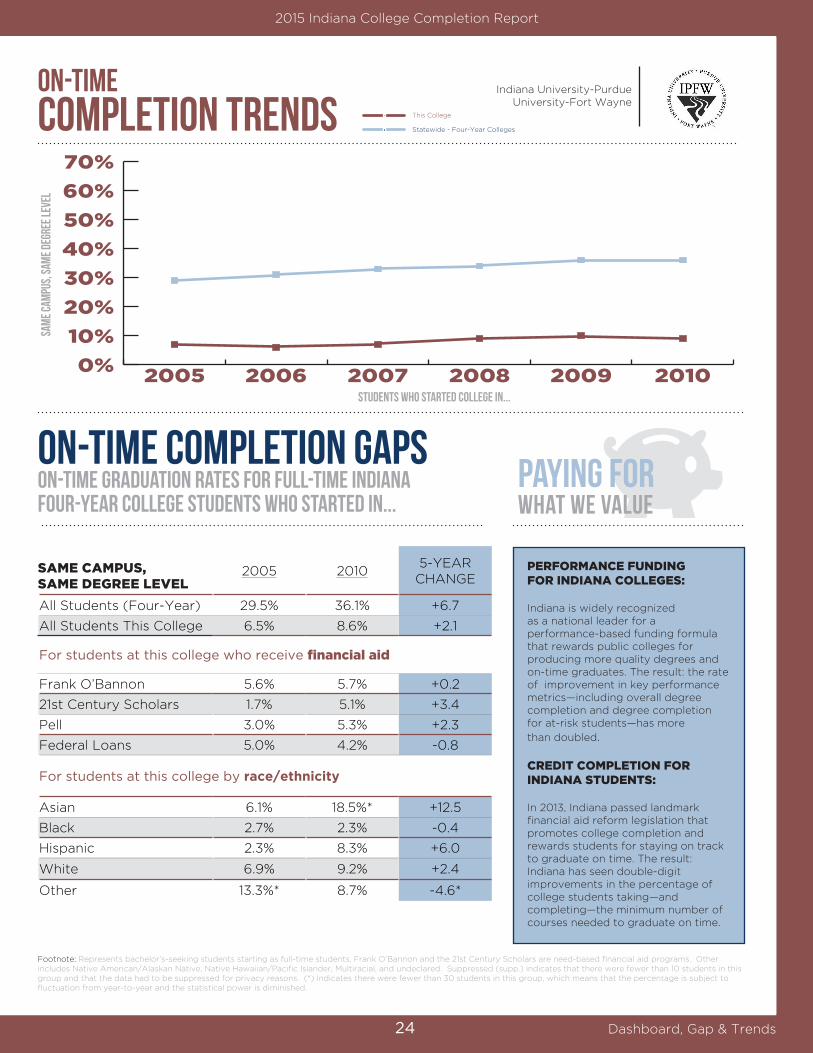
All Students (Four-Year) 29.5% 36.1% +6.7
All Students This College 6.5% 8.6% +2.1
For students at this college who receive financial aid
Frank O’Bannon 5.6% 5.7% +0.2
21st Century Scholars 1.7% 5.1% +3.4
Pell 3.0% 5.3% +2.3
Federal Loans 5.0% 4.2% -0.8
For students at this college by race/ethnicity
Asian 6.1% 18.5%* +12.5
Black 2.7% 2.3% -0.4
Hispanic 2.3% 8.3% +6.0
White 6.9% 9.2% +2.4
Other 13.3%* 8.7% -4.6*
Footnote: Represents bachelor’s-seeking students starting as full-time students. Frank O’Bannon and the 21st Century Scholars are need-based financial aid programs. Other includes Native American/Alaskan Native, Native Hawaiian/Pacific Islander, Multiracial, and undeclared. Suppressed (supp.) indicates that there were fewer than 10 students in this group and that the data had to be suppressed for privacy reasons. (*) Indicates there were fewer than 30 students in this group, which means that the percentage is subject to fluctuation from year-to-year and the statistical power is diminished.
PAYING FOR WHAT WE VALUE
PERFORMANCE FUNDING FOR INDIANA COLLEGES: Indiana is widely recognized as a national leader for a performance-based funding formula that rewards public colleges for producing more quality degrees and on-time graduates. The result: the rate of improvement in key performance metrics—including overall degree completion and degree completion for at-risk students—has more
than doubled. CREDIT COMPLETION FOR INDIANA STUDENTS: In 2013, Indiana passed landmark financial aid reform legislation that promotes college completion and rewards students for staying on track to graduate on time. The result: Indiana has seen double-digit improvements in the percentage of college students taking—and completing—the minimum number of courses needed to graduate on time.
0%
10%
20%
30%
40%
50%
60%
70%
201020092008200720062005
This College
Statewide - Four-Year Colleges
Indiana University-Purdue University-Fort Wayne
SAME CAMPUS, SAME DEGREE LEVEL
24

College completion Report
Indiana UniversityThe rate at which full-time students complete
college within two year for an associate degree and four years for a bachelor’s degree is
increasing:
1Completion dashboardStudents who started college in 2006
the completion gapfull-time Students who started college in 2006
2015 Indiana College Completion Report
Dashboard, Gap & Trends
SAME CAMPUS AND DEGREE
LEVEL
DIFFERENT CAMPUS OR
DEGREE LEVEL
TOTAL COMPLETION
1-YEAR DIFFERENCE(2005-2006 cohorts)
Full-Time Students
Complete within 4 years 13.4% 4.5% 17.9% +3.3
Complete within 6 years 38.2% 10.6% 48.7% +5.7
Complete within 8 years 43.4% 13.9% 57.3% +5.5
Part-Time Students (10.4% of total cohort)
Complete within 4 years 1.2% 6.1% 7.3% +1.3
Complete within 6 years 12.7% 13.5% 26.1% +3.1
Complete within 8 years 19.2% 15.9% 35.1% +1.2
INCOME
ON-TIME COMPLETION
(Same Campus/Degree Level)
TOTAL COMPLETION
WITHIN 8 YEARS
1-YEAR DIFFERENCE(2005-2006 cohorts)
All Students 13.4% 57.3% +5.5
Frank O’Bannon 10.3% 59.7% +0.3
21st Century Scholars 8.5% 47.4% +4.2
Pell 8.6% 49.0% +5.7
Federal Loan 11.1% 55.4% +5.3
RACE/ETHNICITY
ON-TIME COMPLETION
(Same Campus/Degree Level)
TOTAL COMPLETION
WITHIN 8 YEARS
1-YEAR DIFFERENCE(2005-2006 cohorts)
Asians 22.9% 69.9% +12.8
Black 5.8% 49.0% +7.3
Hispanic 5.1% 58.2% +13.6
White 14.3% 57.6% +4.2
Other 11.8% 55.9% + 7.7
Footnote: Represents bachelor’s-seeking students who started in Fall 2006. Frank O’Bannon and the 21st Century Scholars are need-based financial aid programs. Other includes Native American/Alaskan Native, Native Hawaiian/Pacific Islander, Multiracial, and undeclared. Suppressed (supp.) indicates that there were fewer than 10 students in this group and that the data had to be suppressed for privacy reasons. (*) Indicates there were fewer than 30 students in this group, which means that the percentage is subject to fluctuation from year-to-year and the statistical power is diminished.
Traditional college graduation rates—which only account for students starting and finishing at the same campus—are a good indicator of a college’s effectiveness. Yet, a closer look at Indiana’s completion challenge reveals a more complex picture with many students taking longer to graduate, transferring to other colleges and earning other degrees and credentials.
An additonal year of college can cost Hoosiers nearly $50,000 in extra tuition, lost wages and related costs.
Indiana University-Purdue Universtiy-Indianapolis
25

on-time Completion Trends
ON-TIME COMPLETION GAPSon-time graduation rates for full-time indiana four-year college students who started in...
2015 Indiana College Completion Report
Dashboard, Gap & Trends
Students who started college in...
sam
e cam
pus,
sam
e deg
ree L
evel
2005 20105-YEAR
CHANGE
All Students (Four-Year) 29.5% 36.1% +6.7
All Students This College 10.5% 18.9% +8.4
For students at this college who receive financial aid
Frank O’Bannon 10.1% 16.5% +6.4
21st Century Scholars 9.4% 12.4% +3.0
Pell 5.2% 13.5% +8.3
Federal Loans 7.6% 14.4% +6.8
For students at this college by race/ethnicity
Asian 14.3% 37.0% +22.7
Black 2.9% 7.6% +4.7
Hispanic 9.2% 17.2% +8.0
White 11.1% 19.7% +8.6
Other 15.5% 16.1% +0.7
Footnote: Represents bachelor’s-seeking students starting as full-time students. Frank O’Bannon and the 21st Century Scholars are need-based financial aid programs. Other includes Native American/Alaskan Native, Native Hawaiian/Pacific Islander, Multiracial, and undeclared. Suppressed (supp.) indicates that there were fewer than 10 students in this group and that the data had to be suppressed for privacy reasons. (*) Indicates there were fewer than 30 students in this group, which means that the percentage is subject to fluctuation from year-to-year and the statistical power is diminished.
PAYING FOR WHAT WE VALUE
PERFORMANCE FUNDING FOR INDIANA COLLEGES: Indiana is widely recognized as a national leader for a performance-based funding formula that rewards public colleges for producing more quality degrees and on-time graduates. The result: the rate of improvement in key performance metrics—including overall degree completion and degree completion for at-risk students—has more
than doubled. CREDIT COMPLETION FOR INDIANA STUDENTS: In 2013, Indiana passed landmark financial aid reform legislation that promotes college completion and rewards students for staying on track to graduate on time. The result: Indiana has seen double-digit improvements in the percentage of college students taking—and completing—the minimum number of courses needed to graduate on time.
0%
10%
20%
30%
40%
50%
60%
70%
201020092008200720062005
This College
Statewide - Four-Year Colleges
Indiana University-Purdue Universtiy-Indianapolis
SAME CAMPUS, SAME DEGREE LEVEL
26

College completion Report
Indiana UniversityThe rate at which full-time students complete
college within two year for an associate degree and four years for a bachelor’s degree is
increasing:
1Completion dashboardStudents who started college in 2006
the completion gapFULL-TIME Students who started AT THIS college in 2006
2015 Indiana College Completion Report
Dashboard, Gap & Trends
INCOME
ON-TIME COMPLETION
(Same Campus/Degree Level)
TOTAL COMPLETION
WITHIN 8 YEARS
1-YEAR DIFFERENCE(2005-2006 cohorts)
All Students 4.3% 45.4% +3.7
Frank O’Bannon 4.0% 59.0% +14.9
21st Century Scholars 4.7% 39.5% +3.7
Pell 3.6% 42.9% +8.0
Federal Loan 2.6% 43.8% +2.9
RACE/ETHNICITY
ON-TIME COMPLETION
(Same Campus/Degree Level)
TOTAL COMPLETION
WITHIN 8 YEARS
1-YEAR DIFFERENCE(2005-2006 cohorts)
Asians 10.0%* 60.0%* +26.7*
Black 0.0% 34.2% +22.8
Hispanic 6.5% 48.4% +4.0
White 4.4% 46.4% +2.8
Other 3.6% 38.2% -7.3
Footnote: Represents bachelor’s-seeking students who started in Fall 2006. Frank O’Bannon and the 21st Century Scholars are need-based financial aid programs. Other includes Native American/Alaskan Native, Native Hawaiian/Pacific Islander, Multiracial, and undeclared. Suppressed (supp.) indicates that there were fewer than 10 students in this group and that the data had to be suppressed for privacy reasons. (*) Indicates there were fewer than 30 students in this group, which means that the percentage is subject to fluctuation from year-to-year and the statistical power is diminished.
Traditional college graduation rates—which only account for students starting and finishing at the same campus—are a good indicator of a college’s effectiveness. Yet, a closer look at Indiana’s completion challenge reveals a more complex picture with many students taking longer to graduate, transferring to other colleges and earning other degrees and credentials.
An additonal year of college can cost Hoosiers nearly $50,000 in extra tuition, lost wages and related costs.
SAME CAMPUS AND DEGREE
LEVEL
DIFFERENT CAMPUS OR
DEGREE LEVEL
TOTAL COMPLETION
1-YEAR DIFFERENCE(2005-2006 cohorts)
Full-Time Students
Complete within 4 years 4.3% 4.5% 8.8% +1.3
Complete within 6 years 23.1% 10.1% 33.2% +0.1
Complete within 8 years 30.9% 14.5% 45.4% +3.7
Part-Time Students (25.8% of total cohort)
Complete within 4 years 0.0% 1.6% 1.6% -1.2
Complete within 6 years 4.9% 8.8% 13.7% +3.4
Complete within 8 years 12.6% 9.9% 22.5% +4.7
Indiana University-South Bend
27

on-time Completion Trends
ON-TIME COMPLETION GAPSon-time graduation rates for full-time indianafour-year college students who started in...
2015 Indiana College Completion Report
Dashboard, Gap & Trends
Students who started college in...
sam
e cam
pus,
sam
e deg
ree L
Evel
2005 20105-YEAR
CHANGE
All Students (Four-Year) 29.5% 36.1% +6.7
All Students This Campus 4.6% 7.3% +2.7
For students at this college who receive financial aid
Frank O’Bannon 3.7% 6.8% +3.1
21st Century Scholars 5.1% 6.9% +1.8
Pell 3.2% 6.2% +3.0
Federal Loans 5.0% 5.6% +0.6
For students at this college by race/ethnicity
Asian Supp. Supp. Supp.
Black 0.0% 4.1% +4.1
Hispanic 0.0%* 1.3% +1.3*
White 4.8% 7.8% +3.0
Other 12.1% 10.7% -1.4
Footnote: Represents bachelor’s-seeking students starting as full-time students. Frank O’Bannon and the 21st Century Scholars are need-based financial aid programs. Other includes Native American/Alaskan Native, Native Hawaiian/Pacific Islander, Multiracial, and undeclared. Suppressed (supp.) indicates that there were fewer than 10 students in this group and that the data had to be suppressed for privacy reasons. (*) Indicates there were fewer than 30 students in this group, which means that the percentage is subject to fluctuation from year-to-year and the statistical power is diminished.
PAYING FOR WHAT WE VALUE
PERFORMANCE FUNDING FOR INDIANA COLLEGES: Indiana is widely recognized as a national leader for a performance-based funding formula that rewards public colleges for producing more quality degrees and on-time graduates. The result: the rate of improvement in key performance metrics—including overall degree completion and degree completion for at-risk students—has more
than doubled. CREDIT COMPLETION FOR INDIANA STUDENTS: In 2013, Indiana passed landmark financial aid reform legislation that promotes college completion and rewards students for staying on track to graduate on time. The result: Indiana has seen double-digit improvements in the percentage of college students taking—and completing—the minimum number of courses needed to graduate on time.
0%
10%
20%
30%
40%
50%
60%
70%
201020092008200720062005
This College
Statewide - Four-Year Colleges
Indiana University-South Bend
SAME CAMPUS, SAME DEGREE LEVEL
28

College completion Report
Indiana UniversityThe rate at which full-time students complete
college within two year for an associate degree and four years for a bachelor’s degree is
increasing:
1Completion dashboardStudents who started college in 2006
the completion gapFULL-TIME Students who started AT THIS college in 2006
2015 Indiana College Completion Report
Dashboard, Gap & Trends
SAME CAMPUS AND DEGREE
LEVEL
DIFFERENT CAMPUS OR
DEGREE LEVEL
TOTAL COMPLETION
1-YEAR DIFFERENCE(2005-2006 cohorts)
Full-Time Students
Complete within 4 years 8.7% 4.9% 13.6% -0.5
Complete within 6 years 26.6% 9.0% 35.6% -3.9
Complete within 8 years 31.9% 13.2% 45.1% -4.0
Part-Time Students (14.0% of total cohort)
Complete within 4 years 2.0% 3.0% 5.0% -4.1
Complete within 6 years 9.9% 5.9% 15.8% -4.6
Complete within 8 years 11.9% 9.9% 21.8% -5.5
INCOME
ON-TIME COMPLETION
(Same Campus/Degree Level)
TOTAL COMPLETION
WITHIN 8 YEARS
1-YEAR DIFFERENCE(2005-2006 cohorts)
All Students 8.7% 45.1% -4.0
Frank O’Bannon 9.4% 56.6% +0.1
21st Century Scholars 9.5% 50.8% +3.0
Pell 6.7% 38.3% -3.1
Federal Loan 5.7% 42.4% -3.8
RACE/ETHNICITY
ON-TIME COMPLETION
(Same Campus/Degree Level)
TOTAL COMPLETION
WITHIN 8 YEARS
1-YEAR DIFFERENCE(2005-2006 cohorts)
Asians Supp. Supp. Supp.
Black 0.0%* 26.9%* -4.7*
Hispanic 6.7%* 33.3%* -21.2*
White 9.1% 46.8% -3.1
Other 7.7%* 23.1%* -24.1*
Footnote: Represents bachelor’s-seeking students who started in Fall 2006. Frank O’Bannon and the 21st Century Scholars are need-based financial aid programs. Other includes Native American/Alaskan Native, Native Hawaiian/Pacific Islander, Multiracial, and undeclared. Suppressed (supp.) indicates that there were fewer than 10 students in this group and that the data had to be suppressed for privacy reasons. (*) Indicates there were fewer than 30 students in this group, which means that the percentage is subject to fluctuation from year-to-year and the statistical power is diminished.
Traditional college graduation rates—which only account for students starting and finishing at the same campus—are a good indicator of a college’s effectiveness. Yet, a closer look at Indiana’s completion challenge reveals a more complex picture with many students taking longer to graduate, transferring to other colleges and earning other degrees and credentials.
An additonal year of college can cost Hoosiers nearly $50,000 in extra tuition, lost wages and related costs.
Indiana University-Southeast
29

on-time Completion Trends
ON-TIME COMPLETION GAPSon-time graduation rates for full-time indiana four-year college students who started in...
2015 Indiana College Completion Report
Dashboard, Gap & Trends
Students who started college in...
sam
e cam
pus,
sam
e deg
ree L
evel
2005 20105-YEAR
CHANGE
All Students (Four-Year) 29.5% 36.1% +6.7
All Students This College 8.1% 12.0% +3.9
For students at this college who receive financial aid
Frank O’Bannon 5.2% 12.7% +7.5
21st Century Scholars 6.1% 11.2% +5.1
Pell 2.9% 8.0% +5.1
Federal Loans 6.5% 9.1% +2.6
For students at this college by race/ethnicity
Asian Supp. Supp. Supp.
Black 0.0%* 2.0% +2.0*
Hispanic 9.1%* 15.8%* +6.7*
White 8.1% 13.3% +5.1
Other 11.1% 0.0% -11.1
Footnote: Represents bachelor’s-seeking students starting as full-time students. Frank O’Bannon and the 21st Century Scholars are need-based financial aid programs. Other includes Native American/Alaskan Native, Native Hawaiian/Pacific Islander, Multiracial, and undeclared. Suppressed (supp.) indicates that there were fewer than 10 students in this group and that the data had to be suppressed for privacy reasons. (*) Indicates there were fewer than 30 students in this group, which means that the percentage is subject to fluctuation from year-to-year and the statistical power is diminished.
PAYING FOR WHAT WE VALUE
PERFORMANCE FUNDING FOR INDIANA COLLEGES: Indiana is widely recognized as a national leader for a performance-based funding formula that rewards public colleges for producing more quality degrees and on-time graduates. The result: the rate of improvement in key performance metrics—including overall degree completion and degree completion for at-risk students—has more
than doubled. CREDIT COMPLETION FOR INDIANA STUDENTS: In 2013, Indiana passed landmark financial aid reform legislation that promotes college completion and rewards students for staying on track to graduate on time. The result: Indiana has seen double-digit improvements in the percentage of college students taking—and completing—the minimum number of courses needed to graduate on time.
0%
10%
20%
30%
40%
50%
60%
70%
201020092008200720062005
This College
Statewide - Four-Year Colleges
Indiana University-Southeast
SAME CAMPUS, SAME DEGREE LEVEL
30
College completion Report
Indiana UniversityThe rate at which full-time students complete
college within two year for an associate degree and four years for a bachelor’s degree is
increasing:
1Completion dashboardStudents who started college in 2006
the completion gapfull-time Students who started college in 2006
2015 Indiana College Completion Report
Dashboard, Gap & Trends
SAME CAMPUS AND DEGREE
LEVEL
DIFFERENT CAMPUS OR
DEGREE LEVEL
TOTAL COMPLETION
1-YEAR DIFFERENCE(2005-2006 cohorts)
Full-Time Students
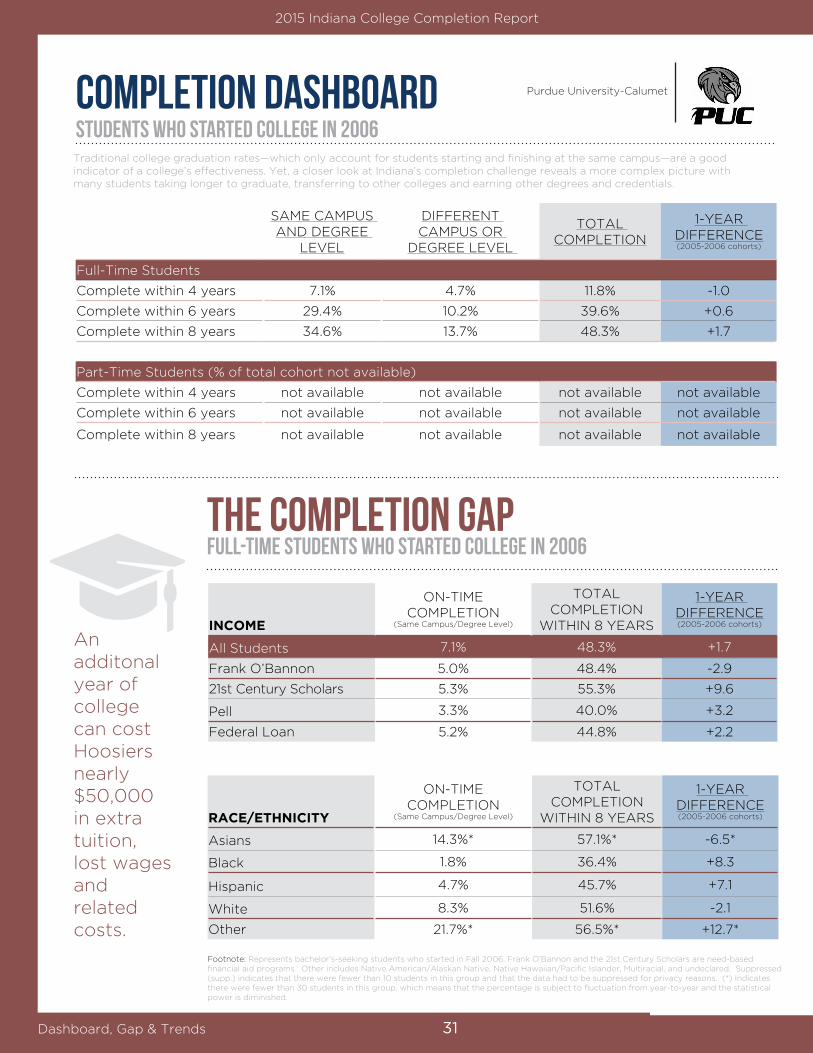
Complete within 4 years 7.1% 4.7% 11.8% -1.0
Complete within 6 years 29.4% 10.2% 39.6% +0.6
Complete within 8 years 34.6% 13.7% 48.3% +1.7
Part-Time Students (% of total cohort not available)
Complete within 4 years not available not available not available not available
Complete within 6 years not available not available not available not available
Complete within 8 years not available not available not available not available
INCOME
ON-TIME COMPLETION
(Same Campus/Degree Level)
TOTAL COMPLETION
WITHIN 8 YEARS
1-YEAR DIFFERENCE(2005-2006 cohorts)
All Students 7.1% 48.3% +1.7
Frank O’Bannon 5.0% 48.4% -2.9
21st Century Scholars 5.3% 55.3% +9.6
Pell 3.3% 40.0% +3.2
Federal Loan 5.2% 44.8% +2.2
RACE/ETHNICITY
ON-TIME COMPLETION
(Same Campus/Degree Level)
TOTAL COMPLETION
WITHIN 8 YEARS
1-YEAR DIFFERENCE(2005-2006 cohorts)
Asians 14.3%* 57.1%* -6.5*
Black 1.8% 36.4% +8.3
Hispanic 4.7% 45.7% +7.1
White 8.3% 51.6% -2.1
Other 21.7%* 56.5%* +12.7*
Footnote: Represents bachelor’s-seeking students who started in Fall 2006. Frank O’Bannon and the 21st Century Scholars are need-based financial aid programs. Other includes Native American/Alaskan Native, Native Hawaiian/Pacific Islander, Multiracial, and undeclared. Suppressed (supp.) indicates that there were fewer than 10 students in this group and that the data had to be suppressed for privacy reasons. (*) Indicates there were fewer than 30 students in this group, which means that the percentage is subject to fluctuation from year-to-year and the statistical power is diminished.
Traditional college graduation rates—which only account for students starting and finishing at the same campus—are a good indicator of a college’s effectiveness. Yet, a closer look at Indiana’s completion challenge reveals a more complex picture with many students taking longer to graduate, transferring to other colleges and earning other degrees and credentials.
An additonal year of college can cost Hoosiers nearly $50,000 in extra tuition, lost wages and related costs.
Purdue University-Calumet
31

on-time Completion Trends
ON-TIME COMPLETION GAPSon-time graduation rates for full-time indiana four-year college students who started in...
2015 Indiana College Completion Report
Dashboard, Gap & Trends
Students who started college in...
sam
e cam
pus,
sam
e deg
ree L
evel
2005 20105-YEAR
CHANGE
All Students (Four-Year) 29.5% 36.1% +6.7
All Students This College 6.8% 11.8% +5.0
For students at this college who receive financial aid
Frank O’Bannon 5.5% 9.0% +3.5
21st Century Scholars 5.4% 9.2% +3.8
Pell 3.4% 8.0% +4.6
Federal Loans 5.6% 7.1% +1.5
For students at this college by race/ethnicity
Asian 9.1%* 32.6% +23.5*
Black 3.1% 2.6% -0.5
Hispanic 3.8% 8.3% +4.5
White 8.7% 14.1% +5.5
Other 0.0%* 10.9% +10.9*
Footnote: Represents bachelor’s-seeking students starting as full-time students. Frank O’Bannon and the 21st Century Scholars are need-based financial aid programs. Other includes Native American/Alaskan Native, Native Hawaiian/Pacific Islander, Multiracial, and undeclared. Suppressed (supp.) indicates that there were fewer than 10 students in this group and that the data had to be suppressed for privacy reasons. (*) Indicates there were fewer than 30 students in this group, which means that the percentage is subject to fluctuation from year-to-year and the statistical power is diminished.
PAYING FOR WHAT WE VALUE
PERFORMANCE FUNDING FOR INDIANA COLLEGES: Indiana is widely recognized as a national leader for a performance-based funding formula that rewards public colleges for producing more quality degrees and on-time graduates. The result: the rate of improvement in key performance metrics—including overall degree completion and degree completion for at-risk students—has more
than doubled. CREDIT COMPLETION FOR INDIANA STUDENTS: In 2013, Indiana passed landmark financial aid reform legislation that promotes college completion and rewards students for staying on track to graduate on time. The result: Indiana has seen double-digit improvements in the percentage of college students taking—and completing—the minimum number of courses needed to graduate on time.
0%
10%
20%
30%
40%
50%
60%
70%
201020092008200720062005
This College
Statewide - Four-Year Colleges
Purdue University-Calumet
SAME CAMPUS, SAME DEGREE LEVEL
32

College completion Report
Indiana UniversityThe rate at which full-time students complete
college within two year for an associate degree and four years for a bachelor’s degree is
increasing:
1Completion dashboardStudents who started college in 2006
the completion gapfull-time Students who started college in 2006
2015 Indiana College Completion Report
Dashboard, Gap & Trends
SAME CAMPUS AND DEGREE
LEVEL
DIFFERENT CAMPUS OR
DEGREE LEVEL
TOTAL COMPLETION
1-YEAR DIFFERENCE(2005-2006 cohorts)
Full-Time Students
Complete within 4 years 7.9% 9.5% 17.4% +2.5
Complete within 6 years 26.9% 13.6% 40.5% +3.1
Complete within 8 years 31.0% 16.1% 47.0% +0.8
Part-Time Students (% of total cohort not available)
Complete within 4 years not available not available not available not available
Complete within 6 years not available not available not available not available
Complete within 8 years not available not available not available not available
INCOME
ON-TIME COMPLETION
(Same Campus/Degree Level)
TOTAL COMPLETION
WITHIN 8 YEARS
1-YEAR DIFFERENCE(2005-2006 cohorts)
All Students 7.9% 47.0% +0.8
Frank O’Bannon 9.3% 53.5% -2.9
21st Century Scholars 8.3% 38.9% +5.6
Pell 3.8% 33.5% -8.2
Federal Loan 5.0% 41.2% +0.2
RACE/ETHNICITY
ON-TIME COMPLETION
(Same Campus/Degree Level)
TOTAL COMPLETION
WITHIN 8 YEARS
1-YEAR DIFFERENCE(2005-2006 cohorts)
Asians Supp. Supp. Supp.
Black 10.3%* 55.2%* +29.1*
Hispanic 3.4%* 62.1%* +25.7*
White 8.1% 45.7% -1.7
Other Supp. Supp. Supp.
Footnote: Represents bachelor’s-seeking students who started in Fall 2006. Frank O’Bannon and the 21st Century Scholars are need-based financial aid programs. Other includes Native American/Alaskan Native, Native Hawaiian/Pacific Islander, Multiracial, and undeclared. Suppressed (supp.) indicates that there were fewer than 10 students in this group and that the data had to be suppressed for privacy reasons. (*) Indicates there were fewer than 30 students in this group, which means that the percentage is subject to fluctuation from year-to-year and the statistical power is diminished.
Traditional college graduation rates—which only account for students starting and finishing at the same campus—are a good indicator of a college’s effectiveness. Yet, a closer look at Indiana’s completion challenge reveals a more complex picture with many students taking longer to graduate, transferring to other colleges and earning other degrees and credentials.
An additonal year of college can cost Hoosiers nearly $50,000 in extra tuition, lost wages and related costs.
Purdue University-North Central
33

on-time Completion Trends
ON-TIME COMPLETION GAPSon-time graduation rates for full-time indiana four-year college students who started in...
2015 Indiana College Completion Report
Dashboard, Gap & Trends
Students who started college in...
sam
e cam
pus,
sam
e deg
ree L
evel
2005 20105-YEAR
CHANGE
All Students (Four-Year) 29.5% 36.1% +6.7
All Students This College 6.3% 7.2% +0.9
For students at this college who receive financial aid
Frank O’Bannon 6.8% 5.6% -1.2
21st Century Scholars 17.3%* 2.3% -15.1*
Pell 8.3% 4.3% -4.0
Federal Loans 2.9% 5.0% +2.1
For students at this college by race/ethnicity
Asian Supp. Supp. Supp.
Black 0.0%* 0.0%* 0.0*
Hispanic 4.5%* 0.0% -4.5*
White 6.7% 8.3% +1.5
Other Supp. Supp. Supp.
Footnote: Represents bachelor’s-seeking students starting as full-time students. Frank O’Bannon and the 21st Century Scholars are need-based financial aid programs. Other includes Native American/Alaskan Native, Native Hawaiian/Pacific Islander, Multiracial, and undeclared. Suppressed (supp.) indicates that there were fewer than 10 students in this group and that the data had to be suppressed for privacy reasons. (*) Indicates there were fewer than 30 students in this group, which means that the percentage is subject to fluctuation from year-to-year and the statistical power is diminished.
PAYING FOR WHAT WE VALUE
PERFORMANCE FUNDING FOR INDIANA COLLEGES: Indiana is widely recognized as a national leader for a performance-based funding formula that rewards public colleges for producing more quality degrees and on-time graduates. The result: the rate of improvement in key performance metrics—including overall degree completion and degree completion for at-risk students—has more
than doubled. CREDIT COMPLETION FOR INDIANA STUDENTS: In 2013, Indiana passed landmark financial aid reform legislation that promotes college completion and rewards students for staying on track to graduate on time. The result: Indiana has seen double-digit improvements in the percentage of college students taking—and completing—the minimum number of courses needed to graduate on time.
0%
10%
20%
30%
40%
50%
60%
70%
201020092008200720062005
This College
Statewide - Four-Year Colleges
Purdue University-North Central
SAME CAMPUS, SAME DEGREE LEVEL
34

College completion Report
Indiana UniversityThe rate at which full-time students complete
college within two year for an associate degree and four years for a bachelor’s degree is
increasing:
1Completion dashboardStudents who started college in 2006
the completion gapFULL-TIME Students who started AT THIS college in 2006
2015 Indiana College Completion Report
Dashboard, Gap & Trends
SAME CAMPUS AND DEGREE
LEVEL
DIFFERENT CAMPUS OR
DEGREE LEVEL
TOTAL COMPLETION
1-YEAR DIFFERENCE(2005-2006 cohorts)
Full-Time Students
Complete within 4 years 39.0% 3.9% 42.9% +1.1
Complete within 6 years 69.0% 8.4% 77.3% +0.5
Complete within 8 years 71.2% 10.5% 81.8% +0.3
Part-Time Students (% of total cohort not available)
Complete within 4 years not available not available not available not available
Complete within 6 years not available not available not available not available
Complete within 8 years not available not available not available not available
INCOME
ON-TIME COMPLETION
(Same Campus/Degree Level)
TOTAL COMPLETION
WITHIN 8 YEARS
1-YEAR DIFFERENCE(2005-2006 cohorts)
All Students 39.0% 81.8% +0.3
Frank O’Bannon 29.8% 77.8% -2.8
21st Century Scholars 27.0% 72.2% +0.9
Pell 26.9% 71.5% +0.3
Federal Loan 32.9% 78.2% -0.1
RACE/ETHNICITY
ON-TIME COMPLETION
(Same Campus/Degree Level)
TOTAL COMPLETION
WITHIN 8 YEARS
1-YEAR DIFFERENCE(2005-2006 cohorts)
Asians 35.0% 80.7% +5.6
Black 16.0% 64.8% +3.8
Hispanic 31.8% 77.0% -3.3
White 40.5% 83.2% -0.6
Other 39.6% 76.2% +6.0
Footnote: Represents bachelor’s-seeking students who started in Fall 2006. Frank O’Bannon and the 21st Century Scholars are need-based financial aid programs. Other includes Native American/Alaskan Native, Native Hawaiian/Pacific Islander, Multiracial, and undeclared. Suppressed (supp.) indicates that there were fewer than 10 students in this group and that the data had to be suppressed for privacy reasons. (*) Indicates there were fewer than 30 students in this group, which means that the percentage is subject to fluctuation from year-to-year and the statistical power is diminished.
Traditional college graduation rates—which only account for students starting and finishing at the same campus—are a good indicator of a college’s effectiveness. Yet, a closer look at Indiana’s completion challenge reveals a more complex picture with many students taking longer to graduate, transferring to other colleges and earning other degrees and credentials.
An additonal year of college can cost Hoosiers nearly $50,000 in extra tuition, lost wages and related costs.
Purdue University-West Lafayetter

on-time Completion Trends
ON-TIME COMPLETION GAPSon-time graduation rates for full-time indiana four-year college students who started in...
2015 Indiana College Completion Report
Dashboard, Gap & Trends
Students who started college in...
sam
e cam
pus,
sam
e deg
ree L
evel
2005 20105-YEAR
CHANGE
All Students (Four-Year) 29.5% 36.1% +6.7
All Students This College 37.6% 49.1% +11.5
For students at this college who receive financial aid
Frank O’Bannon 33.8% 39.5% +5.8
21st Century Scholars 32.6% 42.0% +9.4
Pell 31.1% 41.5% +10.4
Federal Loans 33.0% 45.0% +12.0
For students at this college by race/ethnicity
Asian 29.0% 43.7% +14.6
Black 18.9% 31.6% +12.8
Hispanic 26.9% 43.4% +16.5
White 39.5% 50.2% +10.7
Other 36.3% 51.4% +15.1
Footnote: Represents bachelor’s-seeking students starting as full-time students. Frank O’Bannon and the 21st Century Scholars are need-based financial aid programs. Other includes Native American/Alaskan Native, Native Hawaiian/Pacific Islander, Multiracial, and undeclared. Suppressed (supp.) indicates that there were fewer than 10 students in this group and that the data had to be suppressed for privacy reasons. (*) Indicates there were fewer than 30 students in this group, which means that the percentage is subject to fluctuation from year-to-year and the statistical power is diminished.
PAYING FOR WHAT WE VALUE
PERFORMANCE FUNDING FOR INDIANA COLLEGES: Indiana is widely recognized as a national leader for a performance-based funding formula that rewards public colleges for producing more quality degrees and on-time graduates. The result: the rate of improvement in key performance metrics—including overall degree completion and degree completion for at-risk students—has more
than doubled. CREDIT COMPLETION FOR INDIANA STUDENTS: In 2013, Indiana passed landmark financial aid reform legislation that promotes college completion and rewards students for staying on track to graduate on time. The result: Indiana has seen double-digit improvements in the percentage of college students taking—and completing—the minimum number of courses needed to graduate on time.
0%
10%
20%
30%
40%
50%
60%
70%
201020092008200720062005
This College
Statewide - Four-Year Colleges
Purdue University-West Lafayette
SAME CAMPUS, SAME DEGREE LEVEL
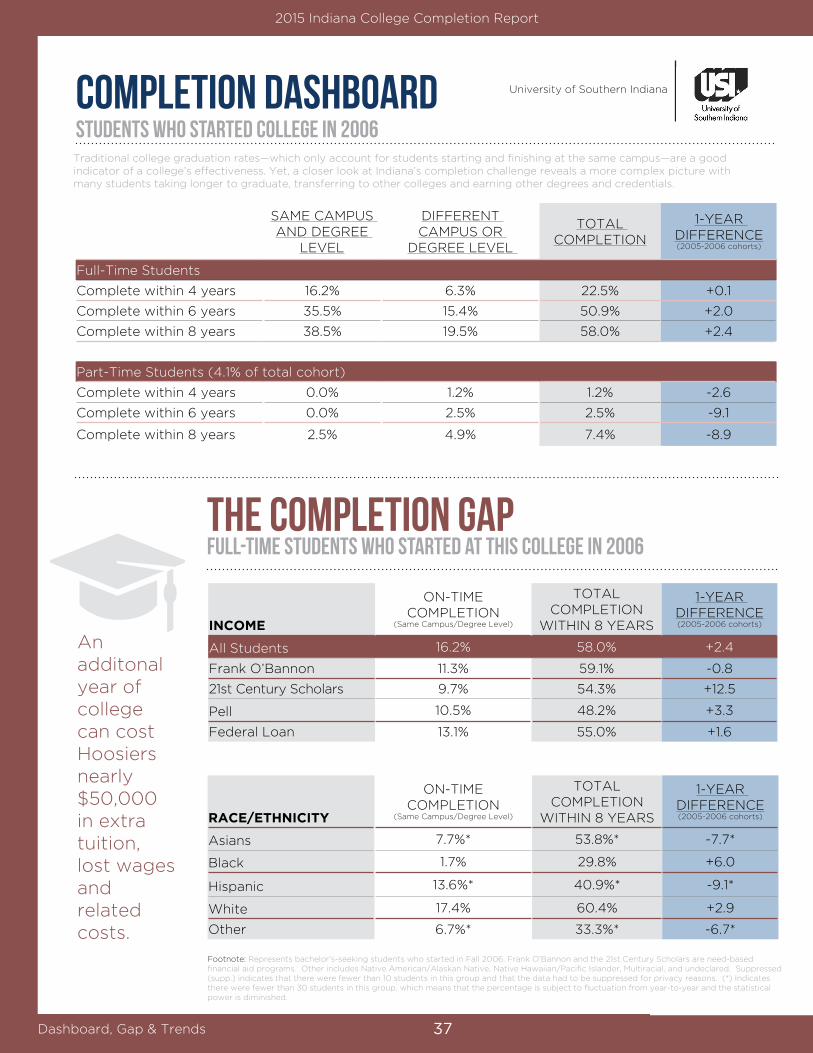
College completion Report
Indiana UniversityThe rate at which full-time students complete
college within two year for an associate degree and four years for a bachelor’s degree is
increasing:
1Completion dashboard Students who started college in 2006
the completion gapFULL-TIME Students who started AT THIS college in 2006
2015 Indiana College Completion Report
Dashboard, Gap & Trends
SAME CAMPUS AND DEGREE
LEVEL
DIFFERENT CAMPUS OR
DEGREE LEVEL
TOTAL COMPLETION
1-YEAR DIFFERENCE(2005-2006 cohorts)
Full-Time Students
Complete within 4 years 16.2% 6.3% 22.5% +0.1
Complete within 6 years 35.5% 15.4% 50.9% +2.0
Complete within 8 years 38.5% 19.5% 58.0% +2.4
Part-Time Students (4.1% of total cohort)
Complete within 4 years 0.0% 1.2% 1.2% -2.6
Complete within 6 years 0.0% 2.5% 2.5% -9.1
Complete within 8 years 2.5% 4.9% 7.4% -8.9
INCOME
ON-TIME COMPLETION
(Same Campus/Degree Level)
TOTAL COMPLETION
WITHIN 8 YEARS
1-YEAR DIFFERENCE(2005-2006 cohorts)
All Students 16.2% 58.0% +2.4
Frank O’Bannon 11.3% 59.1% -0.8
21st Century Scholars 9.7% 54.3% +12.5
Pell 10.5% 48.2% +3.3
Federal Loan 13.1% 55.0% +1.6
RACE/ETHNICITY
ON-TIME COMPLETION
(Same Campus/Degree Level)
TOTAL COMPLETION
WITHIN 8 YEARS
1-YEAR DIFFERENCE(2005-2006 cohorts)
Asians 7.7%* 53.8%* -7.7*
Black 1.7% 29.8% +6.0
Hispanic 13.6%* 40.9%* -9.1*
White 17.4% 60.4% +2.9
Other 6.7%* 33.3%* -6.7*
Footnote: Represents bachelor’s-seeking students who started in Fall 2006. Frank O’Bannon and the 21st Century Scholars are need-based financial aid programs. Other includes Native American/Alaskan Native, Native Hawaiian/Pacific Islander, Multiracial, and undeclared. Suppressed (supp.) indicates that there were fewer than 10 students in this group and that the data had to be suppressed for privacy reasons. (*) Indicates there were fewer than 30 students in this group, which means that the percentage is subject to fluctuation from year-to-year and the statistical power is diminished.
Traditional college graduation rates—which only account for students starting and finishing at the same campus—are a good indicator of a college’s effectiveness. Yet, a closer look at Indiana’s completion challenge reveals a more complex picture with many students taking longer to graduate, transferring to other colleges and earning other degrees and credentials.
An additonal year of college can cost Hoosiers nearly $50,000 in extra tuition, lost wages and related costs.
University of Southern Indiana
37

on-time Completion Trends
ON-TIME COMPLETION GAPSon-time graduation rates for full-time indiana four-year college students who started in...
2015 Indiana College Completion Report
Dashboard, Gap & Trends
Students who started college in...
sam
e cam
pus,
sam
e deg
ree L
evel
2005 20105-YEAR
CHANGE
All Students (Four-Year) 29.5% 36.1% +6.7
All Students This College 15.3% 18.7% +3.4
For students at this college who receive financial aid
Frank O’Bannon 12.1% 15.0% +2.9
21st Century Scholars 9.7% 14.5% +4.8
Pell 8.2% 12.5% +4.3
Federal Loans 12.1% 16.7% +4.6
For students at this college by race/ethnicity
Asian 15.4%* 18.2%* +2.8*
Black 3.8% 3.5% -0.3
Hispanic 11.1%* 12.5% +1.4*
White 16.1% 20.6% +4.6
Other 10.0%* 7.1% -2.9*
Footnote: Represents bachelor’s-seeking students starting as full-time students. Frank O’Bannon and the 21st Century Scholars are need-based financial aid programs. Other includes Native American/Alaskan Native, Native Hawaiian/Pacific Islander, Multiracial, and undeclared. Suppressed (supp.) indicates that there were fewer than 10 students in this group and that the data had to be suppressed for privacy reasons. (*) Indicates there were fewer than 30 students in this group, which means that the percentage is subject to fluctuation from year-to-year and the statistical power is diminished.
PAYING FOR WHAT WE VALUE
PERFORMANCE FUNDING FOR INDIANA COLLEGES: Indiana is widely recognized as a national leader for a performance-based funding formula that rewards public colleges for producing more quality degrees and on-time graduates. The result: the rate of improvement in key performance metrics—including overall degree completion and degree completion for at-risk students—has more
than doubled. CREDIT COMPLETION FOR INDIANA STUDENTS: In 2013, Indiana passed landmark financial aid reform legislation that promotes college completion and rewards students for staying on track to graduate on time. The result: Indiana has seen double-digit improvements in the percentage of college students taking—and completing—the minimum number of courses needed to graduate on time.
0%
10%
20%
30%
40%
50%
60%
70%
201020092008200720062005
This College
Statewide - Four-Year Colleges
University of Southern Indiana
SAME CAMPUS, SAME DEGREE LEVEL
38

College completion Report
Indiana UniversityThe rate at which full-time students complete
college within two year for an associate degree and four years for a bachelor’s degree is
increasing:
1Completion dashboardStudents who started college in 2008
the completion gapfull-time Students who started at this college in 2008
2015 Indiana College Completion Report
Dashboard, Gap & Trends
INCOME
ON-TIME COMPLETION
(Same Campus/Degree Level)
TOTAL COMPLETION
WITHIN 6 YEARS
1-YEAR DIFFERENCE(2007-2008 cohorts)
All Students 3.3% 25.9% -1.7
Frank O’Bannon 3.6% 32.8% -1.3
21st Century Scholars 2.0% 25.9% +1.4
Pell 3.2% 23.5% +0.1
Federal Loan 4.3% 26.4% -0.1
RACE/ETHNICITY
ON-TIME COMPLETION
(Same Campus/Degree Level)
TOTAL COMPLETION
WITHIN 6 YEARS
1-YEAR DIFFERENCE(2007-2008 cohorts)
Asians 1.4% 27.0% -8.7
Black 1.1% 13.5% -2.2
Hispanic 2.2% 23.1% -3.7
White 3.8% 28.2% -1.4
Other 1.9% 21.7% -2.2
Footnote: Represents certificate and associate-seeking students who started in fall 2008. Frank O’Bannon and the 21st Century Scholars are need-based financial aid programs. Other includes Native American/Alaskan Native, Native Hawaiian/Pacific Islander, Multiracial, and undeclared. Suppressed (supp.) indicates that there were fewer than 10 students in this group and that the data had to be suppressed for privacy reasons. (*) Indicates there were fewer than 30 students in this group, which means that the percentage is subject to fluctuation from year-to-year and the statistical power is diminished.
*Due to reporting discrepancies, 2007 cohort part-time data are provided for Ivy Tech. The one year difference for part-time is for the 2006-2007 cohorts.
Traditional college graduation rates—which only account for students starting and finishing at the same campus—are a good indicator of a college’s effectiveness. Yet, a closer look at Indiana’s completion challenge reveals a more complex picture with many students taking longer to graduate, transferring to other colleges and earning other degrees and credentials.
An additonal year of college can cost Hoosiers nearly $50,000 in extra tuition, lost wages and related costs.
SAME CAMPUS AND DEGREE
LEVEL
DIFFERENT CAMPUS OR
DEGREE LEVEL
TOTAL COMPLETION
1-YEAR DIFFERENCE(2007-2008 cohorts)
Full-Time Students
Complete within 2 years 3.3% 1.4% 4.7% -0.5
Complete within 3 years 10.0% 2.7% 12.7% -0.7
Complete within 6 years 17.3% 8.7% 25.9% -1.7
Part-Time Students (49.1% of total cohort)
Complete within 2 years 1.4% 0.7% 2.1% -0.5
Complete within 3 years 4.6% 1.5% 6.1% +0.1
Complete within 6 years 15.6% 5.2% 20.8% +0.7
Ivy Tech Community College
39

on-time Completion Trends
ON-TIME COMPLETION GAPSon-time graduation rates for full-time indiana two-year college students who started in...
2015 Indiana College Completion Report
Dashboard, Gap & Trends
Students who started college in...
sam
e cam
pus,
sam
e deg
ree L
evel
2007 20125-YEAR
CHANGE
All Students (Two-Year) 5.1% 5.9% +0.8
All Students This Campus 3.8% 4.0% +0.3
For students at this college who rely on financial aid
Frank O’Bannon 3.5% 4.0% +0.4
21st Century Scholars 2.5% 3.1% +0.6
Pell 2.8% 2.7% -0.1
Federal Loans 3.7% 1.9% -1.8
For students at this college by race/ethnicity
Asian 1.8% 5.6% +3.8
Black 1.1% 1.8% +0.7
Hispanic 3.9% 4.8% +0.9
White 4.3% 4.2% -0.1
Other 2.0% 5.8% +3.8
Footnote: Represents certificate and associate-seeking students starting as full-time students. Frank O’Bannon and the 21st Century Scholars are need-based financial aid pro-grams. Other includes Native American/Alaskan Native, Native Hawaiian/Pacific Islander, Multiracial, and undeclared. Suppressed (supp.) indicates that there were fewer than 10 students in this group and that the data had to be suppressed for privacy reasons. (*) Indicates there were fewer than 30 students in this group, which means that the percentage is subject to fluctuation from year-to-year and the statistical power is diminished.
PAYING FOR WHAT WE VALUE
PERFORMANCE FUNDING FOR INDIANA COLLEGES: Indiana is widely recognized as a national leader for a performance-based funding formula that rewards public colleges for pro-ducing more quality degrees and on-time graduates. The result: the rate of improvement in key performance metrics—including overall degree completion and degree completion for at-risk students—has more
than doubled. CREDIT COMPLETION FOR INDIANA STUDENTS: In 2013, Indiana passed landmark financial aid reform legislation that promotes college completion and rewards students for staying on track to graduate on time. The result: Indiana has seen double-digit improvements in the percentage of college students taking—and completing—the minimum number of courses needed to graduate on time.
0%
10%
20%
30%
40%
50%
60%
70%
201220112010200920082007
This College
Statewide - Two-Year Colleges
Ivy Tech Community College
SAME CAMPUS, SAME DEGREE LEVEL
40

College completion Report
Indiana UniversityThe rate at which full-time students complete
college within two year for an associate degree and four years for a bachelor’s degree is
increasing:
1Completion dashboardStudents who started college in 2008
the completion gapfull-time Students who started at this college in 2008
2015 Indiana College Completion Report
Dashboard, Gap & Trends
INCOME
ON-TIME COMPLETION
(Same Campus/Degree Level)
TOTAL COMPLETION
WITHIN 6 YEARS
1-YEAR DIFFERENCE(2007-2008 cohorts)
All Students 13.3% 32.5% +1.0
Frank O’Bannon 9.8% 34.1% +1.4
21st Century Scholars 11.9% 37.4% +5.7
Pell 8.6% 25.7% +1.9
Federal Loan 10.6% 28.2% -1.4
RACE/ETHNICITY
ON-TIME COMPLETION
(Same Campus/Degree Level)
TOTAL COMPLETION
WITHIN 6 YEARS
1-YEAR DIFFERENCE(2007-2008 cohorts)
Asians 0.0%* 27.3%* -47.7*
Black 2.2% 11.6% +4.1
Hispanic 6.1% 18.2% +2.4
White 16.0% 38.3% +1.8
Other 13.3% 23.7% +7.5
Footnote: Represents certificate and associate-seeking students who started in fall 2008. Frank O’Bannon and the 21st Century Scholars are need-based financial aid programs. Other includes Native American/Alaskan Native, Native Hawaiian/Pacific Islander, Multiracial, and undeclared. Suppressed (supp.) indicates that there were fewer than 10 students in this group and that the data had to be suppressed for privacy reasons. (*) Indicates there were fewer than 30 students in this group, which means that the percentage is subject to fluctuation from year-to-year and the statistical power is diminished.
Traditional college graduation rates—which only account for students starting and finishing at the same campus—are a good indicator of a college’s effectiveness. Yet, a closer look at Indiana’s completion challenge reveals a more complex picture with many students taking longer to graduate, transferring to other colleges and earning other degrees and credentials.
An additonal year of college can cost Hoosiers nearly $50,000 in extra tuition, lost wages and related costs.
SAME CAMPUS AND DEGREE
LEVEL
DIFFERENT CAMPUS OR
DEGREE LEVEL
TOTAL COMPLETION
1-YEAR DIFFERENCE (2007-2008 cohorts)
Full-Time Students
Complete within 2 years 13.3% 0.5% 13.8% +0.5
Complete within 3 years 19.7% 1.2% 20.9% +0.6
Complete within 6 years 26.4% 6.1% 32.5% +1.0
Part-Time Students (42.9% of total cohort)
Complete within 2 years 1.8% 0.1% 1.9% +0.4
Complete within 3 years 2.7% 0.4% 3.1% +0.1
Complete within 6 years 8.4% 0.6% 9.0% +1.6
Vincennes University
41

on-time Completion Trends
ON-TIME COMPLETION GAPSon-time graduation rates for full-time indiana two-year college students who started in...
2015 Indiana College Completion Report
Dashboard, Gap & Trends
Students who started college in...
sam
e cam
pus,
sam
e deg
reE
Leve
l
2007 20125-YEAR
CHANGE
All Students (Two-Year) 5.1% 5.9% +0.8
All StudentsThis Campus 12.6% 15.6% +3.0
For students at this college who receive financial aid
Frank O’Bannon 10.1% 10.2% +0.2
21st Century Scholars 10.8% 12.1% +1.3
Pell 8.3% 9.3% +1.0
Federal Loans 12.9% 12.5% -0.3
For students at this college by race/ethnicity
Asian Supp. 0.0% Supp.
Black 1.9% 2.5% +0.6
Hispanic 0.0%* 2.7% +2.7*
White 14.7% 18.8% +4.1
Other 8.8% 15.0% +6.2
Footnote: Represents certificate and associate-seeking students starting as full-time students. Frank O’Bannon and the 21st Century Scholars are need-based financial aid pro-grams. Other includes Native American/Alaskan Native, Native Hawaiian/Pacific Islander, Multiracial, and undeclared. Suppressed (supp.) indicates that there were fewer than 10 students in this group and that the data had to be suppressed for privacy reasons. (*) Indicates there were fewer than 30 students in this group, which means that the percentage is subject to fluctuation from year-to-year and the statistical power is diminished.
PAYING FOR WHAT WE VALUE
PERFORMANCE FUNDING FOR INDIANA COLLEGES: Indiana is widely recognized as a national leader for a performance-based funding formula that rewards public colleges for producing more quality degrees and on-time graduates. The result: the rate of improvement in key performance metrics—including overall degree completion and degree completion for at-risk students—has more
than doubled. CREDIT COMPLETION FOR INDIANA STUDENTS: In 2013, Indiana passed landmark financial aid reform legislation that promotes college completion and rewards students for staying on track to graduate on time. The result: Indiana has seen double-digit improvements in the percentage of college students taking—and completing—the minimum number of courses needed to graduate on time.
0%
10%
20%
30%
40%
50%
60%
70%
201220112010200920082007
This College
Statewide - Two-Year Colleges
Vincennes University
SAME CAMPUS, SAME DEGREE LEVEL
42
w2015 Indiana College Completion Report
WHAT IS THE PURPOSE OF THE COLLEGE COMPLETION REPORTS? The reports show a more complete picture of postsecondary success than traditional graduation rates, including students who earn a degree after transferring to another college and those who complete a different degree type than originally sought. These students are not included in traditional graduation rates, which typically are limited to students who start and finish at the same college and with the same degree type. By contrast, a comprehensive completion rate includes all students who earn a degree, regardless of the path or timeline they took to get there. The Completion Reports also spotlight the deeper trends behind the summary numbers, including the disparities in college completion rates among different student populations.
WHAT ARE THE KEY TAKEAWAYS FROM THIS REPORT?1. Traditional graduation rates do not provide a complete picture of student success. 2. A substantial number of Hoosier college grads finish at a different college than where they started. 3. While on-time graduation rates are improving, on-time college completion is the exception in Indiana with the majority of students taking longer to graduate. 4. Full-time student success rates are significantly higher than part-time student success rates. 5. Racial/ethnic achievement gaps in college completion rates are substantial on Indiana campuses, and larger than gaps related to financial aid status.
WHY DO COMPLETION RATES DIFFER SO MUCH BY CAMPUS? Indiana’s college campuses have different missions and admission standards and serve students with differing levels of academic preparation. As such, each higher education institution faces different challenges in its efforts to improve completion rates and student success.When comparing completion rates, a campus is best measured against its own improvement over past performance.
WHAT IS THE SOURCE OF THE DATA IN THIS REPORT?This report relies on data submitted by Indiana colleges through the Commission’s annual data collection process as well as data from the National Student Clearinghouse. It is important to understand that this report represents a snapshot in time and looks back six years for community college campuses (to the class of students entering in
2008) and eight years for the other schools (to the class of students entering in 2006).
FREQUENTLY ASKED QUESTIONS
Frequently Asked Questions 43

w
introduction
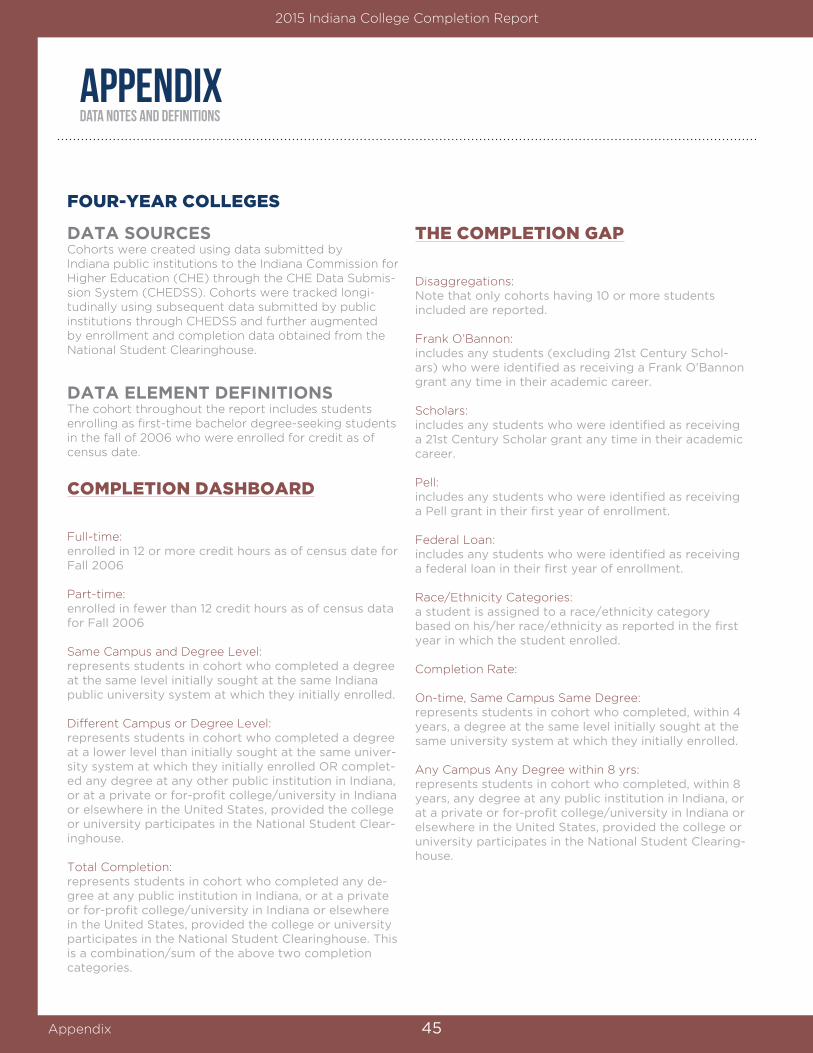
PAG
E TI
TLE
FOUR-YEAR COLLEGES
DATA SOURCESCohorts were created using data submitted by Indiana public institutions to the Indiana Commission for Higher Education (CHE) through the CHE Data Submis-sion System (CHEDSS). Cohorts were tracked longi-tudinally using subsequent data submitted by public institutions through CHEDSS and further augmented by enrollment and completion data obtained from the National Student Clearinghouse.
DATA ELEMENT DEFINITIONSThe cohort throughout the report includes students enrolling as first-time bachelor degree-seeking students in the fall of 2006 who were enrolled for credit as of census date.
COMPLETION DASHBOARD
Full-time: enrolled in 12 or more credit hours as of census date for Fall 2006
Part-time: enrolled in fewer than 12 credit hours as of census data for Fall 2006
Same Campus and Degree Level: represents students in cohort who completed a degree at the same level initially sought at the same Indiana public university system at which they initially enrolled.
Different Campus or Degree Level: represents students in cohort who completed a degree at a lower level than initially sought at the same univer-sity system at which they initially enrolled OR complet-ed any degree at any other public institution in Indiana, or at a private or for-profit college/university in Indiana or elsewhere in the United States, provided the college or university participates in the National Student Clear-inghouse.
Total Completion: represents students in cohort who completed any de-gree at any public institution in Indiana, or at a private or for-profit college/university in Indiana or elsewhere in the United States, provided the college or university participates in the National Student Clearinghouse. This is a combination/sum of the above two completion categories.
THE COMPLETION GAP
Disaggregations:Note that only cohorts having 10 or more students included are reported.
Frank O’Bannon: includes any students (excluding 21st Century Schol-ars) who were identified as receiving a Frank O’Bannon grant any time in their academic career.
Scholars: includes any students who were identified as receiving a 21st Century Scholar grant any time in their academic career.
Pell: includes any students who were identified as receiving a Pell grant in their first year of enrollment.
Federal Loan: includes any students who were identified as receiving a federal loan in their first year of enrollment.
Race/Ethnicity Categories: a student is assigned to a race/ethnicity category based on his/her race/ethnicity as reported in the first year in which the student enrolled.
Completion Rate:
On-time, Same Campus Same Degree: represents students in cohort who completed, within 4 years, a degree at the same level initially sought at the same university system at which they initially enrolled.
Any Campus Any Degree within 8 yrs: represents students in cohort who completed, within 8 years, any degree at any public institution in Indiana, or at a private or for-profit college/university in Indiana or elsewhere in the United States, provided the college or university participates in the National Student Clearing-house.
appendixdata notes and definitions
2015 Indiana College Completion Report
Appendix 45
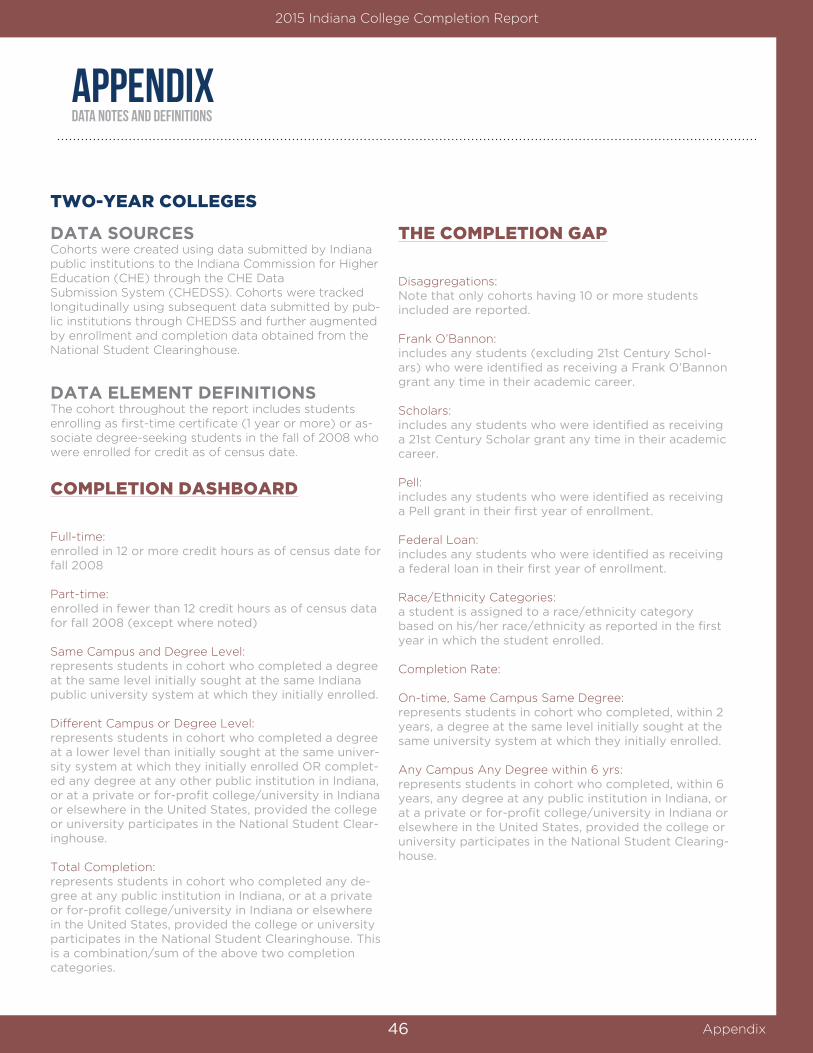
PAG
E TI
TLE
TWO-YEAR COLLEGES
DATA SOURCESCohorts were created using data submitted by Indiana public institutions to the Indiana Commission for Higher Education (CHE) through the CHE Data Submission System (CHEDSS). Cohorts were tracked longitudinally using subsequent data submitted by pub-lic institutions through CHEDSS and further augmented by enrollment and completion data obtained from the National Student Clearinghouse.
DATA ELEMENT DEFINITIONSThe cohort throughout the report includes students enrolling as first-time certificate (1 year or more) or as-sociate degree-seeking students in the fall of 2008 who were enrolled for credit as of census date.
COMPLETION DASHBOARD
Full-time: enrolled in 12 or more credit hours as of census date for fall 2008
Part-time: enrolled in fewer than 12 credit hours as of census data for fall 2008 (except where noted)
Same Campus and Degree Level: represents students in cohort who completed a degree at the same level initially sought at the same Indiana public university system at which they initially enrolled.
Different Campus or Degree Level: represents students in cohort who completed a degree at a lower level than initially sought at the same univer-sity system at which they initially enrolled OR complet-ed any degree at any other public institution in Indiana, or at a private or for-profit college/university in Indiana or elsewhere in the United States, provided the college or university participates in the National Student Clear-inghouse.
Total Completion: represents students in cohort who completed any de-gree at any public institution in Indiana, or at a private or for-profit college/university in Indiana or elsewhere in the United States, provided the college or university participates in the National Student Clearinghouse. This is a combination/sum of the above two completion categories.
THE COMPLETION GAP
Disaggregations:Note that only cohorts having 10 or more students included are reported.
Frank O’Bannon: includes any students (excluding 21st Century Schol-ars) who were identified as receiving a Frank O’Bannon grant any time in their academic career.
Scholars: includes any students who were identified as receiving a 21st Century Scholar grant any time in their academic career.
Pell: includes any students who were identified as receiving a Pell grant in their first year of enrollment.
Federal Loan: includes any students who were identified as receiving a federal loan in their first year of enrollment.
Race/Ethnicity Categories: a student is assigned to a race/ethnicity category based on his/her race/ethnicity as reported in the first year in which the student enrolled.
Completion Rate:
On-time, Same Campus Same Degree:represents students in cohort who completed, within 2 years, a degree at the same level initially sought at the same university system at which they initially enrolled.
Any Campus Any Degree within 6 yrs:represents students in cohort who completed, within 6 years, any degree at any public institution in Indiana, or at a private or for-profit college/university in Indiana or elsewhere in the United States, provided the college or university participates in the National Student Clearing-house.
2015 Indiana College Completion Report
Appendix
appendixdata notes and definitions
46