indias youngest maharatna investors & analysts · pdf fileindias youngest maharatna...
TRANSCRIPT

1
GAIL (India) Ltd. India’s Youngest Maharatna
Investors & Analysts Meet May 23, 2017, Mumbai

Safe Harbor Statement
This presentation has been prepared by GAIL (India) Ltd (Company or GAIL) solely for providing information about the Company. The information contained in this presentation is only current as of its date. Certain statements made in this presentation may not be based on historical information or facts and may be "forward-looking statements", including those relating to the Company’s general business plans and strategy, its future financial condition and growth prospects, and future developments in its industry and its competitive and regulatory environment. Actual results may differ materially from these forward-looking statements due to a number of factors, including future changes or developments in the Company’s business, its competitive environment, information technology and political, economic, legal and social conditions in India. This communication is for general information purposes only, without regard to specific objectives, financial situations and needs of any particular person. Company do not accept any liability whatsoever, direct or indirect, that may arise from the use of the information herein. The Company may alter, modify or otherwise change in any manner the content of this presentation, without obligation to notify any person of such revision or changes
2

Agenda
Introduction
Performance Highlights
Industry Outlook & Strategy
Q&A

4
Introduction

Overview: GAIL (India) Ltd.
5
• Over 11,000 Km of network (206MMSCMD)
• Pursuing for expansion, Participation in RGPPL (5 MMTPA LNG Regasification Facility)
• Long-term Import Portfolio: 24 MMTPA
• Domestic market share ~ 15%
• Petrochemical Plant in Pata( UP) with capacity of 0.81 MMTPA
• 6 Gas Processing Plants producing LPG, Propane, Pentane, Naphtha etc.
• LPG Transport Capacity 3.8 MMTPA (2038 Km.)
• A part of vertical integration
• Participation in 12 blocks (operator-1 blocks)
• Presence in Myanmar & US
• 118 MW Wind Power Plant and 5 MW Solar Power Plant
• Participation in RGPPL (Capacity 1967 MW)
Operates
3/4th
of the total NG transmission in India
Contribute s more than
3/5th
of the natural gas sold in India
Produces
1/5th
of the polyethylene produced in India
Responsible for
1/6th
of India’s total LPG transmission
Produces every
20th
LPG Cylinder
in India
Supplies gas for about
3/5th
of India’s fertilizer produced
Supplies gas for about
3/4th
of India’s gas based power
Operating more than
2/3rd
of India’s total CNG stations

GAIL’s Sustainability Aspiration 2020
#HawaBadlo
Target of 33% reduction in GHG emission intensity from the base of FY2010-11
Target of 5% reduction in specific energy consumption(petrochemical & LHC segment product)
Target of 45% reduction in water consumption intensity from the base of FY2010-11
Target of increasing waste water recycling by 5% of waste water generated
Target of imparting sustainability awareness training to 100% of employees

GAIL HRIDAY: Corporate Social Responsibility
UJJAWAL (Education)
SASHAKT (Women empowerment)
HARIT (Environment projects)
SAKSHAM (Care for elderly & differently abled)
UNNATI (Rural Dev.)
AROGYA (Health)
KAUSHAL (Skill Dev.)
SWACHH BHARAT
Over 8 Lac lives touched by various initiatives taken up in 2016-17
Over 6000 candidates skilled through various Livelihood Generation and Skill Development Initiatives
Preventive Healthcare Extended to in over 420 villages
(covering ~4.5 Lac people through 32 Mobile Medical Units)
Construction/Renovation of 3614 toilets with water facility under “Swachh Bharat, Swachh Vidyalaya” program
Project GAIL Indian Speedstar: 09 athletes selected to provide training for Olympics 2020
CSR spending for FY 2016-17 ~Rs. 124 crore
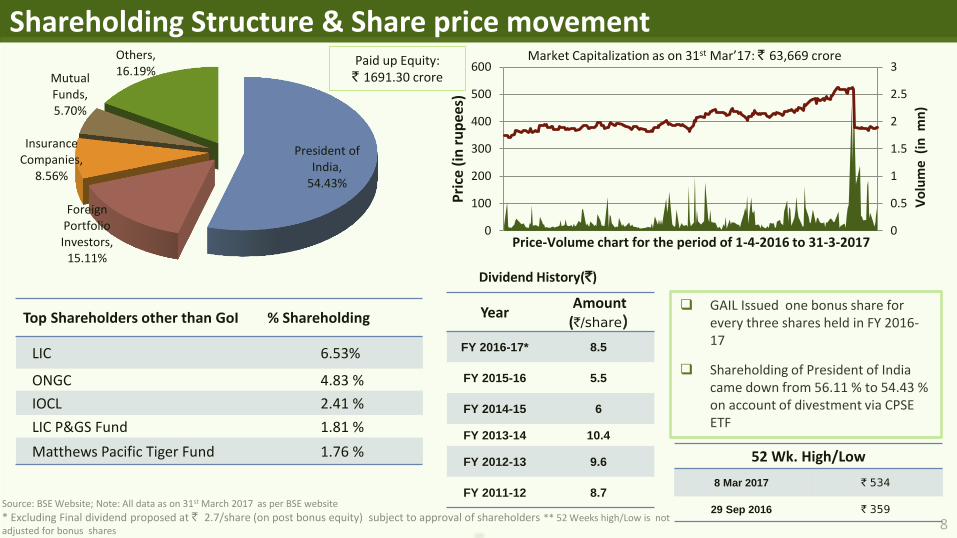
Shareholding Structure & Share price movement
President of India,
54.43%
Foreign Portfolio Investors,
15.11%
Insurance Companies,
8.56%
Mutual Funds, 5.70%
Others, 16.19%
Top Shareholders other than GoI % Shareholding
LIC 6.53%
ONGC 4.83 %
IOCL 2.41 %
LIC P&GS Fund 1.81 %
Matthews Pacific Tiger Fund 1.76 %
Source: BSE Website; Note: All data as on 31st March 2017 as per BSE website
* Excluding Final dividend proposed at ` 2.7/share (on post bonus equity) subject to approval of shareholders ** 52 Weeks high/Low is not adjusted for bonus shares 8
Year Amount (`/share)
FY 2016-17* 8.5
FY 2015-16 5.5
FY 2014-15 6
FY 2013-14 10.4
FY 2012-13 9.6
FY 2011-12 8.7
Dividend History(`)
0
0.5
1
1.5
2
2.5
3
0
100
200
300
400
500
600
Vo
lum
e (
in m
n)
Pri
ce (
in r
up
ees)
Price-Volume chart for the period of 1-4-2016 to 31-3-2017
GAIL Issued one bonus share for every three shares held in FY 2016-17
Shareholding of President of India came down from 56.11 % to 54.43 % on account of divestment via CPSE ETF
52 Wk. High/Low
8 Mar 2017 ` 534
29 Sep 2016 ` 359
Paid up Equity: ` 1691.30 crore
Market Capitalization as on 31st Mar’17: ` 63,669 crore

9
Performance Highlights
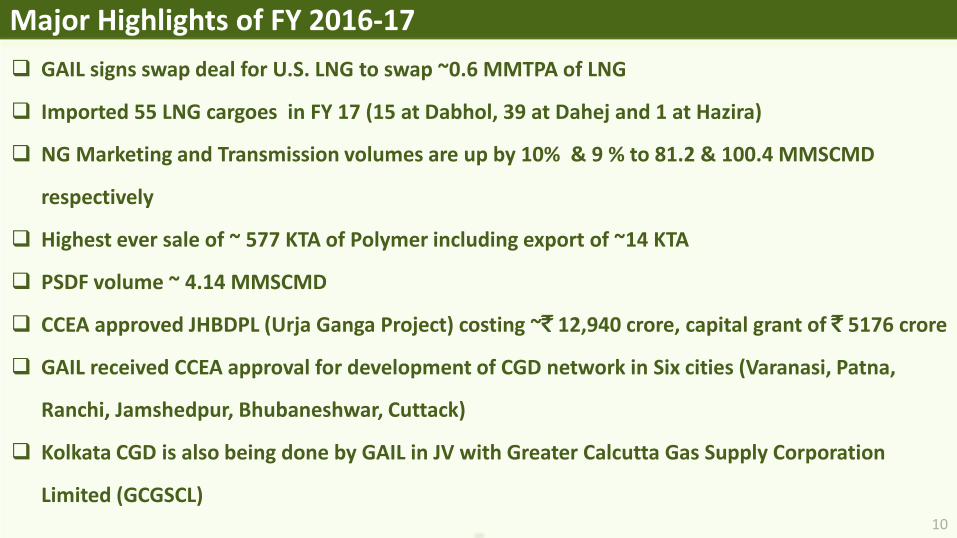
Major Highlights of FY 2016-17
10
GAIL signs swap deal for U.S. LNG to swap ~0.6 MMTPA of LNG
Imported 55 LNG cargoes in FY 17 (15 at Dabhol, 39 at Dahej and 1 at Hazira)
NG Marketing and Transmission volumes are up by 10% & 9 % to 81.2 & 100.4 MMSCMD
respectively
Highest ever sale of ~ 577 KTA of Polymer including export of ~14 KTA
PSDF volume ~ 4.14 MMSCMD
CCEA approved JHBDPL (Urja Ganga Project) costing ~` 12,940 crore, capital grant of ` 5176 crore
GAIL received CCEA approval for development of CGD network in Six cities (Varanasi, Patna,
Ranchi, Jamshedpur, Bhubaneshwar, Cuttack)
Kolkata CGD is also being done by GAIL in JV with Greater Calcutta Gas Supply Corporation
Limited (GCGSCL)

Major Highlights of FY 2016-17
11
IND-AS Implemented successfully
GAIL clocked Gross Turnover of ` 48,789 crore and PBT of ` 5,411 crore
Partial Impairment of Investment in RGPPL ` 783 crore
PNGRB revised Tariff of six pipelines i.e. KG Basin, DBPL, KKMBPL, DBNPL, CJHPL, Cauvery with positive Impact ~ `
360 crore
Turnaround in profitability of Petrochemical Segment - ` 216 crore vs. `(1,155) crore in FY16
Earned profit of ~ ` 489 crore on stakes sales in Mahanagar Gas Limited (MGL)
Total Dividend @ 5% of Networth* (subject to approval of shareholders)
Bonus Shares Issued - 1 Equity share for every 3 Equity shares
Capex of ` 2,180 crore
Loan Repayment of ` 2,938 crore
Liability of ` 94 crore pertaining to increase in Salary on account of 3rd Pay Revision Committee report (PRC) on
estimated basis is made in Q4 FY17
Provision made for increase in Salary and Gratuity ceiling (3rd Pay Revision Committee) - ~ ` 94 crore & ~ ` 149 crore

42%
34%
5%
10% 3% 6%
APM/NAPM RLNG PMT Spot Mid Term RIL
53%
22%
7%
15% 3%
Physical Performance
105 96 92 92 100 81 79 72 74 81
FY13 FY14 FY15 FY16 FY17Gas Transmission Gas Marketing
Gas Volume Trend Gas Transmission Mix
427 445 441 334
577
FY13 FY14 FY15 FY16 FY17
1,371 1,307 1277 1,085 1,082
FY13 FY14 FY15 FY16 FY17
3,136 3,145 3,093
2,819
3,362
FY13 FY14 FY15 FY16 FY17
Petrochemicals Sales Liquid Hydrocarbons Sales LPG Transmission
Gas Marketing Mix
12
(MMSCMD)
(TMT)
FY17 FY17

60% 40%
Gas Sourcing & Sector Wise Supply – FY17
12
19
11 6
16 5
1 10
Fertilisers Power CGD for CNG & PNG Others*
Imported Gas primarily consists of Long Term RLNG, Mid Term RLNG and Spot Major sources for domestic gas are ONGC( APM & Non APM), PMT at APM & PSC prices ,Ravva, Ravva satellite etc. Highest demand of Natural Gas from Power & Fertilizer companies
Domestic RLNG
13
(MMSCMD, % share)
49 MMSCMD
32 MMSCMD
* Others include Steel, Refineries, Sponge Iron, Petrochemicals, GAIL Internal consumption etc.
34% 29%
16% 21%
%age Share

Financial Performance (Standalone)
48,005 58,012 57292
52,003 48,789
FY13 FY14 FY15 FY16 FY17
Turnover (Gross) *
7,234 7,945
5620 5,172
7,287
FY13 FY14 FY15 FY16 FY17
Gross Margin* (PBDIT)
6,058 6,402
4,284
3,062
5,411
FY13 FY14 FY15 FY16 FY17
Profit Before Tax (PBT)*
4,022 4,375
3,039 2,226
3,503
FY13 FY14 FY15 FY16 FY17
Profit After Tax (PAT) *
14 *Figures from FY 16 onward are as per Ind-AS
(in ` crore)
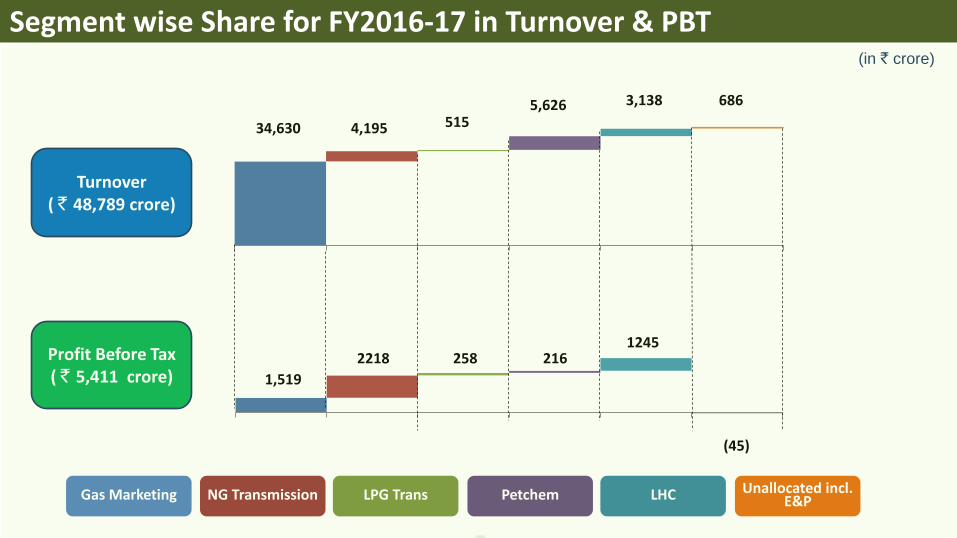
Gas Marketing NG Transmission LPG Trans Petchem LHC Unallocated incl. E&P
34,630 4,195 515 5,626 3,138 686
1,519
2218 258 216 1245
(45)
(in ` crore)
Turnover ( ` 48,789 crore)
Profit Before Tax ( ` 5,411 crore)
Segment wise Share for FY2016-17 in Turnover & PBT

Major Variance in Profitability – FY16 vs. FY17
16
Decrease in cost of Raw Material & Fuel ~ ` 1600 crore
Increase in Petrochemical Sales by 73% - Incremental Margin ~ ` 900 crore
Increase in Gas Transmission Quantity by ~ 9% led to incremental income of ~ ` 500 crore
Upward revision in Tariff of six pipeline Networks - ~ ` 360 crore
Profit from stake sale in MGL ~ ` 489 crore
Increase in Dividend Income by ~ ` 110 crore
Decrease in Finance Cost by ~ ` 320 crore
Partial Impairment of investment in RGPPL - ` 783 crore
Decrease in Avg. LHC & Avg. Petchem Price by 5% & 4% respectively in FY17 Vs. FY16 - ~ `
400 crore
Fall in E&P Revenue ~ ` 140 crore

Balance Sheet – 31.03.2017 (in ` crore)
17
Non Current Assets 47,125
Equity 38,149
Liabilities 18,121
Current Assets 9,145
Equity Share Capital 1,691
Other Equity 36,458
Non Current Liabilities
9,746
Current Liabilities
8,375
Capital Employed ` 47,868 crore
Net Worth ` 32,349 crore
Loan Outstanding ` 5,062 crore
PPE 27,763
CWIP 3,585
Investments 9,510
Others 6,767 Retained Earnings 30,995
Transition Reserve & OCI 5,463
Equity & Liabilities 56,270
Assets 56,270

Financial Profile
24,038 26,858
28,888 30,699 32,349
FY13 FY14 FY15 FY16 FY17
Net Worth (in ` crore)
35,591 39,907 41,984
47,226 47,868
FY13 FY14 FY15 FY16 FY17
Capital Employed ( in ` crore)
31,149 34,056 41,389 43,122 44,498
FY13 FY14 FY15 FY16 FY17
Gross Block (in ` crore)
7
4 3
2 2
FY13 FY14 FY15 FY16 FY17
Debt Service Coverage Ratio (DSCR)
9,064 10,268
9556 8,059
5,062
FY13 FY14 FY15 FY16 FY17
Loans ( in ` crore)
0.38 0.38 0.33
0.26
0.16
FY13 FY14 FY15 FY16 FY17
Debt to Equity Ratio
18 *Figures from FY 16 onward are as per Ind-AS, Networth as per Companies Act 2013

Financial Performance on Consolidated basis
51,738 62,599 61,429
52,355 49,237
FY13 FY14 FY15 FY16 FY17
Turnover (Gross)
8,314 9,235
6577 5,266
7,811
FY13 FY14 FY15 FY16 FY17
Gross Margin (PBDIT)
6,558 6,922
4,492
2,949
5,757
FY13 FY14 FY15 FY16 FY17
Profit Before Tax
4,374 4,786
3160
1,874
3,374
FY13 FY14 FY15 FY16 FY17
Profit after Tax
19
(in ` crore)

20
Capital Expenditure
1,144 , 53%
44 , 2% 3 , 0%
53 , 2%
336 , 15%
600 , 28%
Pipeline Petrochemical BD/PD/Marketing/Process Plants E&P Equity Investments Operational Capex
2699, 63%
96, 2%
41, 1%
66, 2%
932, 22%
427, 10%
FY16-17 ` 2,180 crore
FY17-18E ` 4,261 crore
(in ` crore)
* capital expenditure include plan, non-plan and operational capex
5734, 74% 0, 0%
209, 3%
60, 1% 1451, 19%
250, 3%
FY18-19E ` 7,704 crore

(in ` crore)
21
Capex & Source of Funds
2180
4261
7704
1500
3000
450
1200
1950
1730
1561
2754
0
1000
2000
3000
4000
5000
6000
7000
8000
9000
Capex Source of Fund Capex Source of Fund Capex Source of Fund
FY 2016-17 FY 2017-18 FY 2018-19
Capex Borrowings Grant

22
Industry Outlook

Natural Gas accounts for approximately 6.5% of total primary energy mix in India against the global average of 24%
India: 3rd largest energy consumer in the world after China and USA
Fastest growing energy consumer
Fuel Consumption India’s Global Rank
Coal 2nd
Oil 3rd
Hydel / Nuclear / Renewables 7th
Natural Gas 14th
Source: BP statistics of world energy 2016
Energy Overview

Region Oil Natural
Gas Coal
Nuclear
Energy
Hydro
electric Renewables
World 32.9% 23.8% 29.2% 4.4% 6.80% 2.8%
Asia Pacific 27.3% 11.5% 50.9% 1.7% 6.6% 2.0%
China 18.6% 5.9% 63.7% 1.3% 8.5% 2.1%
India 27.9% 6.5% 58.1% 1.2% 4.0% 2.2%
(Source: BP Statistical World energy Review, 2016)
Primary Energy Consumption
in MMSCMD
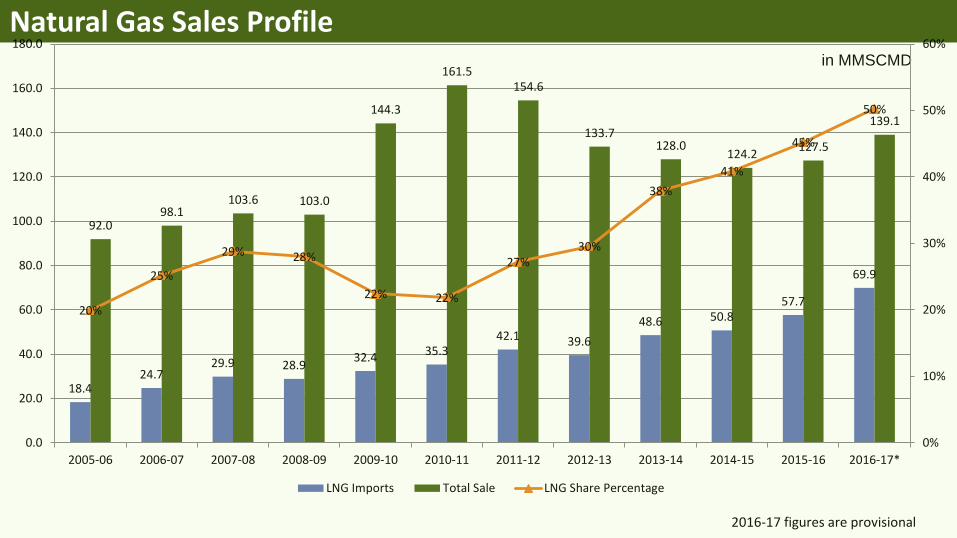
Natural Gas Sales Profile
18.4 24.7
29.9 28.9 32.4 35.3
42.1 39.6
48.6 50.8 57.7
69.9
92.0 98.1
103.6 103.0
144.3
161.5 154.6
133.7 128.0
124.2 127.5
139.1
20%
25%
29% 28%
22% 22%
27% 30%
38%
41%
45%
50%
0%
10%
20%
30%
40%
50%
60%
0.0
20.0
40.0
60.0
80.0
100.0
120.0
140.0
160.0
180.0
2005-06 2006-07 2007-08 2008-09 2009-10 2010-11 2011-12 2012-13 2013-14 2014-15 2015-16 2016-17*
LNG Imports Total Sale LNG Share Percentage
2016-17 figures are provisional

Power and Fertiliser - Anchor Markets
Industrial and City Gas - Growing Markets
Provisional Gas consumption during FY (2016-17), ~139 MMSCMD
Consumption Pattern : India
Sector-wise Break-up
Others includes Refinery, Petrochemicals, LPG, IC and Manufacturing etc.
49.70% 50.31%
Domestic
RLNG
Gas-wise Break-up
30.4%
22.9% 14.5%
1.7%
30.5%
Fertilizer
Power
City Gas
Sponge Iron+Steel
Others

Natural Gas Sales: GAIL
Others includes Refinery, Petrochemicals, LPG, IC and Manufacturing etc.
Sector-wise Break-up
34.20%
29.32%
16.01%
3.91%
16.56%
Fertilisers
Power
CGD
Steel+ SpongeIron
Others
Gas-wise Break-up
59.77%
40.23%
Domestic
RLNG

Category
Length & including Spurlines
(Km)
Design Capacity
(MMSCMD)
Existing Network
~ 16550 434
GoI authorized Pipelines
being executed by
GAIL
~ 4300 32
PNGRB authorized
Pipelines since 2011
9240 485
Pipelines yet to be
authorized 2000
24 (min.)
Total ~ 32000 975
Natural Gas GRID Network

Upcoming LNG Terminal
DAHEJ I & II
15 mmtpa
DABHOL
1.3 mmtpa
KOCHI
5 mmtpa
HAZIRA
5 mmtpa
MUNDRA
5 mmtpa
JAIGARH
4 mmtpa
Chhara
5 mmtpa
DHAMRA
5 mmtpa
ENNORE
5 mmtpa
KAKINADA
3.5 mmtpa
Existing LNG Terminal
Capacity Existing Upcoming
In MMTPA 26.3 27.5
In MMSCMD 94.6 99
Re-gasification Capacity
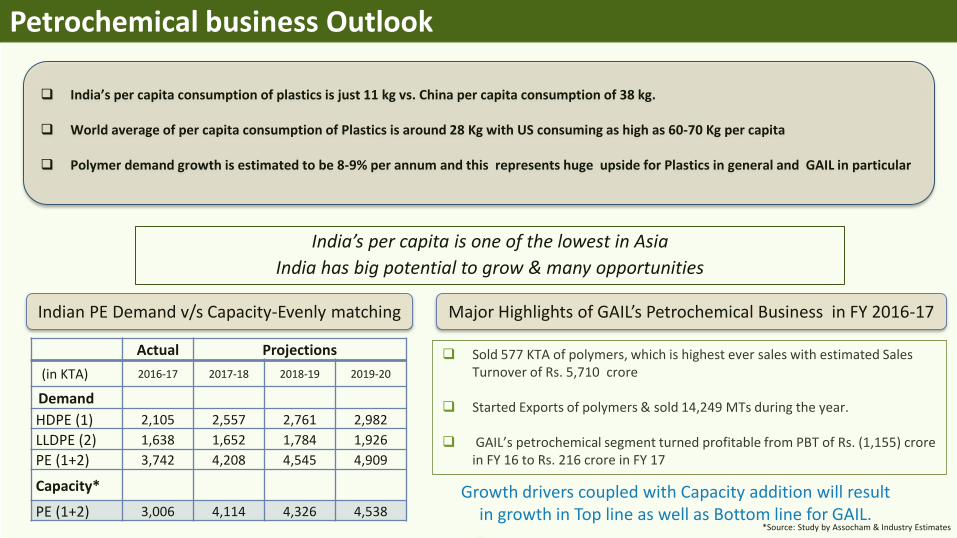
Petrochemical business Outlook
Indian PE Demand v/s Capacity-Evenly matching
India’s per capita consumption of plastics is just 11 kg vs. China per capita consumption of 38 kg.
World average of per capita consumption of Plastics is around 28 Kg with US consuming as high as 60-70 Kg per capita
Polymer demand growth is estimated to be 8-9% per annum and this represents huge upside for Plastics in general and GAIL in particular
India’s per capita is one of the lowest in Asia
India has big potential to grow & many opportunities
Actual Projections
(in KTA) 2016-17 2017-18 2018-19 2019-20
Demand
HDPE (1) 2,105 2,557 2,761 2,982
LLDPE (2) 1,638 1,652 1,784 1,926
PE (1+2) 3,742 4,208 4,545 4,909
Capacity*
PE (1+2) 3,006 4,114 4,326 4,538
Major Highlights of GAIL’s Petrochemical Business in FY 2016-17
Growth drivers coupled with Capacity addition will result in growth in Top line as well as Bottom line for GAIL.
*Source: Study by Assocham & Industry Estimates
Sold 577 KTA of polymers, which is highest ever sales with estimated Sales Turnover of Rs. 5,710 crore
Started Exports of polymers & sold 14,249 MTs during the year.
GAIL’s petrochemical segment turned profitable from PBT of Rs. (1,155) crore in FY 16 to Rs. 216 crore in FY 17

31
New Developments

2540 Km Gas pipeline project at the Cost of Rs 12940 Crore.
Govt. of India will provide Capital Grant of Rs. 5176 Crore (i.e. 40% of Rs 12940 Crore) to
GAIL.
5 States viz. Uttar Pradesh, Bihar, Jharkhand, Odisha and West Bengal, covering 40 Districts
and 2600 Villages.
Synchronized development of 7 City Gas Distribution Network (CGD) projects viz Varanasi,
Patna, Jamshedpur, Kolkata, Ranchi, Bhubaneswar and Cuttack .
For long term energy security, the first LNG Terminal in East Coast is also coming up in
Dhamra (Odisha) under a joint venture of Public and Private Sector Companies.
Revival of 3 Fertilizer Plants located at Gorakhpur, Barauni and Sindri and development of
additional new City Gas Projects in Eastern India.
Eastern India Development – Urja Ganga
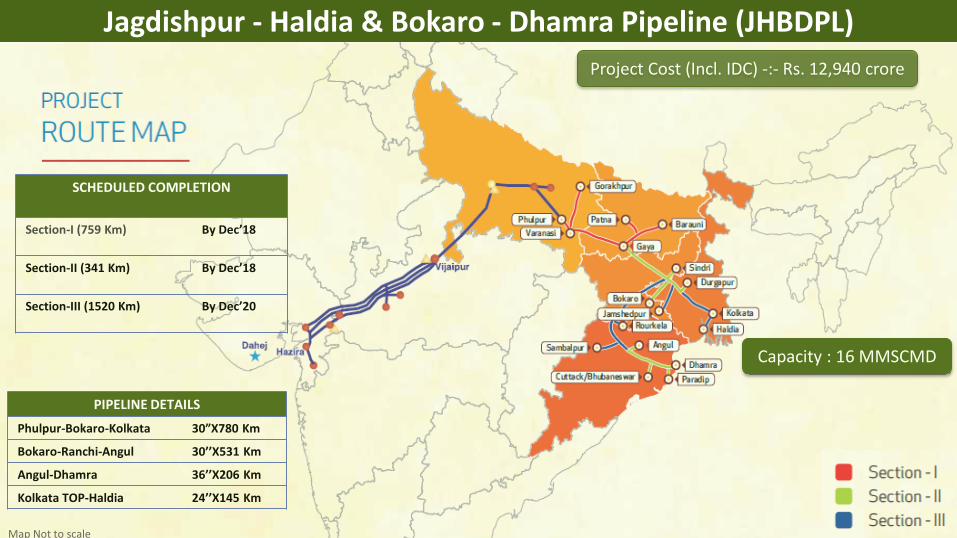
Jagdishpur - Haldia & Bokaro - Dhamra Pipeline (JHBDPL)
33
PIPELINE DETAILS
Phulpur-Bokaro-Kolkata 30”X780 Km
Bokaro-Ranchi-Angul 30’’X531 Km
Angul-Dhamra 36’’X206 Km
Kolkata TOP-Haldia 24’’X145 Km
SCHEDULED COMPLETION
Section-I (759 Km) By Dec’18
Section-II (341 Km) By Dec’18
Section-III (1520 Km) By Dec’20
Project Cost (Incl. IDC) -:- Rs. 12,940 crore
Capacity : 16 MMSCMD
Map Not to scale

Varanasi CGD CGD at Varanasi with initial investment of Rs. 350 Cr. for first five Years and Overall investment of Rs. 1000 Cr.
50000 PNG and 20000 CNG connection in 5 years.
Patna CGD CGD at Patna with initial investment of Rs. 400 Cr. for first five Years and Overall investment of Rs. 800 Cr.
58000 PNG and 20000 CNG connection in 5 years.
Ranchi & Jamshedpur CGD CGD’s with initial investment of Rs. 300 Cr. each for first 5 years and Overall investment of Rs. 800 Cr. each
58000 PNG and 20000 CNG connection in 5 years.
Bhubaneswar and Cuttack CGD CGD’s with initial investment of Rs. 350 & 400 Cr. for first 5 years and Overall investment of Rs. 800 Cr. each
49000 PNG and 45000 CNG connection in 5 years.
Kolkata CGD CGD at Kolkata with initial investment of Rs. 700 Cr. for first 5 years and Overall investment of Rs. 2500 Cr.
140000 PNG and 50000 CNG connection in 5 years.
CGD Infrastructure for Eastern India

35
Future Demand Drivers

Tax reforms
Future Growth Drivers
Air Quality Concerns – Focus on replacement of HSD & FO by CNG/NG
Gas can play an important role as a Bridging Fuel during the transition to a lower emission intensity
GDP regime
Targeted policy framework for increasing the share of natural gas in energy basket to 15%
33%-35% reduction in Emission intensity of GDP by 2030 vis-à-vis 2005 levels – COP 21 NDC.

663 751 615
193 250 150
Sales PBT
E&P: Vertical Integration Net Sales & PBT (in ` Cr.)
310 306 266
151 146 133
FY15 FY16 FY17
Total Crude Production GAIL's Share
FY15 FY16 FY17
Total NG Production GAIL's Share
1.47 0.12
FY13 FY14 FY15 FY16 FY17
37
NG Production (in BCM.)
Crude Production (in ‘000 bbl.)
Recent Key Developments 1. Hydrocarbon discoveries have been notified in two NELP-IX Blocks (Cambay
Onland and Gujarat Kutch Offshore)
2. Activities commenced as per approved Field Development Plan of Tripura Onland block
3. Drilling of 7 Exploratory Wells completed in GAIL Operated CB-ONN-2010/11 (NELP-IX) block (Gujarat)
Portfolio of 12 blocks (2 in Myanmar) Reserves (as on 1st April 2017)
Crude Oil, India (‘000 bbl) 797
Natural Gas, Myanmar (BCM)
4.92
Natural Gas, India (BCF) 52

Way Forward
38
Developing new markets to increase share of Natural Gas in primary energy mix from current 6.5% to 15% by 2030
Pipeline infrastructure expansion in East, North-East and Southern regions in synchronization with market development
Focus on Last Mile Connectivity
Advocacy for Natural Gas and Proactive role in shaping policies for gas based economy
CGD expansion through JVs / subsidiaries for additional 40-60 cities
Developing green corridor by setting up of CNG stations on National Highways/State Highways
Setting up LNG regasification terminals & booking re-gas capacities
Sourcing through transnational pipelines
Focus on Returns through disciplined capital investment and sustainable cost efficiency
Capturing opportunities in the energy’s transition to a low-carbon economy
GAIL to be an Integrated Hydrocarbon Major with significant upstream & downstream presence

16, Bhikaiji Cama Place, R.K. Puram, New Delhi-110066
www.gailonline.com
For Institutional Investors
& Analysts
Shri R C Gupta,
Executive Director (Finance & Accounts)
E-mail ID: [email protected]
For Retail Investors
Shri A K Jha,
Company Secretary
E-mail ID: [email protected]
India’s Youngest Maharatna
Our Touch Points
GAIL (India) Ltd.
39

40
Thank you