indicator 1 – graduation - nceo · web viewindicator 1: graduation rates ... conducting random...
TRANSCRIPT
Analysis of Part B State Performance Plans (SPP)
Summary Document
Compiled 9/8/06

Table of Contents
INDICATOR 1: GRADUATION RATES........................................................3INDICATOR 2: DROPOUT RATES............................................................19INDICATOR 3: ASSESSMENT..................................................................29INDICATOR 4: SUSPENSION/EXPULSION..............................................53INDICATOR 5: SCHOOL AGE LRE...........................................................59INDICATOR 6: PRESCHOOL LRE............................................................71INDICATOR 7: PRESCHOOL OUTCOMES..............................................77INDICATOR 8: PARENT INVOLVEMENT.................................................82INDICATOR 9: DISPROPORTIONALITY – CHILD WITH A DISABILITY. .85INDICATOR 10: DISPROPORTIONALITY – ELIGIBILITY CATEGORY.. .93INDICATORS 9 AND 10 [SECOND SET]................................................101INDICATOR 11: CHILD FIND...................................................................106INDICATOR 12: EARLY CHILDHOOD TRANSITION..............................109INDICATOR 13: SECONDARY TRANSITION.........................................115INDICATOR 14: POST-SCHOOL OUTCOMES.......................................117INDICATOR 15: GENERAL SUPERVISION............................................123INDICATOR 16: COMPLAINT TIMELINESS...........................................128INDICATOR 17: DUE PROCESS TIMELINESS......................................133INDICATOR 18: EFFECTIVENESS OF RESOLUTION SESSIONS.......138INDICATOR 19: MEDIATION AGREEMENTS.........................................141INDICATOR 20: STATE REPORTED DATA............................................146
INDICATOR 1: GRADUATION RATES
INTRODUCTIONThe National Dropout Prevention Center for Students with Disabilities (NDPC-SD) was assigned the task of summarizing Indicator 1—Graduation—for the analysis of the 2005 – 2010 State Performance Plans (SPP), which were submitted to OSEP in December of 2005. The text of the indicator is as follows.
Percent of youth with IEPs graduating from high school with a regular diploma compared to percent of all youth in the State graduating with a regular diploma.
In the SPP, states reported and compared their graduation rates for special education students and all students, set appropriate targets for improvement, and described their planned improvement strategies and activities.
This report summarizes the NDPC-SD’s findings for Indicator 1 across the 50 states, commonwealths and territories, and the Bureau of Indian Affairs (BIA), for a total of 60 agencies. For the sake of convenience, in this report the term “states” is inclusive of the 50 states, the commonwealths, and the territories, as well as the BIA.
The evaluation and comparison of graduation rates for the states was confounded by several issues, which will be described in the context of the summary information for the indicator. The attached Excel file contains summary charts and tables that support the text of this report.
The definition of graduation The definition of graduation is not consistent across states. Some states offer a single “regular” diploma, which represents the only true route to graduation. Other states offer two or more levels of diplomas or other exiting document, (For example, some states offer a Regular diploma, a High School Certificate, and a Special Ed diploma.). Some states include General Education Development (GED) candidates as graduates, whereas the majority of states do not. Until a consistent definition of graduation can be established and effected, making meaningful comparisons of graduation rates from state to state will be difficult, at best.
Within-state comparisons—consistency States were instructed that the measurement for graduation rates for special education students should be the same as the measurement for all youth. Additionally, they were directed to explain their calculations. Forty-seven states (78%) were internally consistent, using the same method to calculate both their rates. Five states (8%), however, used different methods for calculating the two rates. Eight states (13%) did
3

not specify how they calculated one or both of their rates, though all did reiterate the OSEP statement that measurement was the same for both groups.
The states that employed two different calculations generally cited a lack of comparable data for the two groups of students as having forced the use of different methods. For example, as required under No Child Left Behind (NCLB), states generally calculate average daily membership (total enrollment) per grade in September or October of the year. Special education student counts, however, were usually derived from the 618 data and reflected the number of students between ages 14 – 21 (or 17 – 21 in other states) enrolled in school on December 1st of the year. Several states that used disparate calculations acknowledged that comparisons of the rates should not be made.
Types of comparisons madeThe graduation indicator requires a comparison of the percent of youth in special education graduating with a regular high school diploma to the percent of all youth in the state graduating with a regular diploma. The majority of states (56%) made the requested comparison. Twenty-two percent of the states compared special-education rates to general-education rates. Twelve percent made both comparisons. The remaining states (10%) were unable to make comparisons because they were lacking either their special education or all-student graduation rate.
Between-state comparisons—calculation methodsEven for those states that were internally consistent in calculating graduation rates, comparisons among the states were often not possible because the method of calculation was variable from state to state. The graduation rates included in the SPPs were generally calculated using one of two methods: the method recommended by OSEP or that recommended by NCES. The OSEP formula used by states generally followed the form below.
# of graduates receiving a regular diploma_________________________________________________________________________________
# of graduates + # of students receiving GED + # of dropouts + # who maxed out in age + # deceased
The NCES formula provides a graduation rate for a 4-year cohort of students. This method, as applied in the SPPs, generally followed the form below.
# graduates receiving a regular diploma ____________________________________________________________
# graduates receiving a regular diploma + the 4 year cohort of dropouts
Graduation rates calculated using the OSEP formula cannot properly be compared with those derived using the NCES formula. The OSEP method tends to over-represent the graduation rate, providing a snapshot of the graduation rate for a particular year that
4
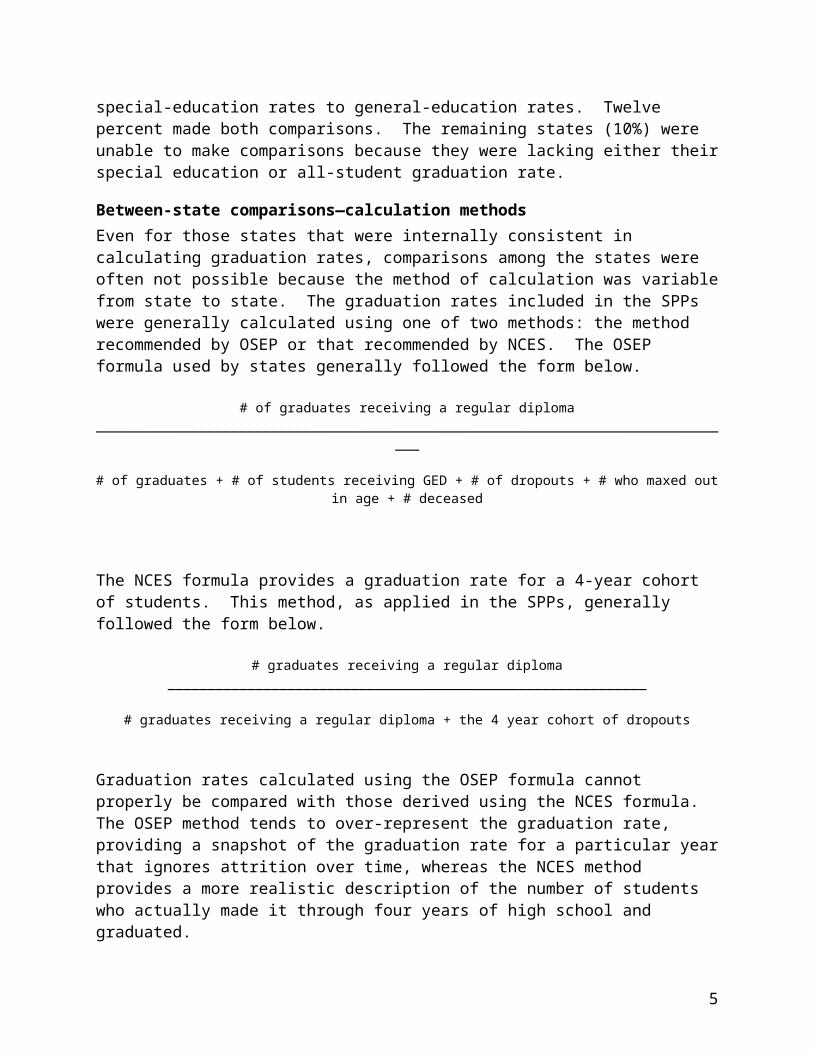
ignores attrition over time, whereas the NCES method provides a more realistic description of the number of students who actually made it through four years of high school and graduated.
Thirty-five states (58%) used the cohort method for calculating special-education graduation rates. Sixteen states (27%) used the OSEP method; 8 states (13%) did not specify how this rate was calculated; and the Bureau of Indian Affairs used the method employed by each state in which one of its schools was located. While many states began switching to a cohort rate several years ago and were able to report a true cohort rate for 2004-05, others reported that they were in the process of adopting a cohort-based graduation calculation and would not have their first complete set of cohort data until a year or two from now.
A prerequisite to adoption of a cohort system is the establishment of a means by which a state can track individual students within the school system, across schools and districts. This requires that each student have a unique student identifier. While several states indicated that they are in the process of setting up such systems, many states have yet to take this step.
Baseline year States were directed to provide baseline graduation-rate data for the 2004-05 school year and to set graduation targets for the out years of the Performance Plan based on these data. Forty-one states (68%) complied and provided data from the 2004-05 school year. Seventeen states (28%) reported baseline data from the 2003-04 school year because the 2004-05 data were not available when the SPP was written. One state (2%) reported its baseline data from the 2002-03 school year and one other state (2%) did not provide baseline data at this time.
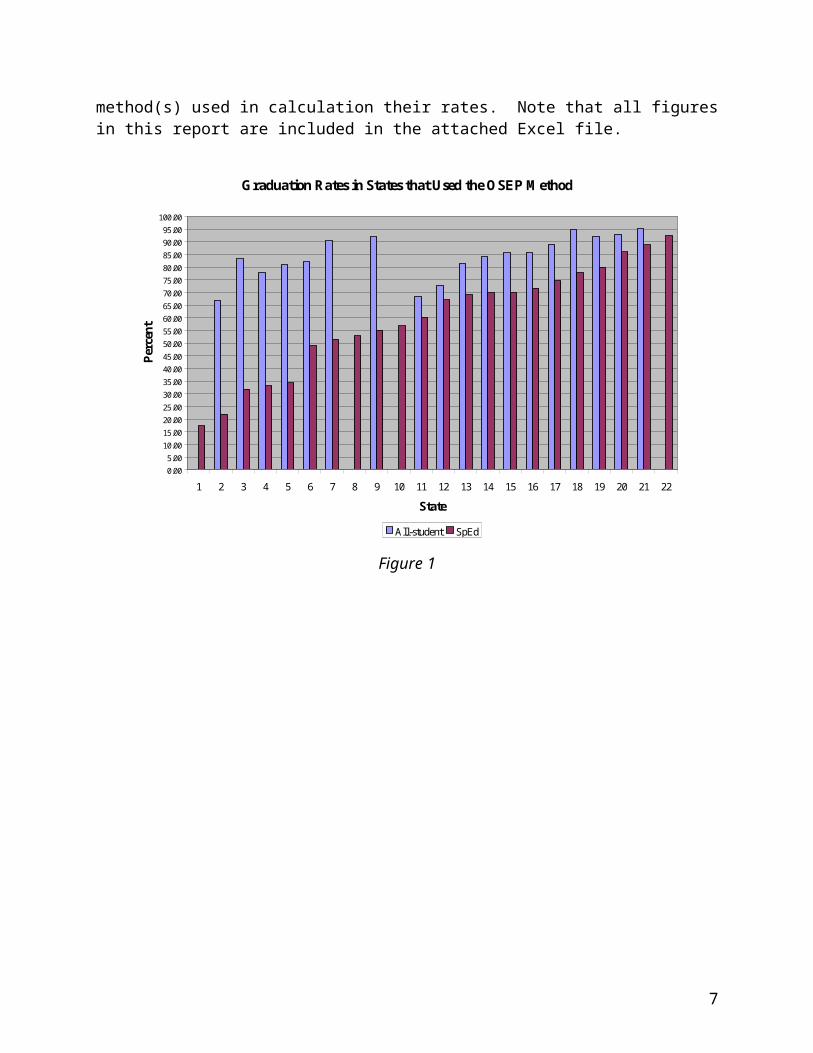
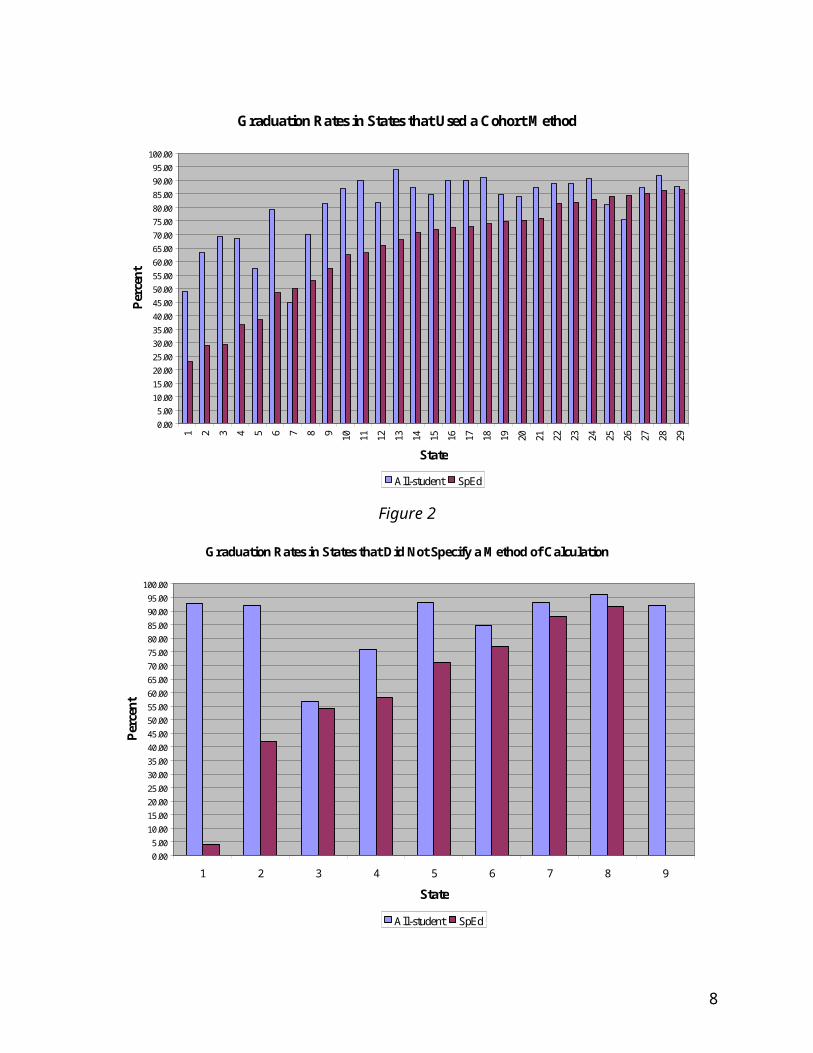
GRADUATION RATESAcross the 60 states, the highest reported graduation rate for special education students was 92.5% and the lowest was 4%.
Figure 1 shows those rates for states that used the OSEP method; Figure 2 shows the all-student and special education graduation rates for those states that calculated using the cohort method; and Figure 3 shows those states that did not specify the method(s) used in calculation their rates. Note that all figures in this report are included in the attached Excel file.
5
Graduation Rates in States that Used the OSEP Method
0.005.00
10.0015.0020.0025.0030.0035.0040.0045.0050.0055.0060.0065.0070.0075.0080.0085.0090.0095.00
100.00
1 2 3 4 5 6 7 8 9 10 11 12 13 14 15 16 17 18 19 20 21 22
State
Perc
ent
All-student SpEd
Figure 1
Graduation Rates in States that Used a Cohort Method
0.005.00
10.0015.0020.0025.0030.0035.0040.0045.0050.0055.0060.0065.0070.0075.0080.0085.0090.0095.00
100.00
1 2 3 4 5 6 7 8 9 10 11 12 13 14 15 16 17 18 19 20 21 22 23 24 25 26 27 28 29
State
Perc
ent
All-student SpEd
Figure 2
6
Graduation Rates in States that Did Not Specify a Method of Calculation
0.005.00
10.0015.0020.0025.0030.0035.0040.0045.0050.0055.0060.0065.0070.0075.0080.0085.0090.0095.00
100.00
1 2 3 4 5 6 7 8 9
State
Perc
ent
All-student SpEd
Figure 3
GRADUATION GAPStates were instructed to identify and address any gap that exists between the all-student graduation rate and the rate for special education students. To calculate that gap, the special education rate is subtracted from the all-student rate. If a gap exists and has a positive value, this indicates that the all-student graduation rate is higher than the rate for special education students. Conversely, a negative value for a gap indicates that special education students graduate at a higher rate than the entire population of students in the state.
Figure 4 shows the graduation-rate gap for the states. Those states for which a gap value is missing did not report one of the two graduation rates required to calculate the gap value.
7
Graduation Rate Gap(All-student Graduation Rate - Special Education Graduation Rate)
-10.0
0.0
10.0
20.0
30.0
40.0
50.0
60.0
70.0
80.0
90.0
100.01 2 3 4 5 6 7 8 9 10 11 12 13 14 15 16 17 18 19 20 21 22 23 24 25 26 27 28 29 30 31 32 33 34 35 36 37 38 39 40 41 42 43 44 45 46 47 48 49 50 51 52 53 54 55 56 57 58 59 60
State
Perc
ent
Figure 4
GRADUATION RATE TARGETSMost states described their graduation targets in terms of a graduation rate that they plan to achieve during each year of the SPP. Of the 60 states, 51 (85%) specified their targets in this manner. The remaining states described their targets in a variety of ways that can be categorized as 1) improving over the previous year by x%, 2) decreasing the graduation gap by x% per year, 3) improving the graduation rate within a certain range each year, or 4) moving a specified number or percentage of districts to a particular graduation rate. The distribution of states, by method, is summarized in Table 2.
States were required to set measurable and rigorous targets for their special education graduation rates. The proposed amount of improvement across the years of the plan ranged between 0.8% and 30%. Not surprisingly, this value was negatively correlated with the baseline graduation rate (r = -0.4835). States reporting relatively high baseline graduation rates generally proposed less ambitious increments of improvement than did states with lower rates. A breakdown of targeted improvement across the years of the SPPs is shown in Table 3.
8
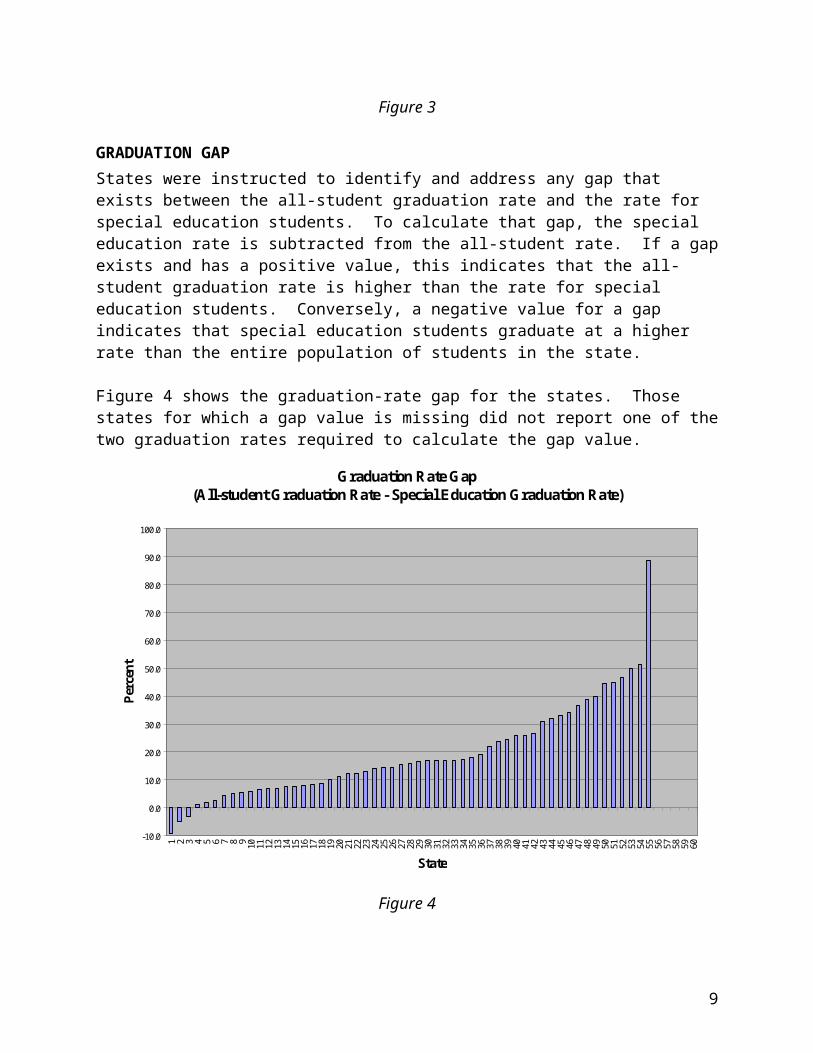
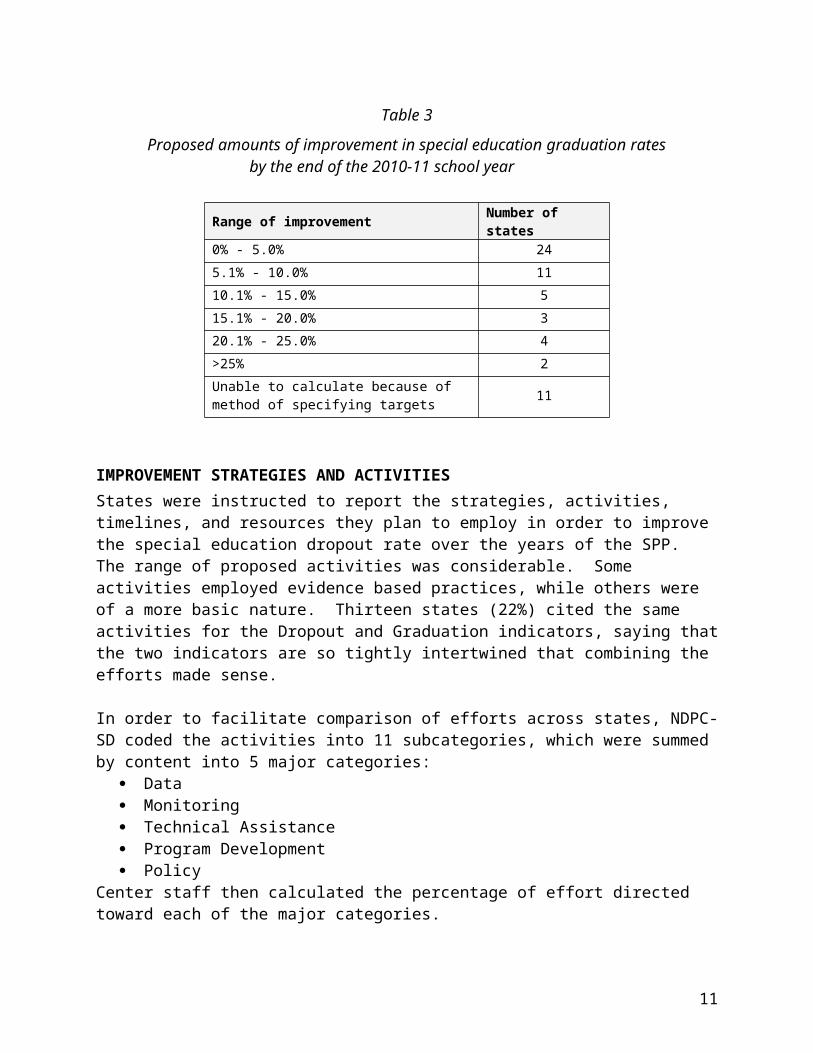
Table 3
Proposed amounts of improvement in special education graduation rates by the end of the 2010-11 school year
Range of improvement Number of states0% - 5.0% 245.1% - 10.0% 1110.1% - 15.0% 515.1% - 20.0% 320.1% - 25.0% 4>25% 2Unable to calculate because of method of specifying targets 11
IMPROVEMENT STRATEGIES AND ACTIVITIESStates were instructed to report the strategies, activities, timelines, and resources they plan to employ in order to improve the special education dropout rate over the years of the SPP. The range of proposed activities was considerable. Some activities employed evidence based practices, while others were of a more basic nature. Thirteen states (22%) cited the same activities for the Dropout and Graduation indicators, saying that the two indicators are so tightly intertwined that combining the efforts made sense.
In order to facilitate comparison of efforts across states, NDPC-SD coded the activities into 11 subcategories, which were summed by content into 5 major categories:
Data Monitoring Technical Assistance Program Development Policy
Center staff then calculated the percentage of effort directed toward each of the major categories.
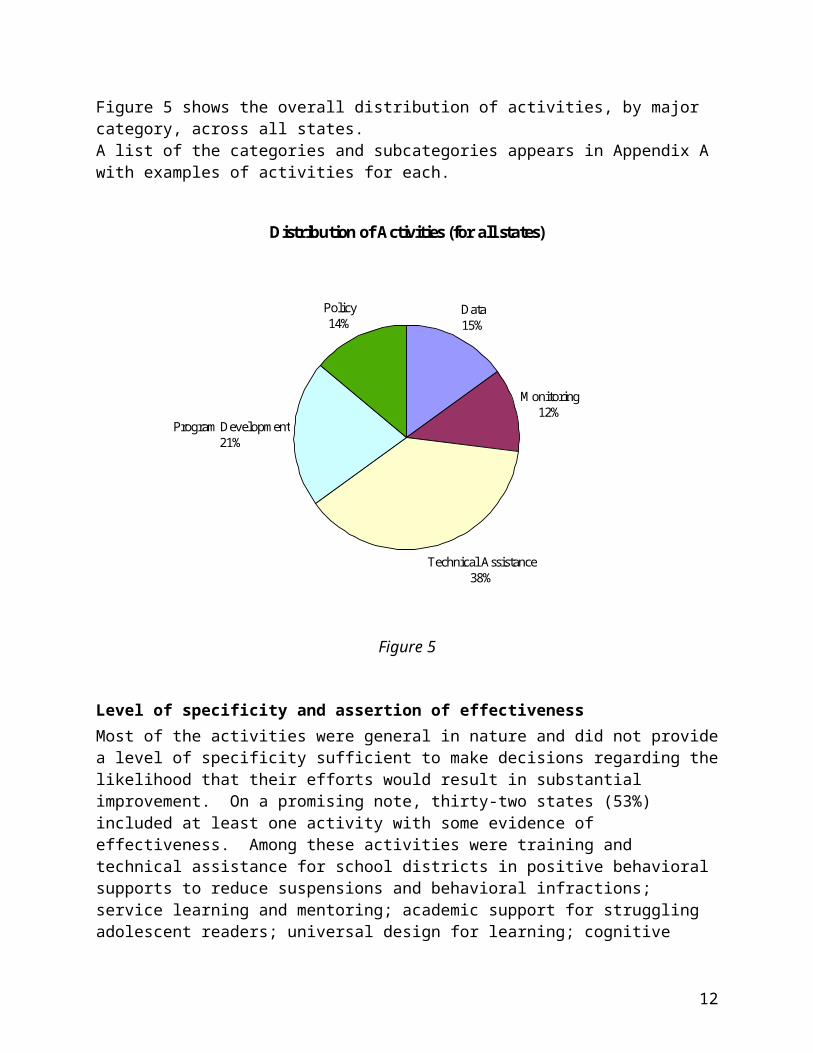
Figure 5 shows the overall distribution of activities, by major category, across all states. A list of the categories and subcategories appears in Appendix A with examples of activities for each.
9

Distribution of Activities (for all states)
Data15%
Monitoring12%
Technical Assistance38%
Program Development21%
Policy14%
Figure 5
Level of specificity and assertion of effectivenessMost of the activities were general in nature and did not provide a level of specificity sufficient to make decisions regarding the likelihood that their efforts would result in substantial improvement. On a promising note, thirty-two states (53%) included at least one activity with some evidence of effectiveness. Among these activities were training and technical assistance for school districts in positive behavioral supports to reduce suspensions and behavioral infractions; service learning and mentoring; academic support for struggling adolescent readers; universal design for learning; cognitive behavioral interventions; parent training; and early efforts to improve instruction at the middle-school level. SEA-sponsored initiatives also include Project GRAD, Gear Up, and transition initiatives.
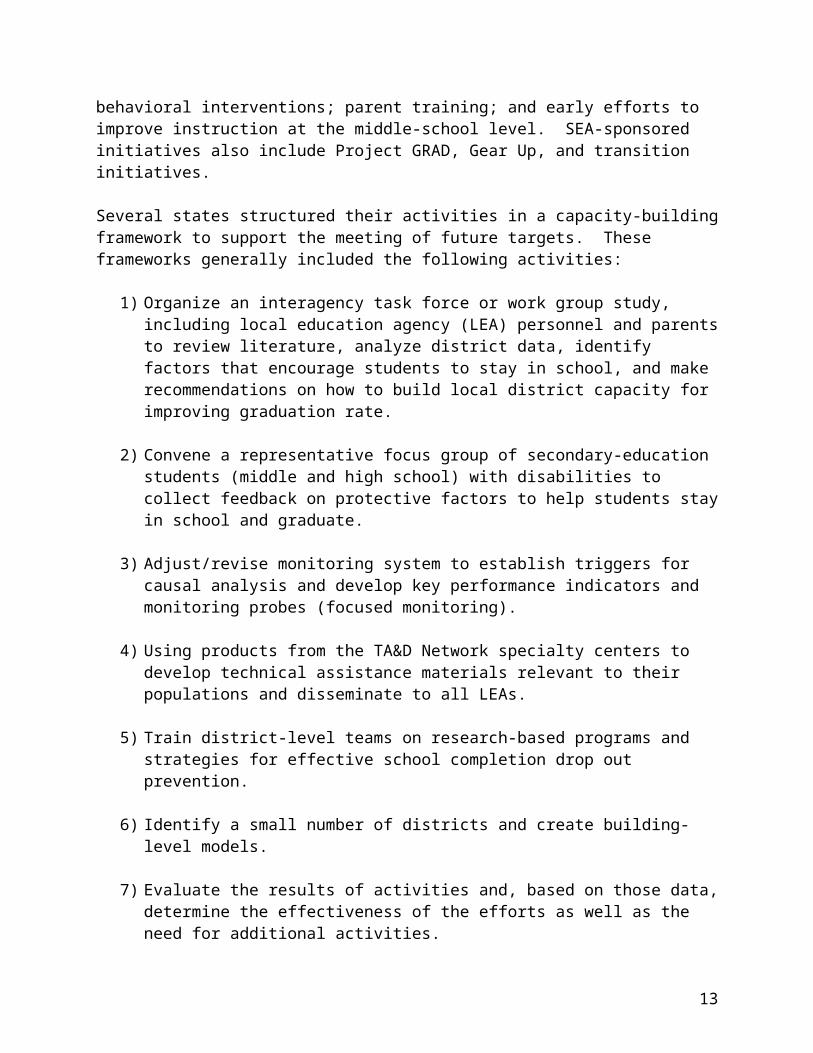
Several states structured their activities in a capacity-building framework to support the meeting of future targets. These frameworks generally included the following activities:
1) Organize an interagency task force or work group study, including local education agency (LEA) personnel and parents to review literature, analyze district data, identify factors that encourage students to stay in school, and make recommendations on how to build local district capacity for improving graduation rate.
10
2) Convene a representative focus group of secondary-education students (middle and high school) with disabilities to collect feedback on protective factors to help students stay in school and graduate.
3) Adjust/revise monitoring system to establish triggers for causal analysis and develop key performance indicators and monitoring probes (focused monitoring).
4) Using products from the TA&D Network specialty centers to develop technical assistance materials relevant to their populations and disseminate to all LEAs.
5) Train district-level teams on research-based programs and strategies for effective school completion drop out prevention.
6) Identify a small number of districts and create building-level models.
7) Evaluate the results of activities and, based on those data, determine the effectiveness of the efforts as well as the need for additional activities.
8) Consider policy and legislative recommendations
11
RECOMMENDATIONS1) States should, as much as possible, obtain their all-student and special
education data using comparable methods at comparable times of the year. This may be difficult, as the December 1 Child Count generally serves as the source for the special-education data and states’ total enrollment is usually collected earlier in the fall. Until the timing of these counts can be reconciled, the data cannot be compared accurately.
2) In order to make comparisons among states possible, the manner in which graduation rates are calculated must be standardized. Many states are moving toward the use of a cohort-based calculation method, though not all states are there yet. This move, toward what most feel is a more accurate method, should yield a fairly realistic picture of graduation.
3) Comparisons of graduation rates would also be facilitated if it were possible to standardize what constitutes graduation (i.e. whether a GED or a certificate may be counted, and how to address students that take more than 4 years to graduate). At this point, different states sanction different credentials as official proof of graduation. This confounds accurate comparisons across states.
4) In the next round of APRs and SPPs, it would be helpful for states to report the exact calculation(s) used in arriving at their graduation rates as well as the exact source of the data used in both the all-student and special-education rate calculations.
5) In comparing the 2005 SPPs with the 2005 APRs, the benefit of OSEP’s guidance through providing a template for submission, definitions and descriptions of calculations and data-analysis strategies is apparent. In the next round of APRs and SPPs, it would be very beneficial to provide states with similar templates and additional guidance that would assist them in identifying improvement activities, timelines, and resources.
12
APPENDIX A – ACTIVITY AND STRATEGY CATEGORIES WITH EXAMPLES
Data activities1. Improve the accuracy of data collection and school district accountability via
technical assistance, public reporting/dissemination, or collaboration across other data reporting systems. Developing or connecting data collection systems.
Examples:
A. Aligning statewide calculation and graduation rates for students with and without disabilities using cohort approach.
B. Providing guidance to all school districts regarding the state’s graduation rate calculations and data points.
C. Providing training to LEAs to increase consistency in their methods of reporting graduation and dropout rates.
D. Examining the use of “Transferred, not Known to be Continuing” category and develop methods to ensure accuracy of reporting (E.g., unique student identifiers, implement and monitor procedures for timely and accurate reporting of transfer students).
E. Implementing a system for providing and tracking unique student identifiers across the state.
2. Analyzing state level graduation-rate data and identifying school districts with high /low rates to plan for future focused analysis.
Examples:
A. Identify school districts for analysis of cause that would result in systematic problem solving for low performers and identification of potential improvement strategies in districts with high graduation rates.
B. Disaggregate state level data by disability categories, ethnicity, and geographic regions and identify trends in data to inform improvement activities.
C. Analyze data across indicators related to graduation (dropout, transition, parental involvement, suspensions and expulsions) to establish corollary relationships for focused monitoring.
13

Monitoring activities3. Refine/ Revise monitoring systems including focused monitoring
Examples:
A. Include specific performance indicators/measures for continuous monitoring of graduation and dropout rates
B. Establish performance triggers for focused monitoring
C. Require improvement/corrective actions plans and follow up visits to evaluate effectiveness of improvement efforts
D. Require LEAs with low graduation rates to engage in analysis of causes
E. Insure that transition plans for each student address unique challenges for meeting graduation requirements
F. Survey a sample of students of students with disabilities about challenges faced in the school setting and factors that help them stay in school
Technical assistance4. Provide technical assistance/training to LEAs on effective practices and model
programs
Examples:
A. Provide technical assistance on effective practices (e.g., struggling adolescent readers, PBIS, problem solving, UDL, progress monitoring) to help students achieve success in middle and high school
B. Provide training on high school reform models on effective math and literacy instruction
C. Compile and disseminate effective practices/strategies from districts that have
made progress in improving graduation rates
5. Provide technical assistance to promote early student and family involvement
Examples:
A. Train parents and students on self- determination and self- advocacy skills
B. Train parents, school personnel, and students on strategies to increase parental involvement at the local level
14
6. Receive technical assistance from TA&D network projects
Examples:
A. Collaborate with the National Dropout Prevention Center for Students with Disabilities to identify effective strategies/interventions to support school completion
B. Collaborate with the Youth in Transitions Partnership to implement Transition to Independence Process (TIP)
C. Receive technical assistance from NSTTAC to identify effective transition models
D. Receive TA from BPIS to develop school wide sites in high schools
Program development7. Develop new statewide initiatives in school completion
Examples:
A. Project 720- High School reform initiative, Project 720 (which refers to the number of days in a High School student’s career). This program will result in significant redesign of instruction at the secondary level. Its goals are to create High School environments that are student-centered, results focused, data informed, and personalized in a way that seamlessly supports systems, resources, technology and shared leadership. Schools that are part of Project 720 will commit to implementing reform strategies over a three year period. Data collected as part of Project 720 will be analyzed and included in future target settings for improving graduation rates.
B. Project FOCUS Academy. This program is focused on creating professional development programs to help students with disabilities build sound career goals and learn skills to ensure successful post-secondary outcomes. The content covered in this program (Positive Behavioral Interventions and Supports, Universal Design for Learning, post-secondary planning, and family engagement) could have a long-term impact reducing dropout rates for students with disabilities.
C. Abbott Secondary Education Initiative (Grades 6 through 12) – A three-year project intended to strengthen the academic performance of students in grades six through twelve in targeted districts via development and implementation of plans to transform their high schools into smaller leaning communities that have stronger connections to the school and community.
15

8. Create incentive to publicly recognize exemplary school districts and use school districts as mentors
A. Publicly recognize exemplary school districts for their work in developing data systems
B. Provide incentives for exemplary school districts to serve as mentors to districts of like demographics
9. Target existing projects/programs to increase school completion efforts, including recruit and retain highly qualified teachers and personnel
A. Use the State Improvement Grant staff (SIG) to target the improvement of special education students’ performance at the middle school level in Math and English/Language Arts.
B. Use the Transition Outcomes Project (TOP) to develop and implement best practices leading to graduation and successful transition to post secondary roles.
C. Scale up Urban Literacy Initiative/Secondary Education Initiative: Literacy is Essential to Adolescent Development and Success (LEADs) model. The LEADs model serves students in Grades 4-8 and emphasizes working across disciplines, using interesting and contemporary literature, frequent writing, diverse texts, and targeted interventions for students reading two or more years below grade level.
D. “Dare to Dream” Student Leadership Regional Conferences provides training and guidance to students, parents, and school personnel in the areas of self-advocacy, IEP preparation, and legal rights and responsibilities and futures planning. The conference features presentations by youth and young adults with disabilities.
E. APEX Program – A recent award from the U.S. Department of Education’s Office of Elementary and Secondary Education for $2,143,000 is a 3 year dropout prevention grant (APEX II). APEX II will be implemented in 11 high schools and their feeder middle schools. This project combines positive behavioral supports with a focus on students at high risk of dropping out as well as those not attending. The state will adopt many of the APEX strategies to assist in the reduction of the graduation gap for students with and without IEPs.
F. SIGNAL Program – State Improvement Grant, Nurturing All Learners began August 1, 2004. The objectives of SIGNAL are to: create state-level systems change, through improved capacity of state-level transition personnel and staff
16
at postsecondary settings to support students with disabilities; increase the knowledge of education and related personnel, through the dissemination of transition resources; improve the skills and capacity of teachers through multiple professional development opportunities.
Policy activities10. Develop, convene, or participate in focus group/task force to study school
completion issues
Examples:
A. Organize/convene SEA level task force including (Special Education, Student Services, Counselor Education, Curriculum and Assessment, Migrant Education, Foster Care, Career and Technical Education, Safe Schools, and Corrections Education) to analyze district level data, identify factors that facilitate school completion, and make recommendations on building local capacity for improving graduation rates for all students.
B. Convene representative focus group of middle and high school students with disabilities to collect feedback on factors that serve as facilitators, challenges, and barriers to school completion.
C. Encourage LEAs to engage in self assessment, utilizing local action teams(including community agencies and business leaders) to examine programs, policies, and school climate variables that promote graduation and decrease dropout.
11. Develop/revise policies to promote school completion; interagency collaboration
Examples:
A. Review and revise current graduation rule requirements to establish clearly defined graduation and diploma requirements that: include specific, objective criteria and are available to all students; provide appropriate advance notice to allow reasonable time to prepare to
meet the requirements or make informed decisions about alternative options, and consider the needs of individual students on a case-by-case basis; and
provide for additional alternative options for students with disabilities to earn the standard high school diploma.
B. Revised state attendance policy to require an interagency protocol committee to require an interagency protocol committee to develop a comprehensive student attendance strategy aimed at reducing unexcused absences and interim monitoring, and ensuring the coordination and cooperation among officials, agencies, and programs.
17
C. Establish High School Redesign Commission and work groups to recommend policy level actions and assist state in redesigning high schools that promote academic achievement and address academic needs of all students.
18
INDICATOR 2: DROPOUT RATES
INTRODUCTIONThe National Dropout Prevention Center for Students with Disabilities (NDPC-SD) was assigned the task of summarizing Indicator 2—Dropout—for the analysis of the 2005 – 2010 State Performance Plans (SPP), which were submitted to OSEP in December of 2005. The text of the indicator is as follows.
Percent of youth with IEPs dropping out of high school compared to the percent of all youth in the State dropping out of high school.
In the SPP, states reported and compared their dropout rates for special education students and all students, set appropriate targets for improvement, and described their planned improvement strategies and activities.
This report summarizes the NDPC-SD’s findings for Indicator 2 across the 50 states, commonwealths and territories, and the Bureau of Indian Affairs (BIA), for a total of 60 agencies. For the sake of convenience, in this report the term “states” is inclusive of the 50 states, the commonwealths, and the territories, as well as the BIA.
The evaluation and comparison of dropout rates for the states was confounded by several issues, which will be described in the context of the summary information for the indicator. The attached Excel file contains summary charts and tables that support the text of this report.
The definition of dropout Some of the difficulties associated with quantifying dropout can be attributed to the lack of a standard definition of what constitutes a dropout. Several factors confound our arrival at a clear definition. Among these are the variability in the age group or grade level of students included in dropout calculations and the inclusion or exclusion of particular groups or classes of students from consideration in the calculation.
For example, some states include students from ages 14-21 in the calculation, whereas other states include students of ages 17-21. Still other states base inclusion in calculations on students’ grade levels, rather than on their ages. Some states count students participating in a General Education Development (GED) program as dropouts, whereas other states include them in their calculation of graduates. As long as such variations in practice continue to exist, comparing dropout rates across states will remain in the realm of art rather than in that of science.
19

Timing of data collections for all-student and special-education dataThe timing of data collections is another factor that has the potential to cause discrepancy between the all-student dropout rate and the rate for special education students. The special-education data reported in the SPPs were generally derived from the 618 data collection, which occurred on December 1 of the year, whereas all-student enrollment data were generally collected earlier in the fall. This difference in timing reduces the comparability of the data, thereby decreasing the validity of comparisons made between special education and all youth.
Types of comparisons madeStates were instructed to compare their dropout data for special education students with that for all students. Thirty-four states (56%) made this comparison. Twelve states (20%) compared special education to general education rates. Seven states (12%) made both comparisons. The remaining 7 states (12%) were unable to make comparisons because they lacked either their special-education or all-student dropout rate.
Methods of calculating dropout ratesAnother factor that confounded comparisons of dropout rates across states was that three methods exist for calculating dropout rates and different states employed different ones. The dropout rates reported in the SPPs were calculated as event rates, status rates, or cohort rates.
In general, states employing an event or status rate reported lower dropout rates than states that used a cohort rate. This is, in large part, due to the nature of the calculations and the longitudinal nature of the cohort method. While this method generally yields a higher rate than the event or status calculations, it appears to provide a more accurate picture of the nature of attrition from school over the course of four years than do the other methods.
As reported in the SPPs, 38 states (63%) reported some form of an event rate. Calculations of this type followed the form of the equation below.
# 2004 SpEd dropouts from Grades 9 - 12---------------------------------------------------------------
Total 2004 enrollment in Grades 9 - 12
Six states (10%) reported a status rate. These calculations generally followed a form like that of the equation below.
# of SpEd dropouts-------------------------------------------
# SpEd enrollment
20

Twelve states (20%) used some form of a cohort method in calculating their dropout rates. These calculations generally follow some form of the equation shown below.
(# 2004 SpEd dropouts)-------------------------------------------------------------------------------------------------------------------------------
(# 2004 SpEd grads + # G9 SpEd dropouts in 2000-01 + #G10 SpEd dropouts in 2001-02+ #G11 SpEd dropouts in 2002-03 + # G12 SpEd dropouts in 2003-04)
Finally, 4 states did not specify the method used to calculate their dropout rates.
Several states reported that they are in the process of moving from the use of an event rate to using a cohort rate. Most of these added a caveat about the potential necessity of adjusting their dropout targets in years to come.
Baseline yearOSEP instructed states to provide baseline dropout data for the 2004-05 school year. While the majority of states (42 states or 70%) were able to provide this, another 16 states (27%) used data from the 2003-04 school year because data from the 2004-05 year were not available when the report was being compiled. One state (2%) used data from 2002-03 and another (2%) did not specify the year of its baseline data.
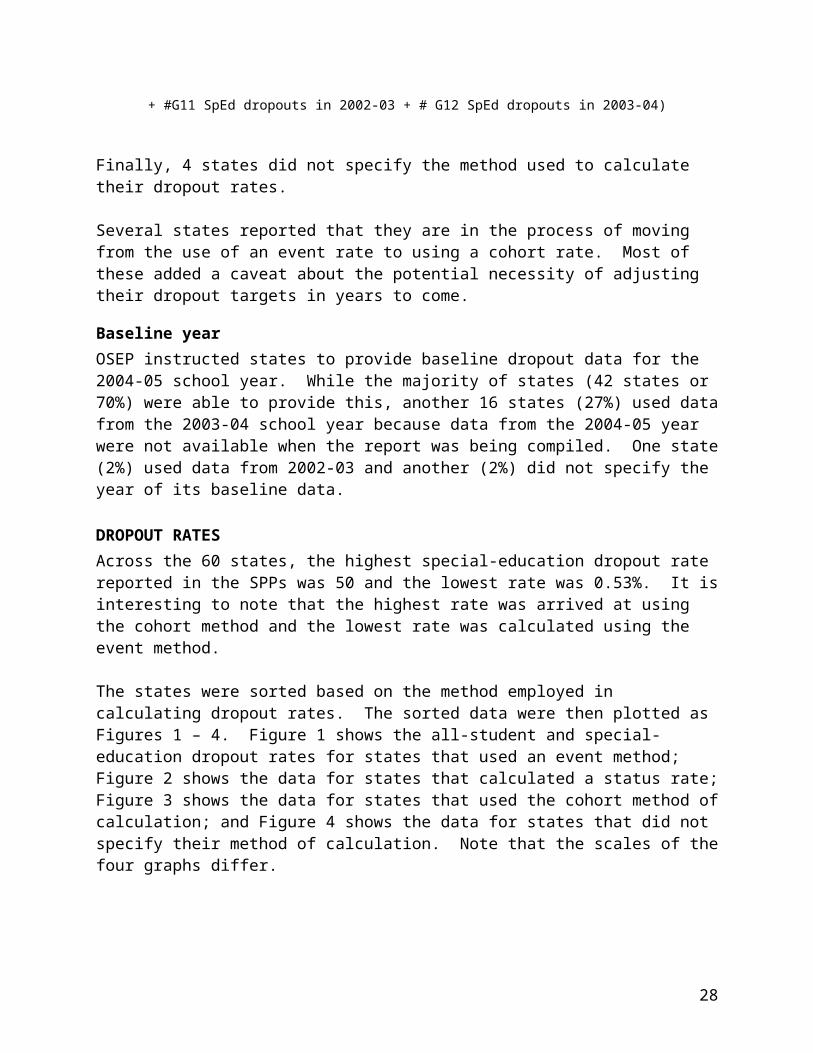
DROPOUT RATESAcross the 60 states, the highest special-education dropout rate reported in the SPPs was 50 and the lowest rate was 0.53%. It is interesting to note that the highest rate was arrived at using the cohort method and the lowest rate was calculated using the event method.
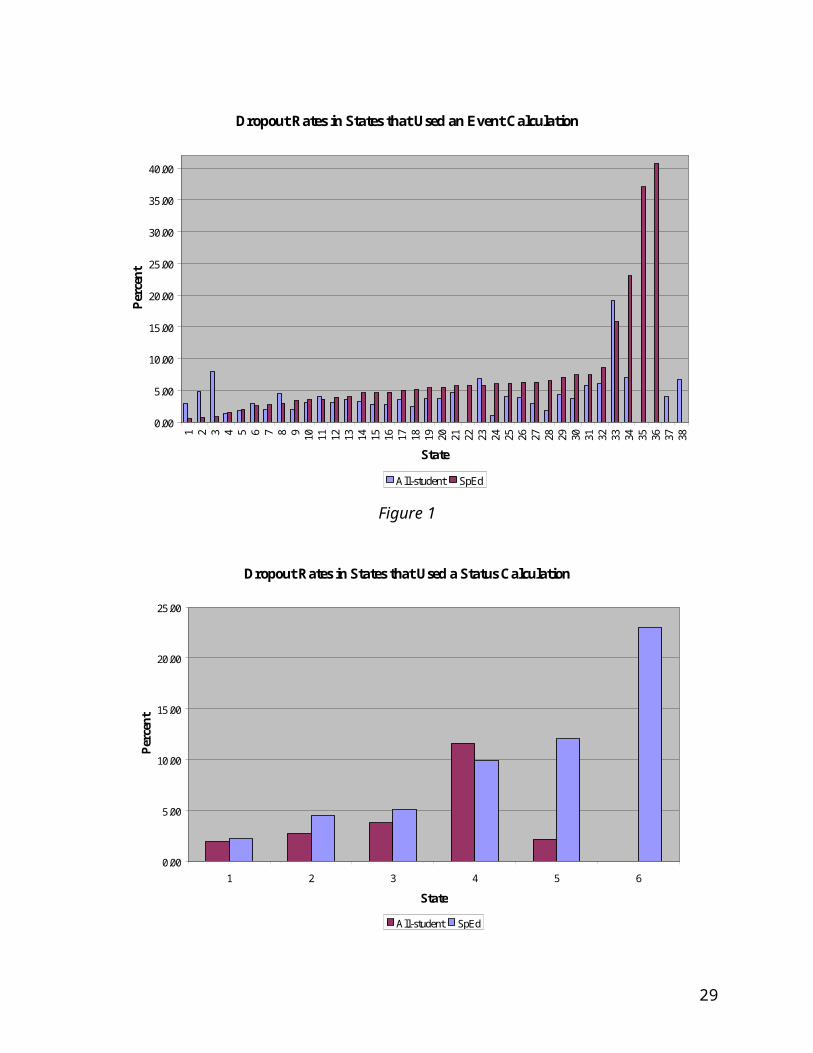
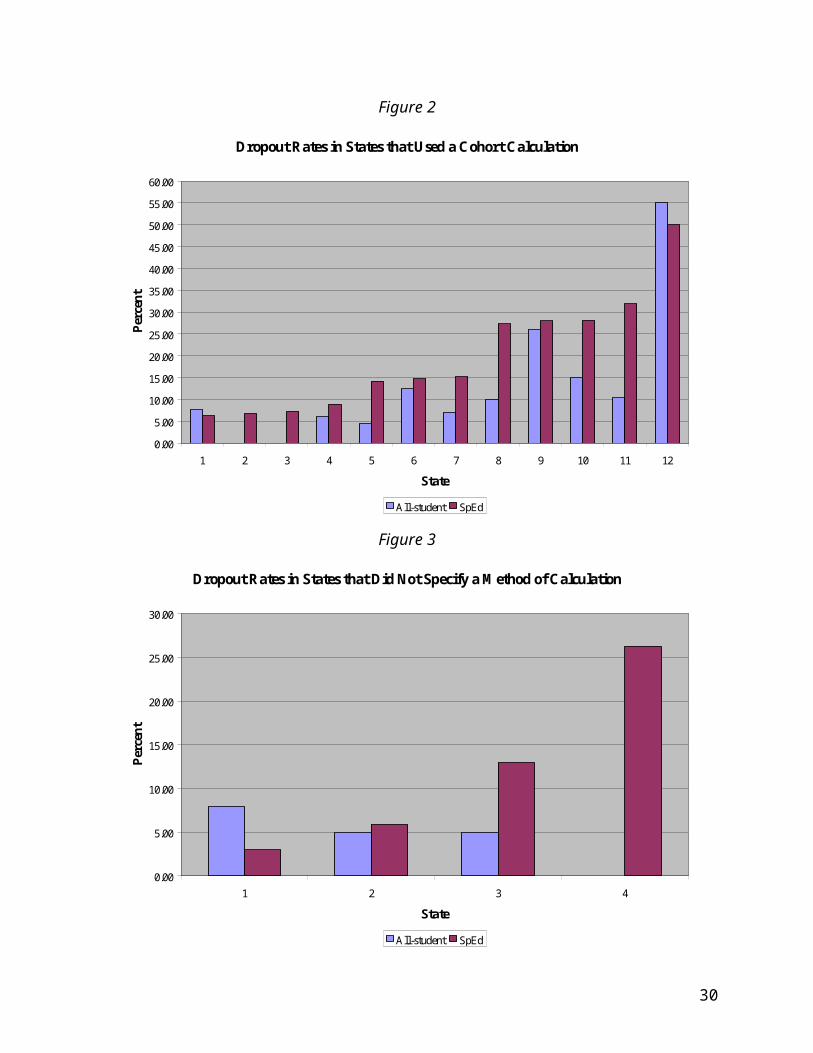
The states were sorted based on the method employed in calculating dropout rates. The sorted data were then plotted as Figures 1 – 4. Figure 1 shows the all-student and special-education dropout rates for states that used an event method; Figure 2 shows the data for states that calculated a status rate; Figure 3 shows the data for states that used the cohort method of calculation; and Figure 4 shows the data for states that did not specify their method of calculation. Note that the scales of the four graphs differ.
21

Dropout Rates in States that Used an Event Calculation
0.00
5.00
10.00
15.00
20.00
25.00
30.00
35.00
40.00
1 2 3 4 5 6 7 8 9 10 11 12 13 14 15 16 17 18 19 20 21 22 23 24 25 26 27 28 29 30 31 32 33 34 35 36 37 38
State
Perc
ent
All-student SpEd
Figure 1
Dropout Rates in States that Used a Status Calculation
0.00
5.00
10.00
15.00
20.00
25.00
1 2 3 4 5 6
State
Perc
ent
All-student SpEd
Figure 2
22

Dropout Rates in States that Used a Cohort Calculation
0.00
5.00
10.00
15.00
20.00
25.00
30.00
35.00
40.00
45.00
50.00
55.00
60.00
1 2 3 4 5 6 7 8 9 10 11 12
State
Perc
ent
All-student SpEd
Figure 3
Dropout Rates in States that Did Not Specify a Method of Calculation
0.00
5.00
10.00
15.00
20.00
25.00
30.00
1 2 3 4
State
Perc
ent
All-student SpEd
Figure 4
23
DROPOUT GAPStates were instructed to identify and remedy any gap existing between the all-student dropout rate and the rate for special education students. To calculate that gap, the special education rate is subtracted from the all-student rate. If a gap exists and has a positive value, this indicates that the all-student dropout rate is higher than the rate for special education students. Conversely, a negative value for a gap indicates that special education students drop out at a higher rate than the entire population of students in the state.
Of the 60 states, 39 (65%) showed a negative gap, 13 states (22%) showed a positive gap, and 8 states (13%) were missing data, making it impossible to calculate a gap. Figure 5 shows the dropout-rate gap for the states. Those states for which a gap value is missing on the chart did not report one of the two dropout rates required to calculate the gap value.
Dropout Rate Gap(All-student Dropout Rate - Special Education Dropout Rate)
-25.00
-20.00
-15.00
-10.00
-5.00
0.00
5.00
10.00
1 2 3 4 5 6 7 8 9 10 11 12 13 14 15 16 17 18 19 20 21 22 23 24 25 26 27 28 29 30 31 32 33 34 35 36 37 38 39 40 41 42 43 44 45 46 47 48 49 50 51 52 53 54 55 56 57 58 59 60
State
Perc
ent
Figure 5
DROPOUT RATE TARGETSMost states expressed their targets in terms of a particular special-education dropout rate they would like to achieve during each year of the SPP. Of the 60 states, 49 (82%) expressed their targets in this manner. Five states (8%) expressed their targets in terms of improving from a baseline value by a particular percentage for each year of the
24
SPP. Three states (5%) expressed their targets in terms of an increasing percentage of districts attaining particular targets. Two states (3%) stated their targets in terms of reducing the gap between the all-student and special-education dropout rates. Finally, one state set targets for only the all-student dropout rate, rather than specifying targets for both all students and special-education students.
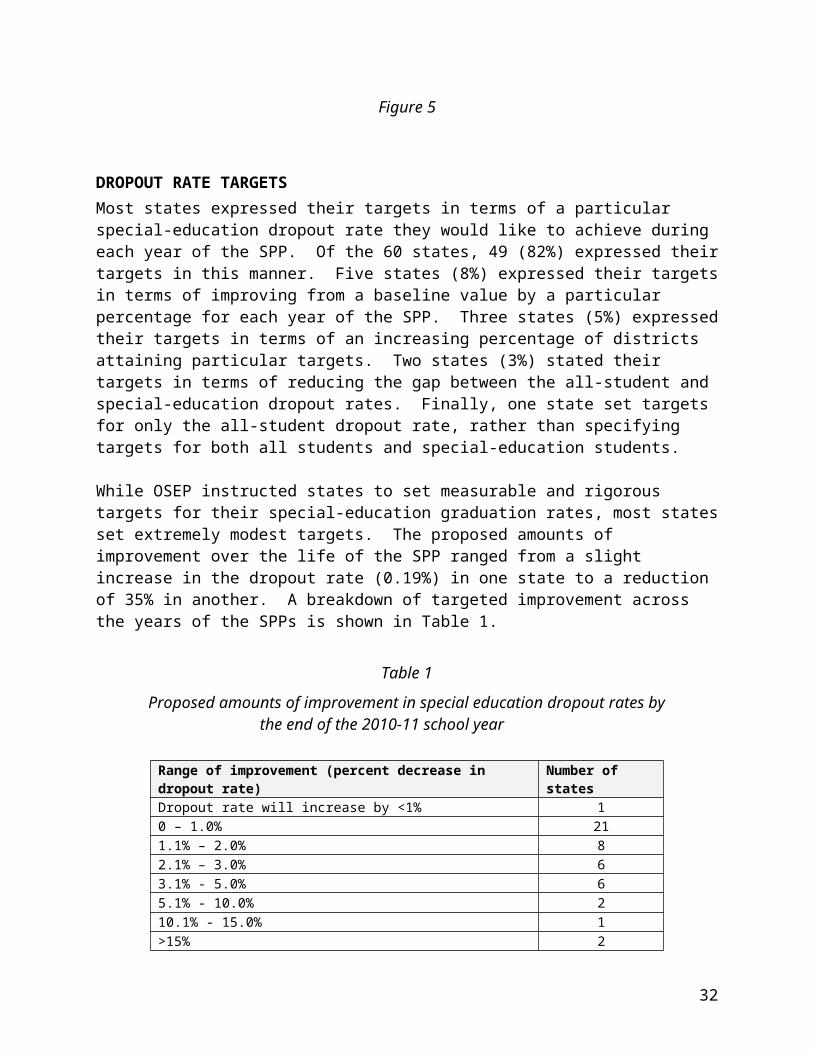
While OSEP instructed states to set measurable and rigorous targets for their special-education graduation rates, most states set extremely modest targets. The proposed amounts of improvement over the life of the SPP ranged from a slight increase in the dropout rate (0.19%) in one state to a reduction of 35% in another. A breakdown of targeted improvement across the years of the SPPs is shown in Table 1.
Table 1
Proposed amounts of improvement in special education dropout rates by the end of the 2010-11 school year
Range of improvement (percent decrease in dropout rate) Number of statesDropout rate will increase by <1% 10 – 1.0% 211.1% – 2.0% 82.1% – 3.0% 63.1% - 5.0% 65.1% - 10.0% 210.1% - 15.0% 1>15% 2Couldn’t calculate improvement because of manner in which targets were stated 13
IMPROVEMENT STRATEGIES AND ACTIVITIESStates were instructed to report the strategies, activities, timelines, and resources they plan to employ in order to improve the special education dropout rate over the years of the SPP. The range of proposed activities was considerable. Some activities employed evidence based practices, while others were of a more basic nature. Thirteen states (22%) cited the same activities for the Dropout and Graduation indicators, saying that the two indicators are so tightly intertwined that combining the efforts made sense.
In order to facilitate comparison of efforts across states, NDPC-SD coded the activities into 11 subcategories, which were summed by content into 5 major categories: data, monitoring, technical assistance, program development, and policy. Center staff then calculated the percentage of effort directed toward each of the major categories. Figure 6 shows the overall distribution of activities, by major category, across all states. A list of the categories and subcategories appears in Appendix A with examples of activities for each.
25

Figure 6
Level of specificity and assertion of effectivenessMost of the activities were general in nature and did not provide a level of specificity sufficient to make decisions regarding the likelihood that their efforts would result in substantial improvement. On a promising note, thirty-two states (53%) included at least one activity with some evidence of effectiveness. Among these activities were training and technical assistance for school districts in positive behavioral supports to reduce suspensions and behavioral infractions; service learning and mentoring; academic support for struggling adolescent readers; universal design for learning; cognitive behavioral interventions; parent training; and early efforts to improve instruction at the middle-school level.
Several states structured their activities in a capacity-building framework to support the meeting of future targets. These frameworks generally included the following activities:
9) Organizing an interagency task force or work group study, including local education agency (LEA) personnel and parents to review literature, analyze district data, identify factors that encourage students to stay in school, and make recommendations on how to build local district capacity for improving the dropout rate.
10)Convening a representative focus group of secondary-education students (middle and high school) with disabilities to collect feedback on protective factors to help students stay in school and graduate.
26
Distribution of Activities (for all states)
Data18%
Monitoring12%
Technical Assistance
37%
Program Development
23%
Policy10%

11)Adjusting/revising the monitoring system to establish triggers for causal analysis and developing key performance indicators and monitoring probes (focused monitoring).
12)Using products from the TA&D Network specialty centers to develop technical assistance materials relevant to their populations and disseminating them to all LEAs.
13)Training district-level teams on research-based programs and strategies for effective school completion drop out prevention.
14)Identifying a small number of districts and creating building-level models.
15)Evaluating the results of activities and, based on those data, determining the effectiveness of the efforts as well as the need for additional activities.
16)Considering policy and legislative recommendations
27
RECOMMENDATIONS1) In order to make comparisons among states possible, the manner in which
dropout is defined and dropout rates are calculated must be standardized. Many states are moving toward the use of a cohort-based calculation method, though not all states are there yet. This move, toward what most feel is a more accurate method than the others, should yield a fairly realistic picture of dropout. With a standardized calculation formula states could plug in their raw counts and the rates could be computed as part of an on-line submission of the APR.
2) States should, as much as possible, obtain their all-student and special education data using comparable methods at comparable times of the year. This may be difficult, as the December 1 Child Count generally serves as the source for the special-education data and states’ total enrollment is usually collected earlier in the fall. Until the timing of these counts can be reconciled, the data cannot be compared accurately.
3) Comparisons of dropout rates would also be facilitated if it were possible to standardize what constitutes dropping out (e.g., how long a student is absent from school before he or she is considered a dropout, whether students participating in a GED program are counted as dropouts, etc). We recommend that USDE adopt a uniform definition for dropout to be used by both OESE and OSEP.
4) In the next round of APRs and SPPs, it would be helpful to have states report the exact calculation(s) used in arriving at their dropout rates as well as the exact source of the data used in both the all-student and special-education rate calculations.
5) In comparing the 2005 SPPs with the 2005 APRs, the benefit of OSEP’s guidance through providing a template for submission, definitions and descriptions of calculations and data-analysis strategies is apparent. In the next round of APRs and SPPs, it would be very beneficial to provide states with similar templates and additional guidance that would assist them in identifying improvement activities, timelines, and resources.
For Appendix A, see Chapter 1.
28
INDICATOR 3: ASSESSMENT
Introduction
The National Center on Educational Outcomes (NCEO) analyzed the information provided by states on the participation and performance of students with disabilities on statewide assessments, which was Part B Indicator 3 of the State Performance Plan (SPP). Indicator 3 information is based on assessment data from 2004-2005. States entered the data into their plans in December 2005.
There are good reasons to ensure that there is clear reporting of the participation and performance of students with disabilities on assessments. A 1993 NCEO survey showed that in the early 1990s, most states included fewer that 10% of their students with disabilities in state assessments. Students who are excluded from state assessment and accountability reporting are at greater risk of being “left behind” when it comes to access to the curriculum and standards-based instruction. Participation of students with disabilities has increased significantly since the early 1990s; in the 2003-2004 annual performance reports that states submitted to the U.S. Department of Education, all but a handful of states had more than 95% of their students with disabilities participating in state assessments.
In this review of the SPP Indicator 3 information that states submitted, our goal was to summarize both the data that states reported as their baseline information on districts meeting AYP, and assessment participation and performance, and to document states’ targets for the future and their improvement activities for reaching those targets. Because of differences in requirements for some of the unique states, in this report we separated findings for the 50 regular states (Alabama through Wyoming) and the 10 unique states (American Samoa, Bureau of Indian Affairs, Commonwealth of Northern Mariana Islands, District of Columbia, Federated States of Micronesia, Guam, Palau, Puerto Rico, Republic of the Marshall Islands, Virgin Islands).
We begin with a description of the methodology of our analysis of the information in the SPPs. This is followed by a description of each component of Indicator 3, the targets, and the improvement activities.
Methodology
SPPs used for the analysis were obtained from the RRFC Web site. The information included data on districts meeting adequate yearly progress (AYP), state assessment participation and performance, and targets for these as well as information on improvement activities. This information was used as the basis for all analyses.
There were three components that comprised the data in Indicator 3:
29
Indicator 3A is the percent of districts meeting the state’s Adequate Yearly Progress objectives for the disability subgroup (AYP)
Indicator 3B is the participation rate for children with IEPs (Participation) Indicator 3C is the proficiency rate for children with IEPs (Proficiency)
Both 3B and 3C had subcomponents:
a) The number of students with Individualized Education Programs (IEPs)b) The number of students in a regular assessment with no accommodationsc) The number of students in a regular assessment with accommodationsd) The number of students in an alternate assessment measured against
GRADE level achievement standardse) The number of students in an alternate assessment measured against
ALTERNATE achievement standards
States were given instructions on how to calculate percentages for the subcomponents of 3B and 3C. In addition, they were general instructions for states that related more broadly to Indicator 3. These instructions were:
Sampling from the state’s 618 data is not allowed States should use the same assessments used for reporting under NCLB States should describe the results of the calculations and compare their results to
the target
Data Verification
There were many numbers to verify and summarize for SPP Part B Indicator 3. Careful verification of the numbers was undertaken for a number of reasons. Yet, the verification turned out to be a very time-consuming and challenging process. One of the challenges was that data posted on the Web site was changed over time. There were instances when we obtained a set of data for a state at one point in time and then when the data were being viewed again at a later date for verification purposes, the data had been removed or changed.
Another challenge was that sometimes numbers were only embedded within text and not presented separately in tables or lists. Extracting data from text involved finding the numbers within discussions and understanding which numbers to extract from the discussions. The difficulty of doing this was compounded when we obtained numbers from the text that seemed inconsistent with data shown in tables elsewhere in a state’s SPP. Providing all relevant data in table format would reduce several potential sources of error that are introduced when numbers are embedded in text.
Concerns about the nature of the data reported in the SPP when the goal is to create a national summary are identified several times in this report. Some of the issues in state data seem to be a result of different interpretations of instructions or definitions. Other
30

issues appear to be a result of choices or mistakes that states made that resulted in the omission of data or introduction of errors. Many of these result in unclear numerators or denominators reminiscent of the 1997 article by Erickson, Ysseldyke, and Thurlow titled “Neglected Numerators, Drifting Denominators, and Fractured Fractions.”
Categorizing Improvement Activities
To examine states’ planned improvement activities, NCEO staff developed a classification system for activities. We started with a sample of four states, reviewing the listed improvement activities and categorizing them. Team members met to discuss proposed categories. This initial coding produced 187 activities for the four states, with a 56% agreement rate. Disagreements (e.g., an activity identified by one staff member was not identified by another) and additional codings (e.g., where the two staff agreed on part of the coding, but one staff member had coded an additional activity). The low rates of agreement reflect the challenge of finding activities within lists that varied from bulleted one activity items to multiple activity items, to entire paragraph narratives containing multiple activities.
Additional attempts to improve agreement among raters did increase agreement considerably. In the second review of the initial states, 196 activities were identified, with 81% agreement. Continued meetings and discussions occurred as two team members coded an additional 10 states. One staff member finished the coding of states’ improvement activities. (The staff member who originally identified the largest number of activities for each state was selected to complete the coding of improvement activities.)
Districts Meeting State’s Adequate Yearly Progress Objective – AYP (Component 3A)
The data source for Component 3A (AYP) was the same data used by states for determining adequate yearly progress for NCLB, which is based on performance in reading and math. A state must meet AYP in both reading and math in order to meet AYP overall. States were instructed to determine AYP calculations with the following formula:
Percent = # of districts meeting the state’s AYP objective for progress for the disability subgroup (children with IEPs) divided by the total # of districts in the state times 100.
Most states reported AYP data; in 2004-2005, 47 states reported these data. The AYP requirement does not apply to Hawaii, which is just one district. Thus, of the 49 regular states required to report AYP data, all but 2 reported the data. One of the two states that did not report data actually provided old data, indicating it would update the data; however, the data were not updated.
31
The AYP requirements for the unique states are not entirely clear, and several unique states are also districts. Not all unique states are required to meet NCLB requirements.
Challenges in Analyzing AYP Data
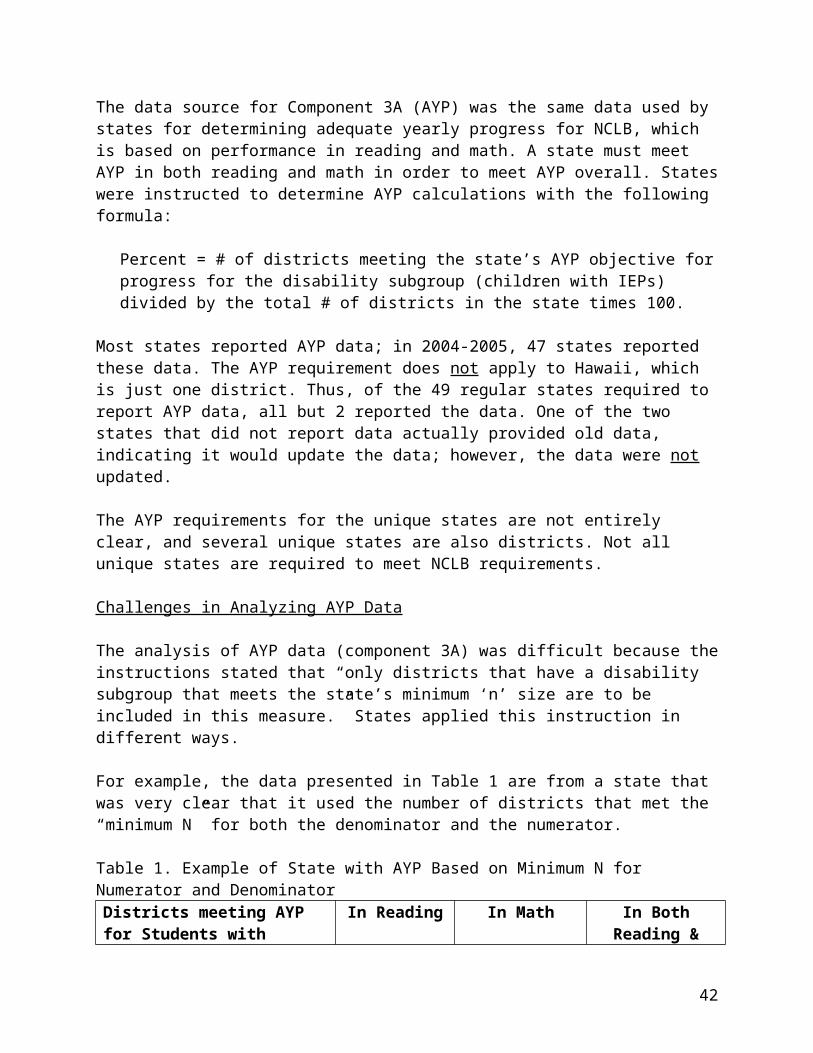
The analysis of AYP data (component 3A) was difficult because the instructions stated that “only districts that have a disability subgroup that meets the state’s minimum ‘n’ size are to be included in this measure.” States applied this instruction in different ways.
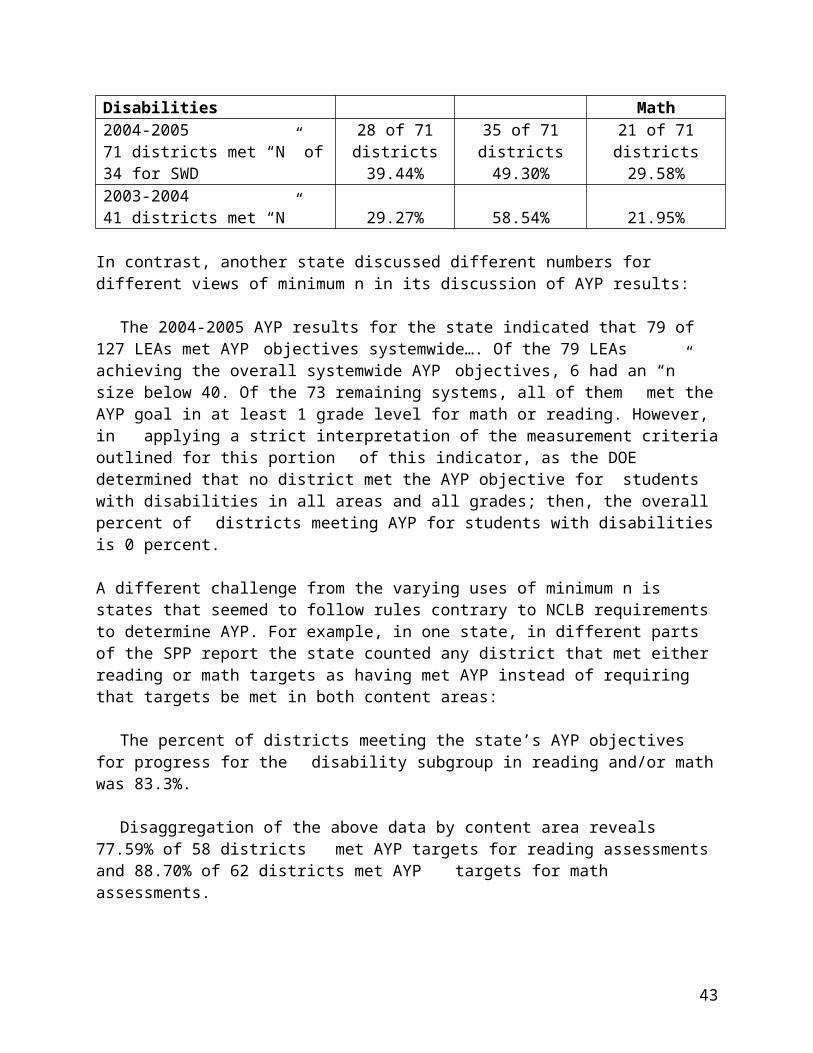
For example, the data presented in Table 1 are from a state that was very clear that it used the number of districts that met the “minimum N” for both the denominator and the numerator.
Table 1. Example of State with AYP Based on Minimum N for Numerator and DenominatorDistricts meeting AYP for Students with Disabilities
In Reading In Math In Both Reading & Math
2004-2005 71 districts met “N” of 34 for SWD
28 of 71districts39.44%
35 of 71districts49.30%
21 of 71districts29.58%
2003-2004 41 districts met “N” 29.27% 58.54% 21.95%
In contrast, another state discussed different numbers for different views of minimum n in its discussion of AYP results:
The 2004-2005 AYP results for the state indicated that 79 of 127 LEAs met AYP objectives systemwide…. Of the 79 LEAs achieving the overall systemwide AYP objectives, 6 had an “n” size below 40. Of the 73 remaining systems, all of them met the AYP goal in at least 1 grade level for math or reading. However, in applying a strict interpretation of the measurement criteria outlined for this portion of this indicator, as the DOE determined that no district met the AYP objective for students with disabilities in all areas and all grades; then, the overall percent of districts meeting AYP for students with disabilities is 0 percent.
A different challenge from the varying uses of minimum n is states that seemed to follow rules contrary to NCLB requirements to determine AYP. For example, in one state, in different parts of the SPP report the state counted any district that met either reading or math targets as having met AYP instead of requiring that targets be met in both content areas:
The percent of districts meeting the state’s AYP objectives for progress for the disability subgroup in reading and/or math was 83.3%.
32

Disaggregation of the above data by content area reveals 77.59% of 58 districts met AYP targets for reading assessments and 88.70% of 62 districts met AYP targets for math assessments.
This information is confusing. The state provides information that appears to indicate that overall AYP performance is 83%. Then a later paragraph refers to disaggregation by content areas, and reports different percentages meeting the targets (77.59% for reading and 88.7% for math). Is it possible to have an overall AYP number that is higher than the lowest percentage in one content area? That is what this state seems to claim in its unorthodox use of the words “and/or.”
Another state that deviated from instructions provided percentages of districts NOT meeting AYP. Simple subtraction produces the correct number, but preparation of a summary is much more difficult when data are not presented in a consistent manner.
Some states generated confusion by supplying extra data, such as the following example:
The addition of proxy percentages was used in calculating AYP. The percentages (14% for reading and 17% for mathematics)…. 62.8% (83 of 132) of [state’s name] public school divisions met Adequate Yearly Progress (AYP) objectives for the students with disabilities subgroup.”
This state used the paragraph format of reporting numbers, and included many different numbers in the paragraphs. We believe the state is referring to the 2% flexibility that allowed states to indicate that students were proficient in a variety of ways, one of which was a “proxy” calculation. This state apparently provided the percentages of students with disabilities who were determined to be proficient on the basis of that flexibility. The words were vague enough, however, to be unclear. The example shows the difficulty of winnowing out which numbers are the numbers of interest for purposes of reporting on AYP component 3A.
Even among states that clearly and accurately calculated AYP results, the data were reported in a way that did not lend themselves to a national summary. Roughly half of the states provided data broken down by content area (reading and math) without an overall AYP figure, while many of the rest provided only overall data on the percent of districts meeting state AYP objectives for the disability subgroups. Only a few states provided AYP both by content area and overall. Overall AYP cannot be derived from separated content area results. Thus, there was no way to produce summary data for the nation.
Example of Well-Presented AYP Data
AYP data that were presented in tables, that clarified the number of districts in the state overall and the number of districts meeting the state-designated minimum n for students with disabilities, and that provided both reading and math AYP data separately as well
33

as their overall data in a clear and easy to find manner were examples of well-presented AYP data.
Table 2 is pulled from one state’s SPP that had clear AYP data presentation. The school year is clearly designated. There is a clear designation of the number of districts overall, as well as the number of districts with the minimum n designated by the state (> 40), and then the number of districts meeting AYP. It is apparent from these data that there are shifts from one year to the next. The data in Table 2 are for English/Language Arts. This state also provided a similar table for Math. In addition, as shown in Figure 1, the state provided a visual picture of the comparison between years for the school levels. The figure may be helpful for visualizing what is happening, but does not substitute for the numbers in the table. It is also important to note that without a table showing AYP data overall (districts meeting AYP on both reading/English Language Arts and math), it is not possible to calculate those data from the two tables that the state provided.
Table 2. One State’s Presentation of District AYP Data for English/Language Arts
School Year Grade Level
Number of
Districts
Number with >40 Spec Ed Students
Number meeting
AYP
Percent meeting
AYP2004 Elementary Schools 15 13 13 100.0%2005 Elementary Schools 15 13 8 61.5%2004 Middle Schools 16 13 8 61.5%2005 Middle Schools 16 12 5 41.7%2004 High School 19 5 3 60.0%2005 High School 19 7 4 57.1%
Figure 1. State’s Graphic Display of AYP DataSpecial Education -
% of Districts Meeting AYP in English/Language Arts
0.0%20.0%40.0%60.0%80.0%
100.0%
ElementarySchools
MiddleSchools
High School
20042005
Another state presented its AYP data in a different way (see Table 3), but still in a way that was clear and easy to determine the basic information requested. This state provided all the information requested. It indicated the number of districts that met the minimum n designated by the state. It indicated the number of districts meeting AYP for
34
students with disabilities in reading, in math, and in both reading and math – in 2004-2005 and 2003-2004. This is a simple and clear presentation of the data requested. (This table is a replication of Table 1.)
Table 3. One State’s Presentation of District AYP DataA. 29.58% of districts (that met the N of >34 SWD) met AYP objectives for
progress for SWD during 2004-2005Districts making AYP for SWD
Met AYP for SWD in Reading
Met AYP for SWD in Math
Met AYP for SWD in Both Reading & Math
2004-2005 71 districts met N
of 34 for SWD
28 of 71 districts
39.44%
35 of 71 districts
49.30%
21 of 71 districts
29.58%
2003-2004 41 districts met “N” 29.27% 58.54% 21.95%
AYP Summary
A national summary of AYP data would enable us to answer questions such as these:
What is the average number of districts nationally that is meeting AYP for students with disabilities?
What is the range in the number of districts meeting AYP for students with disabilities?
What is the average number of districts nationally that is meeting AYP for students with disabilities for Reading and Math?
What is the range in the number of districts meeting AYP for students with disabilities for Reading and Math?
The point in having these numbers is to be able to look at them again next year and the year after in a way that would mean the same thing from year to year. At this point, with the data that we have for 2004-2005, we do not have the data that we need for examining trends in AYP for students with disabilities across years. In summary, even for states that provided unambiguous results we found:
Only a few states report AYP data both overall and by content Some states report AYP data overall, but not by content Some states report AYP data by content, but not overall; it is not possible to
derive an overall AYP from this information
Thus, no common ground exists to produce a national AYP summary.
35
Participation of Students with Disabilities in State Assessments (Component 3B)
States were instructed to use the same data to determine 3B (Participation) as they would use for their 618 Report (Annual Report of Children Served). They were instructed to use the following formulas for computing percentages:
Participation rate =
a) # of children with IEPs in grades assessedb) # of children with IEPs in regular assessment with no accommodations
(percent = ‘b’ divided by ‘a’ times 100)c) # of children with IEPs in regular assessment with accommodations
(percent = ‘c’ divided by ‘a’ times 100)d) # of children with IEPs in alternate assessment against grade level
standards (percent = ‘d’ divided by ‘a’ times 100)e) # of children with IEPs in alternate assessment against alternate
achievement standards (percent = ‘e’ divided by ‘a’ times 100)
Additionally, states must:
• Account for any children included in ‘a’, but not included in ‘b’, ‘c’, ‘d’ or ‘e’ above;• Provide an overall Percent = ‘b’ + ‘c’ + ‘d’ + ‘e’ divided by ‘a’
All 50 regular states reported participation data in some fashion, although one state reported data from the 2003-2004 school year instead of the requested 2004-2005 school year data. Nine of the ten unique states reported participation data. More than three-fourths of the states provided data by content area; seven states provided only overall data and one state provided grade level data. Contrary to the situation with AYP computations, participation data would sometimes permit deriving overall results from content area results. Unfortunately, there are other hindrances to making national comparisons.
Challenges in Analyzing Participation Data
As with the AYP data (component 3A), discrepancies among states started with how states followed the instructions. The instruction phrasing, “Number of children with IEPs in grades assessed,” could be interpreted as “the number of children with IEPs who are enrolled in the grades assessed,” or it could be interpreted as “the number of children with IEPS who were assessed in each grade when testing occurred.”
The second interpretation would be the one most likely to produce a participation rate of 100%. The difficulty in knowing how to interpret results for states reporting 100% participation was exacerbated when no information was reported on invalid assessments or on those students who were not assessed for various reasons. If a state reported exactly 100% participation, it could mean that no tests were declared
36

invalid and that no students were excused from testing, and no students were absent. This is unlikely.
Only 28 regular states and 3 unique states accounted for students not assessed. Table 4 is an example of one state’s reporting of this information.
Table 4. Example of State’s Accounting for Students Not AssessedWithdrew
BeforeCompletio
n
Non-allowed
Accomm.LanguageExemption
ParentalRefusal
ExtremeFrustration
OtherNon-
completion13 55 4 19 377 1,067
One example of a state that appeared to have used the number of students assessed as its denominator in calculations it made is shown in Table 5. The numbers in this table show first that the state percentages of participation are based on a number (10,247) that is listed as the number of special education students tested. The counts of students who took the regular assessment with no accommodations plus the number who took the regular assessment with accommodations adds to that total number and the percentages add to 100%. In addition, the percentage participating in the alternate assessment against alternate achievement standards seems to have been calculated using the same 10,247 as the denominator even though adding the counts from that assessment to the counts from the regular assessment would bring the total number tested to more than 10,247. Note also that summing the percentages of participants in all types of testing would come to more than 100%.
Table 5. Example of State That Used Number Assessed as its DenominatorSpecial Education Participation on the State Assessment
(name of test)Grade 4 Reading
SpEd Tested
Regular No Accommodations
Regular With Accommodations
Alternate Against Grade
Alternate Against
AlternateCount 10,247 6,854 3,393 0 743Percent 66.89% 33.11% 0.00% 7.25%
On the other hand, Table 6 provides an example of a state that clearly did use the number enrolled as the denominator. In this table, the state is trying to be very clear about what is included and what is not included. The bottom line for this state is to account for all options, and then to use the number of students with IEPs as the denominator.
By looking very carefully at Table 6, however, it becomes clear that there is an issue present.
37
Table 6 indicates the total number of students with IEPs who are Test Takers for Grade 4 is 4520.
Adding the numbers representing actual test takers results in a different number, 4314 (3913 + 206 + 195 = 4314)
So is the percentage of students with IEPS who took the test actually 93.9% rather than the 98.39% reported on the table?
This same discrepancy occurs in each column in Table 6. The state probably subtracted the number of students recorded as “not tested” from the enrollment to obtain the number tested, and doubled up on one of the numbers, perhaps the alternate assessment number. Whatever the reason for the miscalculation, this serves as a good example of the kind of errors made even by states trying to be meticulous in their calculations for the SPP.
Table 6. Example of State that Used IEP Enrollment as Its DenominatorParticipation
Grade 4
Grade 8
Grade 11
Students with IEPs 4594 6014 4682All Students 29,103 31,822 30,846Students with IEPs who took Regular Assessments on grade level, Full Academic Year 3913 5232 3961
Students with IEPs who took Regular Assessments out of grade level, Full Academic Year ---- ---- ----
Students w/IEPs who took Alternate Assessments 206 233 238Students with IEPs who took Regular Assessments on grade level, NOT Full Academic Year 195 248 148
Students w/IEPs who did not take Assessments 74 68 131Total Students with IEPs Test Takers 4520 5946 4552Students with IEPs Participation Rate 98.39 98.87 97.22Students without Disabilities Participation Rate 99.8 99.53 98.94
Example of Well-Presented Participation Data
Participation data that were presented in tables, with both numbers and percentages, and that accounted for students not participating were examples of well-presented data. These data had clearly been cross-checked, with rows and columns adding up.
An example of a simple table showing the basic information is presented in Table 7. In this table, numbers and percentages are presented by content area for subcomponents a-e, and the overall participation rate is presented at the beginning of the information that the state presented. This table did not present the participation data by the grades in which the tests were administered, nor did it provide in the table the reasons for students who did not participate in any of the assessment options. Some of this information may have been presented within the text, but finding information within the
38
text is much more difficult, and less reliable than having it presented clearly within a table.
Table 7. One State’s Presentation of Participation Data B. Participation rate for students with IEPs: 99.8%
Participation Rate for SWD 2004-2005 Reading Number
Reading Percent
Math Number
Math Percent
a. Total number of students on IEPs in the grades assessed 14,803 14,803b. Spring [test] 2005 no accommodations 6,385 43.1% 4,766 32.2% c. Spring [test] 2005 with accommodations 7,442 50.3%
9,064 61.2%
d. Alternate assessment against grade level standards NA NA NA NAe. [State] Alternate Assessment against alternate 951 6.4% 944 6.4%
Another state presented all of its Participation data, by grade and by content area, in one table. These data (reproduced in Table 8) are very clear; it easy to determine how numbers fit together and add up.
Table 8. One State’s Presentation of Participation Data by Content and GradeIndicator 3B: Participation rate for children with IEPs in a regular assessment with no accommodations; regular assessment with accommodations; alternate assessment against grade-level standards; alternate assessment against alternate achievement standards.
Statewide Assessment --
Spring 2005
Math Assessment ELA AssessmentGrade
4Grade
8Grade
10Total Grade
4Grade
8Grade
10Total
# % # %
a
Children with IEPs in grades assessed 11034 7872 5834 24740 11036 7871 5818 24725
b
Children with IEPs in regular assessment with no accommodations 2426 967 820 4213 17.03% 2422 968 799 4189 16.94%
c
Children with IEPs in regular assessment with accommodations 8064 6221 3881 18166 73.43% 8069 6224 3882 18175 73.51%
39
d
Children with IEPs in alternate assessment against grade- level standards* 0 0 0 0 0.00% 0 0 0 0 0.00%
e
Children with IEPs in alternate assessment against alternate achievement standards 498 591 946 2035 8.23% 498 594 950 2042 8.26%
Overall (b+c+d+e) Baseline 10988 7779 5647 24414 98.68% 10989 7786 5631 24406 98.71%
Children included in a but not included in the other counts above
Parental Exemptions 0 0 0 0 0 0 0 0
Absent 30 44 49 123 29 42 46 117 Not assessed for other reasons 16 49 138 203 18 43 141 202
Participation Summary
The examples provided in this section demonstrating the need to be cautious about calculations highlight the importance of states providing both raw numbers and percentages as the instructions indicated. Some states provided only numbers; some states provided only percentages. Both are needed.
Because of the inconsistency in the denominators that states used, it is impossible to provide a national summary of the participation of students with disabilities overall. Similarly, we cannot provide a summary of participation in the regular assessment with and without accommodations, participation in alternate assessments based on grade level achievement standards, or participation in alternate assessments based on alternate achievement standards.
Performance of Students with Disabilities on State Assessments (Component 3C)
States were to report on the proficiency rates of students with disabilities based on their 2004-2005 state assessments. They were instructed to calculate proficiency rates according to the following formula:
Proficiency Rate =
a) # of children with IEPs in grades assessed
40
b) # of children with IEPs proficient in regular assessment with no accommodations (percent = ‘b’ divided by ‘a’ times 100)
c) # of children with IEPs proficient in regular assessment with accommodations (percent = ‘c’ divided by ‘a’ times 100)
d) # of children with IEPs proficient in alternate assessment against grade level standards (percent = ‘d’ divided by ‘a’ times 100)
e) # of children with IEPs proficient in alternate assessment against alternate achievement standards (percent = ‘e’ divided by ‘a’ times 100)
Thus, the overall percentage should equal all students included in ‘b’+ ‘c’ + ‘d’ + ‘e’ divided by ‘a’ x 100.
Challenges in Analyzing Assessment Performance Data
In reporting performance data, additional levels of complication emerged in how states applied the instruction to use as the denominator ‘a’ the number of students in grades assessed. In some cases, the denominator dwindled from the number of students enrolled down below the number of students assessed, to include only the number of students for whom there was a valid score that could be used for determining proficiency. With the increasing variations in the denominator, a national summary of proficiency rates was impossible.
Table 9 shows an example of a state that used as a denominator the number of students taking each specific type of test (e.g., the percent of regular assessments with no accommodations taken that were passed).
Table 9. Example of State That Used Number Taking a Specific Type of Test as its Denominator for Proficiency
Test Type
Number of Tests
Passed
Number of Tests Failed
Total Number of
Tests
Percent Tests
PassedRegular Assessment No Accommodations 63,960 26,858 90,818 70.4
Regular Assessment With Accommodations 276,102 283,510 559,612 49.3
Alternative Assessment Against Grade-Level Standards
1,502 517 2019 74.4
Alternate Assessment Against Alternate Achievement Standards
14,856 534 15,390 96.5
In addition to denominator issues, more steps in the computations allow for more errors in data entry and in calculations. Table 10 shows an example of a state with a data entry error that appears to have resulted from a cut-and-paste mistake. (Notice that the numbers in columns 2, 3, and 4 are exactly the same, even though the final column
41
contains different numbers. While this is conceivably possible, it is highly unlikely that the numbers would lay out this way.)
Table 10. Example of State That Made a Data Entry Error – Probably a “Cut-and-Paste” Mistake
Content Area
Reg. Assess. w/o Accommodations
Reg. Assess. w/ Accommodations
Alt. Assess. Alternate
Achievement Standards
Overall Proficiency
Reading 40.41 19.07 6.13 65.61Math 40.41 19.07 6.13 50.77
Other challenges with the proficiency data included:
Fewer than half of all regular states reported proficiency data by content and by grade level.
Five states reported only overall proficiency numbers, and did not provide specific data for sub-components b (regular assessment, no accommodations), c (regular assessment, with accommodations), d (alternate assessment against grade level standards) and e (alternate assessment against alternate achievement standards).
Several states were missing data on either accommodations or alternate assessments.
One state reported performance data from the 2003-04 school year, rather than the requested 2004-05 school year.
Table 11 shows a table provided by one state to summarize the percentage of students who were proficient on its state assessment. The table clearly lays out the numbers enrolled in each grade, the number proficient, and then the percent proficient. This state has used as the denominator, the number tested – this number should be the number of IEP students enrolled. It is very clear to tell, however, what the state has done, making it clear to chart over time, and for individuals who are going back to look at baseline to know what exactly the baseline data were.
Table 11. One State’s Presentation of Performance Data by Content and Grade (only Reading part of table shown here) 4th Grade 8th Grade 11th Grade
Reading
# Te
sted
(Sho
uld
beE
nrol
led)
# P
rofic
ient
%
Pro
ficie
nt
# Te
sted
# P
rofic
ient
%
Pro
ficie
nt
# Te
sted
# P
rofic
ient
%
Pro
ficie
nt
Proficient - no accommodations 373 139 37% 448 75 17% 398 60 15%Proficient - accommodations 1802 315 17% 1944 136 7% 1433 65 5%
Proficient - Alt, 192 19 10% 209 28 13% 138 15 11%
42
alternate standardsTotal 2367 473 20% 2601 239 9% 1969 140 7%
Table 12 is a reproduction of a table provided by of another state that presented performance data by content and grade. In this case, the denominator is the percent of students enrolled, and each of the subcomponents in the calculation is clearly identified, and how the percentages were calculated is provided as well (only the Math data from the state’s table are presented in Table 12).
Table 12. One State’s Presentation of Performance Data by Content and Grade (only Math part of table shown here)
Grade Level
a. Number
of Children with IEPs in grades assessed
b.Proficient or above in the
Regular Assessment
With No Accommodations
(Percent = b/a*100)
c.Proficient or above in the
Regular Assessment
With Accommodations
(Percent =c/a*100)
d.Proficient or above in the
Alternate Assessment
Against Grade Level Standards(Percent = d/a*100)
e.Proficient or above in the
Alternate Assessment
Against Alternate
Achievement Standards(Percent =e/a*100)
Overall Percent =(b+c+d+e)
divided by a.
3 7,794 2,623(33.65%)
980(12.57)
371(4.76)
194(2.49)
53.48%
5 9,256 2,914(31.48)
1,286(13.89)
363(3.92)
187(2.02)
51.32
7 8,666 2,030(23.42)
630(7.27)
240(2.77)
238(2.75)
36.21
11 7,912 1,671(21.12)
211(2.67)
323(4.08)
285(3.60)
31.47
Performance Summary
Creating a summary of performance on state assessments overall was not possible because of inconsistencies in the denominators that states used. Similarly, we cannot provide a summary of performance on the regular assessment with and without
43

accommodations, performance on alternate assessments based on grade level achievement standards, or performance on alternate assessments based on alternate achievement standards.
TARGETS
States were required to designate measurable and rigorous targets for Indicator 3 each of the federal fiscal years through 2010-2011. These targets were intended to align with the improvement activities also specified in the report. Targets were developed for AYP, participation, and performance.
One interesting finding was that some states anticipated annual decreases for certain grades and content areas, for AYP, participation, or performance. Table 13 provides an example of one state that targeted a decrease in districts meeting AYP.
Table 13. Example of State with Targets for AYP that DecreaseMeasurable and Rigorous Targets
AYP Participation PerformanceBaseline(2004-2005)
Math: 100%Read: 100%
Math: 97%Read: 97%
Math: 39%Read: 47%
2010-2011 Math: 41%Read: 50%
Math: 100%Read: 100%
Math: 77%Read: 87%
Another finding was that several states selected relatively flat performance targets, ones that would require an unrealistic amount of improvement in the last few years to achieve the NCLB requirement of achieving 100% proficiency for all by 2013-14. An example of this is shown in Table 14.
Table 14. Example of State with Targets for Performance that are Very LowMeasurable and Rigorous Targets
AYP Participation PerformanceBaseline(2004-2005)
Math: 37%Read: 45%
Math: 99%Read: 99%
Math: 14%Read: 24%
2010-2011 Math: 45%Read: 52%
Math: 99%Read: 99%
Math: 17%Read: 26%
Despite these unique findings, it is possible to provide some summary information for the targets.
44
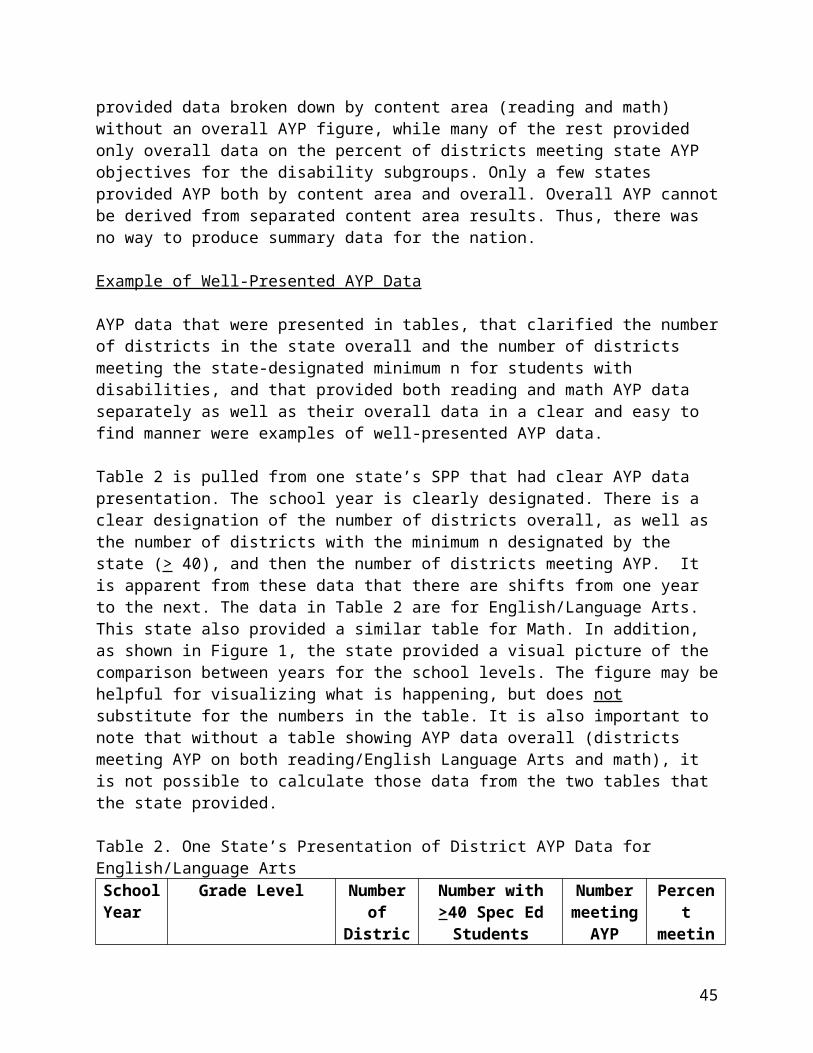
AYP Targets
AYP target information was provided by 45 regular states and 2 unique states. Table 15 shows the range in the targets and the median average annual increase across these states.
Table 15. Target for Annual Increase in Percent of Districts Meeting AYPProvided Target Information:
Range of Target Performance Median Average Annual IncreaseLow High
45 States Annual Decrease of 9%
Annual Increase of 13% 2.0%
2 Unique States Annual Increase of 2%
Annual Increase of 9% 5.5%
Participation Targets
Targets for participation are summarized in Table 16. This information was provided by 46 regular states and 9 unique states. Nearly every state was aiming for at least 95 percent participation of students with disabilities by 2010-11. However, for some states, this was actually a decrease from their current participation levels. Sixteen states indicated that they are aiming for 100 percent participation of students with IEPs in their statewide testing system by 2010-11, and six unique states had that as their goal.
Table 16. Targets for Participation RatesProvided Target Information:
Range of Target Performance Median Average Annual IncreaseLow High
46 States 90% participation 100% participation 99% 9 Unique States 93% participation 100% participation 100%
Performance Targets
States were asked to provide annual targets for proficiency. These data are provided in Table 17, converted to average annual yearly targets in order to provide a measure of comparison. A total of 44 regular states and 9 unique states provided these data.
Table 17. Targets for Proficiency Rates
Provided Target Information:
Range of Target Annual Increase in Performance Median Average
Annual IncreaseLow High
44 States 1% average annual increase
10% average annual increase 5%
9 Unique States 1% average annual increase
11% average annual increase 5%
45
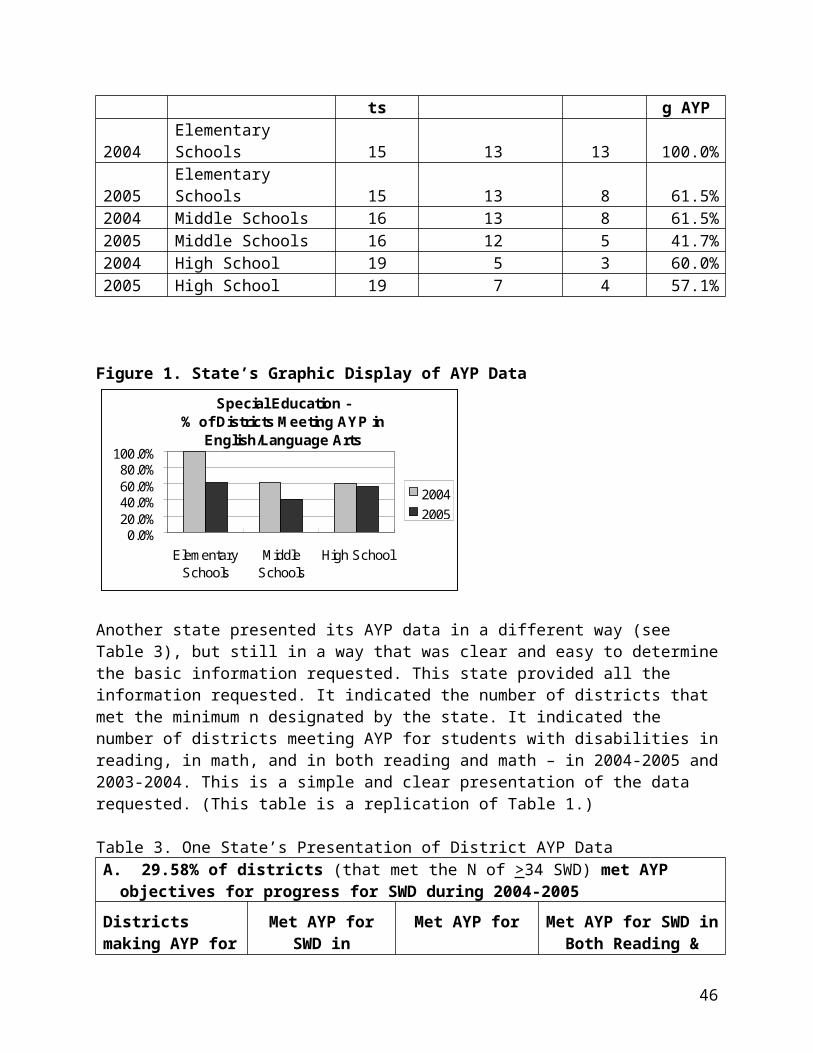
Improvement Activities
States were directed to describe the Improvement Activities they would complete over six years, including timelines and resources. There was great variation in how states organized and presented this information.
Sixteen categories were used to organize improvement activities:
1) Reading/Literacy Programs and Interventions2) Math Strategies3) Training of Stakeholders, including Development and Evaluation4) Activities related to Data Analysis, Reporting, Data Provision, and Training of
Stakeholders5) Activities related to Standards-based Curriculum, Accommodations, Access to
the General Curriculum, Differentiated Instruction, Universal Design for Learning, and Training of Stakeholders
6) Activities related to General Assessment, Accommodations, Universal Design, Participation, and Training of Stakeholders
7) Activities related to Alternate Assessment, Participation, and Training of Stakeholders
8) Monitoring Improvements and Implementation of Improvement Plans, including State Improvement Grants
9) Collaboration with Other Departments and Entities10)Sharing Best Practices11)School-wide interventions such as Positive Behavioral Supports, and Response
to Intervention (RTI)12)Implementation of Technology; Assistive Technology13)Teacher quality, recruitment, retention, mentoring and incentives14)Others (Difficult, lower incidence responses such as Inclusion of Special
Education services and special education alignment in the accreditation process of school districts)
88) Unclear99) Requirements of NCLB, IDEA or steps toward compliance
Challenges to Summarizing Improvement Activities
States’ improvement activities were presented in their SPPs in a variety of formats. Some states listed activities that fit neatly into one of the categories. For example, a state improvement activity that would clearly fall into category #1 was: “Implement comprehensive reading programs.” Our agreement on those activities was quite high.
Some states wrote lengthy paragraphs in which they clumped together a number of activities. Multiple categories of improvement activities were assigned to these when appropriate; but, sometimes it was difficult to determine the intent of a paragraph and
46
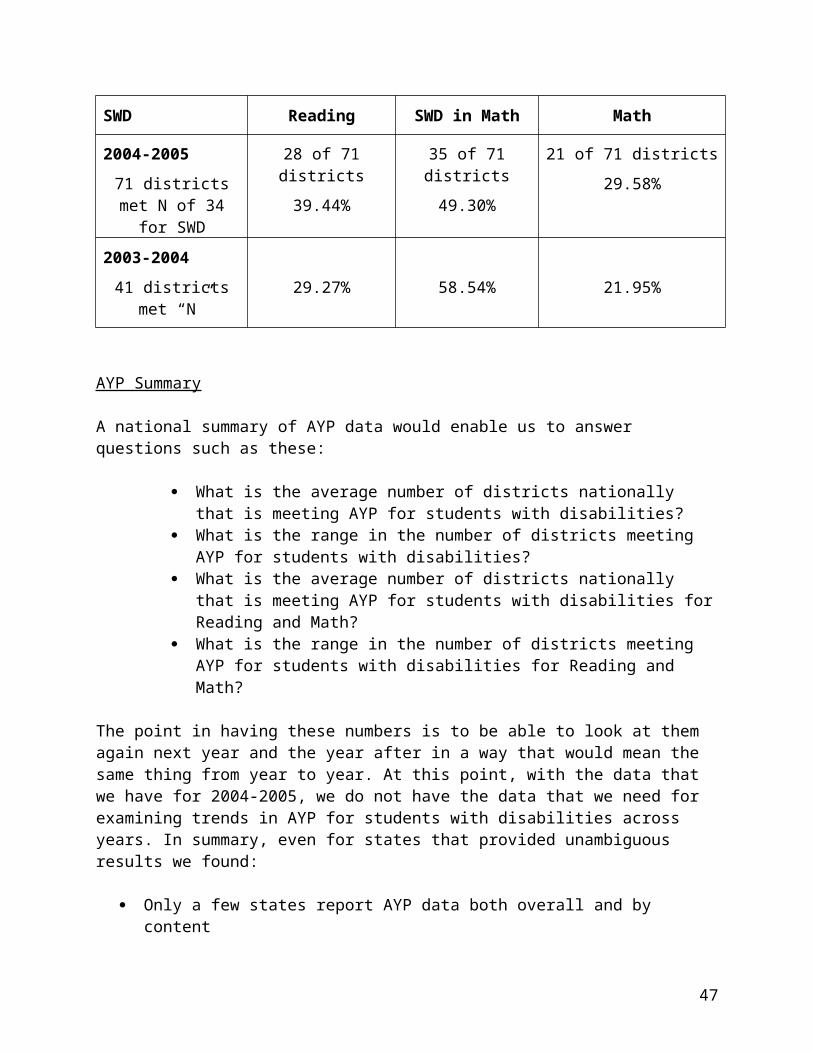
therefore the specific improvement activities. The following is an example of an “improvement activity” paragraph that could fall into many categories:
Continue to work cooperatively with the SIG staff to scale up efforts across the state to improve student engagement through the use of Makes Sense Strategies, Positive Behavior Supports, intervention reading strategies and the recruitment and retention of highly qualified teachers.
The categories of improvement activities used to describe this strategy were
Category #1 – Reading/Literacy Programs and Interventions Category #9 – Collaboration with other departments and entities Category #11 – School-wide interventions such as Positive Behavior Supports
and Response to Intervention Category #13 – Teacher Quality and Retention
Category #8 might have been used as well because the passage mentioned State Improvement Grants. We opted not to use that code because the State Improvement Grant was not a primary focus of the activity.
Summary of Improvement Activities
Many states’ improvement activities were vague. To summarize them required a “best guess” on our part as to what the activity actually entailed. A summary of improvement activities is shown in Table 12. The numbers reflect the number of states that indicated they were going to undertake at least one activity that would fall under a specific category. A state may have mentioned several specific activities under the category, or merely mentioned one activity that fit into the category.
Table 12. State Improvement Activities
Description (Category #)Number Indicating Activity
Regular States
Unique States
Reading/Literacy Programs and Interventions (1) 24 3Math Strategies (2) 13 1Training of Stakeholders (3) 23 5Data-related Activities (4) 36 5Standards-based Curriculum and Access to General Curriculum* (5) 38 4Activities Related to General Assessment (6) 28 6Activities Related to Alternate Assessment (7) 20 5Monitoring Improvements (8) 26 2Collaboration (9) 27 3Sharing Best Practices (10) 8 2School-wide Interventions (11) 22 1Implementation of Assistive Technology (12) 19 2
47

Teacher-related Strategies (13) 12 2Other (33) 26 4Unclear Statements (88) 7 1Basic Requirements of NCLB or IDEA (99) 20 4
* This included such topics as accommodations, differentiated instruction, and universal design for learning.
Improvement Activities by Category
Reading/Literacy Programs and Interventions (Category #1)
We found 24 regular states and 3 unique states that listed activities that fit the Reading/Literacy Programs and Interventions category. Nearly twice as many states indicated they were doing a reading strategy than those doing a math strategy.
Math Strategies (Category #2)
Thirteen regular states and one unique state indicated they would be undertaking math strategies. Overall, 13 states listed both math and reading activities. Half the states cited neither reading nor math activities (25 regular states, 7 unique states).
Training of Stakeholders (Category #3)
This category focused on training of stakeholders, including development and evaluation. Nearly half of the regular states as well as five unique states listed activities that fit this activity category. Examples of this category are:
Provide training for teachers to increase their effective strategies. Conduct training on research-based instructional strategies for diverse
learners.
Data-related Activities (Category #4)
This category included activities related to data analysis, reporting, data provision, and training of stakeholders with a focus on data-related activities. We found activities in this area for 36 regular states and 5 unique states. An example of an activity in this category is the following:
Continue to monitor state accountability assessment data results, report the data to the public, and provide on-site assistance to administrators, general education teachers, and special education teachers as needs are indicated on instructional use of assessment data.
Standards-based Curriculum and Access to the General Curriculum (Category #5)
48

This category covered activities related to standards-based curriculum, accommodations, access to the general curriculum, differentiated instruction, universal design for learning, and training of stakeholders in these topics. We coded 38 regular states and 4 unique states as having at least one activity of this type. Examples include:
Conduct technical assistance trainings on modifications/accommodations within grade level curriculum content areas.
Train teachers with job embedded strategies that are aligned with the standards and curriculum.
Universal design for teaching/learning fit in this category. Universal design for assessment was categorized as Activities Related to General Assessment (Category 6).
Activities Related to General Assessment (Category #6)
This covered activities related to general assessment, accommodations, universal design for assessment, participation, and training of stakeholders. We found 28 regular states and 6 unique states that fit into this category. An example of a category #6 activity was:
Training by the staff of the Special Education Unit and the ADE Accountability Unit on the proper use of accommodations on the benchmark will be given to all persons involved in the administration of the exams.
Activities Related to Alternate Assessment (Category #7)
The focus of this category is alternate assessment, participation, and training of stakeholders. We found 20 regular states that listed this type of improvement activity, as well as 5 unique states. Examples include:
Conduct training for ALL staff on the scoring of alternate assessments. Provide technical assistance and training for teachers, administrators and
parents on alternate assessment expectations.
Monitoring Improvements (Category #8)
These activities focused on monitoring improvements and implementation of improvement plans, including State Improvement Grants. For this category, we noted 26 regular states and 2 unique states that listed activities. An example:
Revise monitoring procedures to require agencies with below average reading achievement scores for SWD to complete a root cause analysis and improvement plan.
Collaboration (Category #9)
49
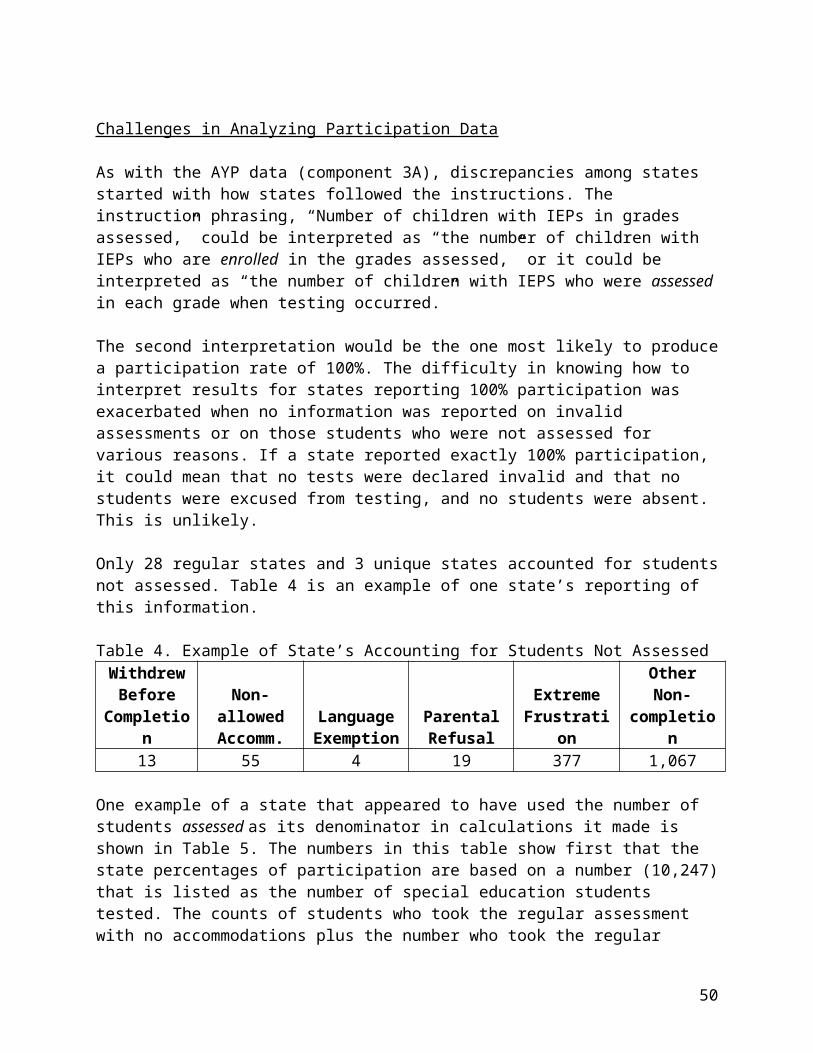
Over half of the states (27 regular states and 3 unique states) indicated they were going to collaborate with other departments or entities. As an example:
Community-based collaboration with city agencies to promote the importance of preparation and participation in school testing programs with support and incentives.
Sharing Best Practices (Category # 10)
This group of activities involved sharing best practices. Only 8 regular states and 2 unique states included this strategy. An example of a state activity that was categorized as a #10:
Identify and distribute effective strategies used in districts with high-performing SWD on state assessments.
School-wide Interventions (Category # 11)
Nearly half the regular states (22) and 1 unique state included activities that were coded as School wide interventions such as Positive Behavioral Supports, and Response to Intervention (RTI). An example:
Establish a statewide procedure for agencies electing to use RTI as an identification strategy for special education”.
Implementation of Assistive Technology (Category #12)
This focused on implementation of technology and assistive technology. We found 19 regular states and 2 unique states that included this strategy. An example:
Provide coordinated training and technical assistance on the need for and use of assistive technology (AT) with a focus on access to the general curriculum and support for including students with disabilities in the general classrooms and community settings and make available at (website).
Teacher-related Strategies (Category #13)
This focus included activities in the area of teacher quality, recruitment, retention, mentoring and incentives. Twelve regular states and 2 unique states mentioned at least one activity in this area. An example:
Identify and implement innovative teacher and related services personnel recruitment and retention initiatives.
50
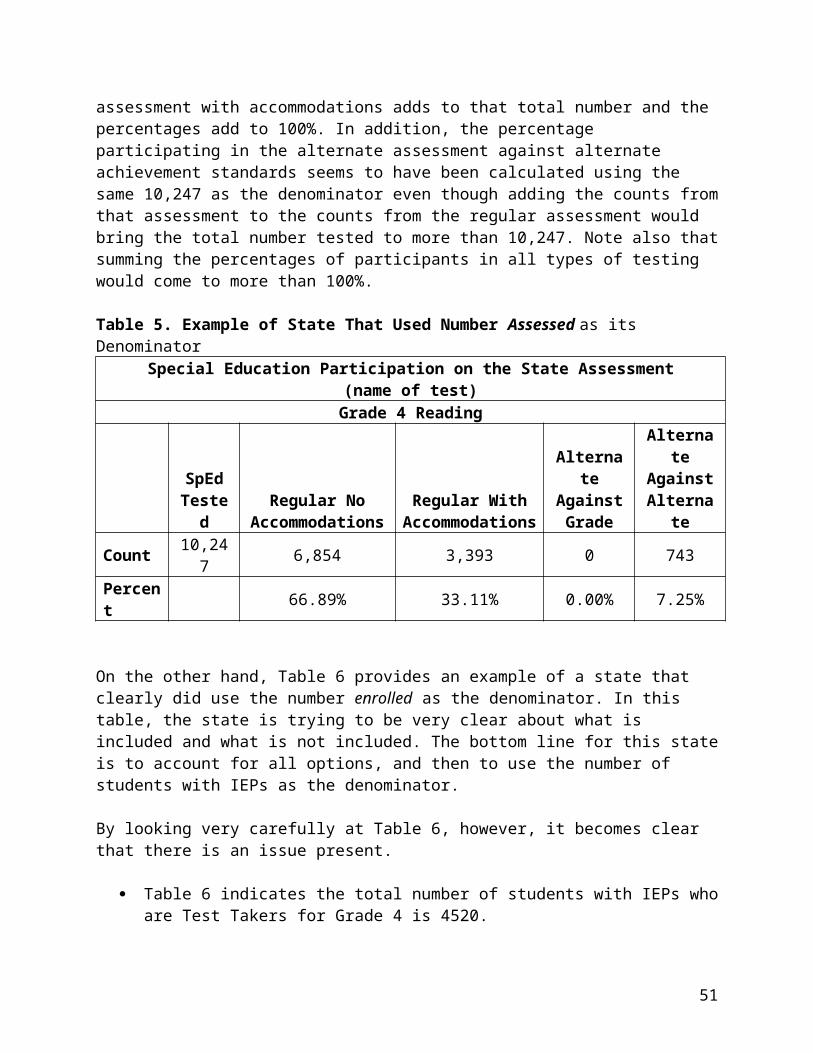
Other (Category #33)
Several activities were difficult to code or were lower incidence responses. We found these for over half of the regular states (26) and 4 unique states. An example of an “other” activity was:
Ensure the appropriate inclusion of Special Education Services as well as general and special education alignment in the accreditation process of school districts.
Unclear Statements (Category # 88)
There were also activities listed that were simply unclear. These could not be correctly categorized without additional information. Seven regular states and one unique state listed activities that we coded as “unclear.” A couple examples of activities we coded this way were the following:
Connections and relationships are made with other district schools’ practices (feeder schools).
[STATE] continues to have a strong commitment to the inclusion and increased performance of students with disabilities in our state assessment.
Basic Requirements of NCLB or IDEA (Category #99)
There were 20 regular states and 4 unique states that appeared to list activities that were basic requirements. Basic requirements of NCLB or IDEA, or steps toward compliance with these laws were not considered to be improvement activities. Examples included:
Identify an alternate assessment against grade level standards. Develop item specifications and items for alternate assessment.
Conclusion
SPP Indicator 3 on the districts meeting AYP and the participation and performance of students with disabilities in state assessments provided states an opportunity to document their assessment results, establish targets for improvement, and layout improvement activities for reaching these targets. Although this has been an important effort for states to engage in, creating a national summary of 2004-2005 assessments based on the information in the SPPs on Indicator 3 is not possible. This is due to many reasons, including misinterpretation of directions, provision of non-comparable data, and mistakes in data presented. Without a data summary from 2004-2005 that is somewhat comparable to data summarized from the 2002-2003 and 2003-2004 school years, an important point in the longitudinal chain is missing – a chain that will allow for
51
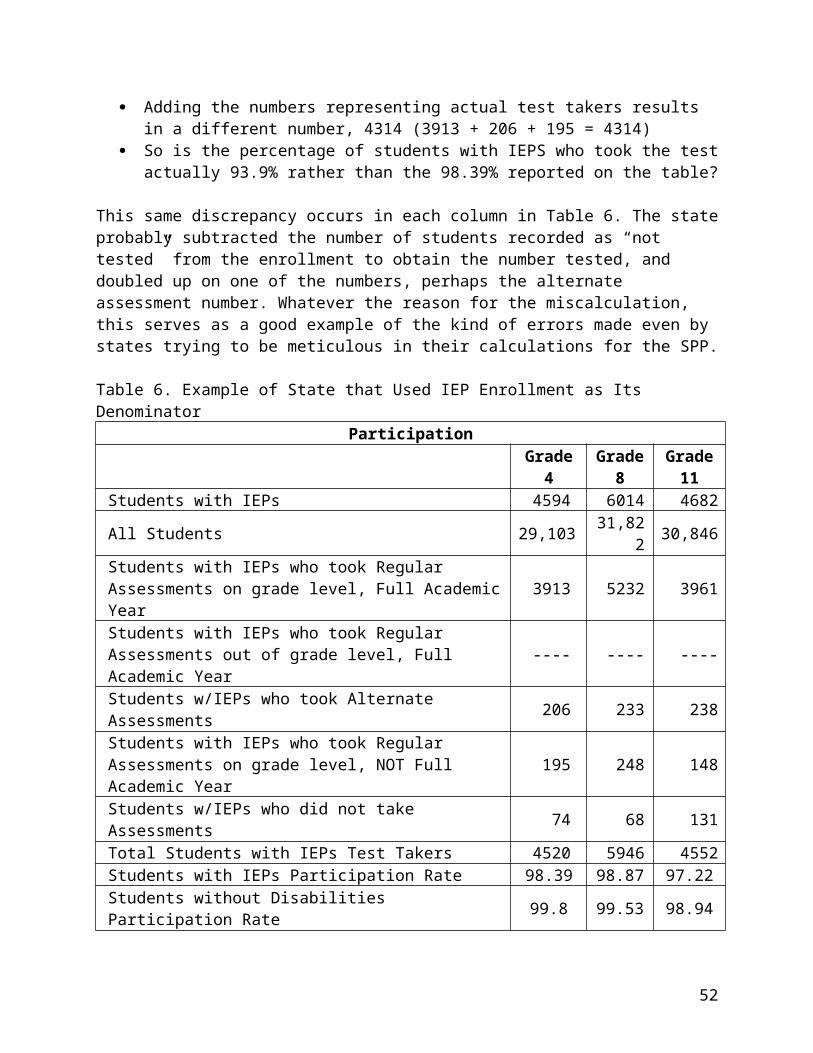
watching changes in the participation and performance of students with disabilities on assessments over time.
States did submit Table 6 with their 618 report in February 2006. This table also contains the data needed for longitudinal comparisons, but requests it in a way that reduces the likelihood of misinterpretation of instruction or entry of mistakes. Using these data rather than the data in states’ SPPs may be the best option for developing a national summary at this point.
Nevertheless, the issues remain with the baseline data in the SPP. These data, and data in subsequent annual performance reports (APRs) should be consistent with each other. In the future, Table 6 of 618 will be completed before the APRs are due. Attaching Table 6 to states APRs will assist in helping to make sure that all data are clear.
There are some approaches to presenting data in APRs that will improve the utility of state reported assessment data for national analyses:
Present data from the appropriate school-year correctly the first time Present data in table format Ensure that all data included in text matches those in all tables Ensure that directions for computation are understood and followed appropriately Check all entered data for data-entry errors Ensure that all denominators used are consistent with the standard computations
being used across states (most often, IEP enrollment) Include all necessary data broken down by grade level and by content area
assessed as well as including overall data Include all necessary data broken down by subcomponents, such as regular
assessments with and without accommodations, and alternate assessments (based on grade-level achievement standards and based on alternate achievement standards)
Issues with establishing targets and developing improvement activities have less direct effect on being able to observe progress in student participation and performance, but may determine how much progress is made. Thus, thoughtful preparation of improvement activities in the following ways is warranted:
Match target numbers with specific yearly improvement activities Specify improvement activities in “one-per-statement” form Ensure that improvement activities are clear to those who work both inside and
outside the state
ReferenceErickson, R., Ysseldyke, J., & Thurlow, M. (1997). Neglected numerators, drifting denominators, and
fractured fractions: Determining participation rates for students with disabilities. Diagnostique, 23 (2), 105-115.
52

INDICATOR 4: SUSPENSION/EXPULSION
Analysis of SPP Discipline DataIndicator #4A and B: Suspension/Expulsion
This document summarizes analysis of suspension/expulsion data from Indicator #4 of the Part B SPPs.
The indicators used for SPP reporting suspension/expulsion data are as follows:
A. Percent of districts identified by the state as having a significant discrepancy in the rates of suspensions and expulsions of children with disabilities for greater than 10 days in a school year; and
B. Percent of districts identified by the state as having a significant discrepancy in the rates of suspensions and expulsions of greater than 10 days in a school year of children with disabilities by race and ethnicity. (NEW)
As noted, Section B of Indicator #4 is new. Baseline data and targets are to be provided in the FFY 2005 APR due February 1, 2007. In the SPP, states were asked to describe how data are to be collected so that the state will be able to report baseline data and targets. Because Section B is new, most of the discussion in this analysis concerns Section A, unless otherwise noted.
Measurement of these indicators was defined in the requirements as:
A. Percent = # of districts identified by the state as having significant discrepancies in the rates of suspensions/expulsions of children with disabilities for greater than 10 days in a school year divided by # of districts in the state times 100.
B. Percent = # of districts identified by the state as having significant discrepancies in the rates of suspensions/expulsions for greater than 10 days in a school year of children with disabilities by race and ethnicity divided by # of districts in the state times 100.
States are required to include their definition of “significant discrepancy.”
Analysis
We compiled all of the SPPs for the 50 states, DC, and nine territories. (For purposes of this discussion, we will refer to all as states, unless otherwise noted.) We developed a table matrix based on the elements that states were required to include for this indicator. The matrix includes the following:
Method of Comparison;
53
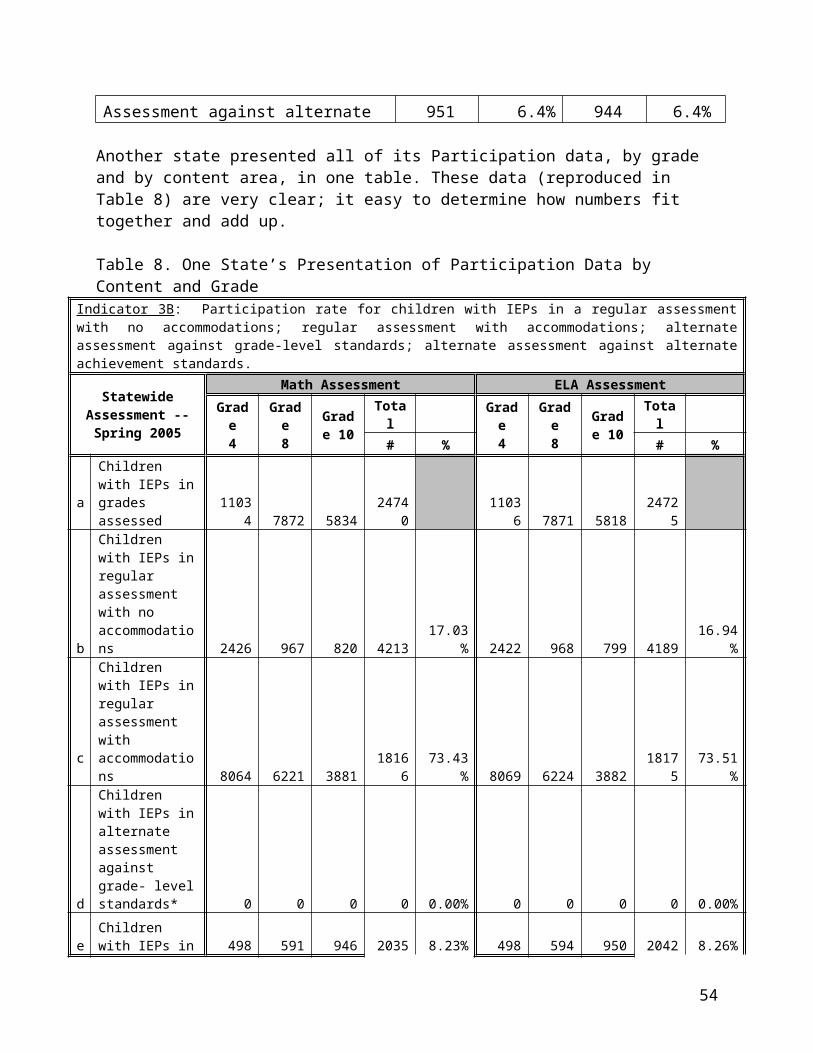
Definition of Significant Discrepancy; Description of Measurable and Rigorous Targets; Description of Specified Plan To Review Policies, Procedures, and Practices;
and Description of Plan for Analyzing Data by Race/Ethnicity.
1. Method of Comparison
States are required to provide an overview of their system and processes for suspension/ expulsion data collection. States are also required to present baseline data on the percentage of districts identified by the state as having a significant discrepancy in the rates of suspensions and expulsions of children with disabilities for greater than 10 days in a school year and the methods used to obtain this percentage. The state’s discussion must include a comparison of the rates of long-term suspensions and expulsions of children with disabilities, either:
1) Among local educational agencies (districts) within the state, or2) To the rates for nondisabled children within the agencies.
States used the following methods of comparison:
Comparing the suspension/expulsion rates for students with disabilities across districts (17 states or 28%);
Comparing by district the percentage of students with disabilities who were suspended/expelled to the percentage of nondisabled students who were suspended/expelled. The majority (22 states or 37%) used this approach;
Comparing the district percentage or rate of suspension/expulsion to the statewide mean rate (12 states or 20%); or
Comparing the suspension/expulsion rate for each district to the national average (1 state or 1.7%).
Eight states (13%) used a different method of comparison or did not discuss the method of comparison that they used.
2. Definitions for Discrepancy
States are required to define how they determine a significant discrepancy in their suspension/ expulsion data for students with disabilities.
The most common definitions for discrepancy were the following:
Setting a cut-point (a number, rate, or percentage above which would be considered a discrepancy) (15 states or 25%);
Using one or two standard deviations from the district or statewide mean rate of suspension/expulsion (10 states or 17%);
54
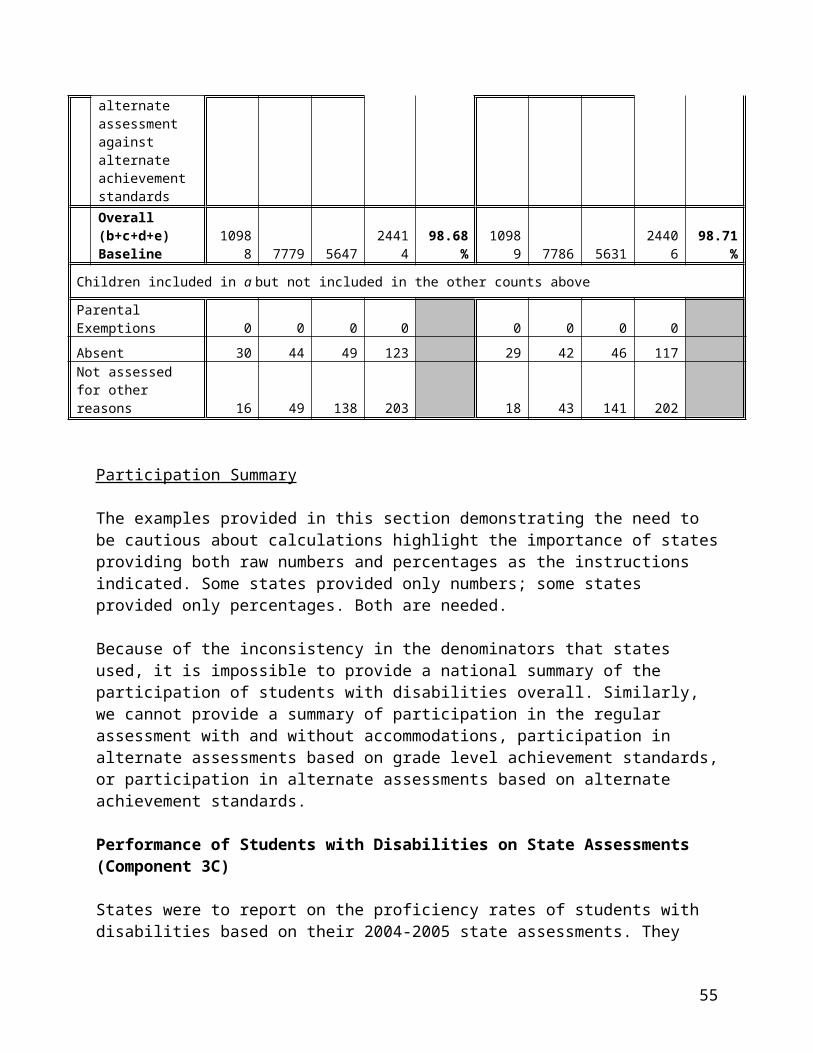
Comparing districts’ suspension/expulsion rate/percentage to the statewide mean rate/percentage (9 states or 15%); or
Using a combination of the above criteria (9 states or 15%).
Below, we present the number of states that used these definitions for discrepancy by the most common methods of comparison, along with some examples.
States that compared suspension/expulsion rates for students with disabilities across districts used cut-points, standard deviations, and a combination of the two to determine discrepancies:
Cut-point (6 states): “greater than 5% of students with disabilities suspended/expelled, if the school district suspends/expels more than five students”;
Standard deviation (5 states): “Suspension/expulsion rates that are 1.75 standard deviations from the mean (2.93% or higher)”; or
Combination (3 states): “The lesser of one of the two following criteria: 1) any LEA that has a suspension/expulsion rate more than 3% of that LEA’s total special education population; or 2) any LEA that has a rate of suspension/expulsion more than 1 standard deviation above the mean for all LEAs.”
States that compared by district the percentage of students with disabilities who were suspended/expelled to the percentage of nondisabled students who were suspended/expelled used cut-points, comparisons to the statewide mean, standard deviations, and a combination of these methods to determine discrepancies:
Cut-point (5 states): “Any district that suspends or expels more than 1.24% of its special education students than all students will be identified”;
Comparison to statewide mean (2 states): “Any LEA with a suspension rate equal to or above the state average with a positive difference in the number of students with disabilities suspended when compared to all students suspended”;
Standard deviation (4 states): “For districts with at least five discipline incidents, a ratio of rates was calculated: the number of incidents for students with disabilities/ special education count: to the number of incidents for all students/enrollment. Across districts, a mean and a standard deviation of the ratio of rates was calculated. Any ratio greater than the mean plus one standard deviation is a significant discrepancy”; or
Combination (4 states): “A discrepancy was determined if an LEA met three conditions: 1) has a minimum of 10 students; 2) the number of students suspended or expelled is >1; 3) the percentage of special education students suspended/expelled is at least 2.5 times greater than that of general education students.”
55
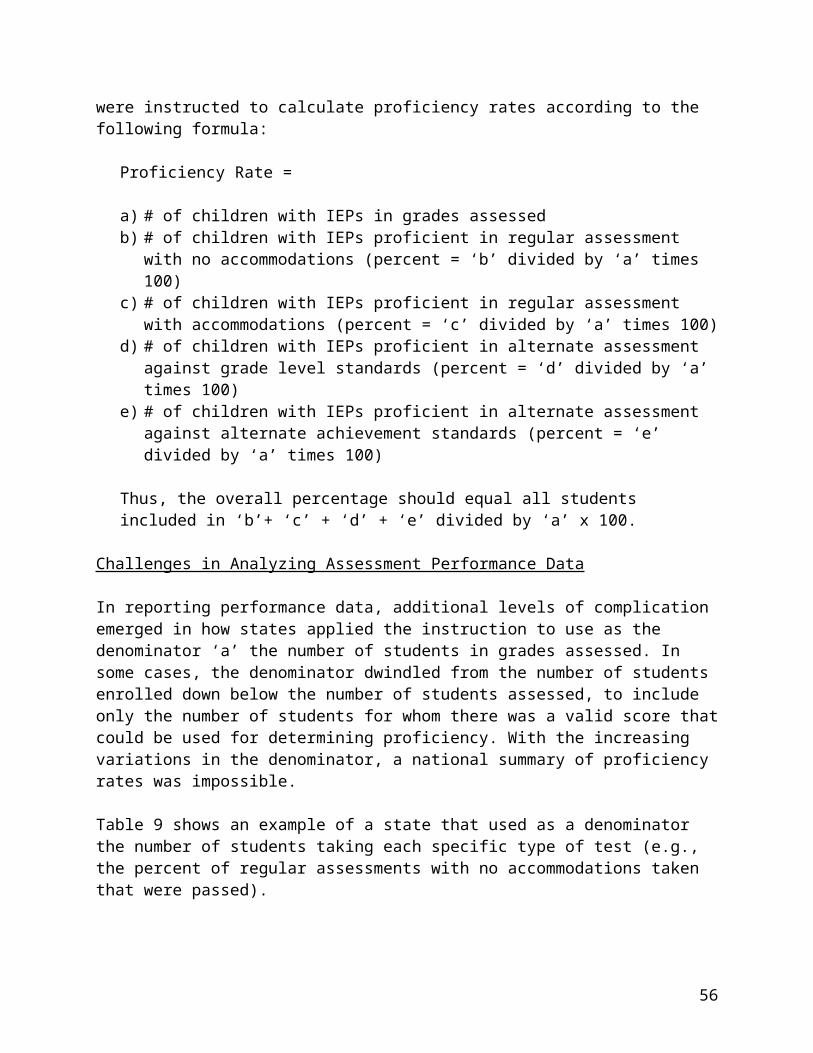
States that compared the district percentage or rate of suspension/expulsion to the statewide mean rate used cut-points, comparisons to the statewide mean, standard deviations, and a combination of these methods to determine discrepancies.
Cut-point (2 states): “Measured the suspensions/expulsions of students using an unduplicated and cumulative count and a count of more than 10 consecutive days. In the past, a 5% discrepancy between districts was used. There was no significant discrepancy for several years. The state is now implementing a discrepancy cut-point of 2%”;
Comparison to statewide mean (6 states): “Any district rate that is higher than the current state average rate of suspensions and expulsions for general education of 2.98%.” Another example is, “Through 2007-08, a suspension rate of greater than 4 times the baseline statewide mean. Beginning in 2008-09 through 2010-11, a suspension rate of greater than 2 times the baseline statewide mean. A minimum of 75 students with disabilities was used”;
Standard deviation (1 state): “Significant discrepancy is defined as 2 standard deviations above the state mean;” or
Combination (1 state): “Districts that report 30 or more suspensions for students with disabilities for greater than 10 days and that have a rate at least double the state mean incidence of 1.5% of students with disabilities suspended/expelled.”
In addition to these more common methods, other methods were used to determine discrepancies.
Seven states (12%) used risk-ratio methodology to determine discrepancies.
“A risk-ratio of greater than 1.5 for students with disabilities when compared to the suspension of all students for greater than 10 days”;
“A risk ratio compares the relative risk of suspension/expulsion by dividing the number of students with disabilities suspended/expelled by the proportion of nondisabled students suspended/expelled. A risk ratio of less than 0.5 or greater than 1.5 for students with disabilities compared to nondisabled students is considered a discrepancy”; and
“Used a “comparative ratio” approach – if the resulting ratio was >1 at the state level and >2 at the local level, this indicated that the students with disabilities were suspended at a higher rate than their nondisabled peers.”
The remaining 10 states (17%) used other methodologies, including:
“A two-tier process is used: a rate of long-term suspension/expulsion greater than expected based on chi-square analysis and cannot be justified by unique district characteristics”; and
Not including a definition of discrepancy due to reporting zero discrepancies
56
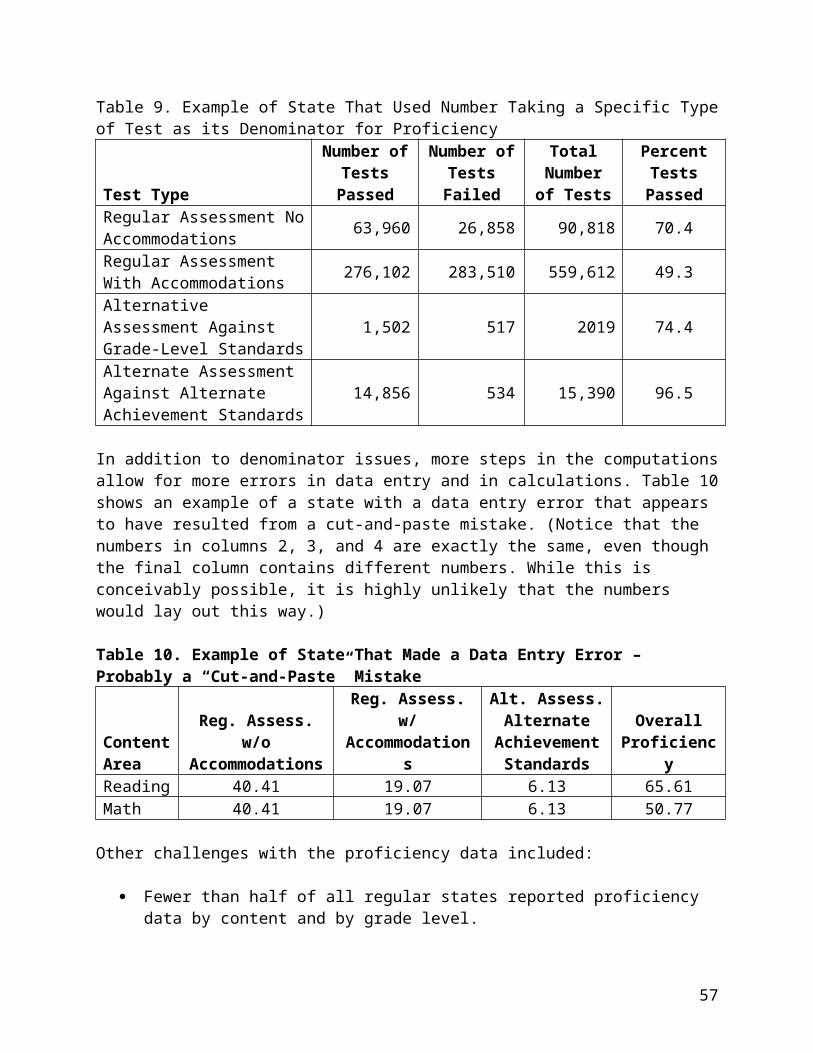
Approximately 12 states (20%; seven states and five territories) reported that there were no significant discrepancies in their data. The territories reported having a very low number of suspension/expulsions or no suspensions/expulsions. A few states set standards that allowed for discrepancies in suspension/expulsion rates to be fairly large before being considered significant (e.g., a rate 25% higher than the statewide mean, or a rate 2 standard deviations from the mean). Two states used statistical significance as a standard for determining discrepancies, which may also lower the number of cases that meet the discrepancy standards.
Many states have issues with small sample sizes and included a requirement that a minimum number of students with disabilities suspended/expelled be reached in order for the district to be considered in calculations for a discrepancy.
3. Description of Measurable and Rigorous Targets
States presented measurable and rigorous targets to monitor progress through 2010-11. States generally set a percentage or number by which they will aim to reduce the number of discrepant districts over time. Some examples are:
“Decrease by 50% the number of districts with significant discrepancies each year: from 25 in 2005-06 to 0 in 2010-11;”
“Decrease by 0.8% the percentage of LEAs having significant discrepancies each year: from 7% in 2005-06 to 3% in 2010-11”; and
“2005-06 target is to have no more than 6 districts with a significant discrepancy. Reduce the number of districts with discrepancies by one each year until 2010-11, when there will be no significant discrepancies.”
States varied in the number or percentage they aim to improve in their targets: For example one state’s goal is to reduce the percentage of districts with a discrepancy from 1.99% in 2005-06 to 1.20% in 2010-11, while another state’s goal is to decrease the percentage of discrepant districts from 58.43% in 2005-06 to 0% in 2010-11.
One state’s goal is to decrease the gap between state and local statewide standards by 0.2 standard deviations per year.
4. States’ Plans for Reviewing Policies, Procedures, and Practices
In total, 45 states (75%) included a plan for reviewing policies, procedures, and practices while 15 states (25%) did not include a plan.
Most states did not describe in great detail their plan for reviewing policies, procedures, and practices for addressing significant discrepancies. However, there was a range of approaches described, including:
57
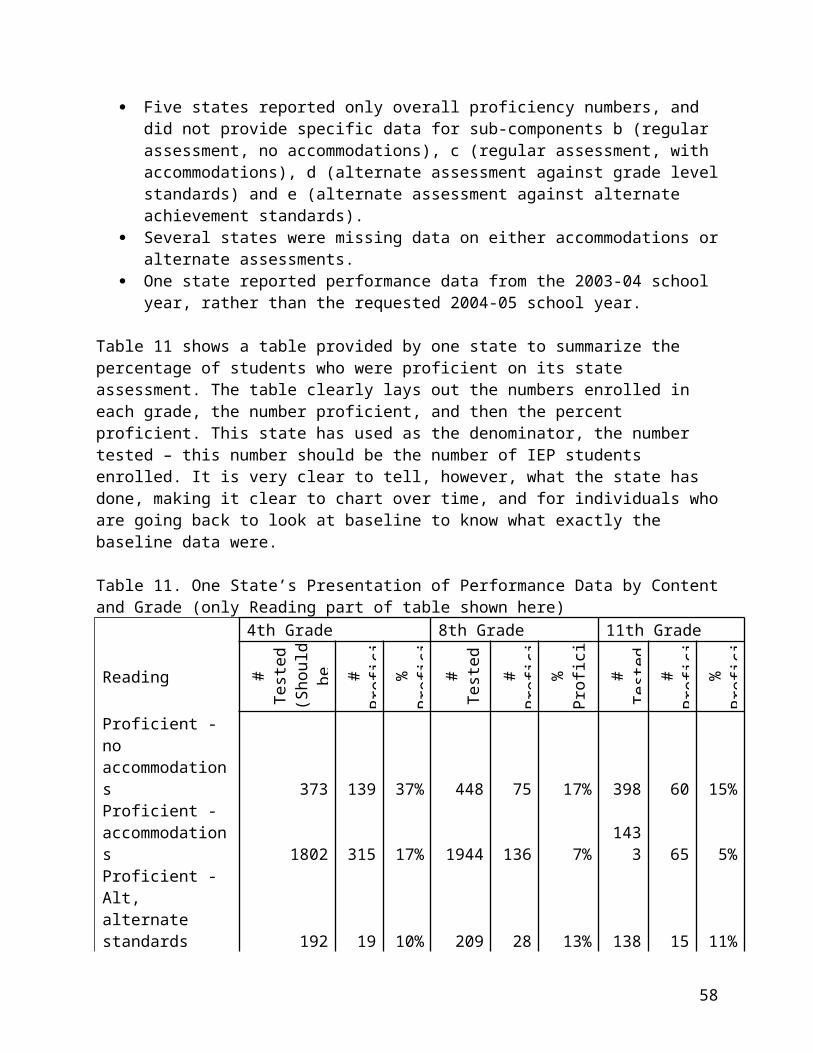
States simply stated that they will review the policies of districts with significant discrepancies;
States specifically mentioned their monitoring and improvement system as a vehicle for reviewing plans and decreasing discrepancies;
States specifically mentioned using Positive Behavioral Support Coaches in districts with discrepancies;
States reported that they will review the policies, procedures and practices of districts that have discrepancies and provide training in those districts;
States described a multi-step process for reducing discrepancies.
5. Discussions of Race/Ethnicity
In total, 33 states (55%) included a plan for collecting and analyzing discipline data by race/ethnicity while 27 (45%) did not include a plan. Some states have established a baseline, while others are establishing their formula for calculating discrepancies by race/ethnicity. The plans for calculating discrepancies by race/ethnicity include:
Most states that reported a plan will use the state’s current plan to determine a significant discrepancy and disaggregate those data by race/ethnicity.
Some states have created a formula that calculates data by race/ethnicity Another group of states mention a particular data system for collecting data
by race/ethnicity. One state plans to contract a statistician to develop a plan. A few states described the use of a risk-ratio. For example one state reported
“A risk ratio is calculated to identify if any district is suspending black students at a greater rate than non-black students.” Another state described using a “disproportionality risk ratio.” Clearly, a small number of states are interpreting Section B of Indicator #4 to be an analysis of disproportionality, as opposed to disaggregating their discipline data by race/ethnicity.
58

INDICATOR 5: SCHOOL AGE LRE
State Performance Plans 2005Part B Indicator 5: Percent of children with IEPs aged 6 through 21 Narrative Report
Prepared by Barbara Sparks and Swati JainNational Institute for Urban School ImprovementApril 2006
INTRODUCTIONPart B Indicator 5, part of Monitoring Priority: FAPE in the Least Restrictive Environment requires state information regarding the percent of children with IEPs aged 6 through 21 in three measurement categories:
A: Removed from regular class less than 21% of the day:B. Removed from regular class greater than 60% of the day; orC: Served in public or private separate schools, residential placements, or homebound or hospital placements.
This narrative report presents data, in aggregated form, from the State Performance Plans, of the states and the District of Columbia into the category States.
The territories and the Bureau of Indian Affairs (BIA) are aggregated into the category Territories.
BASELINE DATA FOR FFY 2004Baseline data for each Category; A, B, and C is presented.
CATEGORY A*% Children removed from
regular class less than 21% of the day
*The higher the better
CATEGORY B*% Children removed from regular class greater than
60% of the day
*The lower the better
CATEGORY C*% Children served in
public or private separate schools, residential
placements, homebound or hospital placements
*The lower the betterHigh variability
10% to 78%High variability
4% to 36%High variability.45% to 31%
Top 10 states61% to 78%
Top 10 states4% to 11%
Top 10 states.45% to 2%.
Bottom 10 states Bottom 10 states Bottom 10 states
59
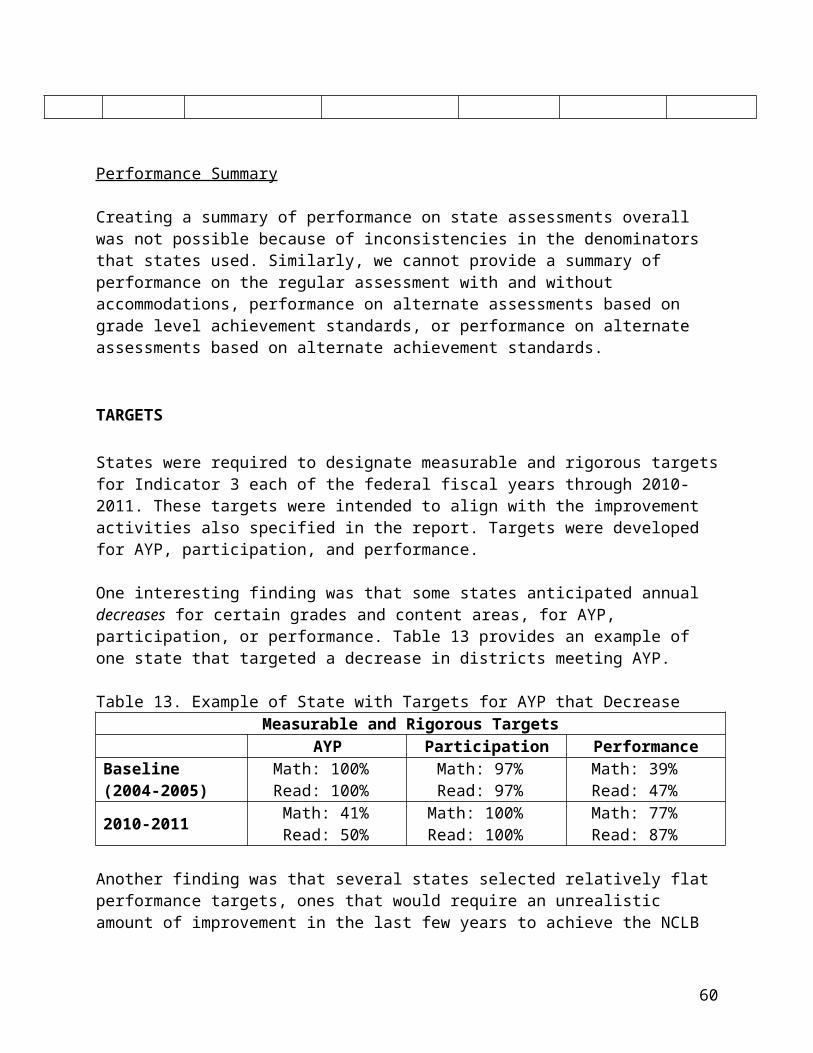
10% to 46% 22% to 36% 6% to 31%.
Mean among states 52%
Mean among states 19%
Mean among states4%
TerritoriesRange 28% to 99%
Mean of 75%
TerritoriesRange 0% to 29%
Mean of 14%
Territories Range .03% to 5%
Mean of 2%
MEASUREABLE AND RIGOROUS TARGETSRigorous targets for a 5 year period, from 2005 to 2010, are reported for Categories A, B, and C. Listed below are targets for 2010.
CATEGORY A*% Children removed from
regular class less than 21% of the day
*The higher the better
CATEGORY B*% Children removed from regular class greater than
60% of the day
*The lower the better
CATEGORY C*% Children served in
public or private separate schools, residential
placements, homebound or hospital placements
*The lower the betterHigh variability
16% to 82%High variability.02% to 36%
High variability.1% to 25%
Top 10 states68% to 82%
Top 10 states.02% to .6%
Top 10 states.1& to 1.41%
Bottom 10 states16% to 50%
Bottom 10 states7% to 36%
Bottom 10 states4% to 25%
Mean among states 62%
Mean among states 12.5%
Mean among states2.8%
TerritoriesRange 40% to 98%
Mean of 52%
TerritoriesRange .25% to 32%
Mean of 10%
TerritoriesRange 0% to 2%Mean of 1.37%
IMPROVEMENT ACTIVITIESEight emergent categories, or types, of improvement activities were identified after thoroughly reviewing all SPP reports. This section of the report combines all states, territories, the District of Columbia and the Bureau of Indian Affairs.
Working definitions were determined for each category and specific activities were cataloged.
60
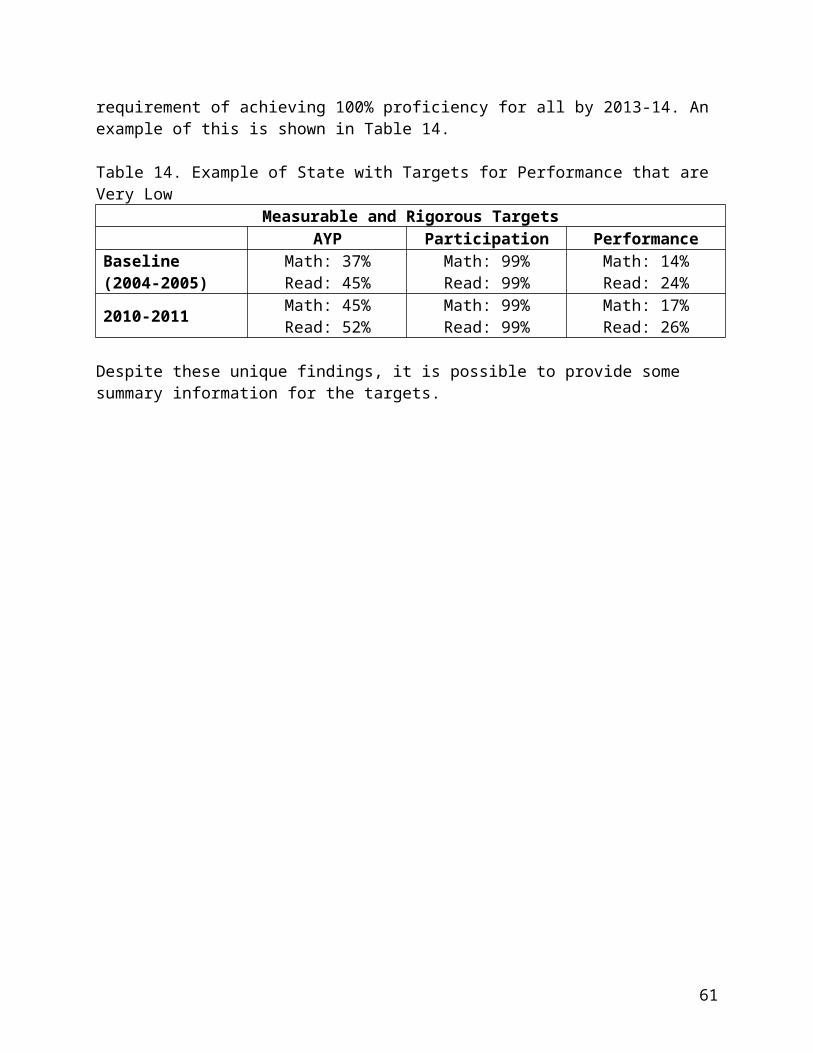
The categories with working definitions are:1) Review activities include examining policies, practices, and procedures at the
state and district levels.2) Evaluation activities include collecting and analyzing data.3) Development activities include designing protocols, policies, practices and
procedures, rubrics, and software systems.4) Monitoring activities include providing oversight of district level continuous
improvement.5) Technical Assistance and Professional Development activities include
training and assistance at the state and local levels.6) Coordination activities include applying processes, collaborating with technical
assistance centers and others, convening meetings, and maintaining current practices and procedures.
7) Dissemination activities include reporting district and state level data and resources to various stakeholders.
8) Funding activities include identifying, securing, providing, and reimbursing districts for services and projects for placing children with disabilities in the least restrictive environment (LRE).
CATEGORY OF ACTIVITIES
WORKING DEFINITIONS
Review Examine policies, practices and procedures at various levels
Evaluation Collect and analyze dataDevelopment Design protocols, policies,
practices and procedures, rubrics and systems
Monitoring Provide oversight of district level continuous improvement
Technical Assistance & Professional Development
Train and assist at the state and local levels
Coordination Apply processes, collaborate, convene and maintain practices and procedures
Dissemination Report data and resources to various stakeholders
Funding Financially support LRE services and projects
61
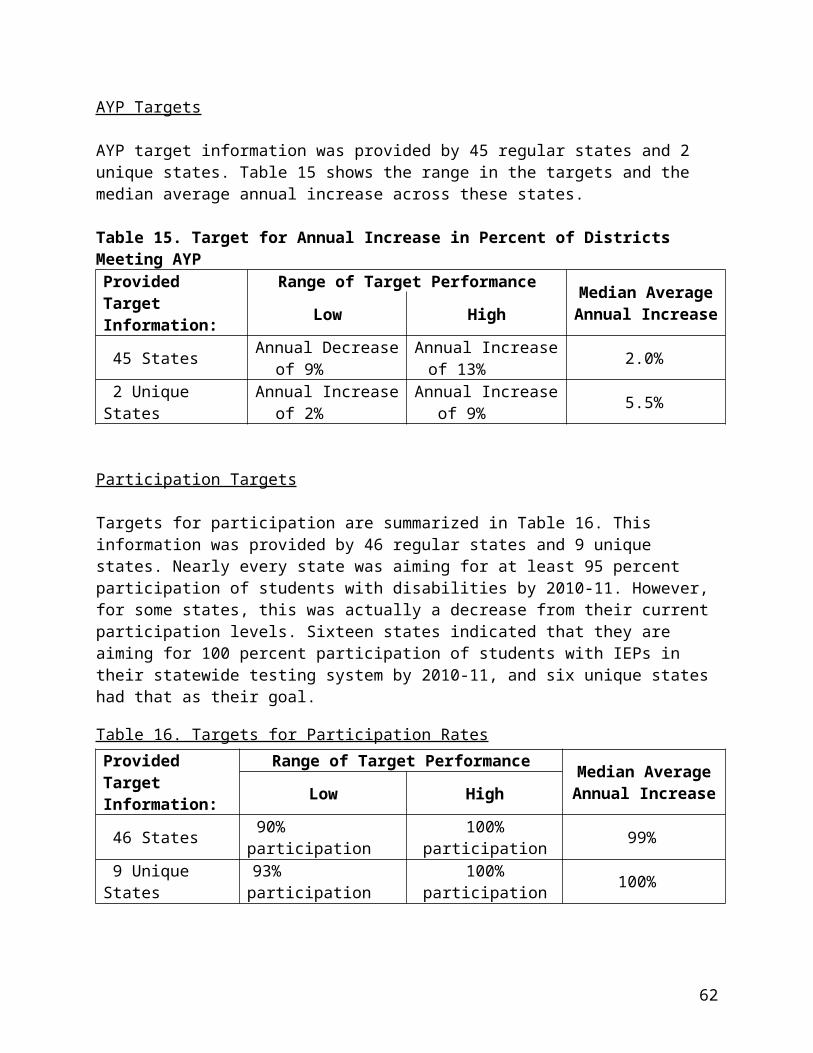
FindingsFive hundred seventy (570) separate improvement activities were noted in all state performance plans.
Of the eight categories of improvement activities, the majority of activities fall into Technical Assistance and Professional Development (31%), followed by Coordination (19%), Development (16%), and Review (11%). An equal percentage of improvement activities were noted in Evaluation (8%) and Monitoring (8%), followed by Dissemination (5%), and finally, Funding (2%).
Technical Assistance and Professional Development ActivitiesImprovement activities in this category include a wide variety of Technical Assistance and Professional Development.
Technical Assistance and Professional Development activities were identified for numerous audiences including:
State personnel, district administrators and principals, general education, early childhood and special education teachers, speech pathologists, nurses,
interpreters, assessment officers, management information coordinators, para-educators, preservice teachers, parents, and advocates.
Other audiences include state-sponsored charter schools, private schools, various state level support agencies, demonstration schools, and regional resource centers.
Train the Trainer programs were also included. Topics listed for Technical Assistance and Professional Development are extensive and diverse. They include:
Accountabilityo Data definitions, formulas, collection, analysis, reporting, audits,
exit and post-exit follow-up, student progress monitoring, data entry.
Identification and placemento Placement options, LRE determination processes, assessment,
decision making, evaluation, placement barriers, disability awareness, IEP improvement plans, making LRE decisions, appropriate assessments.
Access to least restrictive environmentso Inclusion, support for special education students in least restrictive
environments, accommodations and modifications of general education curriculum, identification of separate settings, alternative school use, integrated settings, evaluating training, prevention and intervention strategies.
Targeted student groups
62
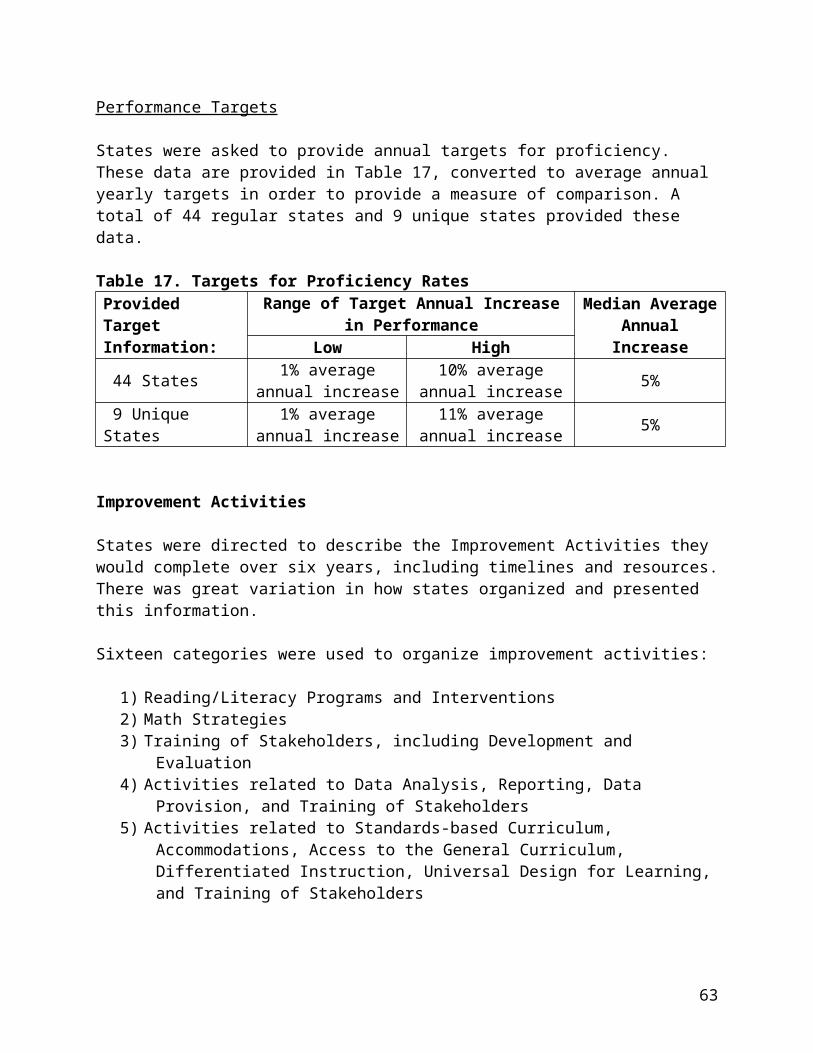
o Autism, hearing and speech impaired, identifying students with specific disabilities.
Administrative codeso State and federal statutes and regulations, IDEA, identifying
alternative schools, site codes, placement justification, child count definitions, due process.
Improvement planningo Leadership development, management, scheduling, mentoring,
prevention-based interventions, focused monitoring and continuous improvement, highly qualified teachers, sustaining improvements.
Classroom teachingo Universal design, early literacy, positive behavior supports,
differentiated instruction, curriculum modifications, response to intervention, curriculum-based assessment, co-teaching, data-driven instruction, best practices, performance-based assessment, grading.
Technology utilizationo Assistive technology in general education, technology as access,
data collection software. Reform efforts
o Implementing high poverty and NCLB reform, reinventing high schools.
Category Focus ExamplesTechnical Assistance and Professional Development Activities
Audiences State education personnel, all teachers, special services, i.e., nurses, speech pathologists, private education institutions, regional resource centers, parents
Topics Accountability, access, identification and placement, administrative codes, school reform, targeted student groups, improvement planning, classroom teaching, technology
Coordination ActivitiesDiverse Coordination activities were reported to assist in meeting least restrictive environment targets for special education students.
Coordination of state initiatives such as state action plans, school improvement,
63
professional development focused record reviews, monitoring, systemic change processes and teacher preparation, recruitment and retention programs were identified. Other state initiatives included facilitating cooperative agreements and memorandums of understanding among districts for continuous service, increasing assistive technologies in schools, opening new programs for pre-K at risk populations, creating model schools and a high school to teacher preparation mentoring program to foster future teachers.
Coordinating partnerships with higher education institutions for curriculum improvements, professional development, special education endorsement programs, and recruitment were repeated in many reports. The emphasis on teacher quality also focused on working with taskforces and increasing personnel.
Facilitating partnerships with various agencies were reported. These include working with special services providers, vocational rehabilitation, departments of health and human services, foster-parenting, Governor’s Council on special education. Partnerships were also reported with regional resource centers and city agencies.
Coordinating professional learning opportunities fall into this category of improvement activities. A wide range of efforts were included; data retreats, state-wide conferences and summer institutes, steering committee and stakeholder group sessions, and LRE communities of practice. Also included were parent/legal guardian learning opportunities coordinated at the state level.
Reporting activities, such as preparing annual performance reports, are a set of efforts requiring coordination at the state level. They include providing summary reports, implementing placement protocols and building equity and capacity by documenting best practices. Coordinating district action plans and quarterly reports, collecting district implementation plans, and strategizing public reporting of data were identified. Also part of this set of activities included coordinating the revision of administrative codes, processing complaint data, and overseeing court mandates.
Category Focus ExamplesCoordination Activities
Reporting District action plans, summary reports, best practices, public reporting, APR
Project Management
State initiatives, services, new programs/schools, learning opportunities
Outreach Partnerships at city, state and regional levels
64
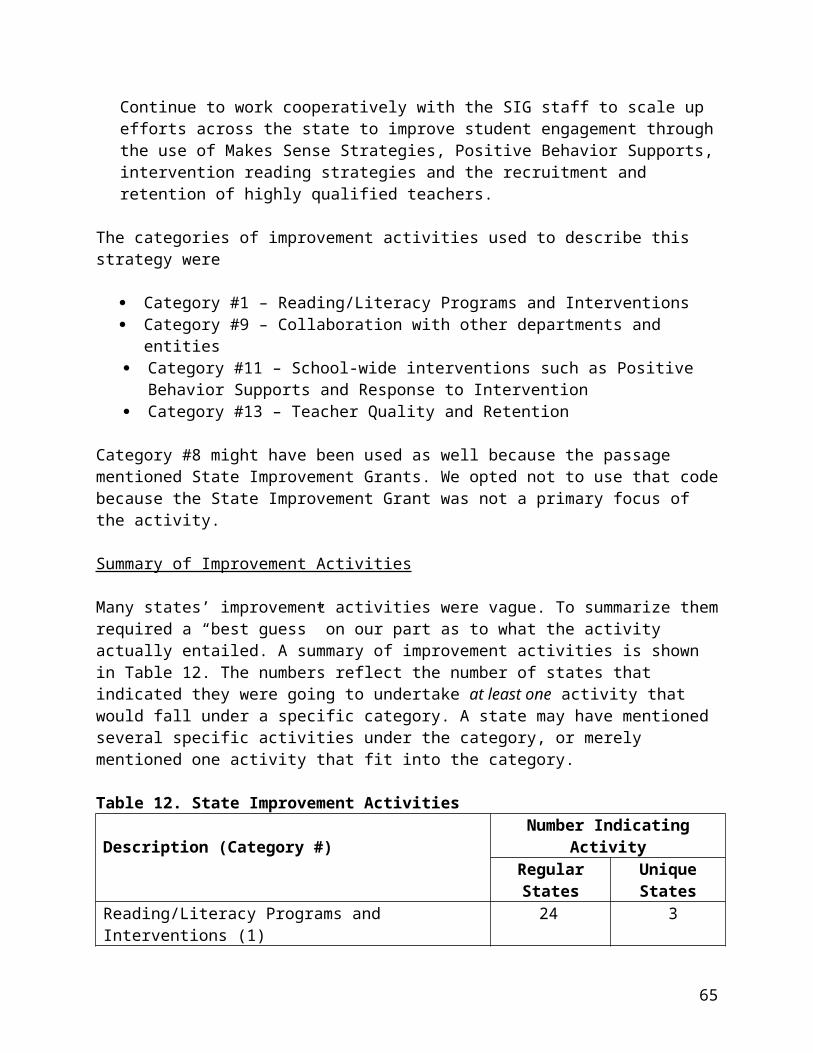
Development Activities Development activities consist of a range of efforts dealing with policies, practices, and procedures.
Policy related activities include developing parameters for charter schools, state frameworks for literacy instruction, revising pre-K individualized education plans (IEP) to include least restrictive environment targets, report formats for districts, dispute resolution strategies, and standardized terminology across agencies serving special education students. Documenting legal requirements for identification, referral and placement fall into this set of activities.
Practice related activities included creating infrastructures for professional development, and continuous improvement planning, Development of resource and guidance materials and technical briefs for serving specific disabilities, tools for IEP pre-k environments, discipline manuals, best practices for achievement, improvement strategies for least restrictive environments (LRE) and home schooling materials were mentioned.
Several technology efforts were reported. These included developing web pages for professional development calendars and professional development and technical assistance sites. Other technology efforts were designing systems for data collection and data monitoring, distributing special education data and IDEA 2004 guidelines.
Development activities related to procedures encompass designing protocols for identifying services for special needs students, data collection and analysis, continuous improvement criteria, conducting focused record reviews, and action plans were identified. Developing an evaluation system for parent involvement and a system for tracking students were found. Developing guidelines for reporting LRE data in district report cards was also reported.
Category Focus ExamplesDevelopment Activities
Policies Charter schools, dispute resolution, state frameworks, pre-K IEPs
Practices Guidance materials, infrastructures, technology, improvement activities
Procedures Protocols, guidelines for data collection and reporting
Review Activities
65

A range of review activities were included in reports. One set of activities encompasses examining policies, procedures and practices related to least restrictive environments for special education students.
Examples include reviewing student assessment guidelines, access to general education, instructional designs and curriculum for special needs students in general education classrooms, improvement activities and definitions and reporting practices. Reviewing placement data by specific disability groups, preschool students, and state and private agencies were a key set of activities. Examining district reports for specific actions taken (i.e., improvement activities) and materials used (i.e., technical aids), agency reports for high placements, voucher placements, and memorandums of understanding with outside agencies were identified.
Another set of Review activities include examining all available data sources and reports within the state including annual performance reviews, master plan objectives and activities, LRE placements in non-public settings, teacher qualifications for student teaching, and state and local policies regarding instructional designs for special students in general education.
The third set of activities under the Review category addresses prevention by reviewing pre-K promising inclusion practices, model collaborative schools, supports needed for reaching targets, the need for state legislative action for appropriate services, and identifying placement barriers. Reassessment of rigorous targets for all LRE categories, self-assessment instruments, and alignment of least restrictive environment definitions with federal guidelines were also included.
Category Focus ExamplesReview Activities Identification,
referral, placementAssessment, access, instruction, placement trends, MOUs
Data sources Master plans, APRs, separate settings, teacher qualifications
Prevention Barriers, promising practices in inclusion, collaboration, targets
Evaluation ActivitiesVarious Evaluation tasks were identified as improvement activities. Collecting, analyzing and disseminating data on least restrictive environments appears to drive many Evaluation activities.
66

Related efforts include collecting baseline data on court ordered residential placements, analyzing placement trends for inclusive settings, for pre-K environments, and access to general education were identified. Analysis of placement data through self-assessments and monitoring systems were reported. Disaggregated placement data for improvement planning, evaluating student needs, and revising collection systems are other Evaluation activities. Finally, analyzing special education student performance data is included in this set of Evaluation activities.
Evaluating use of on-line assessment tools, efficacy of data collection systems and processes, follow-up assessments and universal design pilot study in improving access to general education are examples of assessing various tools and systems.
Another set of evaluation activities include assessing implementation of SPP activities and related efforts. These include analyzing variance from annual rigorous targets and change over the years, and conducting comparison studies of placement in different states. Pilot studies to determine the impact of state funding to separate settings was proposed as were needs assessments to determine the required level of technical assistance and professional development related to inclusive practices.
Category Focus ExamplesEvaluation Activities Data collection &
analysisPlacement trends, disaggregated data, student performance
Tools & systems On-line tools, collection, state practices
State Performance Plans
Variance, measurements, comparisons, pilot studies
Monitoring Activities Activities within the Monitoring category are fairly concentrated and emphasize aspects of focused monitoring.
The major emphasis of focused monitoring is in placement of special education students in general education. Related tasks that were included are monitoring targeted districts for budgeting 15% of funds for early intervening services, monitoring self assessments in order to identify districts in need of research-based continuous improvement planning.
67

Other Monitoring tasks include verifying district data, practices, student records, and parental involvement in addition to the identification and placement of special education students in least restrictive environments. Teacher documentation of highly qualified activities and student access to supplemental aids are two more areas of attention.
Monitoring out-of-state facilities and private separate settings regarding placement rates in least restrictive environments was identified as well as monitoring program quality, restrictive patterns and decision making procedures. Also, monitoring the referral, eligibility and evaluation policies of educational diagnostic centers was mentioned.
Category Focus ExamplesMonitoring Activities Focused monitoring Targeted districts
Oversight Using analysis tools, placements, budgeting,
Facilities Out-of-state, private, diagnostic centers
Dissemination ActivitiesIncluded in Dissemination activities are various reporting efforts to stakeholders.
Activities include disseminating least restrictive environment data and special education performance data to the public through websites, district report cards and profiles.
Creating access to research-based practices and resource materials through technologies (i.e., DVDs, webcasts, websites), state conferences, and print materials were identified. Also mentioned were award programs for exemplary inclusive school programs and awareness of districts to national rankings.
Category Focus ExamplesDissemination Activities
Reporting Least restrictive environment & performance data, report cards & profiles, websites
Access Resources, recognition programs
Funding ActivitiesFinancial assistance to districts was identified through several mechanisms and for diverse efforts.
Quality Assurance grants to offset focused monitoring expenses, engage in improvement activities or systems change and for transitioning special education
68
students into general education were reported. Significant Improvement grants for building capacity were mentioned. State funds were identified for assisting non-public agencies to work with the educational system, children and parents, for reimbursement of special education student services, inclusive practices, and intervention systems.
Another focus of Funding activities is identifying funding opportunities for district and state level work in meeting targets.
Category Focus ExamplesFunding Activities
Purposes Building capacity, delivery of services, improvement practices
Opportunities Identifying additional sources
Examples of improvement activities within each category are representative of the range of effort but are not exclusive to those listed.
SummaryIn general several statements can be made.
Based on the range of difference among states in baseline data and the breadth of improvement activities reported, states are at very different levels related to their work in moving special education students into least restrictive environments and general education curriculum.
Category A baseline data shows a difference of 68 points between the highest ranking state and the lowest ranking state in terms of the percentage of children removed from regular class less than 21% of the day.
Category B baseline data shows a difference of 32 points between the highest ranking state and the lowest ranking state in terms of the percentage of children removed from regular class greater than 60% of the day.
Category C baseline data shows a difference of 30.5 points between the highest ranking state and the lowest ranking state in terms of the percentage of served in public or private separate schools, residential placement, homebound or hospital placement.
There seems to be a series of predictable and developmental steps in addressing access to general education environments and curriculum and related services by special education students. These steps include:
development of measurements for identifying districts with disproportionate placement in separate settings,
collection and analysis of data, revision of policies, practices and procedures at the state and district levels,
69

technical assistance and professional development, and progress monitoring.
Likewise, questions arise based on what has been reported and what has not. What patterns would be uncovered if the data were analyzed by regions? Are
differences significant?
Why do boundaries determine where a student receives services?
What kinds of results do students served in LRE environments achieve on accountability measures?
What do we know about segregated schools as opposed to segregated classrooms?
70
INDICATOR 6: PRESCHOOL LRE
NECTAC REVIEW OF PART B INDICATOR #6
Part B INDICATOR #6: Percent of preschool children with IEPs who received special education and related services in settings with typically developing peers (e.g. early childhood settings, home, and part-time early childhood/part-time early childhood special education settings).
Introduction
Indicator #6 is intended to show the state’s performance regarding the extent to which special education and related services for eligible preschool children (ages 3 through 5) are being provided in settings with typically developing peers. The data source states are to use for calculating the baseline performance for Indicator #6 is Table 2-1. Children ages 3 through 5 served under IDEA, Part B, by educational environment that states are required to submit to OSEP annually under Section 618 of the IDEA. Table 2-1, used for reporting these data, includes eight specific settings for preschool services, including the three settings named in Indicator #6 as settings with typically developing peers. In selecting the data for calculating baseline performance for Indicator #6, only one state used data reported in FFY 03-04; the others used FFY 04-05 data. Indicator #6 is not considered a compliance indicator so states were asked to provide in their SPP rigorous and measurable target performance levels for the next six years that would show improvement over the state’s baseline performance. This review and analysis of Part C indicator #6 is based on a review of State Performance Plans (SPP) for 59 states and jurisdictions.
BASELINE PERFORMANCE
The table below shows the distribution of baseline performance for 56 of 59 states/jurisdictions reporting baseline data that responded appropriately to indicator #6.
Table 1. Distribution of States’ Baseline Performance
Percent who received services in settings with
typically developing peers
Number of States in each percentile
distribution100% 3
90% to 99% 280% to 89% 170% to 79% 760% to 69% 1050%t to 59% 840% to 49% 1430% to 39% 7
71
15% to 29% 4Baseline data not provided 2Not responsive to indicator 1
Three state Part B programs reported a baseline performance of 100% and two more reported a baseline performance of 95% or more. All five of these programs are territories. Below that level of performance there were 26 states with baseline performances above 50%, with only one exceeding 80%. There were 25 states with baseline performances below 50%, with four states performing below 30%.
Three states did not respond to Indicator #6 with the performance data requested. One state reported that, because its current data structure does not accurately align with federal definitions, it was neither able to provide data regarding baseline performance nor develop measurable and rigorous targets in the absence of accurate baseline performance. The other two states responded by providing baseline performance percents for specific settings that appear in Table 2-1, but did not combine their data into a single performance percent reflecting Indicator #6’s three settings with typically developing peers. This approach also shaped the way these states provided their targets for the next six years, showing a combination of projected increases and decreases in the percents of children served in specific settings. While the combination of these increases and decreases do represent an overall improved performance across the six years, both the baseline performance and targets provided by these two states could not be shown in Tables 1 and 2.
PERFORMANCE TARGETS
The table below shows the distribution of states’ rigorous and measurable targets for Indicator #6 for all six years of the SPP, as well as the distribution of baseline performance.
Table 2. Distribution of States’ Baseline Performance and Target Performance
State PerformanceDistribution
Baseline Performance # of States
TargetFFY05
# of states
TargetFFY06
# of states
Target FFY07
# of states
TargetFFY08
# of states
TargetFFY09
# of states
TargetFFY010
# of states
100% 3 3 3 3 3 3 390% to 99% 2 2 2 2 3 5 580% to 89% 1 2 3 3 5 3 770% to 79% 7 7 9 11 10 11 1160% to 69% 10 10 9 10 10 10 1150%t to 59% 8 11 12 11 11 11 940% to 49% 14 11 10 10 9 8 830% to 39% 7 7 5 3 4 3 115% to 29% 4 3 3 3 1 1 1
Not responsive to indicator 3 3 3 3 3 3 3
72
B6- Comparison of Reported Baseline to 2010 Target
0
2
4
6
8
10
12
14
16
15%-29% 30%-39% 40-49% 50%-59% 60%-69% 70%-79% 80%-89% 90%-99% 100%
Percentage Range
Num
ber o
f Sta
tes
Baseline2010 Target
The following graph compares states’ baseline performance with the targets forthe final year of the SPP.
If all states were to meet their respective targets in the final year of the SPP, 46 states would have a performance level above 50% (up from 31 states in the baseline performance), with 15 states achieving above 80% (up from only one state). Ten states would still be performing below 50% (down from 25 states), but all but two of those states would now be above 40%.
ISSUE RELATED TO STATES REPORTING COMPARABLE BASELINE AND TARGET DATA
Both baseline performance and future performance in relation to projected targets for Indicator #6 are to be based on the data reported each year to OSEP on Table 2-1. The structure of that settings table is to be revised. When the revision has been completed, states will then begin reporting data annually according to the new structure. Since the new structure will be somewhat different than the current structure upon which a state’s baseline performance was determined, the measurement of subsequent performance may not be entirely comparable to the way baseline performance was measured, depending on how different the new structure of Table 2-1 is from the current structure.
Note: 3 states did not provide baseline data in the manner requested
73
States may wish to interpret the results of the first use of the revised Table 2-1 as establishing a new baseline performance for the state and to consider whether or not there is a need to revise its targets for the remaining years.
Improvement Activities, Timelines, Resources
States’ improvement activities, timelines and resources for Indicator #1 were reviewed in order to determine:
What types of improvement activities are being used by states? What amount of specificity did states provide in their six-year improvement plan? What assertions of effectiveness, if any, did states provide?
Types of Improvement Activities
The table below shows the types of improvement activities states plan to use to address Indicator #6 and the number of states employing each type of activity.
Table 3. Types of Improvement Activities To Be Used By States
Types of Improvement ActivitiesNumber of States
Provide training 45Provide technical assistance 37Improve monitoring 26Promoting best practices 20Improve data collection 19Collaboration w/other early education initiatives 19Increase public awareness of preschool efforts 19Clarify policies and procedures 16Advocating for additional funding 16Increasing/Improving local infrastructure capacity 16
Training and technical assistance improvement activities were typically targeted for LEA school administrators and preschool administrators, early childhood general and special education teachers, childcare providers, and parents. Training typically focused on requirements regarding least restrictive environments, data reporting requirements, and various approaches to providing special education and related services in settings with typically developing peers. States sought to improve monitoring by developing or refining the monitoring protocols for preschool LRE, using data on preschool LRE to rank LEAs for focused monitoring, and requiring LEAs with poor performance to develop improvement plans. Promoting the use of best practices included such activities as gathering and disseminating LRE best practice materials, spotlighting high performing LEAs as demonstration sites and mentors, and promoting specific best practice models. In order to improve collaboration with other early childhood programs states proposed developing or revising Interagency Agreements and Memorandums of Understanding between preschool special education programs and other community-based early
74

childhood programs, especially Headstart. Some proposed providing planning grants to LEAs to develop collaborative agreements with community providers. Activities to increase public awareness included, developing new materials for parents, developing websites and distributing data results. In order to improve data collection, states proposed to develop data accuracy protocols, provide training to LEAs on accurate use of settings codes/definitions, and enhance the state’s capacity to publish reports that compare LEA placement data with state target. Clarification of policies and procedures included identifying state and federal policy barriers to LRE and the development and dissemination of policy guidelines regarding preschool LRE. Some states proposed to advocate for additional funds in order to offer local incentive grants, support obtaining NAEYC certification, or creating set aside funds for children who are enrolled after the school year has started. Some states targeted the improvement of local infrastructures by increasing placement sites and the physical space for preschool programs in schools, and by the enhancement of assistive technology services and supports.
Level of Specificity
After reviewing the improvement activities, timelines and resources section of a state’s response to Indicator #6, the state’s improvement activities were assigned a specificity rating of high, moderate, or low. A plan that was rated high was characterized by improvement activities that reflected multiple approaches to achieving improvement that included most (if not all) of the types of improvement activities identified above. Improvement activities were usually delineated as a sequence of specific steps with accompanying timelines and resources, usually organized by year. Proposed activities were explained in some detail. A plan that was rated moderate contained a lesser number of activities and without as much detail, but did include timelines and resources. Sequencing of the activities across the six years was not as well specified. A plan that was rated low contained only a few activities; descriptions of proposed activities were vague and lacking in detail; timelines and resources were not provided; and the activities typically did not cover all six years. The table below displays the results of the assignment of ratings.
Table 4. Level of Specificity in SPP Improvement Activities
Assertions of Effectiveness
While there were no specific assertions of effectiveness by states regarding their proposed improvement activities, several states included improvement activities for
Level of Specificity Number of statesHigh 7
Moderate 17Low 35
75
promoting the use of best practices, including promoting specific named best practice models.
76

INDICATOR 7: PRESCHOOL OUTCOMES
ECO REVIEW OF PART B SPP INDICATOR #7 (Draft. April 4, 2006)
Part B Indicator #7. Percent of preschool children with IEPs who demonstrate improved: A) Positive social-emotional skills (including social relationships); B) Acquisition and use of knowledge and skills (including early language/communication and early literacy); and C) Use of appropriate behaviors to meet their needs
INTRODUCTION
The following data is based on information reported by 58 states and jurisdictions in their December, 2005 State Performance Plans (SPPs). States and jurisdictions will be called “states” for the remainder of this report. Only information specifically reported in the SPPs was included in the analysis. Therefore, it is possible that a state may be conducting an activity or using a data source or assessment that is not included in this summary. All percentages reported are based on a total of 58 states and jurisdictions, unless stated otherwise.
Data Sources
Sixteen states (28%) report that they will use multiple data sources for each child to measure child outcomes, while 32 states (55%) will use one data source. States using a single data source for an individual child’s outcome data are primarily intending to use a formal assessment instrument (31 of the 32 states). The frequency of use of various data sources reported by states are shown in the Table below.
Data Source # %Formal assessment instruments 45 80%Observation 12 21%Parent Report 11 19%Teacher/provider report 8 14%IEP goals & objectives 1 2%Clinical opinion 1 2%Not reported 10 17%
The largest number of states will include data from formal assessment instruments, observation, and parent report in the measurement of child outcomes. Ten states (17%) did not report or have not yet determined the data sources they will be using to measure child outcomes.
Combining Data from Multiple Sources
77

When states combine data from multiple sources, or use data from selected items from an assessment instrument to determine a child’s level of functioning in each of the three outcome areas, they report various methods that they will employ to summarize the information. Seventeen states (29%) are intending to use, or considering the use of the ECO Child Outcomes Summary Form, and 6 states (10%) have developed or will develop their own summary tools.
Assessment Instruments
Thirty-one states (53%) listed specific instruments they will include in their child outcome measurement process. Twenty-one states (36%) report that they have not yet determined what assessment tool(s) providers will use. Five states (9%) have an approved list of assessment instruments providers can use, but did not specify the tools in their SPPs. One state will allow local programs to select which assessment instruments to use for outcomes measurement.
The table below summarizes the tools reported by the 31 states who named formal assessment instruments in their SPPs. A total of 43 assessment instruments were reported by states [see attachment for complete listing]. The most commonly reported assessment instruments (used by 3 or more states) are shown in the table below.
Seven states (12%) reported they will be using a state developed assessment tool.
When Data will be Collected
For this indicator, states are required to collect data reflecting each child’s status related to each of the three outcome areas near entry and near exit from the Preschool program. Fifteen states (26%) did not report any timelines for data collection more specifically than that. The remaining 43 states (74%) provided additional details, as shown in the chart below.
When Data will be collected # %Aligned with naturally occurring data review points:
22 38%
Annual IEP reviews 11 19% Initial evaluations 5 9%
Assessment Tools # %Battelle Developmental Inventory (BDI/BDI-2 ) 9 16%Creative Curriculum 8 14%Brigance Diagnostic Inventory of Development 7 12%High Scope Child Observation Record (High Scope/COR) 6 10%Assessment, Evaluation, and Programming System (AEPS) 5 9 %Carolina Curriculum for Preschoolers with Special Needs 3 5%
78

Initial IEP development 4 7% At eligibility determination 2 3%
Within prescribed time periods around entry: 10 17%
W/in 6 months of referral 1 2% W/in 6 weeks of entry 2 3% W/in 45 days of enrollment 2 3% W/in 30 days of eligibility 3 5% W/in first 4 weeks of attendance 1 2% W/in 25 days of entry 1 2%
Within prescribed time periods around exit: 5 9%
W/in 6 months of exit 1 2% 3 to 6 months prior to exit 1 2% W/in 6 weeks of exit 1 2% W/in 30 days of exit 2 3%
At time periods recommended for curriculum referenced assessments (2 or 3x/year) 8 14%Annually (end of school year) 6 10%
Children Included in Outcome Measurement
As is required for this indicator, children to be included in the report of progress data (in the February, 2008 APR) will be those with entry and exit outcome data who have received services for six months or more.
Eight states (14%) reported that they are intending to sample to measure child outcomes. Three of these states will collect outcome data on all preschool children but select a sample to report to OSEP. One state will only collect outcome data for the children in the sample. Four states were not specific about whether they were sampling for data collection at entry and/or at exit, or for reporting data. One state, while not sampling, will collect outcome data on the districts in the state which are monitored each year. Two additional states reported they are considering sampling, and three states will decide whether or not to sample based on their pilots.
Forty-two (72%) reported that they intend to ultimately include all children in outcome measurement. Twenty-seven of these states will roll out their outcome measurement system statewide (all at once), including all preschool children with IEPs. Ten other states will pilot their methods on a subset of children, then include all children subsequent to the pilot. Five states will phase in data collection over two or more years until all children are included.
79
Two states did not indicate which children would be included in their outcome measurement.
Alignment with State Standards
Eighteen states (31%) reported that they will be aligning their Preschool outcomes work with state Early Childhood Standards. States reported selecting assessment instruments which aligned to their standards, developing state assessment tools specifically to measure their standards, and/or using the standards to define age expectations for determining whether children’s functioning is at age-expected levels.
Collaboration with other Programs
Twenty-one states (36%) reported that they will be collaborating with their state Part C program in some capacity (e.g. sharing data, using Part C exit data for Part B entrance, a shared data system, using the same or congruent assessments). Eighteen states (31%) reported that they will be collaborating with other early childhood programs in the state on outcomes initiatives, e.g. Head Start, public preschool programs, child care, and Even Start programs.
Databases
Thirty states (52%) reported that they will use or adapt their databases to include data related to child outcomes measurement. Twelve states (21%) reported they will have to develop a database for child outcomes measurement. Sixteen states (28%) did not include information about their database in their SPPS.
Training
Forty-two states (72%) described training that they will be providing to state level staff, local administrators and providers, data analysts, and/or families related to their outcome measurement system. Training was reported regarding specific assessment instruments, data collection and reporting methods, general information about state outcome systems, using the ECO Child Outcome Summary Form, and using data for program improvement.
STRATEGIES THAT HAVE EVIDENCE OF EFFECTIVENESS
Because this is a new indicator, there are no strategies yet that show evidence of effectiveness.
Assessments Instruments Reported by Part B Preschool Programs
1. Assessment, Evaluation, and Programming System (AEPS)2. Adaptive Behavior Assessment System (Ages 0-5)
80
3. American Samoa EC Assessment4. Arizona Articulation Proficiency Scale5. Ages and Stages Questionnaire (ASQ)6. AGS Early Screening Profiles7. ABILITIES 8. Battelle Developmental Inventory (BDI 2)9. Bayley Scales of Infant Development (BSID 2),10.Bracken11.Brigance Diagnostic Inventory of Development; 12.Behavior Assessment System for Children (BASC)13.Carolina Curriculum for Preschoolers with Special Needs14.Child Behavior Checklist (CBCL)15.Creative Curriculum B-3, 3-516.Child Development Inventory (CDI)17.Clinical Evaluation of Language Fundamentals-Preschool II (CELF)18.Connors’ Parent & Teacher Rating Scale (CRS-R)19.Developmental Assessment of Young Children (DAYC);20.Differential Ability Scales21.Desired Results Developmental Profile (DRDP Access)22.DIAL-3, DIAL-R,23.Early – Learning Accomplishment Profile (E-LAP)24.Early Screening Inventory Preschool (ESI-P)25.Early Literacy Assessment (ELA)26.First STEP-First Screening Test for Evaluating Preschoolers27.Get, It, Got it, Go - preschool literacy (Ohio)28.Getting Ready to Read29.Goldman-Fristoe Test of Articulation30.Hawaii Early Learning Profile (HELP)31.High Scope Child Observation Record (High Scope/COR)32. Indiana Standards Tool for Alternate Reporting (Indiana)33. Individual Growth and Development Indicators (IGDI)34.Kindergarten Readiness assessment system (Mass.)35.Kindergarten Readiness Assessment- Literacy (KRA-L) (Ohio)36.Learning Accomplishment Profile–D (LAP-D)37.Micronesian Inventory of Development (MID)38.Mullen Scales of Early Learning39.Natural Environmental Survey and Early Learning Progress Profile (Alabama)40.Observation of Indicators (North Dakota)41.Oregon Early Childhood Assessment42.PALS-PreK43.Peabody Developmental Motor Scales-2; Picture Vocab. Test (PPVT)
81

INDICATOR 8: PARENT INVOLVEMENT
ANALYSIS OF 2005 STATE PERFORMANCE PLANSINDICATOR 8
Percent of parents with a child receiving special education services who report that schools facilitated parent involvement as a means of
improving services and results for children with disabilities
This analysis covers the 50 States, District of Columbia, Bureau of Indian Affairs, and eight outlying areas, hereinafter referred to as States. N = 60
Data Source: Instrument for Collecting Data
Developed by the State: 10 States will use their own instruments
Adopted from Another State: 1 State
State-Developed for 2005-2006, with NCSEAM Questions Thereafter: 1 State.
Adoption of NCSEAM Questions: 29 States
Modification of NCSEAM Questions: 11 States. Considering NCSEAM Questions Intact or Modified: 1 State
Incorporates NCSEAM Questions and EC Outcomes Center Family Survey: 5 States. (Two others are considering the adoption of ECO questions in the future.)
Reviewing NCSEAM, ECO, and others: 1 State
Names several instruments but not NCSEAM or ECO: 1 State
Special Features of the Data Source
Instrument Will Be Translated in Language(s) Other Than English: 21 States.
Instrument Will be Translated in More Than One Language: 1 State will use six languages other than English. 1 State will use three languages other than English.2 States will use two languages other than English.
Languages Used for Translations
Bengali 1 StateChamorro: 1 State
82
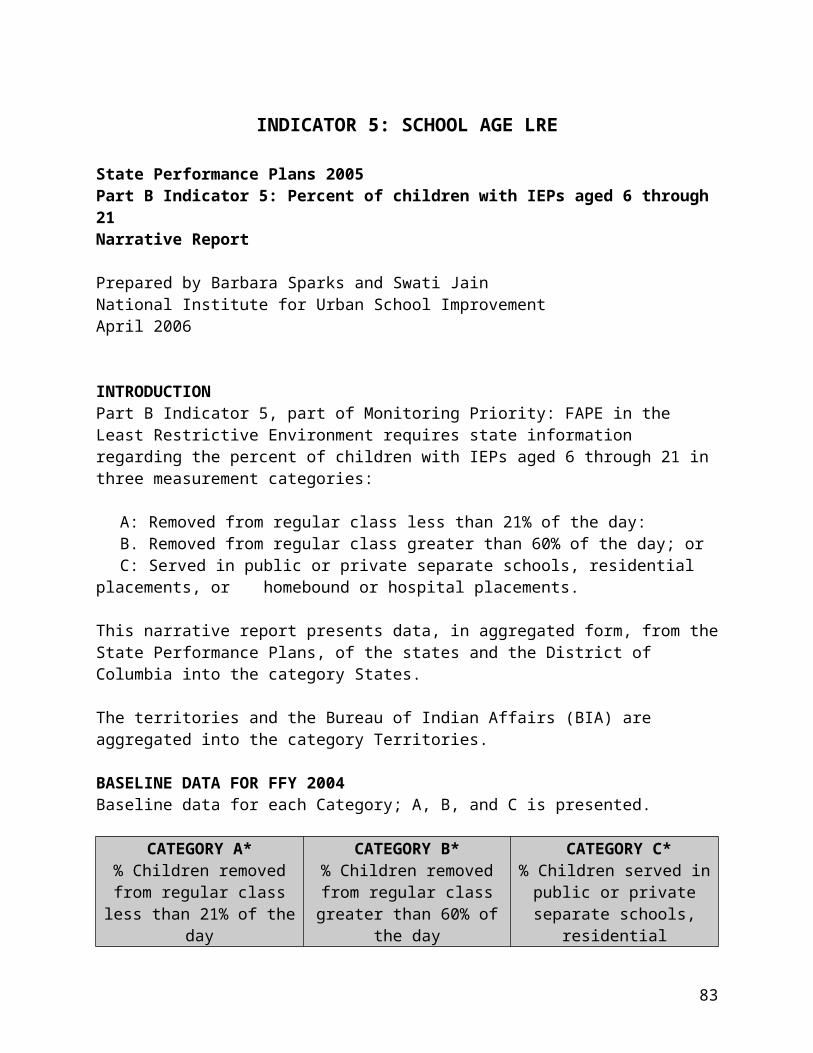
Carolinian 1 StateChinese, simplified 1 State
Haitian-Creole 2 StatesNative American languages 1 StatePaluaun 1 StateRussian 1 StateSamoan 1 StateSpanish 12 States
Tagalog 1 StateTongan 1 StateUrdu 1 State
Translations Not Specified: 5 States referred to “languages other than English, or multiple languages, or families’ primary language, or language translations” but did not specify the languages.
Instrument Reflects Cultural Relevance, Cultural Competence, or Diversity Issues: 3 States.
Accessible Format (Braille and Audio): 1 State
Data Collection: Sampling
Intent Is To Reach All Parents: 15 States are in this category, either with intent to reach all parents annually or to reach all parents over the monitoring cycle; one of these may sample after baseline data are collected.
Intent to Reach All Parents is Implied but Not Clear: 2 States
Sampling Procedures Are Described: 20 States (although some of these descriptions are quite minimal).
Sampling Procedures Are In Development: 13 States
Sampling Is Not Described: 4 States
No Data Collection Procedures Are Described: 6 States
Distribution of Survey Instrument
Distribution Via AEAs, Regional Centers, ISDs, or LEAs/School Divisions: 18 States (specifically or implied)
83
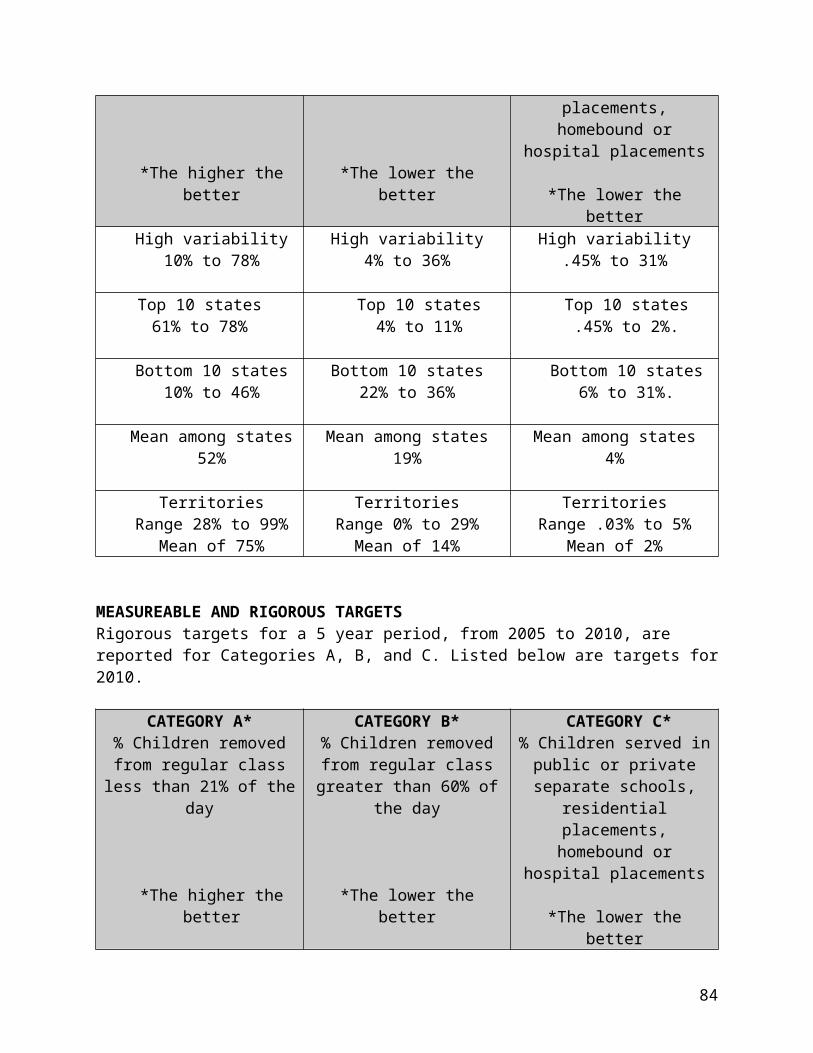
Distribution Via Schools: 5 States
Mass Mailing by SEA or Contractor: 11 States (in some cases, mass mailing is implied but not altogether clear).
Web-Based Online Distribution Is the Primary Strategy: 6 States (two of these will explore multiple venues in the future). In addition, 6 States use online distribution as one of several methods, and 4 States report considering online distribution; these States are subsumed in the other categories in this section.
Face-to-Face Interviews: 2 States
Distribution Method Will Be Developed: 2 States
Distribution Method Is Not Clear: 16 States
Special Features of the Distribution Method
Phone Surveys As an Additional/Optional Method: 7 States
Phone Followup for Non-Responses: 3 States
Home Visits As an Option: 1 State
Cooperation of Parent Centers/Organizations in Administration of Survey: 3 States
Cooperation of Parent Centers/Organizations in Pre-Distribution Publicity or Otherwise Promoting Participation: 4 States
MEASUREMENT
All States reported measurement as:Percent = # of respondent parents who report schools facilitated parent involvement as a means of improving services and results for children with disabilities divided by the total # of respondent parents of children with disabilities times 100.
BaselineAll States reported that baseline data will be provided in FFY 2005 APR due February 1, 2007.
Submitted by Judy Smith-DavisFor The IDEA Partnership at NASDSE
84
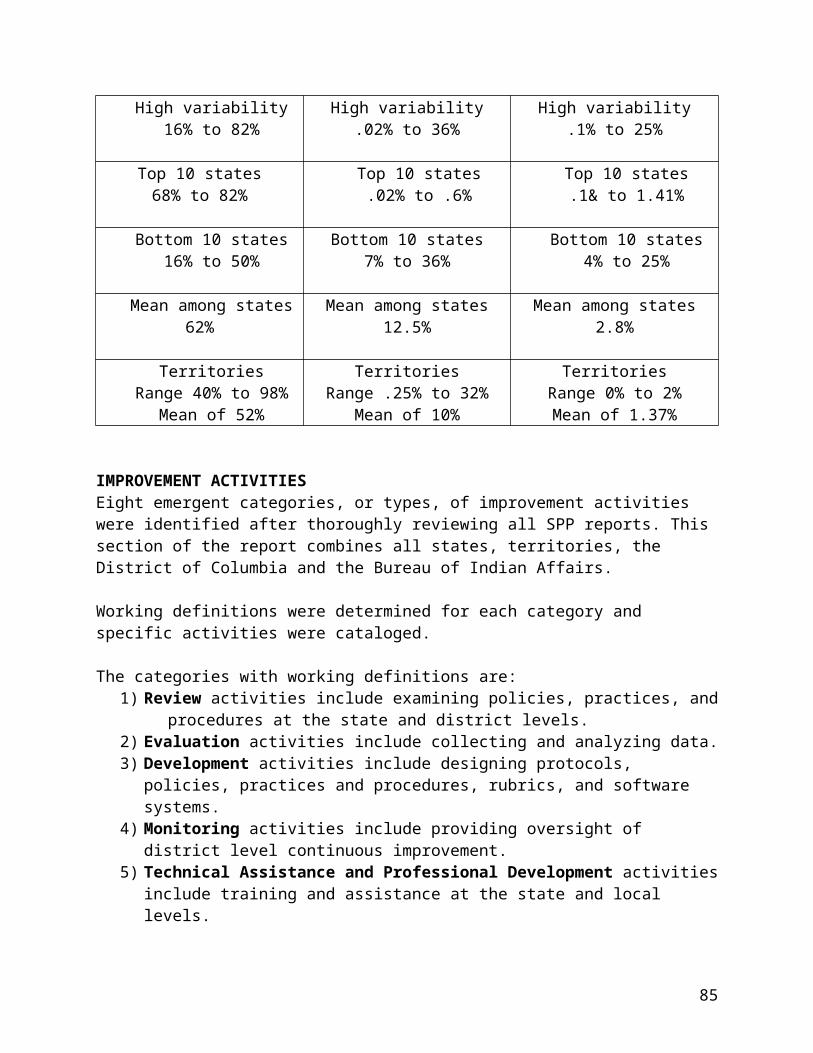
INDICATOR 9: DISPROPORTIONALITY – CHILD WITH A DISABILITY
State Performance Plans 2005
Part B Indicator 9: Percent of districts with disproportionate representation in special education and related services
Narrative Report
Prepared by Barbara Sparks and Swati Jain
National Center for Culturally Responsive Educational Systems
April 2006
INTRODUCTION
Part B Indicator 9, subsection of Monitoring Priority: Disproportionality requires state information regarding improvement activities that will be used in meeting disproportionality targets.
This narrative report presents data, in aggregate form, from the State Performance Plans of the states, the District of Columbia, the territories and the Bureau of Indian Affairs.
This is a new indicator which allowed states to wait until 2007 to report; 35 reports, or 58%, did not include improvement activities, timelines and resources.
Twenty-four states, 24, reported improvement activities. Timelines and resources are not reported here.
IMPROVEMENT ACTIVITIES
Seven emergent categories, or types, of improvement activities were identified after thoroughly reviewing all SPP reports. Working definitions were determined for each category and specific activities were cataloged.
The categories with working definitions are:
1. Review activities include examining policies, practices, and procedures at the state and district levels.
2. Evaluation activities include collecting and analyzing data.3. Development activities include designing protocols, policies, practices and
procedures, rubrics, and software systems.
85
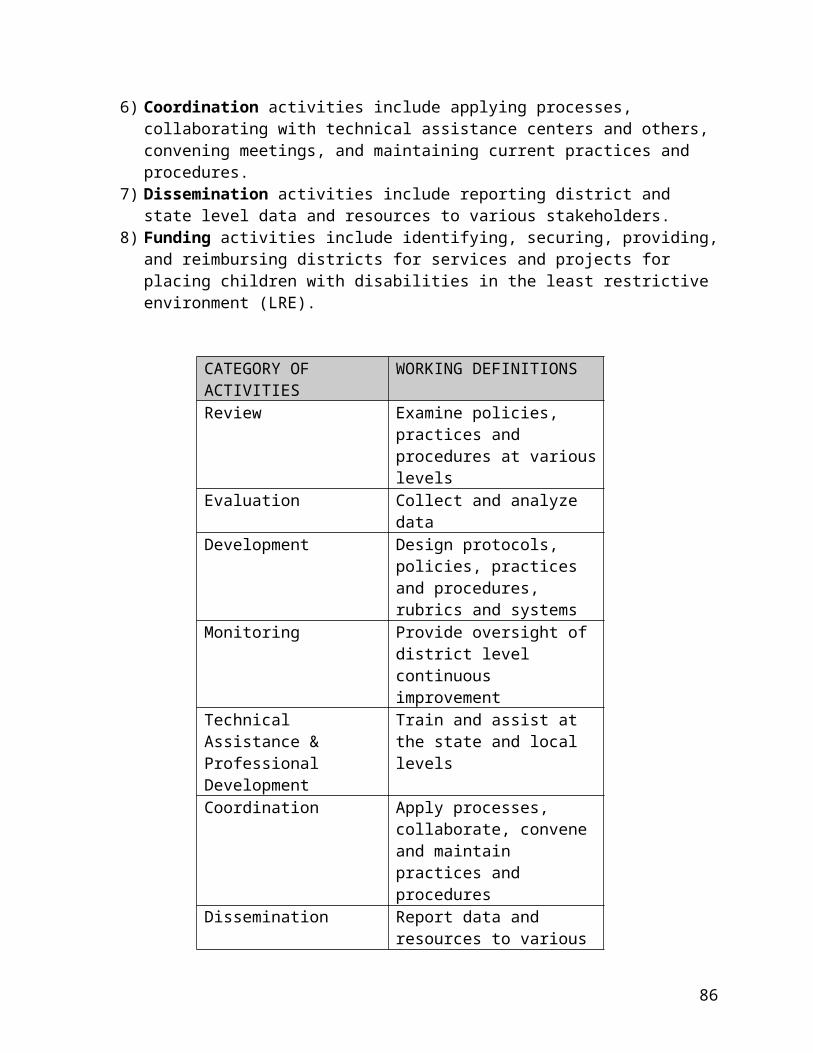
4. Monitoring activities include providing oversight of district level continuous improvement.
5. Technical Assistance and Professional Development activities include training and assistance at the state and local levels.
6. Coordination activities include applying processes, collaborating with technical assistance centers and others, convening meetings, and maintaining current practices and procedures.
7. Dissemination activities include reporting district and state level data and resources to various stakeholders.
CATEGORY OF ACTIVITIES
WORKING DEFINITIONS
Review Examine policies, practices and procedures at various levels
Evaluation Collect and analyze dataDevelopment Design protocols, policies, practices and
procedures, rubrics and systemsMonitoring Provide oversight of district level
continuous improvementTechnical Assistance & Professional Development
Train and assist at the state and local levels
Coordination Apply processes, collaborate, convene and maintain practices and procedures
Dissemination Report data and resources to various stakeholders
86

FindingsOne hundred seventy one (171) separate improvement activities were noted in all state performance plans. Of the seven categories of improvement activities, the majority of all activities fall into Review (23%) and Technical Assistance and Professional Development (TA&PD) (22%) categories. Evaluation (17%) activities are third, with Coordination (11%), then Development (10%), Monitoring (9%), and Dissemination (8%) activities, in that order. Review ActivitiesA range of Review activities exists. One set of activities encompasses examining policies, procedures and practices related to referral, identification and placement of special needs students. Examples include reviewing eligibility criteria, placement trends, racial/ethnic trends, clarity of policies, data analysis, and analysis tools. Another set of Review activities includes examining all available data sources and reports within the state including expenditures, focused record reviews, and outcomes of focused monitoring. The third set of activities under the Review category focuses on prevention by reviewing promising practices for student achievement and reviewing procedures for response to intervention (RTI).
CATEGORY FOCUS EXAMPLESReview Activities
Referral, identification, placement
Eligibility criteria, placement trends, racial/ethnic trends, clarity of policies, tools, analysis
Data sources Expenditures, focused record reviews, outcomes of focused monitoring
Prevention Promising practices in achievement and intervention
Technical Assistance and Professional Development Activities
87

Improvement activities in this category include a variety of Technical Assistance and Professional Development strategies for a variety of audiences. Technical Assistance and Professional Development activities were identified for state and local level personnel, general education and special education teachers, interpreters, and parents. Train the Trainer programs were also included. Topics listed for Technical Assistance and Professional Development are extensive. They include:
1. Identification and monitoring of disproportionality2. Disproportionality and over-representation issues3. Targeted interventions to support students in the least restrictive environment4. Classroom management5. Evaluation and eligibility procedures6. Cultural differences and learning styles7. ELL strategies and services8. Teaching reading9. Instruction10.Corrective action plans11.Culturally appropriate behavioral interventions12. Intervention and prevention13.Self-assessment processes14.Problem solving models15.Conducting focused record reviews16.Cultural diversity
In addition to direct services, development of resource materials and translation of outreach materials for parents were identified as Technical Assistance and Professional Development activities.
CATEGORY FOCUS EXAMPLESTechnical Assistance & Professional Development
Activities
Audiences State and local level staff, general education and special education teachers, interpreters, parents, trainers
Topics Teaching, learning, monitoring, management, assessment, environment
Materials Resources, outreach, translation of materials
Evaluation Activities
88
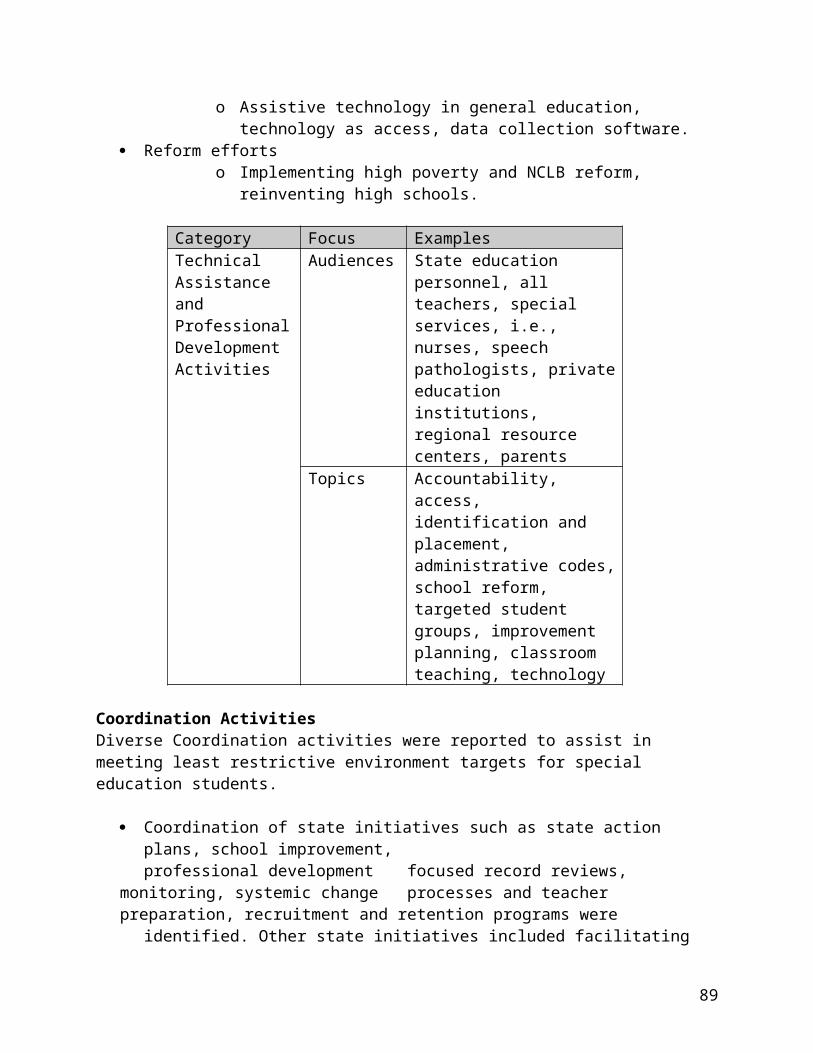
Various Evaluation tasks were identified as improvement activities. Developing baseline data for the 2007 reporting appears to direct many Evaluation activities. Related efforts include establishing baseline data, conducting random sampling of targeted districts, and analyzing/applying weighted risk ratio for racial/ethnic groups in all disability categories at the state and district levels, analyzing student performance measures, and defining standards of significance are part of this set of activities. Included in this next set of activities are developing databases for use in reporting state monitoring activities for the Annual Performance Review and the State Performance Plan, and assessment of disproportionality tools. Finally, exploratory Evaluation activities were reported. Examples included determining causes of inappropriate identification and placement; identifying characteristics of districts with significant risk; identifying the needs of special education students, evaluating the effectiveness of early intervening services; and conducting comparison studies of district data.
CATEGORY FOCUS EXAMPLESEvaluation Activities
Data collection & analysis Baseline data, weighted risk ratio, standards of significance
Databases Reporting, monitoring, tools
Exploratory studies Causes of inappropriate, characteristics of districts, needs assessments, effectiveness of services
Development ActivitiesDevelopment activities consist of a range of efforts dealing with policies, practices and procedures. Policy related activities include developing state board of education regulations based on IDEA 2004, restructuring special education grant processes to reflect new systems of support, and developing statewide framework for literacy instruction, interventions and assessments. Practice related activities include developing appropriate improvement activities and designing self assessment processes. Several technology related efforts were reported. These include developing a website, creating automated monitoring interface software, developing connections to existing access data base and creating a program that incorporates disproportionality calculations. Development activities related to procedures encompass designing protocols for identifying inappropriate policies, practices and procedures. Developing evaluation methods and rubrics to identify systemic issues, revising eligibility guidelines for special education placements, and establishing procedures for identifying disproportionality by racial, gender, language and disability were
89

included.
CATEGORY FOCUS EXAMPLESDevelopment Activities
Policies State regulations, grant processes, state frameworks
Practices Improvement activities, technology, self-assessment
Procedures Protocols, evaluation rubrics, guidelines for identification & placement
Coordination ActivitiesDiverse Coordination activities were reported to assist in meeting disproportionality targets. Several states reported scheduling and conducting focused record reviews of targeted districts. Activities related to upgrading or implementing automated monitoring software systems and management systems were identified. Coordination of responses to non-reviewed districts was also included. Coordination of early intervening services, program development in tiered instruction in least restrictive environments, and applying appropriate intervention for targeted districts were identified. Other activities in this set of practices include coordinating a pilot study to establish local and state needs of special education students and coordinating self-assessments for Headstart Centers and districts. Outreach efforts were also identified in the Coordination category. Activities include establishing partnerships with higher education institutions, publishing state frameworks for literacy instruction, and continuing with Communities of Practice within districts.
CATEGORY FOCUS EXAMPLESCoordination Activities
Reporting Focused record reviews, automated systems
Project management
Services, program development, pilot studies
Outreach Partnerships, publishing, communities of practice
Monitoring Activities Activities within the Monitoring category are fairly concentrated and emphasize aspects of focused monitoring. Related tasks to focused monitoring that were included are monitoring targeted districts in utilizing new disproportionality analysis tools, budgeting 15% of funds for early
90
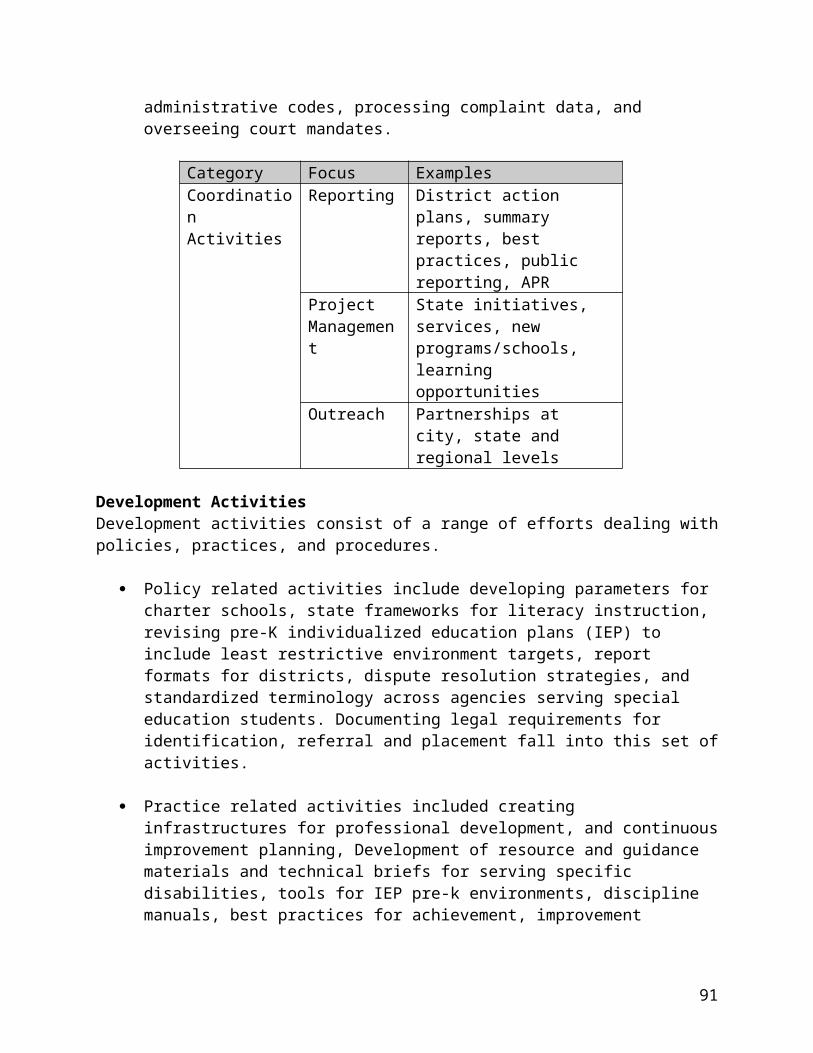
intervening services, and monitoring self assessments of districts in order to identify districts in need of continuous improvement assistance. Included in the Monitoring category of activities is instructing and monitoring districts in revising policies, practices, and procedures when they are found to be inappropriate.
CATEGORY FOCUS EXAMPLESMonitoring Activities
Focused monitoring Targeted districts Oversight Using analysis
tools, budgeting, assessments
Revision Policies, practices, & procedures
Dissemination ActivitiesIncluded in Dissemination activities are various reporting efforts to stakeholders. Activities include disseminating disproportionality data and student performance data to the public through websites and interactive local report cards. In order to facilitate dissemination of data, efforts to incorporate representation reports into existing accountability systems were reported. Creating access to non-biased practices through teacher networks, state conferences, professional development workshops, and higher education forums were identified. Also mentioned were making technical assistance resources available.
CATEGORY FOCUS EXAMPLESDissemination Activities
Reporting Disproportionality & performance data, report cards, websites
Access Conferences, forums, resources
Examples of improvement activities within each category are representative of the range of effort but are not exclusive to those listed. It should be noted that the activities identified are those of 24 states only. SUMMARYIn general several statements can be made.
Forty-two percent (42%), or 24 states reported state improvement activities.
As a result of the opportunity for states to delay responding to Indicator 9 until 2007, 58% of all reports did not include improvement activities.
Based on the breadth of improvement activities reported, it appears that states are at very different levels related to their work in disproportionate representation in special education and related services.
91

There seems to be a series of predictable steps in addressing disproportionate representation in special education and related services. These steps include:
development of measurements for identifying districts with disproportionate representation,
collection and analysis of data, revision of policies, practices and procedures at the district level, technical assistance and professional development, and progress monitoring.
Likewise, questions arise based on what has been reported and what has not.
Analyzing by region, what patterns can be identified in terms of improvement activities? Are they significant?
How are state finances, geography, population size and density related to efforts to reduce disproportionate representation?
Will the improvement activities actually make a difference in reducing disproportionate representation
92

INDICATOR 10: DISPROPORTIONALITY – ELIGIBILITY CATEGORY
State Performance Plans 2005
Part B Indicator 10: Percent of districts with disproportionate representation of racial and ethnic groups in specific disability categories that is the result of inappropriate identification.
Narrative Report
Prepared by Barbara Sparks and Swati Jain
National Center for Culturally Responsive Educational Systems
April 2006
INTRODUCTION
Part B Indicator 10, subsection of Monitoring Priority: Disproportionality requires state information regarding improvement activities that will be used in meeting disproportionality targets.
This narrative report presents data, in aggregate form, from the State Performance Plans of the states, the District of Columbia, the territories and the Bureau of Indian Affairs.
Since this is a new indicator which allowed states to wait until 2007 to report, 34 reports, or 57%, did not include improvement activities, timelines and resources.
Twenty-six (24) reported improvement activities.
IMPROVEMENT ACTIVITIES
Seven emergent categories, or types, of activities were identified after thoroughly reviewing all SPP reports. Working definitions were determined for each category and specific activities were catalogued.
The categories with working definitions are:
1. Review activities include examining policies, practices, and procedures at the state and district levels.
2. Evaluation activities include collecting and analyzing data.3. Development activities include designing protocols, policies, practices and
procedures, rubrics, and software systems.
93
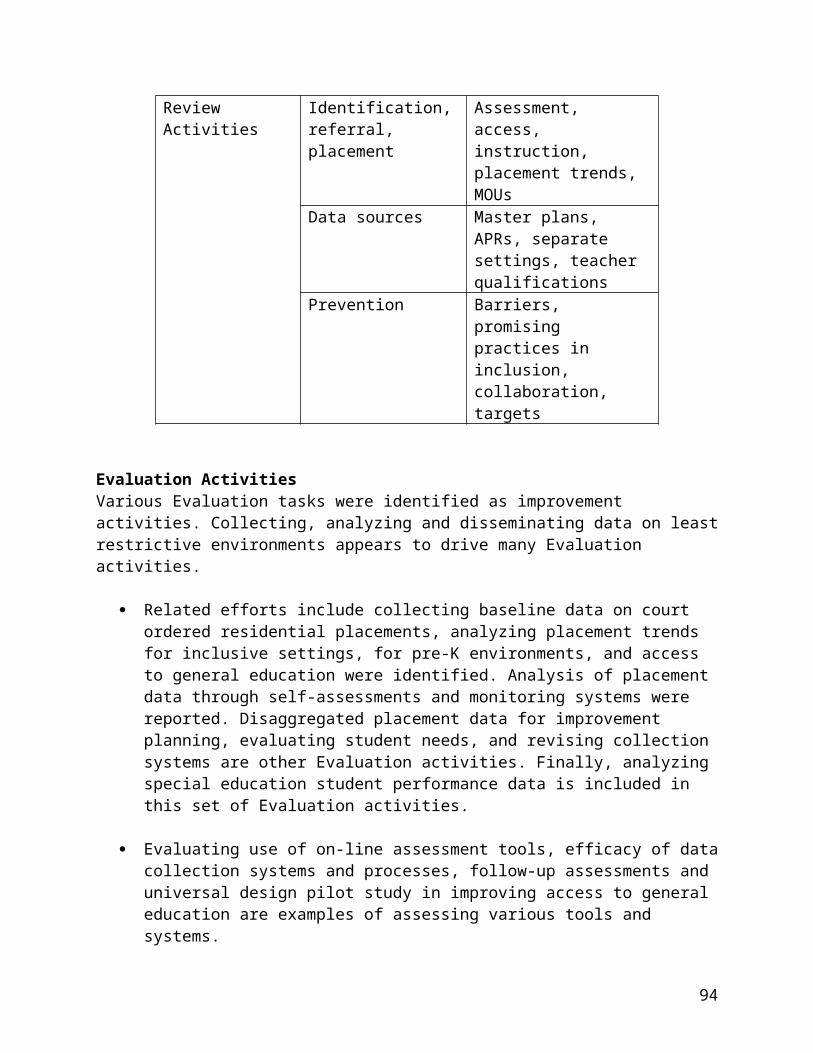
4. Monitoring activities include providing oversight of district level continuous improvement.
5. Technical Assistance and Professional Development activities include training and assistance at the state and local levels.
6. Coordination activities include applying processes, collaborating with technical assistance centers and others, convening meetings, and maintaining current practices and procedures.
7. Dissemination activities include reporting district and state level data and resources to various stakeholders.
CATEGORY OF ACTIVITIES
WORKING DEFINITIONS
Review Examine policies, practices and procedures at various levels
Evaluation Collect and analyze dataDevelopment Design protocols, policies, practices and
procedures, rubrics and systemsMonitoring Provide oversight of district level
continuous improvementTechnical Assistance & Professional Development
Train and assist at the state and local levels
Coordination Apply processes, collaborate, convene and maintain practices and procedures
Dissemination Report data and resources to various stakeholders
94
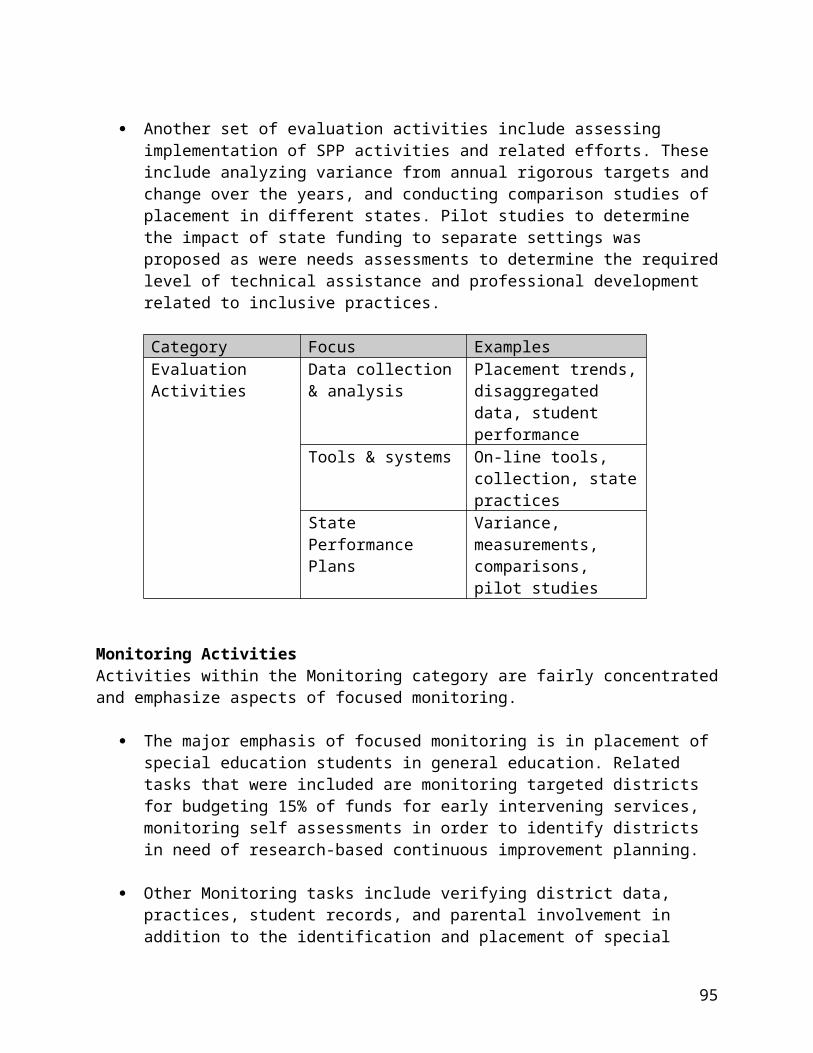
FINDINGSOf the seven categories of improvement activities, the majority of all activities fall into Review and Technical Assistance and Professional Development (TA&PD) categories. Evaluation activities are third, with Coordination activities fourth, then Development, Monitoring, and Dissemination activities, in that order. Review ActivitiesA range of Review activities exists. One set of activities encompasses examining policies, procedures and practices related to referral, identification and placement of special needs students. Examples include reviewing eligibility criteria, placement trends, racial/ethnic trends, clarity of policies, data analysis, and analysis tools. Another set of Review activities includes examining all available data sources and reports within the state including expenditures, focused record reviews, and outcomes of focused monitoring. The third set of activities under the Review category focuses on prevention by reviewing promising practices for student achievement and reviewing procedures for response to intervention (RTI).
CATEGORY FOCUS EXAMPLESReview Activities
Referral, identification, placement
Eligibility criteria, placement trends, racial/ethnic trends, clarity of policies, tools, analysis
Data sources Expenditures, focused record reviews, outcomes of focused monitoring
Prevention Promising practices in achievement and intervention
Technical Assistance and Professional Development ActivitiesImprovement activities in this category include a variety of Technical Assistance and Professional Development strategies for a variety of audiences. Technical Assistance and Professional Development activities were identified for state and local level personnel, general education and special education teachers, interpreters, and parents. Train the Trainer programs were also included. Topics listed for Technical Assistance and Professional Development are extensive. They include:
1. Identification and monitoring of disproportionality
95

2. Disproportionality and over-representation issues3. Targeted interventions to support students in the least restrictive environment4. Classroom management5. Evaluation and eligibility procedures6. Cultural differences and learning styles7. ELL strategies and services8. Teaching reading9. Instruction10.Corrective action plans11.Culturally appropriate behavioral interventions12. Intervention and prevention13.Self-assessment processes14.Problem solving models15.Conducting focused record reviews16.Cultural diversity
In addition to direct services, development of resource materials and translation of outreach materials for parents were identified as Technical Assistance and Professional Development activities.
CATEGORY FOCUS EXAMPLESTechnical Assistance & Professional Development
Activities
Audiences State and local level staff, general education and special education teachers, interpreters, parents, trainers
Topics Teaching, learning, monitoring, management, assessment, environment
Materials Resources, outreach, translation of materials
Evaluation ActivitiesVarious Evaluation tasks were identified as improvement activities. Developing baseline data for the 2007 reporting appears to direct many Evaluation activities. Related activities include establishing baseline data, conducting random sampling of targeted districts, and analyzing/applying weighted risk ratio for racial/ethnic groups in all disability categories at the state and district levels, analyzing student performance measures, and defining standards of significance are part of this set of activities. Included in this next set of activities are developing data bases for use in reporting state monitoring activities for the Annual Performance Review and the State Performance, and assessment of disproportionality tools.
96

Finally, exploratory Evaluation activities were reported. Examples included determining causes of inappropriate identification and placement; identifying characteristics of districts with significant risk; identifying the needs of special education students, evaluating the effectiveness of early intervening services, and conducting comparison studies of district data.
CATEGORY FOCUS EXAMPLESEvaluation Activities
Data collection & analysis Baseline dataDatabases Reporting,
monitoring, toolsExploratory studies Causes of
inappropriate, characteristics of districts, needs assessments
Development ActivitiesDevelopment activities consist of a range of efforts dealing with policies, practices and procedures. Policy related activities include developing state board of education regulations based on IDEA 2004, restructuring special education grant processes to reflect new systems of support, and developing statewide framework for literacy instruction, interventions and assessments. Practice related activities include developing appropriate improvement activities and designing self assessment processes. Several technology related efforts were reported. These include developing a website, creating automated monitoring interface software, developing connections to existing access data base and creating a program that incorporates disproportionality calculations. Finally, development of rubrics for evaluation was mentioned. Development activities related to procedures encompass designing protocols for identifying inappropriate policies, practices and procedures. Developing evaluation methods and rubrics to identify systemic issues, revising eligibility guidelines for special education placements, and establishing procedures for identifying disproportionality by racial, gender, language and disability were included.
CATEGORY FOCUS EXAMPLESDevelopment Activities
Policy State regulations, grant processes, state frameworks
Practice Improvement activities, technology, self-assessment processes
97
Procedures Revising and designing protocols, evaluation rubrics, guidelines for identification & placement
Coordination ActivitiesDiverse Coordination activities were reported to assist in meeting disproportionality targets. Several states reported scheduling and conducting focused record reviews of targeted districts. Activities related to upgrading or implementing automated monitoring software systems and management systems were identified. Coordination of responses to non-reviewed districts was also included. Coordination of early intervening services, program development in tiered instruction in least restrictive environments, and applying appropriate intervention for targeted districts were identified. Other activities in this set of practices include coordinating a pilot study to establish local and state needs of special education students and coordinating self-assessments for Headstart Centers and districts. Outreach efforts were also identified in the Coordination category. Activities include establishing partnerships with higher education institutions, publishing state frameworks for literacy instruction, and continuing with Communities of Practice within districts.
CATEGORY FOCUS EXAMPLESCoordination Activities
Reporting Focused record reviews, automated systems
Project management
Services, program development, pilot studies
Outreach Partnerships, publishing, communities of practice
Monitoring Activities Activities within the Monitoring category are fairly concentrated and emphasize aspects of focused monitoring. Related tasks to focused monitoring that were included are monitoring targeted districts in utilizing new disproportionality analysis tools, budgeting 15% of funds for early intervening services, and monitoring self assessments of districts in order to identify LEAs in need of continuous improvement assistance. Included in the Monitoring category of activities is instructing and monitoring districts in revising policies, practices, and procedures when they are found to be inappropriate. Numerous states referred to a three tiered model of monitoring. Entries included monitoring quality documentation for attempted interventions.
CATEGORY FOCUS EXAMPLESFocused monitoring Targeted districts
98

Monitoring Activities
Oversight Using analysis tools, budgeting, assessments
Revision Policies, practices, & procedures
Dissemination ActivitiesIncluded in Dissemination activities are various reporting efforts to stakeholders. Activities include disseminating disproportionality data and student performance data to the public through websites and interactive local report cards. In order to facilitate dissemination of data, efforts to incorporate representation reports into existing accountability systems were reported. Creating access to non-biased practices through teacher networks, state conferences, professional development workshops, and higher education forums were identified. Also mentioned were making technical assistance resources available.
CATEGORY FOCUS EXAMPLESDissemination Activities
Reporting Disproportionality & performance data, report cards, websites
Access Conferences, forums, resources
Examples of improvement activities within each category are representative of the range of effort but are not exclusive to those listed. It should be noted that the activities identified are those of 26 states only. SUMMARYIn general, several statements can be made.
Forty-three percent (43%), or 26 states reported state improvement activities.
As a result of the opportunity for states to delay responding to Indicator 9 until
2007, 57% of all reports did not include improvement activities.
Based on the breadth of improvement activities reported, it appears that states
are at very different levels related to their work in disproportionate representation in special education and related services.
There seems to be a series of predictable steps in addressing disproportionate
representation in special education and related services. These steps include:
99
development of measurements for identifying districts with disproportionate representation,
collection and analysis of data, revision of policies, practices and procedures at the district level, technical assistance and professional development, and progress monitoring.
Likewise, questions arise based on what has been reported and what has not.
Why did 24 states respond to Indicator 9, when they were not required to do so?
Analyzing by region, what patterns can be identified in terms of improvement
activities? Are they significant?
How are state finances, geography, population size and density related to efforts
to reduce disproportionate
100

INDICATORS 9 AND 10 [SECOND SET]
Westat’s Analysis of the Part B SPPs
Indicators #9 and #10: Disproportionality
This document summarizes Westat’s analysis of Indicators #9 and #10 of the Part B SPPs.
The indicators used for SPP reporting of disproportionality data are as follows:
#9. Percent of districts with disproportionate representation of racial and ethnic groups in special education and related services that is the result of inappropriate identification; and
#10. Percent of districts with disproportionate representation of racial and ethnic groups in specific disability categories that is the result of inappropriate identification.
Both Indicators #9 and #10 are new. Baseline data and targets are to be provided in the FFY 2005 APR due February 1, 2007. In the SPP, states were required to describe how the data are to be collected so that the state will be able to report baseline data and targets, including the state’s definition of disproportionate representation and the plan for determining whether the disproportionate representation is a result of inappropriate identification.
Measurement of these indicators was defined in the requirements as:
#9. Percent = # of districts with disproportionate representation of racial and ethnic groups in special education and related services that is the result of inappropriate identification divided by # of districts in the State times 100.
#10. Percent = # of districts with disproportionate representation of racial and ethnic groups in specific disability categories that is the result of inappropriate identification divided by # of districts in the State times 100.
Westat compiled all of the SPPs for the 50 states, DC, and nine territories. (For purposes of this discussion, we will refer to all as states, unless otherwise noted.) We developed a matrix based on some of the elements that states should have included for Indicators #9 and #10. The matrix includes the following:
1. Methods Used To Calculate Disproportionality;2. Definition of Disproportionate Representation;3. Minimum Cell Sizes Used in Calculations of Disproportionality;
101

4. Description of Plan for Reviewing Policies, Procedures, and Practices; and5. Description of Measurable and Rigorous Targets (if included – not
required).
Methods Used To Calculate DisproportionalityFor the SPP, states could choose the method they will use to calculate disproportionality. The SPP instructions advise states that they should consider using multiple methods to reduce the risk of overlooking potential problems. Thus, the SPPs were first examined to determine what method or methods states will use to calculate disproportionality.
The majority of states said they were going to use the risk ratio as the sole method for calculating disproportionality (27 states or 45%).
A small number of states will use other methods as their sole means of calculating disproportionality, including composition, risk, and the E-formula.
Thirteen states (22%) plan to use more than one method to calculate disproportionality. The methods states combined consisted of composition, risk, risk ratios, odds ratios, chi-square, standard errors, and the Z-test. Some examples of how states combined these methods include:
Composition and the risk ratio; Composition and risk; Composition and the Z-test; Composition, risk, and the risk ratio; Standard error and the odds ratio; and Risk and the risk ratio.
Fourteen states did not specify in their SPPs how they will calculate disproportionality (23%). Some of these states said that they were still determining what methods they would be using. This number also includes many of the territories, who stated that Indicators #9 and #10 did not apply to them because all of their children with disabilities are reported in one race/ethnicity category.
Definition of Disproportionate RepresentationStates were instructed to include the state’s definition of disproportionate representation in their SPPs. The definitions that states used varied and depended upon the method the state planned to use to calculate disproportionality. Also, some of the states that said they will use multiple methods for calculating disproportionality only included a definition of disproportionate representation for one of those methods. Below are some of the types of definitions that states provided.
Most of the states that plan to use the risk ratio defined disproportionality representation using a risk ratio cutoff point. That is, the risk ratio had to be greater than the cutoff point for the state to consider it disproportionate representation.
The most common risk ratio cutoff points were 1.5 (used by 7 states) and 2.0 (used by 11 states). Other cutoff points included
102
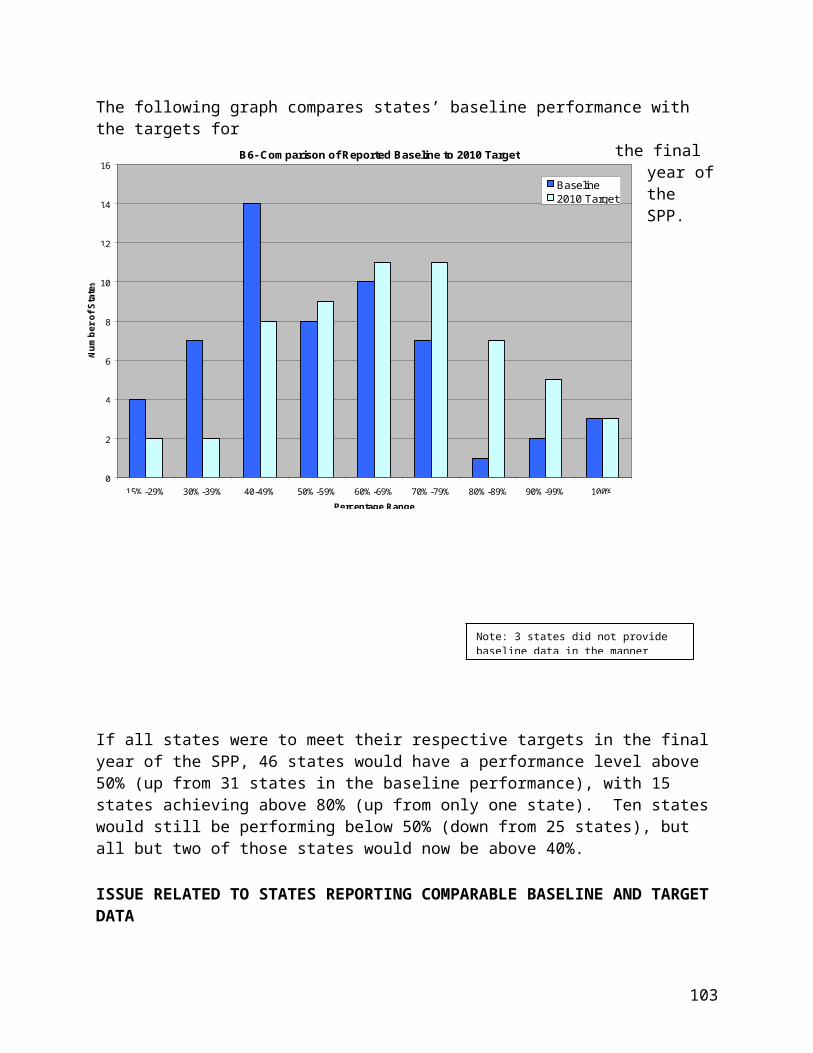
1.0, 1.3, and 3.0. One state used different risk ratio cutoff points for each racial/ethnic group that were calculated using 1.96 standard deviations from the state-level mean risk ratio for the racial/ethnic group.
Three states chose to use a tiered system of risk ratios cutoff points. For example, a risk ratio between 1.2 and 1.99 would be considered “at risk”; a risk ratio between 2.0 and 2.99 would be considered “disproportionate”; a risk ratio between 3.0 and 3.99 would be considered “significant disproportionality”; and a risk ratio greater than 4.0 would be considered “most significant.” Each level of disproportionality would then trigger a different activity by the state.
As part of their definition of disproportionate representation, a small number of states included cutoff points for underrepresentation (4 states).
Three states used risk ratio cutoff points in combination with performance data, such as assessment data, graduation rates, and dropout rates. In these states, the cutoff points were only applied to racial/ethnic groups with poorer than state average performance data.
States that plan to calculate disproportionality using composition defined disproportionate representation in several ways. The most common were:
A percentage point difference in composition, frequently either 10% or 20%; and
A relative difference in composition of ±20%. States that plan to use statistical tests defined disproportionate
representation in terms of significance levels (e.g., instances where p<.05).
Nineteen states did not provide a definition of the disproportionate representation. Some of these states said they would develop their definitions after analyzing their disproportionality data, while others stated that they were consulting with various stakeholder groups about their definition. Note, this number also includes those territories that questioned whether Indicators #9 and #10 applied to them.
Minimum Cell Sizes Used in Calculations of DisproportionalitySome states chose to specify minimum cell sizes that they would use in their calculations of disproportionality. Almost all of the states that specified minimum cell sizes, however, did not describe how disproportionality would be calculated or determined when this minimum cell size is not met. Thus, it is assumed these racial/ethnic groups or districts will be excluded from the analysis of disproportionality.
Not including the territories, over half of the states did not specify whether a minimum cell size would be used in their calculations (28 states).
Of those states that did include a minimum cell size, the type of cell size they chose to use varied.
103

Some states included a minimum cell size that was related to the number of students from a racial/ethnic group who were enrolled in the district. These minimum cell sizes tended to range from 5 to 30 students. Other states included a minimum cell size that was related to the number of students with disabilities from the racial/ethnic group. These minimum cell sizes tended to range from 5 to 20 students. Several states combined these types of minimum cell sizes; for example, there must be at least 20 students from the racial/ethnic group enrolled in the district and at least 5 students in the disability category.
Some states specified that small minority populations would be excluded from the analyses. For example, one state will exclude small numbers of American Indian/Alaska Native students from the analyses. In another state, because the state’s school population is 94% White, 5% Black, and less than 1% in each of the other racial/ethnic categories, the state’s analyses will exclude these other racial/ethnic groups.
Some states indicated that they would use a minimum cell size of 10, but did not specify whether this number was referring to child count data or enrollment data.
Description of Plan for Reviewing Policies, Procedures, and PracticesFor both Indicators #9 and #10, states needed to describe the how the state would determine that disproportionate representation of racial/ethnic groups in special education was the result of inappropriate identification. The amount of information states included in their plans for reviewing policies, procedures, and practices varied. Some states provided only limited detail regarding how this would be accomplished, while other states included quite a bit of detail. Only a handful of states provided no information (9 states, including 8 of the territories). Some of the approaches that states described are summarized below. In many cases, states’ plans included a combination of two or more of these approaches.
Many states indicated that they would be developing some type of disproportionality tool or rubric to guide the review process.
Other states indicated that the review would be accomplished through their monitoring activities, which often included an on-site review and additional data collection and analysis.
Some states required districts to complete a self-assessment or a self-study and then report back to the state, which would verify the findings.
Several states reported that they would conduct desk audits. Some states reported that they would use a tiered system of intervention,
where the degree of disproportionate representation would trigger different types of reviews.
Some states required that districts submit their policies and procedures to the state for review for appropriateness. Often, districts were required to submit their screening, referral, evaluation, and eligibility policies and procedures.
104
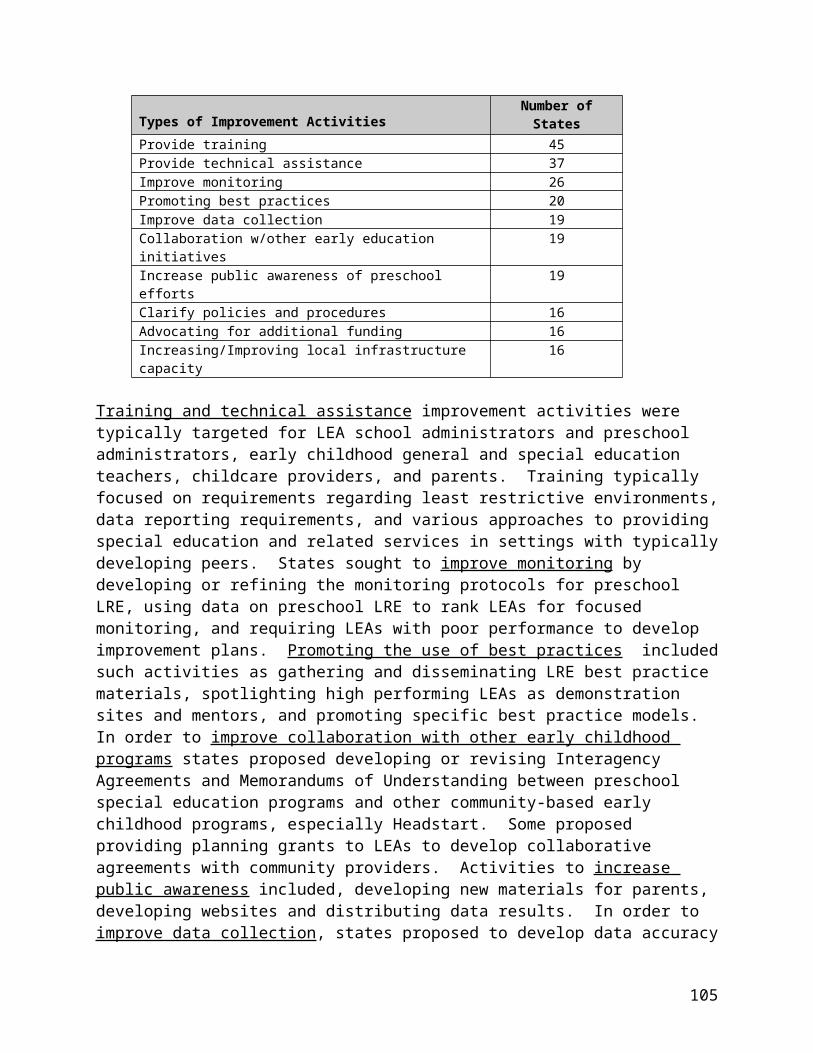
Description of Measurable and Rigorous TargetsBecause these are new indicators, states did not have to designate targets in their SPPs, but instead need to include this information in their APRs due February of 2007. A preliminary review of the SPPs, however, indicated that a number of states included targets for these indicators in their SPPs. Thus, we reviewed the measurable and rigorous targets designated by states for each of the FFYs 2005-2010 to ensure that they were 0%, if the state included targets.
Excluding the territories, about half of the states did not designate targets for Indicators #9 and #10 (23 states).
All of the states that did designate targets, designated targets of 0%, although one state did not discuss disproportionate representation in relation to inappropriate policies, procedures, and practices.
105

INDICATOR 11: CHILD FIND
Analysis of SPP Effective General Supervision Part B: Child FindIndicator #11: Evaluation Timelines Part B
This document summarizes analysis of Evaluation Timeline content submitted for Indicator #11 of the Part B SPPs, completed by NCSEAM.
Indicator 11: Percent of children with parental consent to evaluate who were evaluated and eligibility determined within 60 days (or State established timeline). [20 U.S.C. 1416(a)(3)(B)] [New Indicator]
As noted, Indicator 11 is new. Baseline data and targets are to be provided in the FFY 2005 APR due February 1, 2007. In the SPP, states were asked to describe how data are to be collected so that the state will be able to report baseline data and targets.
Data Source:Data to be taken from State monitoring or State data system and must be based on actual, not an average, number of days. Indicate if the State has established a timeline and, if so, what is the State’s timeline for initial evaluations.
Measurement:a. # of children for whom parental consent to evaluate was received.b. # determined not eligible whose evaluations and eligibility determinations were
completed within 60 days (or State established timeline).c. # determined eligible whose evaluations and eligibility determinations were
completed within 60 days (or State established timeline).
Account for children included in a but not included in b or c. Indicate the range of days beyond the timeline when eligibility was determined and any reasons for the delays.
Percent = b + c divided by a times 100.
This indicator is referring to “initial” eligibility determination. When data is taken from State monitoring, States were required to describe the method used to select LEAs for monitoring.
Analysis
We compiled all of the SPPs for the 50 states, DC, and nine territories. (For purposes of this discussion, we will refer to all as states, unless otherwise noted.) We developed a table matrix based on the elements that states were required to include for this indicator. The matrix includes the following:
New Indicator Data Source; How Data Will Be Collected; State Standard Number of Days
106

1. New Indicator Data Source
The following table summarizes the sources of data for this indicator:Monitoring
System State Data System Other
Monitoring System
State Student Database
District report
Anticipate fields in state database in future
Not reported, Not Yet Determined, Cannot
Identify29 14 12 17 4
Some states plan to obtain data through multiple sources.
Several of the 17 states that are adding fields to their state database are also collecting data through their monitoring system initially.
2. How Data Will Be Collected
The following table summarizes the information on data collection methods for this indicator: On-site Activities
file reviews 15Interviews 4
other unspecified 1 Other monitoring
local self-assessment 7
desk audits 2
Other
locals enter into state database 19locals complete report and submit to state 8Not stated in the SPP 12
Several states listed multiple methods for the data collection within monitoring activities.
Five states indicated that sampling of either locals or files within locals would be used for this indicator.
107
3. State Standard Number of DaysThe following table summarizes the variation in state established timelines:
Calendar Days School DaysUnknown
(calendar vs school)Days # states Days # states Days # states
60 4 30 2 45 390 1 40 1 60 26 45 5 90 4 60 6 80 1 65 1 120 1
unknown or did not specify 6
Other findings on number of days:
Three states’ timelines are from consent to completion of the evaluation report.
One state’s timeline is specified as 45 school days or 90 calendar days, whichever is shorter.
One state has a state requirement of 90 days but has asked locals to observe the 60 day federal timeline requirement as well.
One state has a 30 day timeline for preschool and a 60 day timeline for school age.
Three states did not previously have a defined timeline requirement at the state level.
108

INDICATOR 12: EARLY CHILDHOOD TRANSITION
NECTAC REVIEW OF PART B INDICATOR #12
Part B INDICATOR #12: Percent of children referred by Part C prior to age 3 and who are found eligible for Part B, and who have an IEP developed and implemented by their third birthdays
Introduction
Indicator #12 is considered a compliance indicator with a performance target of 100%. Part B regulations specify that, in order for a state to be eligible for a grant under Part B it must have policies and procedures that ensure that, “Children participating in early intervention programs assisted under Part C, and who will participate in preschool programs assisted under this part [Part B] experience a smooth and effective transition to those preschool programs in a manner consistent with 637(a) (9). By the third birthday of such a child an individualized education program has been developed and is being implemented for the child” [Section 612 (a) (9)]. In responding to this indicator states were asked, in addition to determining the state’s baseline performance, to provide the range in the number of days that occurred beyond the child’s third birthday before eligibility was determined and the reasons these delays. This review and analysis of Part B indicator #12 is based on a review of Part B State Performance Plans (SPP) for 56 of 59 states and jurisdictions. Indicator #12 was not applicable to three jurisdictions in the Pacific Basin because those jurisdictions are not eligible to receive Part C funds under the IDEA.
BASELINE PERFORMANCE DATA
Data Sources
Seventeen states did not provide a source for their baseline performance data. Of those that did, 28 states used data from their state data system and 8 used data from the monitoring of LEAs. Two states indicated the Part C Exit Table as the data source for baseline performance. In both cases the lead agency for Part C in the state is the Department of Education, making transition an intra-agency, rather than interagency, process. One of those states is a “birth mandate state” making children in Part C already being served by a local school before the child’s third birthday. One state reported conducting a survey of LEAs to collect baseline data.
109

Indicator B12 -Reported SPP Baseline Performance
0
2
4
6
8
10
12
14
17%-39% 40%-49% 50%-59% 60%-69% 70%-79% 80%-89% 90%-99% 100%
Percentile Range
Num
ber o
f Sta
tes
Baseline Performance
The table below shows the distribution of baseline performance for only 38 of 56 states/jurisdictions reporting baseline data that responded appropriately to indicator #12. Sixteen states were not able to provide data indicating the state’s baseline performance and 2 states data were not responsive to the indicator.
Table 1. Distribution of States’ Baseline Performance
Percent of eligible children with an IEP implemented by
the child’s 3rd birthday
Number of States in each percentile
distribution100% 1
90% to 99% 580% to 89% 1370% to 79% 360% to 69% 750%t to 59% 440% to 49% 217% to 39% 3
Baseline data not provided 16Not responsive to indicator 2
Only one state was able to report full compliance with Indicator #12. Since this was a “birth mandate state” all children eligible for Part C are also eligible for the state’s special education and related services. Therefore, Part C eligible children are already receiving the equivalent of IEP services before their third birthdays. Only 6 states reported baseline performances at 90% or above. Thirty-three states were at 50% or above and 5 states were below 50%. However, the baseline performance of another 18 states is not yet known. The graph below displays states’ baseline performance for SPP Indicator #12 for the 38 states that reported baseline performance.
110

Ranges reported by states in the number of days beyond the third birthday that occurred before the eligibility of a child referred by Part C was determined
Twenty-nine states provided no information in response to OSEP’s request. Another 12 states, while acknowledging OSEP’s request, were unable to provide the information requested because such data is not currently gathered in the state’s data system and/or its monitoring of LEAs. Only 15 states were able to respond to OSEP’s request. The one state reporting full compliance had no range of days to report. Another state’s response indicated that the eligibility of all the children referred from Part C had been determined by the child’s third birthday, but for some whose birthday occurs during the summer an interagency agreement with Part C allows those children to remain in Part C until school starts. The distribution of ranges reported by the other 13 states is shown in Table 2 below.
Table 2. Range in #of days beyond 3rd birthday before eligibility was determined
Distribution of Ranges Reported by States
Number of States in Each Range
30 days or less 160 days or less 290 days or less 3
120 days or less 2180 days or less 1200 days or less 1240 days or less 1365 days or less 2
Total 13
Reasons for Eligibility Not being Determined by the Third Birthday
Forty-two states did not provide any information regarding the reasons for eligibility not being determined by the third birthday. Of those states, 22 states indicated that such data had not been collected (with 16 of those also not providing baseline performance data). Of the 14 states that provided reasons, 8 states identified family circumstances as a reason, and 11 identified system related circumstances. One state identified not receiving the child’s referral form Part C until less than 30 days before the child’s third birthday. The state reporting full compliance had no delays to report.
Variance in the Responses of StatesOSEP’s request regarding delays may have been interpreted differently among those states that were able to respond. OSEP said, “Indicate the range of days beyond the third birthday when eligibility was determined and reasons for the delays.” While the language in Indicator #12 itself covers the entire process of
111
eligibility determination, IEP development and IEP implementation, OSEP’s request seems to be limited to just the first step in that process, the determination of eligibility. It is not clear whether state responses to the request are based on any delays associated with the entire process described in Indicator #12 or just on those delays encountered during eligibility determination.
PERFORMANCE TARGETS
Since Indicator #12 is considered a compliance indicator rigorous and measurable performance targets for all six years of the SPP are 100%.
IMPROVEMENT ACTIVITIES, TIMELINES, RESOURCES
States improvement activities, timelines and resources for Indicator #12 were reviewed in order to determine:
What types of improvement activities are being used by states? What amount of specificity did states provide in their six-year
improvement plan? What assertions of effectiveness, if any, did states provide?
Types of Improvement Activities
The table below shows the types of improvement activities states plan to use to address Indicator #12 and the number of states employing each type of activity.
Table 3. Types of Improvement Activities To Be Used By States
Types of Improvement ActivitiesNumber of
StatesImprove data collection 48Improve monitoring 32Provide training 46Provide technical assistance 31Clarify policies and procedures 28Interagency collaboration 20Special program evaluation efforts 5Develop/distribute information to public 5Increase personnel 3
112
All but a very few states identified a need to improve data collection regarding Indicator #12, including additions and changes to both the types of data being collected regarding transition and the way data is collected. Many states described plans to establish ways to collect data jointly with the state’s Part C program and/or to share data being collected separately. Some states described plans to create a “tracking system” within their state data system, in order to know when timelines are being met and when they are not. Some states plan to carry out data verification activities to better establish the accuracy of their data and some plan to include performance regarding this indicator in an LEAs performance “report card”. In order to improve the monitoring of Indicator #12 some states have included or plan to add the monitoring of transition from Part C to its monitoring priorities. Many states are exploring monitoring transition jointly with their state’s Part C program. Plans include revising monitoring protocols and steps to ensure the timely collection and reporting of data.
Providing training and technical assistance is also a major feature of state improvement plans. Typical targets for training and technical assistance include LEA special education coordinators, preschool teachers, and Head Start teachers. Many states proposed conducting joint training for Part B and Part C staff. Some states plan to target training and technical assistance on low performing LEAs. In addition to proposing training that covers transition requirements and procedures, some states plan to focus training on their new on transition for data collection and reporting on transition, and also on incorporating evidence based practices into transition services.
Many states recognized the need to improve coordination and collaboration with the state’s Part C Program, especially developing and/or up-dating interagency agreements regarding transition. In order to further clarify policies and procedures related to transition from Part C, including new IDEA requirements, some states plan to develop and disseminate new documents on transition policies. A few states are planning to disseminate information to the public about the transition from early intervention to preschool services, and to carry out special program evaluation efforts such as surveying parents about their transition experience and focused evaluation on timeline issues.
Level of Specificity
After reviewing the improvement activities, timelines and resources section of a state’s response to Indicator #12, the state’s improvement activities were assigned a specificity rating of high, moderate, or low. A plan that was rated high was characterized by improvement activities that reflected multiple approaches to
113

achieving improvement that included most (if not all) of the types of improvement activities identified above. Improvement activities were usually delineated as a sequence of specific steps with accompanying timelines and resources, usually organized by year. Proposed activities were explained in some detail. A plan that was rated moderate contained a lesser number of activities and without as much detail, but did include timelines and resources. Sequencing of the activities across the six years was not as well specified. A plan that was rated low contained only a few activities; descriptions of proposed activities were vague and lacking in detail; timelines and resources were not provided; and the activities typically did not cover all six years. The table below displays the results of the assignment of ratings.
Table 4. Level of Specificity in SPP Improvement Activities
Assertions of Effectiveness
The review of Indicator #12 found no instances of a state making as assertion that a proposed improvement activity was selected because of demonstrated effectiveness.
Level of Specificity Number of statesHigh 2
Moderate 8Low 45
114

INDICATOR 13: SECONDARY TRANSITION
ANALYSIS OF 2005-2006 STATE PERFORMANCE PLANS FOR INDICATOR 13
Indicator 13 requires states to report data on the percent of youth aged 16 and above with an IEP that includes coordinated, measurable, annual IEP goals and transition services that will reasonably enable the child to meet the post-secondary goals. Baseline data must be reported by February 1, 2007. The sections below summarize states’ plans for collecting and reporting data for Indicator 13. Since 100% of states and territories responded, percentages are based on n = 60.
Age
Almost all respondents (93.3%; n = 56) indicated that they would gather data on students age 16 and above, as stated in the indicator. Three respondents (5%) indicated they would collect data on students age 14 and above and one (1.6%) indicated they would collect Indicator 13 data on students age 15 and above.
Data Collected to Calculate Standard Percentage
The vast majority of respondents (85%; n = 53) did not indicate what data they would gather to measure Indicator 13, instead they merely stated that they would calculate the standard percentage. However, nine (15%) respondents did provide some detail on what data they would gather to measure Indicator 13 (e.g., post-secondary education/employment goal, community/independent living goal, and a minimum of one transition service per goal).
Data Collection Procedures
Respondents indicated that data to measure Indicator 13 would be gathered using a variety of strategies including:
1) Electronic monitoring system (41.7%; n = 25)2) Student file review (26.7%; n = 10)3) On-site monitoring (5.0%; n = 3)4) Student and parent surveys (3.3%; n = 2)5) Combination of strategies (13.3%; n = 8)6) To be determined/not indicated (10%; n = 6)
Activities for Improvement
In terms of activities that would be needed to improve respondents’ ability to measure and use Indicator 13 data, 31.7% (n = 19) did not state any activities, 26.7% (n = 16) stated that they would wait until baseline data had been collected, and 41.6% (n = 25)
115

defined activities that would be needed to improve their system. Of the 25 respondents who defined activities for improvement, the activities were divided into the following five categories:
1) Training/Technical Assistance (88%; n = 22). For example, developing research-based, transition-focused rubrics, training, and curriculum for LEAs and providing professional development on transition requirements and IEP development.
2) Monitor/Adjust Policies/Practices/Procedures (76%; n= 19). For example, developing quality indicators to support high quality transition planning in the IEP process and submitting improvement plans through the state process.
3) Data Monitoring/Recording (64%; n = 16). For example, analyzing data and preparing plans for APRs and reporting data for the public.
4) Develop Interagency Collaboration (40%; n = 10). For example, developing a statewide community of practice for collaborative efforts related to transition services and working with IHEs to improve their transition-related pre-service and in-service coursework.
5) Materials Development/Dissemination (15%; n = 9). For example, creating web-based training modules in the area of family and student involvement, interagency collaboration, and the transition planning process.
Summary of Indicator 13
Although baseline data for Indicator 13 are not required until February 1, 2007, all states have started the planning process to collect the necessary data. First, almost all states/territories will follow the Indicator 13 requirement for collecting data beginning at age 16 (93.3%). Second, while 90% have a plan for collecting Indicator 13 data (e.g., electronic monitoring systems, student file review), only 15% provided a description of what data they will collect to measure Indicator 13. Finally, while 58.3% (n = 35) did not list any activities for improvement, 41.6% (n = 25) listed activities in a variety of areas including training/technical assistance, monitoring/adjust policies/practices/procedures, data monitoring/recording, develop interagency coordination, and materials development/dissemination.
116

INDICATOR 14: POST-SCHOOL OUTCOMES
INDICATOR
Indicator 14: Percent of youth who had IEPs, are no longer in secondary school and who have been competitively employed, enrolled in some type of postsecondary school, or both, within one year of leaving high school. (20 U.S.C. 1416(a)(3)(B)).
OVERVIEW
Indicator 14 was a new reporting requirement in the 2005 State Performance Plan (SPP). For this indicator, states were asked to describe how they would collect post-school outcome data for school leavers on IEPs one-year after leaving high school. States were offered the option of either (a) conducting a census of all students on IEPs leaving high schools in their state in a particular year or (b) establishing a representative sample of school leavers in their state for a particular year. In either case, data were to be gathered in such a way as to (a) include students who graduated, completed high school with a modified completion document, aged out of school, or dropped out and (b) describe students in terms of their primary disability, gender, and ethnicity.
For the 2005 SPP reporting period, states were asked to describe (a) the data they would collect; (b) from where (e.g., extant data set) that data would be collected; (c) the “representativeness” of data collected by gender, disability type, and ethnicity; and (d) to provide a time schedule for the data collection. Those states choosing to conduct a representative sample of school leavers were to present a sampling plan detailing (a) the sampling procedures (e.g., random, stratified, etc.), (b) the methods to be used to test the similarity or difference of the sample from the population of students with individual education plans, and (c) how the State Education Agency (SEA) would address problems with response rates, missing data, and selection bias.
In combination, these requirements lead to two primary procedures — census/sampling and data collection -- that states were asked to address in their SPP. As Indicator 14 was new for 2005, there was no requirement to present baseline data or measurable and rigorous targets for this Indicator. We should point out that 8 states did, however, choose to report baseline data.
The National Post-School Outcomes (NPSO) Center analyzed the SPPs from all 60 United States, jurisdictions, and territories. From this point on we will refer to these 60 states, jurisdictions, and territories as “states.”
To conduct the analyses, we developed a coding protocol in alignment with the requirements of the SPP (Note: the coding protocol was reviewed and approved by OSEP officials). Project staff analyzed the SPP by coding the document using the structured review protocol. A second reviewer was assigned for 30 (50%) of the SPPs to double code the SPP in order to establish inter-judge agreement. In several instances
117
coding discrepancies were noted. In those cases, the discrepancy was discussed by the two coders and then recoded by the project director; thus, 100% agreement was achieved for the entire coding process.
The coding protocol was based on 15 questions, centered on four primary themes: (a) current use of an existing data collection system for collecting post-school outcomes, (b) sampling, (c) data collection plans, and (d) intended use of technical assistance in the future. These four areas and the questions on the protocol comprising each area are reported below.
Section I: Documenting an Existing Data Collection System
1. Does the state report having an existing system for collecting post-school outcome data?
2. Does the state report baseline data for employment and or post-secondary education enrollment?
3. If baseline data are reported, describe briefly.
Section II: Establishing the Sampling Frame
4. Will states use a census or a sample to define on whom data are collected?5. Does the state include a data collection plan for non-graduating students,
including those who age-out or drop-out?6. Does the state include a plan to define a representative sample by disability type,
ethnicity, and gender? 7. Does the state include a plan to collect data annually from school districts with
student enrollment above 50,000? 8. Is the state planning to test statistically whether the respondents are
representative of all students with IEPs in the state based on disability, gender, and ethnicity?
9. Is the state's sampling plan, as described, sufficient to gain a representative sample?
Section III: Establishing the Data Collection System
10.Does the state indicate a plan to collect post-school employment and post-school enrollment outcomes?
11.What method does the state plan to use to collect their post-school data (e.g., extant data or survey)?
12. If a survey is to be conducted, what type of survey method will be used (e.g., mail, web-based, phone, person, or combination)?
13.Who will collect the post-school outcomes (e.g., a hired contractor, or the state or local education agency)?
14. Is the state's data collection plan, as described, sufficient to make a judgment about its adequacy?
118
Section IV: Identifying Future Technical Assistance
15.Does the state plan to access technical assistance in the future?
RESULTS
The results are organized by the four areas presented above. Percentages are based on N = 60, the total of all states, jurisdictions, and territories. Where we could report on only a subset of the 60 states, we have elected not to present percentages.
Section I: Documenting an Existing Data Collection System
As presented in Table 1, 29 (48.3%) states reported having an existing post-school outcome data collection system. Of those 29, eight (13.3%) states reported baseline data for employment and/or post-secondary education enrollment. Of the 8 states reporting baseline data, 4 states included baseline data on employment and 4 states reported baseline data for both employment and post-secondary education enrollment. Table 1. Summary of states reporting an existing data collection system
Question No Yes
N % N %
1. Does the state report having an existing system for collecting post-school outcome data?
31 51.7 29 48.3
2. Does the state report baseline data for employment and/or post-secondary education enrollment?
52 86.7 8 13.3
Section II: Establishing the Sampling Frame
To collect post-school outcome data on all exiting school leavers, states can choose to conduct a census (e.g., data collected on the total population of school leavers with disabilities) or develop a sampling plan (e.g., a randomized selection of school leavers with disabilities). The following is a summary of the states who report the method (e.g., sample or census) they planned to use to conduct relative to conducting a census or establishing a representative sample.
Thirty-one (51.7%) states report that they are planning to conduct a sample of school leavers with disabilities.
Nineteen (31.7%) states report that the are planning to conduct a census of school leavers with disabilities.
Ten (16.7%) states did not report whether they planned to conduct a census or develop a sampling plan for the collection of post-school outcomes.
119
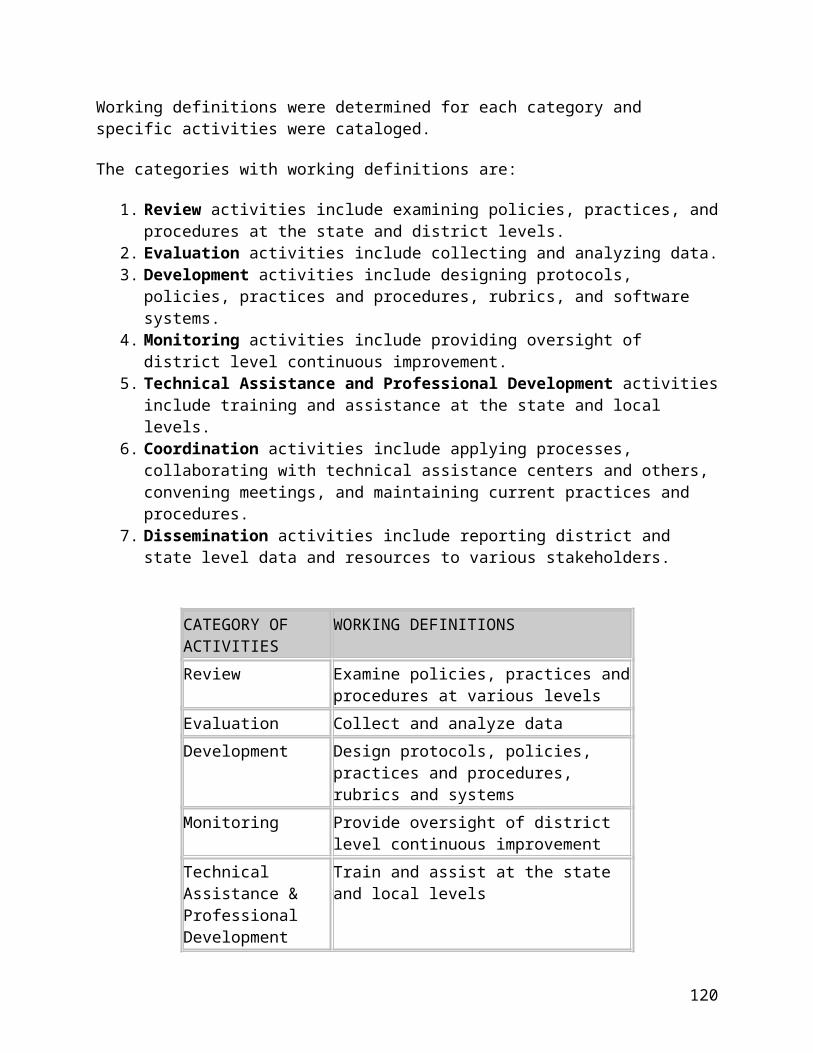
States were to describe the process they would follow to collect data on the post-school outcomes of the school leavers in their state. As we stated above, these data were to be gathered on all school leavers including those who exited with a diploma and on those students who have aged out or have left school (e.g., dropped out) prior to graduation. The following information presents the number of states who define the population that data will be collected in the following manner:
Of the 19 states reporting a plan to conduct a census of school leavers, 9 states reported they would include students who age-out or drop-out in the census along with graduates.
Of the 31 states reporting a plan to sample school leavers, 14 states reported they would include students who age-out or drop-out in their sample along with graduates.
Of the 10 states not specifying census or sample, 1 state reported they would include students who age-out or drop-out of school along with graduates.
The following information summarizes how states reported that their plan would address the following SPP requirements.
9 states reported a method to define representativeness of their sample by disability type, ethnicity, and gender.
11 states reported that all districts with an enrollment over 50,000 would be included in data collection every year.
15 states, including 2 states that will complete a census and 13 states that will sample, reported they would statistically test whether their respondents after data collection were representative to their state’s population of school leavers with IEPs on disability type, ethnicity, and gender.
Table 2 presents information for states who reported they had a plan for each of the questions defined in the coding protocol.
Table 2. Summary of States Reporting Plans to Develop a Representative Respondent Pool.
Question Census n = 19
Sample n = 31
Not Reported
n = 10
n % n % n %
6. Does the state include a plan to define a representative sample by disability type, ethnicity, and gender?
NA NA 9 29.0 0 0.0
120
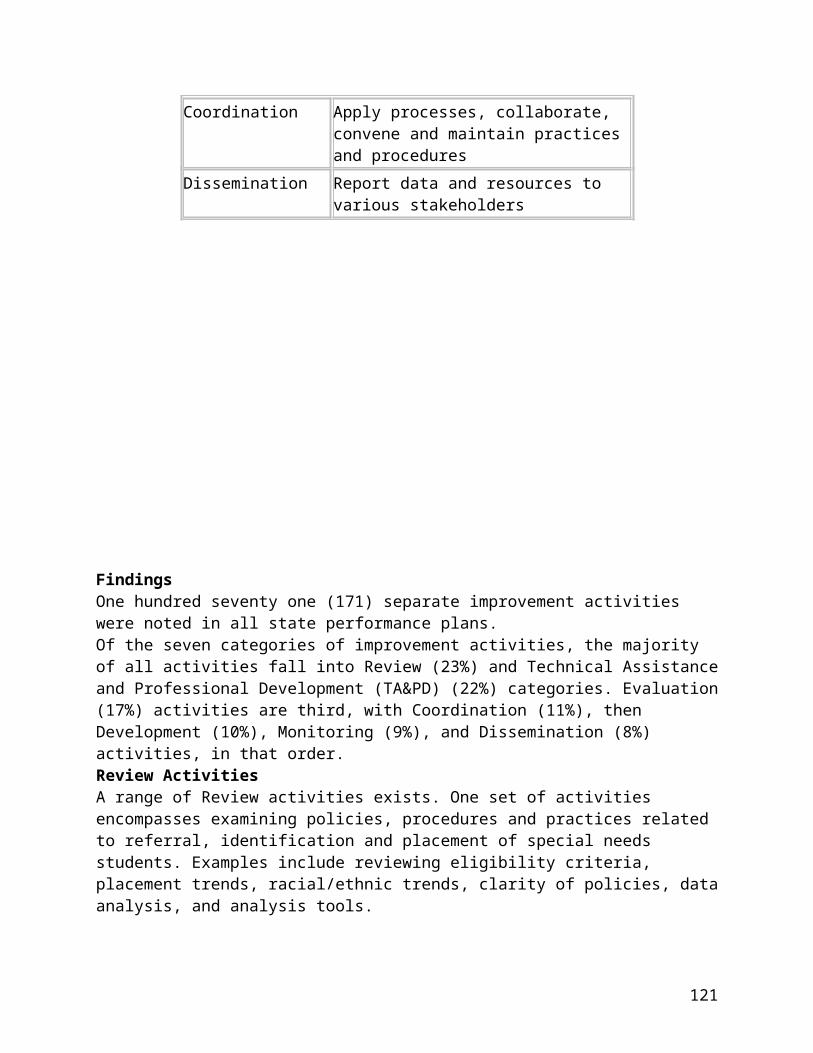
Question Census n = 19
Sample n = 31
Not Reported
n = 10
n % n % n %
7. Does the state include a plan to collect data annually from school districts with student enrollment above 50,000?
NA NA 11 35.5 0 0.0
8. Is the state planning to test statistically whether the respondents are representative of all students with IEPs in the state based on disability, gender, and ethnicity?
2 10.5 13 41.9 0 0.0
Finally, the sampling plan was assessed for whether sufficient detail was provided to judge the adequacy of the plan. Of the 19 states who reported the use of a census, only 2 states were judged by NPSO staff as providing sufficient detail to be able to assess the adequacy of the plan for the development of their census.
Of the 31 states who reported the use of a sampling plan, 4 states’ sampling plans were judged as providing sufficient detail to assess the adequacy of their sampling plan. Additionally, 4 additional states whose sampling plan description was not judged as adequate stated they will use NPSO sampling calculator to create their representative sample. If the sampling calculator is used appropriately then these states also would have plans to enable the development of a representative pool of respondents.
The 10 states that did not specify clearly whether a sample or a census would be completed were judged not to have an adequate plan to develop a representative respondent pool.
In total, 10 (17%) states were judged to have presented either a census or sampling plan in sufficient detail to judge the adequacy of those plans and to believe that their approach would produce a representative picture of school leavers in their respective state.
Section III: Establishing the Data Collection System
This section describes the methods states reported how they plan to collect data on school leavers with IEPs. As defined in the Indicator, states are required to report post-school outcomes on competitive employment and enrollment in some type of post-secondary school or both. Relative to the data collection system:
48 (80%) states reported a plan to use a survey.
121
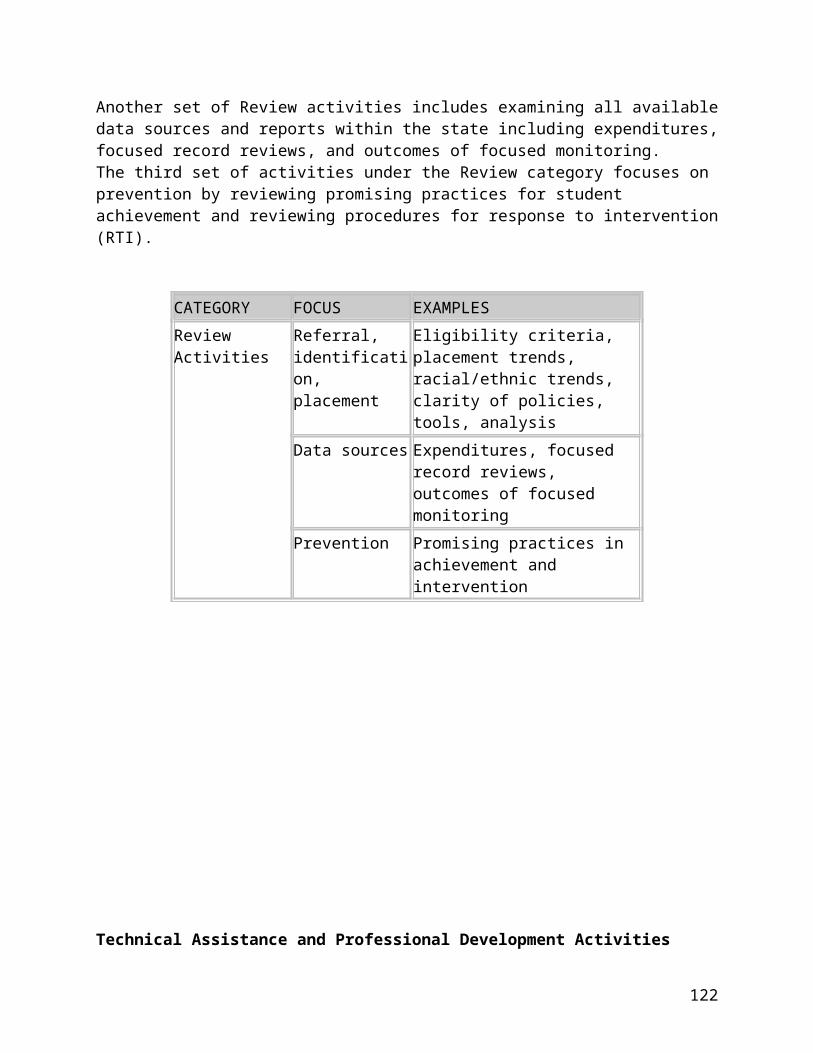
34 (57%) states defined competitive employment and postsecondary education for their data collection process.
11 (18.3%) states did not indicate a specific data collection method. 1 (1.7%) state reported a plan to use extant data.
Of the 48 states who reported a plan to conduct a survey,
15 reported they would use a combination of survey methods (i.e., phone and mail).
13 did not report a specific survey method. 12 states reported the use of a phone survey. 3 reported the use of personal interviews, home visits, or face to face contact. 3 reported they would use a web-based survey. 2 reported they would use mail survey.
States often reported who was responsible for the data collection process (e.g., contractor, the SEA, or LEA). Data collection responsibility was reported as follows:
24 did not report who would be responsible for data collection. 22 reported that data collection would be completed by the local education
agency. 9 reported that data collection would be completed by a hired contractor. 4 reported that data collection would be completed by the state education
agency. 2 reported that data collection would be done by some combination of SEA, LEA,
and/or a hired contractor.
Finally, based on specified criteria, NPSO judged that 2 (3.3%) state’s data collection plan, as described, were judged as sufficient to ensure the adequacy of collecting post-school outcome data.
Section IV: Identifying Future Technical Assistance
As part of the coding process, we additionally identified those states that would report the use of some type of technical assistance to support the state in the development and implementation of their post-school outcome data collection process. The types of technical assistance included: (a) NPSO, (b) RRCs, and (c) research experts in the field.
Thirty-four (56.7%) states reported a plan to access technical assistance in the future. Noteworthy, of the 10 states that did not include a specific sampling plan, 6 indicated a plan to access technical assistance on sampling in the future. Of the 58 states that did not include an adequate description of their data collection plan, 33 states reported they would access some type of technical assistance on data collection in the future.
122

INDICATOR 15: GENERAL SUPERVISION
This document summarizes the analysis of Indicator 15, General Supervision System
Indicator 15: General supervision system (including monitoring, complaints, hearings, etc.) identifies and corrects noncompliance as soon as possible but in no case later than one year from identification. (20 U.S.C. 1416 (a)(3)(B))
Data Source:Data to be taken from State monitoring, complaints, hearings and other general supervision systems. Indicate the number of agencies monitored related to the monitoring priority areas and indicators and the number of agencies monitored related to areas not included in monitoring priority areas and indicators.
Measurement:A. Percent of noncompliance related to monitoring priority areas and indicators
corrected within one year of identification:a.# of findings of noncompliance made related to monitoring priority areas and
indicators.b.# of corrections completed as soon as possible but in no case later than one year
from identification.Percent = b divided by a times 100.For any noncompliance not corrected within one year of identification, describe what actions, including technical assistance and/or enforcement that the State has taken.
B. Percent of noncompliance related to areas not included in the above monitoring priority areas and indicators corrected within one year of identification:a.# of findings of noncompliance made related to such areas.b.# of corrections completed as soon as possible but in no case later than one year
from identification.Percent = b divided by a times 100.For any noncompliance not corrected within one year of identification, describe what actions, including technical assistance and/or enforcement that the State has taken.
C. Percent of noncompliance identified through other mechanisms (complaints, due process hearings, mediations, etc.) corrected within one year of identification:a.# of agencies in which noncompliance was identified through other mechanisms.b.# of findings of noncompliance made.c. # of corrections completed as soon as possible but in no case later than one year
from identification.Percent = c divided by b times 100.
For any noncompliance not corrected within one year of identification, describe what actions, including technical assistance and/or enforcement that the State has taken.
123

Instructions for Indicators/MeasurementStates must describe the process for selecting LEAs for monitoring.
States should describe the results of the calculations and compare the results to their target.
In Measurements A and B, States should reflect monitoring data collected through on-site visits, self-assessments, local performance plans and annual performance reports, desk audits and/or data reviews.
In Measurements B and C, areas of noncompliance not related to monitoring priority areas and indicators may be grouped by topical areas. The State should describe the topical areas.
IntroductionThe indicator specifically begins with the words “General supervision system.” Using the framework or puzzle components provided by OSEP at the National Accountability Conference in 2004, the analysis looked for methods associated with
Statutes and regulations; Policies and procedures; Interagency agreements and MOUs; Monitoring ; Data collection; Technical assistance; Dissemination of promising practices; Dispute resolution; Enforcement; Other sources.
AnalysisAll SPPs were reviewed. (For purposes of this document, the word state will be used to represent all entities.) A table matrix was developed that included the following headings:
Baseline data – FY Reported, % Corrected within 1 year for A, B, and C Methods used to select LEAs for monitoring Number of agencies monitored by method Monitoring data collected Actions taken for noncompliance not corrected within one year of identification Improvement strategies
General ResultsFY and % CorrectionThe FY reported varied from 2003 to 2005, although most states used 2004, by which they indicated they meant 2004-05.
124
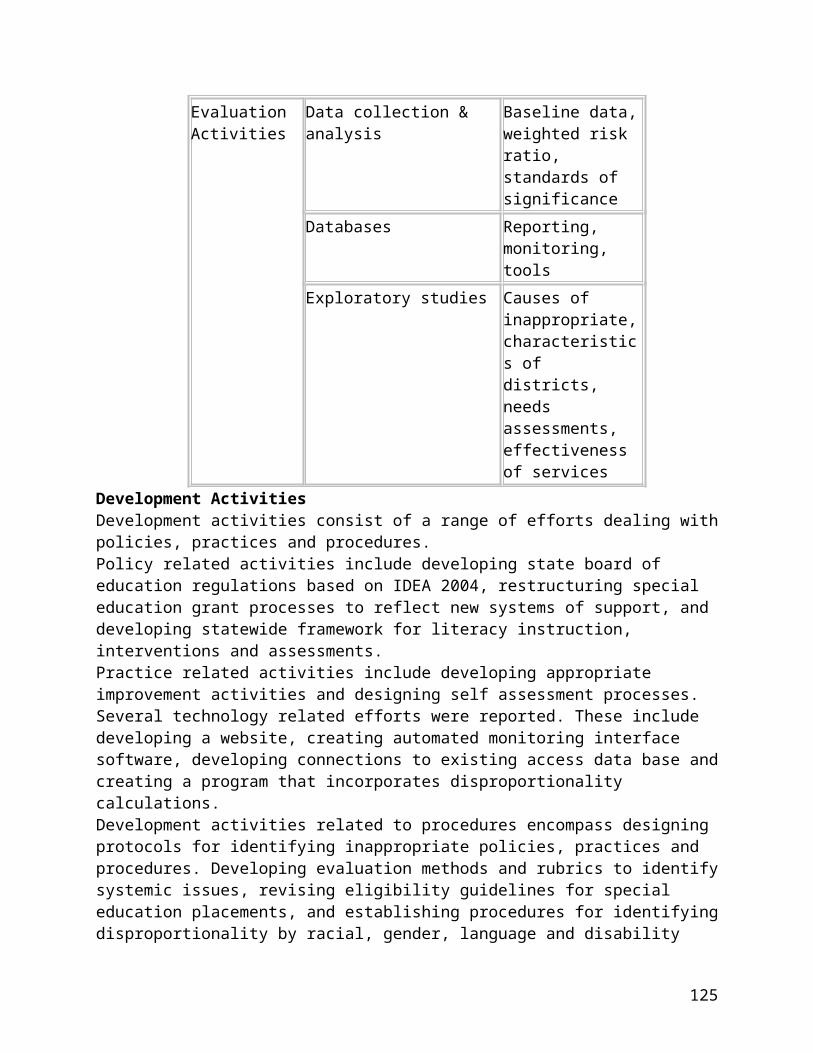
Most states attempted to answer 15 for A, B, and C. About 12% did not report percents for A, B, or C and about 10% did not report for A and B. A few states answered in percent of districts rather than corrections. There was a range in percent corrected from 0 to 100%. Some states used a table similar to the one provided at the summer institute that showed findings of noncompliance and corrections by method of monitoring; most states, however, provided numbers without a monitoring method attached. A number of the states did reflect the topical areas of the findings of noncompliance; however, this was not found in all plans. States did have greater difficulty with identifying topical areas for C (dispute resolutions) than for B.
Methods to SelectIn general, it was difficult to determine the specific process for selecting LEAs for monitoring. There are several reasons. One reason seems to be related to an underlying understanding of monitoring as occurring on-site. It seemed that the words monitoring and on-site were considered synonymous. Another reason for difficulty with identifying methods to select is that most frequently states described methods of monitoring rather than methods of selection.
The most frequent methods identified were cycle (50%) and focused monitoring (25%). By implication these meant an on-site visit.
Some states indicated a combination of a cycle and focused monitoring, such as the “focused 5 year cycle.” Some used the generic terms of “traditional” or “on-site” to identify the methods. Other monitoring methods states identified included self-assessment, multifaceted approach, random selection, and a general titled state monitoring method, such as the XYZ Continuous Improvement Monitoring or QRS Quality Program Monitoring.
The length of years between on-site visits for states that identified monitoring on a cycle was three to six years. Some states that identified focused monitoring also identified the selection indicators; the most common indicators were graduation, test performance or achievement, and educational environments.
Number of AgenciesAs noted above, it seemed that many states interpreted the instruction States must describe the process for selecting LEAs for monitoring as referring to an on-site activity. Therefore, while several methods might have been listed, the number was usually linked to the on-site visit. Some states did identify the number by selection progress. For example, focused monitoring = 8; continuous improvement = all; compliance follow up = 10; continuous improvement follow up = 12 or self-assessment = 73; on-site = 76; focused monitoring = 5. Some states did use the table OSEP presented at the 2005 Summer Institute to categorize methods to select, number of agencies, findings by method, and corrections.
125
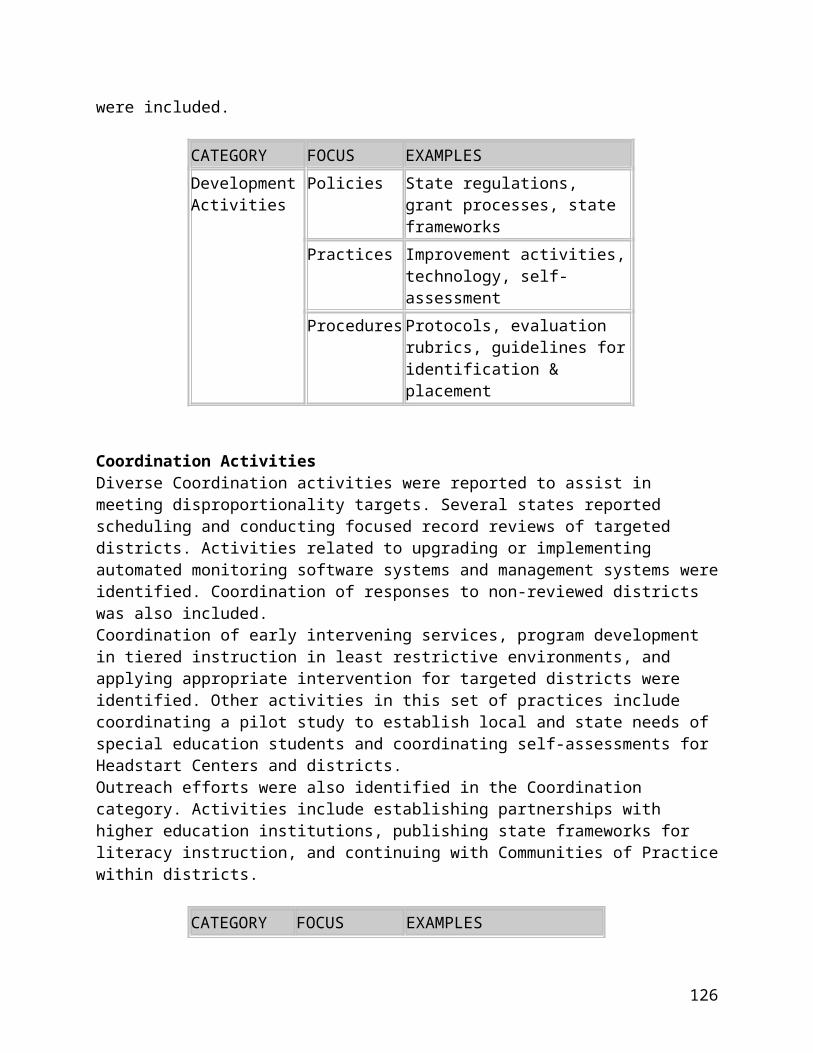
Monitoring Data CollectedThere was great variability in the detail or explicit associations between method and data or information collected. Most frequently for on-site activities it was noted that data were gathered through file reviews, interviews, and observations.
One difficulty encountered was that self-assessment could simultaneously be a method for selecting LEAs and a source of data either before or during an on-site visit. Self-assessment or self-review was mentioned in approximately 21% of the SPPs. Surveys were also used to collect data for monitoring; in some states these were conducted on-site, in others off-site.
While data reports/analyses were sometimes mentioned, it was often difficult to discern how the review/analysis was intended to be used. There were instances that it was explained that districts were provided data to completed self-assessments or that data reports or tables were provided to districts; yet, data seemed to have a more generic connotation, rather than specific programmatic or demographic data.
Off-site monitoring methods included examinations of data, reviews of self-assessment or program improvement documents, and reviews of LEA policies and procedures.
Actions taken for Noncompliance beyond One YearThe majority of states addressed corrective action or improvement planning as a result of findings of noncompliance; however, only about 50% provided any specificity on what possible enforcement actions or sanctions would be imposed. For those SPPs that did include this information, the most frequently cited sanction was related to money. Other mechanisms were through the school approval or accreditation process, assignment of a specific education department contact or special consultant, and referral to the Attorney General’s office.
A possible explanation for why some states did not address this item is that for those states that reported 100% correction, they did not think it applicable. It seems from some of the narratives, that there was an interpretation of the measurement information “For any noncompliance not corrected within one year of identification, describe what actions, including technical assistance and/or enforcement the State has taken” that if noncompliance did not extend beyond a year, no explanation was needed.
General ObservationsAs is often the case hindsight provides insight. The SPP section heading and indicator both reference “general supervision.” In reading many of the SPPs, especially the overview or description of the process, there seemed to be an emphasis on on-site monitoring, rather than a description of the system of general supervision, meaning all the activities the state uses to supervise local education agencies. It was possible in some SPPs to infer more supervisory activities than were explicated. There were few SPPs, however, that provided a description of the general supervision system. The general sense after reading the SPP is that on-site monitoring is the only method of monitoring.
126
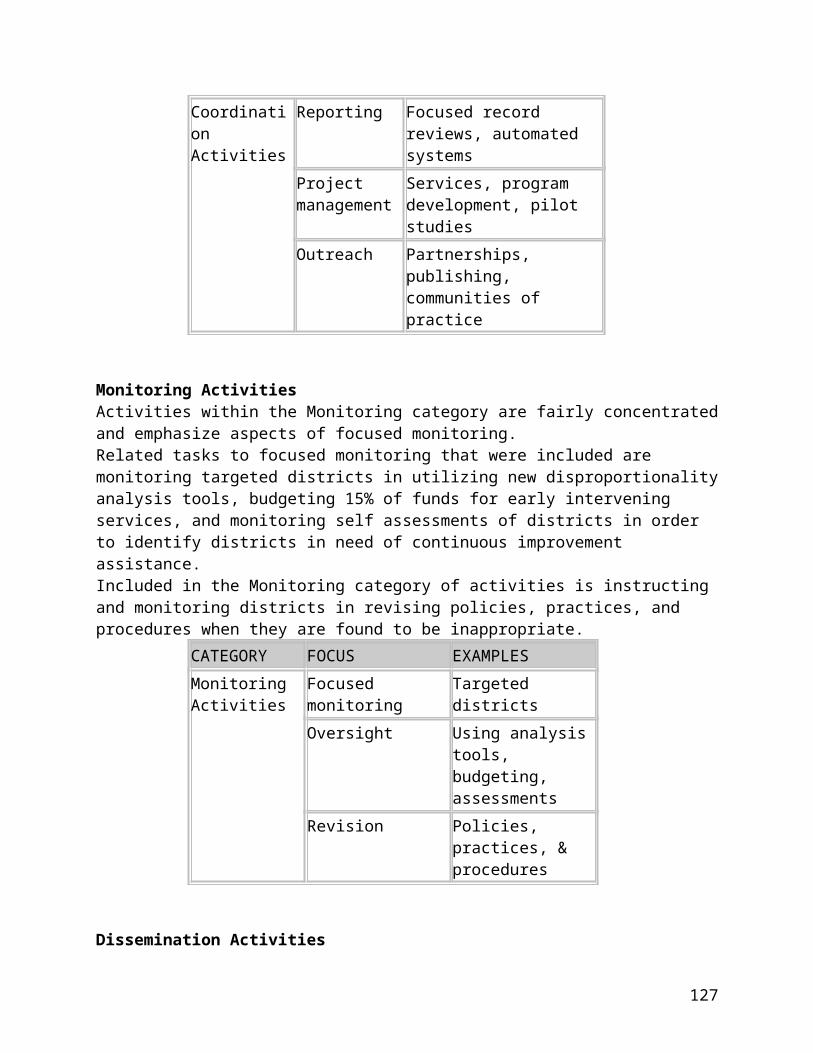
Improvement Activities/StrategiesIn reviewing the activities or strategies, in general, states listed items that emerged from the description, baseline, and need to reach the targets. There were, however, some states that did not include activities across the period of the SPP or did not seem to list improvement activities, instead they were continuation or maintenance activities, or were written in such broad terms that the emphasis for improvement was difficult to find.
It was noted in the section above on Actions Taken for Noncompliance beyond One Year, that there was often a lack of information on enforcement actions or sanctions. In reviewing the improvement strategies, several states included the development of these. Usually the activity was worded something similar to revise procedures to include appropriate guidelines for applying sanctions for noncompliance by LEAs. Notes were made of states that did not include clear descriptions of enforcement actions and did not include these in the improvement activities; more than 20% of the states did not have enforcement actions or activities for their development.
Below is a list of examples of some of the activities that seem to hold promise for consideration across states. (Some liberty has been taken to clarify or eliminate identifying information.)
Conduct validity and reliability studies of monitoring data collected to ensure more consistent results during the monitoring process.
Train monitoring staff on what needs to be evident for one year closeouts when systemic change (performance results) may not be evident in one year.
Conduct external third party evaluation of monitoring activities. Pursue development of a management table to track the various aspects of
compliance and performance through the general supervision system. Require technical assistance to all districts/agencies that are not close to
compliance by the eighth month of the corrective action plan. Explore effective practices beyond the priority areas, related to system change. Develop [name of state] resource list of research based practices organized by
SPP indicator Develop criteria to determine if LEA is in need of assistance, needs intervention,
or needs substantial intervention consistent with Section 616 of IDEA
127
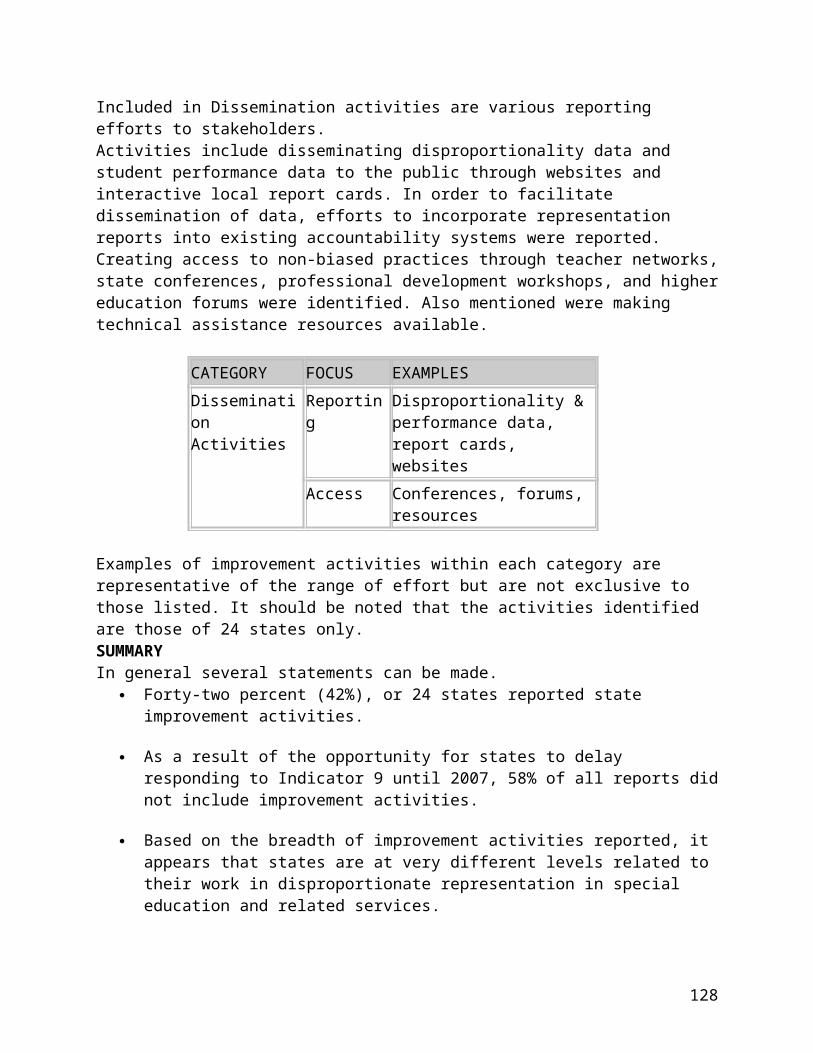
INDICATOR 16: COMPLAINT TIMELINESS
Timeliness in the Completion of Complaint InvestigationsCADRE, Richard Zeller and Aimee Taylor
This document summarizes indicator B-16 for Part B SPPs. The indicator is one of four dispute resolution indicators for Part B. Indicator B-16 is:
“Percent of signed written complaints with reports issued that were resolved within 60-day timeline or a timeline extended for exceptional circumstances
with respect to a particular complaint.”
Data necessary to calculate this indicator were included in Attachment 1 of the SPP for school year 2004-05 and have been included in the two previous Annual Performance Reports (2002-03 and 2003-04 school years). Measurement of this indicator is defined, with the label and cell designations from Attachment 1, as:
Percent = [(1.1(b) + 1.1(c)) divided by (1.1)] times 100
where,
(1.1)(b) = “Reports within timelines”(1.1)(c) = “Reports within extended timelines”
(1.1) = “Complaints with reports issued”
METHODOLOGY:
CADRE compiled and examined the Indicator 16 sections from the SPPs of all 50 states, DC, BIA, five outlying areas (AS, CNMI, GU, PR, VI), and the three Freely Associated States (FSM, ROP, RMI). For purposes of this report, these 60 entities are referred to in aggregate as “states.” Each state report was summarized to capture the following information:
Baseline reported for Indicator B-16 Number of years of data for Indicator B-16 reported in the SPP text Improvement/maintenance practices described (in many cases it is not possible
to distinguish improvement from maintenance) Assertions states made about the effectiveness of their complaints system Description of the “measurable and rigorous target” for Indicator B-16
Two or more reviewers read and compiled data for each of the above elements for each state. Reviewers entered the resulting summaries into an Excel data base, with a focus
128

on capturing in brief the language each state used. The authors of this document then coded these summaries in order to categorize improvement or maintenance strategies, assertions of effectiveness, and measurable and rigorous target descriptions.
SUMMARY AND ANALYSIS:
2004-05 School Year Baseline Reported for Indicator B-16
Fifty-six (56) states reported having one or more complaints during 2004-05. The total number of complaints reported by these states was 8,337; of these, 7,478 were completed “on time” (within 60 days or with an extended timeline), for a national rate of 89.7%. However, ten states report 80% of all complaints nationally; one state accounted for 58% of the national total. More than half of the 56 states reporting baseline values on this indicator indicated that they completed all complaints within 60 days or within an appropriately extended timeline. The following table displays the range of state rates of completion:
Indicator B-16 Value Reported Number of States Reporting<50% 3
50% - 75% 675% - 90% 6
>90% - <100% 10100% 31
Few states documented in the text of the SPP whether or not extensions were used to complete complaint investigations on time. Not all the data from Attachment 1 has not been completely verified as of the preparation of this summary. However, based on those states whose Attachment 1 data has been verified, it appears that nationally less than 15% of “on time” complaints involve the use of an extension. About one-third of states used extensions more than 20% of the time to achieve timely completion, but most states do not seem to make frequent use of extensions.
Number of Years of Data Reported in the SPP Text
The data necessary to calculate this performance indicator have been a part of the Annual Performance Report and now the SPP for three years. Dispute resolution activity varies considerably among Part B programs. The vast majority of states, however, did not report baseline data beyond the single year covered by this SPP (2004-05).
Eleven (11) states reported two or more years of data for this indicator; seven of these states reported three or more years. The trend information provided by these states varied, with some states showing improved on-time performance and others showing slippage. It was not the case that states with multiple years of data only displayed positive improvements. Some states have clearly used the trend data to help focus their efforts to improve future timeliness.
129
Improvement/Maintenance Practices Described
States varied widely in the level of practice descriptions they provided in the SPP. What states reported in the SPP is summarized here, although CADRE is aware of innovative and effective state practices that were not included in the SPPs. This summary is also limited by:
States differing in their willingness to report non-required activities in the SPP; Difficulty in distinguishing improvement from maintenance activities; Difficulty in finding the connection between apparent improved performance and
what the states see as their effective practices; Differing terminology (e.g., states use “train, develop personnel, provide TA/
support, conduct annual conference” to describe similar activities); Sketchiness and variability of report detail (e.g., “annual training” v. “30 hours of
mediation training & 24 hours IDEA update training”); States using a standard format for improvement activities; for 19 states,
improvement activities were the same for all indicators and differed, if at all, only in terminology (e.g., “hearing officer training” v. “mediator training”).
Because improvement strategies for many states followed a common format across dispute resolution indicators, the summary below lists types of improvement strategies and the number of states that included them in their SPPs under All Indicators and under Indicator B16:
Improvement “Strategies” All Indicators Indicator B-16 Training and Technical Assistance 53 32 Data collection and tracking systems 46 32 Review data & plan system changes 29 20 Guidance/public awareness materials 26 11 Satisfaction surveys and user feedback systems 23 2 PTI, stakeholders, and advisory Involvement 18 7 Assign or adjust FTE of staff as needed 11 4 Promote ADR options 26 13 Forms and templates to expedite processes 21 10
Most of the above activities would seem to be basic components of a state system. The absence of reporting, however, does not necessarily indicate an absence of activity. For states with integrated dispute resolution systems, redundancy across indicator reports might be inevitable, because the state sees different dispute resolution processes as closely related.
States use the terms training, technical assistance, personnel development, annual conference, etc., to designate activities with the same function. Many states list “training” without any further specification. Some states emphasized training in rights
130

and procedural safeguards, while others focused on specific communications skills and dispute resolution approaches. Several states indicated they were exploring web-based skills training approaches.
Many states list data collection and tracking systems and periodic performance reviews. These clearly overlapping functions focused in different states on tracking complaints timelines (with tickler systems), monitoring complaint investigator performance, ensuring the implementation of corrective actions, or identifying issues for improvements in the operation of the complaints system. Few states, however, report using participant satisfaction or feedback as a check on the effectiveness of the corrections in addressing parent concerns.
Common early dispute resolution processes supported through complaints processes were “early complaints resolution” periods. These typically involve time at the early stages of the complaint filing (e.g., 10 days to 2 weeks) for the parties to consider a face-to-face conference or a mediation to address the concerns. If settlement is reached through this approach, the filing party typically withdraws the complaint and agreed to changes in program are then implemented.
Assertions of Effectiveness Regarding the State’s Complaints System
Eight states asserted that their systems resulted in fewer complaints or that complaint investigations were completed on time because of particular improvement strategies. The connection between data on improved performance and these strategies was, at least, articulated. Common elements in these “effective strategies” include:
Electronic data tracking systems, with “ticklers” for key points in the process Forms/templates/processes for complaint filing (e.g., guides to parents), and
efficient communications with parties, documentation, etc. Prescreening processes to determine validity of complaint Additional and dedicated “expert” staffing (e.g., coordinator, attorney, paralegal) Training for investigators with an emphasis on timelines Strict/higher internal standards for investigation and reporting (e.g., 30 days) Standards for and documentation of any timeline extension Promotion and use of early resolution and alternative dispute resolution
processes (e.g., IEP facilitation, resolution facilitator, parent “navigators”)
Description of the “Measurable and Rigorous Target” for Indicator B-16
For almost all states, the target statement took this form: “100% resolved within 60-day timeline, or a timeline extended for exceptional circumstances.” A few states provided other targets. These included:
Providing adequate staffing and work distribution so that no complaint investigator had more than three complaints at any one time
Setting a higher standard for time to report completion (e.g., 30-35 days)
131
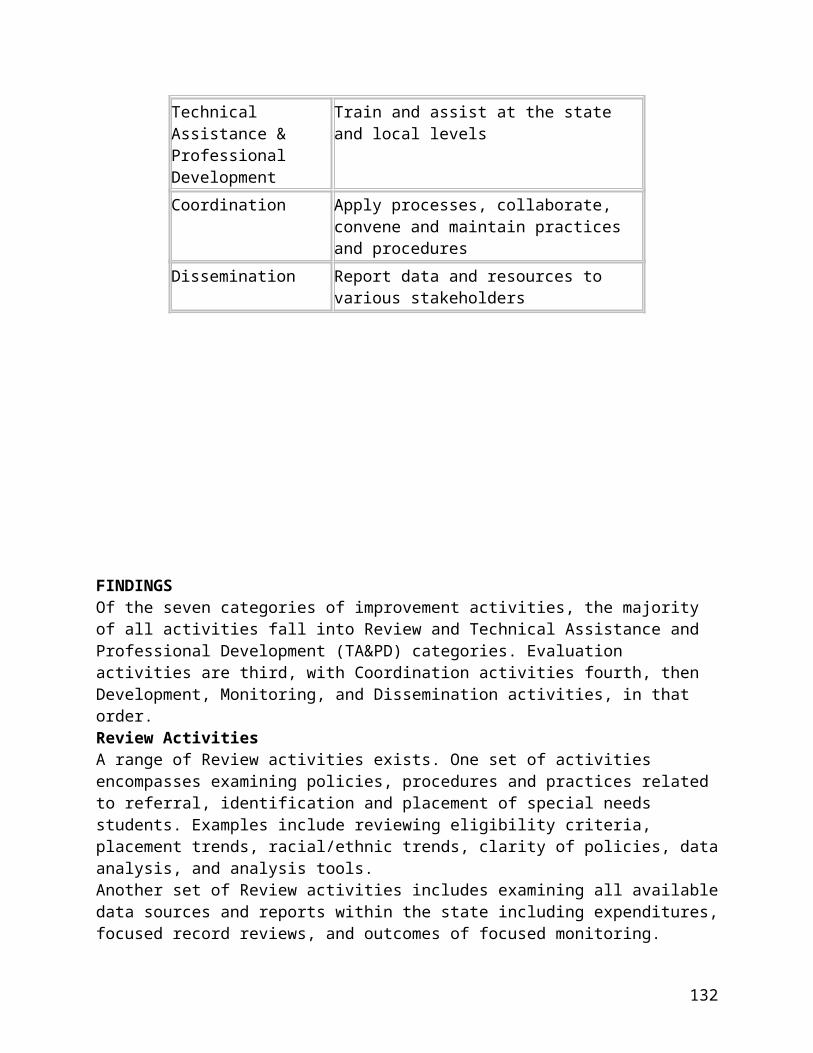
Reduce complaint filings and investigations by 3% per year Increase use of early resolution and alternative dispute resolution approaches
While Indicator B-16 must have a 100% goal, the effective management of a complaints system, in the context of broader dispute resolution, should involve other goals and indicators (e.g., increased use of alternative dispute resolution approaches, durability of corrective actions required through complaints). Most states were not explicit about what these other indicators were.
CADRE RECOMMENDATIONS FOR COMPLAINTS SYSTEMS
Improve the documentation and quality of data to support assertions about effective practices;
Establish and use performance indicators for all dispute resolution system management beyond the four required performance indicators;
Establish integrated dispute resolution data systems for formal complaints, due process, resolution sessions, mediations, other dispute resolution approaches, and for tracking of expressed parent concerns;
Support early and informal dispute resolution options (e.g., early complaint resolution, other early dispute resolution approaches prior to filing);
Provide training for staff and parents focused on dispute resolution options and effective collaborative working relationships;
Develop parent/provider surveys to measure awareness of DR options, understanding of rights, and satisfaction with special education services and dispute resolution processes.
132

INDICATOR 17: DUE PROCESS TIMELINESS
Timeliness in the Adjudication of Due Process HearingsCADRE, Richard Zeller and Aimee Taylor
This document summarizes indicator B-17 for Part B SPPs. The indicator is one of four dispute resolution indicators for Part B. Indicator B-17 is:
“Percent of fully adjudicated due process hearing requests that were fully adjudicated within the 45-day timeline or a timeline that is properly extended
by the hearing officer at the request of either party.”
Data necessary to calculate this indicator were included in Attachment 1 of the SPP for school year 2004-05 and have been included in the two previous Annual Performance Reports (2002-03 and 2003-04 school years). Measurement of this indicator is defined, with the label and cell designations from Attachment 1, as:
Percent = [(3.2(a) + 3.2(b)) divided by (3.2)] times 100
where,
(3.2)(a) = “[Hearing] Decisions within timeline”(3.2)(b) = “[Hearing] Decisions within extended timeline”
(3.2) = “Hearings (fully adjudicated)”
METHODOLOGY:
CADRE compiled the Indicator B-17 sections from the SPPs of all 50 states, DC, BIA, five outlying areas (AS, CNMI, GU, PR, VI), and the three Freely Associated States (FSM, ROP, RMI). For purposes of this report, these 60 entities are referred to in aggregate as “states.” Each state report was summarized to capture the following information:
Baseline reported for Indicator B-17 Number of years of data for Indicator B-17 reported in the SPP text Improvement/maintenance practices described (in many cases it is not possible
to distinguish improvement from maintenance) Assertions of effectiveness regarding the state’s due process hearings system Description of the “measurable and rigorous target” for Indicator B-17
Two or more reviewers read and compiled data for each of the above elements for each state. Reviewers entered the resulting summaries into an Excel data base, with a focus on capturing in brief the language each state used. The authors of this document then
133

coded these summaries in order to categorize improvement or maintenance strategies, assertions of effectiveness, and measurable and rigorous target descriptions.
SUMMARY AND ANALYSIS:
2004-05 School Year Baseline Reported for Indicator B-17
Fifty-two (52) states reported holding one or more “fully adjudicated” due process hearings in 2004-05 in the text of their SPP. Under this indicator, States reported 7,261 hearings held, with 6,783 of those being held with 45 days or an appropriately extended timeline, for an “on time” rate of 93%. The distribution of the values reported for this indicator for these 52 states are shown below:
Indicator B-17 Value Reported Number of States Reporting<50% 3
50% - >80% 880% - <100% 8
100% 33
Only about half a dozen states showed the full calculation for this indicator in the SPP text, but the breakdown of “on-time” performance is also reported in Attachment 1. While not all Attachment 1 data has been verified, CADRE has confirmed the accuracy of data from 44 of the 50 states (not including non-state entities). Most states appear to make extensive use of extensions in order to complete hearings on time; about three-fourths of the states in this verified sample used extensions in more than half their “on-time” hearings. The distribution of states by the % of their on-time hearings that were under extended timelines is displayed below:
% of On-Time Hearings that had Extended Timelines # States Reporting100% 9
80 - <100% 1150 - <80% 13
<50% 30% (w/in >50%) 4No hearings held 4
Total n = 44
Number of Years of Data Reported in the SPP Text
The data necessary to calculate this performance indicator has been a part of the Annual Performance Report and now the SPP for three years. Dispute resolution activity varies considerably (from none to some) among Part C states, and across years. The vast majority of states, however, did not report baseline beyond the single year covered by this SPP (2004-05).
134
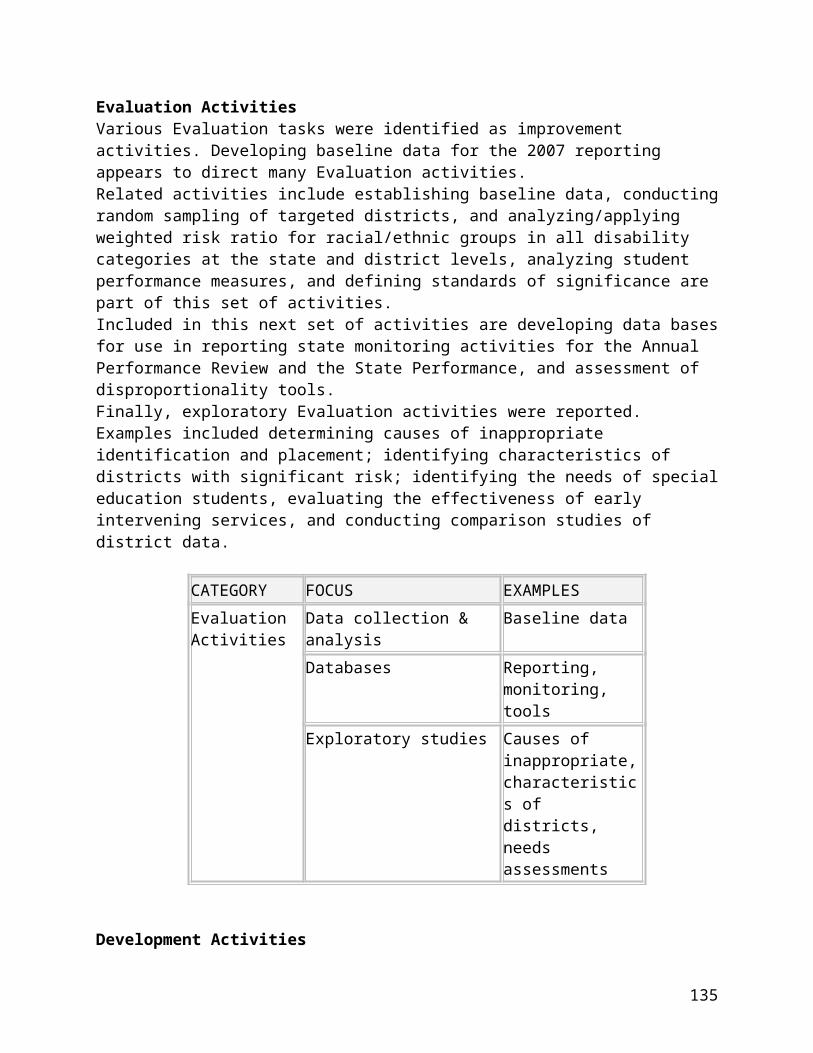
Only seven states reported two or more years of data for this indicator. These seven states account for only 40 hearings held in 2004-05 (out of 6,783 reported in the SPP texts). Of the 40, 24 were in one state. In other words, states with more active hearing systems tended to not report trend activity in their baseline on this indicator.
Improvement/Maintenance Practices Described
States varied widely in the level of practice descriptions they provided in the SPP. What states reported in the SPP is summarized here, although CADRE is aware of innovative and effective state practices that were not included in the SPPs. This summary is also limited by:
States differing in their willingness to report non-required activities in the SPP; Difficulty in distinguishing improvement from maintenance activities; Difficulty in finding the connection between apparent improved performance and
what they states see as their effective practices; Differing terminology (e.g., states use “train, develop personnel, provide TA/
support, conduct annual conference” to describe similar activities); Sketchiness and variability of report detail (e.g., “annual training” v. “30 hours of
mediation training & 24 hours IDEA update training”); States using a standard format for improvement activities; for 19 states,
improvement activities were the same for all indicators and differed, if at all, only in terminology (e.g., “hearing officer training” v. “mediator training”).
Because Improvement strategies for many states followed a common format across dispute resolution indicators, the summary below lists types of improvement strategies and the number of states that included them in their SPPs under All Indicators and under Indicator B16:
Improvement Strategies All Indicators Indicator B-17 Training and Technical Assistance 53 41 Data collection and tracking systems 46 28 Review data & plan system changes 29 15 Guidance/public awareness materials 26 12 Satisfaction surveys and user feedback systems 23 3 PTI, stakeholders, and advisory Involvement 18 5 Assign or adjust FTE of staff as needed 11 4 Promote ADR options 26 6 Forms and templates to expedite processes 21 8
Most of the above activities would seem to be basic components of a state system; the absence of reporting, then, does not necessarily indicate an absence of activity. Many states indicated “training” without further specification. The most frequently noted element of training for Hearing Officers was emphasis on timelines and proper use of extensions. In a number of states this was supported through ongoing review of timelines data, tickler systems, and sanctions for HOs who did failed to complete
135

hearings in a timely fashion (e.g., non-renewal of contracts). Other notable strategies for some states were the use of guides (forms, templates) for filing hearings and promotion of ADR options (pre-hearing conferences, now to be called “resolution sessions”, or mediation) as an alternative to filing a hearing request.
Assertions of Effectiveness Regarding the State’s Due Process Hearings System
CADRE identified assertions of effectiveness about the Due Process Hearings management systems in 10 states. In most cases, no specific data provided to support the assertion. In some states reporting trend data, change or improvement was attributed to the strategies previously adopted to address problems of timeliness. Among the approaches described as “effective” in helping to meet timelines were:
Train hearing officers and enforce timeline requirements Structure process so that the HO is responsible for timelines (e.g., immediate HO
assignment, with the HO contacting parties regarding calendar) Ensure adequate staffing, including coordination of the hearings system Tracking system for hearing process, with ticklers built into alert HOs Standards/guidance/model for use of extensions
While the connection between these strategies and data showing their effectiveness was sometimes scant, they do appear to be reasonable strategies to improve timely completion of the hearings process.
Description of the “Measurable and Rigorous Target” for Indicator B-17
For most states, the target statement took this form: "100 percent of fully adjudicated due process hearing requests will be fully adjudicated within the applicable time frame." Only two states provided any other “targets” in this area beyond the required “100%” compliance with required timelines. In these two states, other indicators were noted, including decreasing the use of hearings and increasing alternate methods of dispute resolution, and collecting and using data on an ongoing basis to manage the hearings process. It seems likely that many states also share these goals, though few articulate them in the SPP.
CADRE RECOMMENDATIONS FOR DUE PROCESS HEARINGS SYSTEMS
Improve the documentation and quality of data to support assertions about effective practices;
Provide guidance/standards/formats for documenting and justifying extensions of hearing timelines;
Establish and use performance indicators for all dispute resolution system management beyond the four required performance indicators;
Establish integrated dispute resolution data systems for formal complaints, due process, resolution sessions, mediations, other dispute resolution approaches, and for tracking of expressed parent concerns;
136
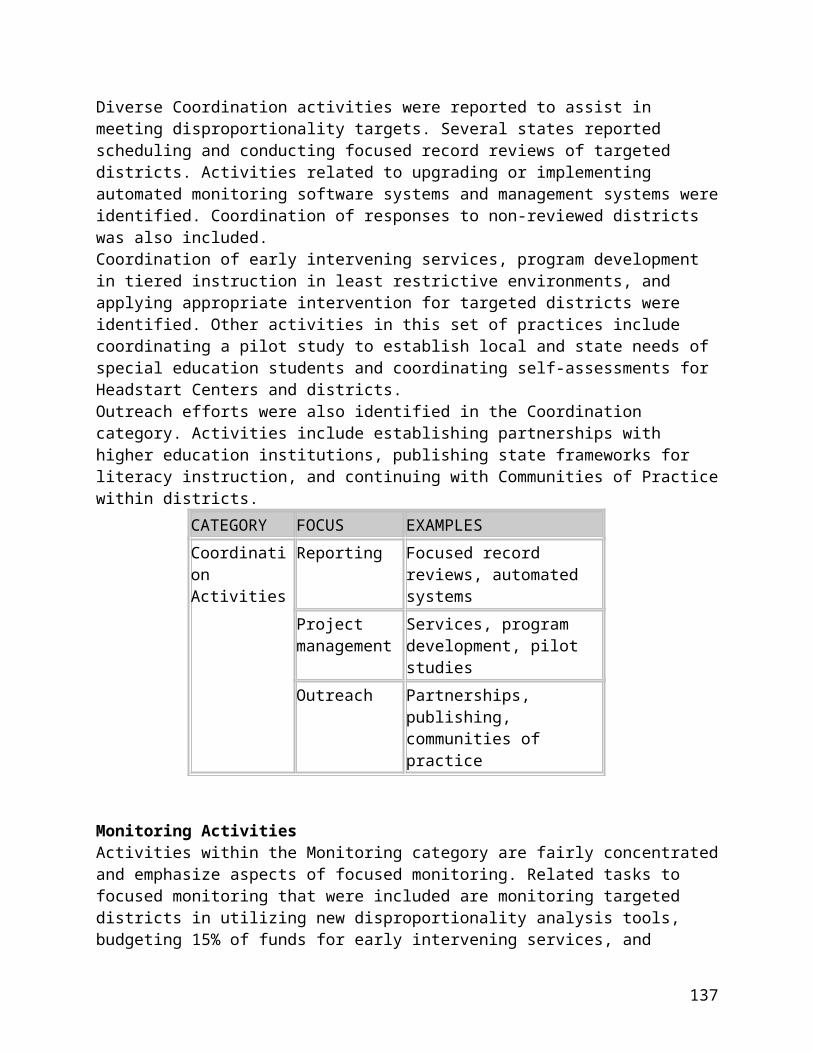
Support early and informal dispute resolution options (e.g., guidance on how to facilitate an effective resolution session, other early resolution/pre-filing processes);
Train hearing officers on effective hearings, timelines, IDEA legal updates; Develop parent/provider surveys to measure awareness of DR options,
understanding of rights, and satisfaction with special education services and dispute resolution processes.
137
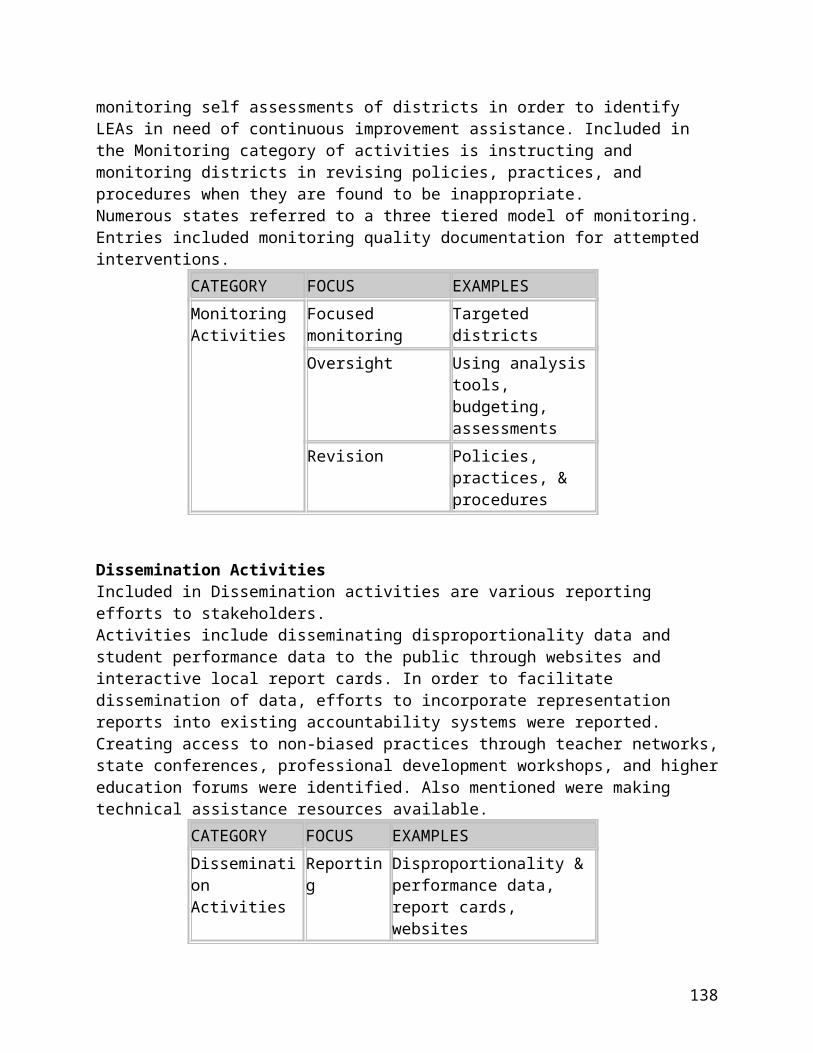
INDICATOR 18: EFFECTIVENESS OF RESOLUTION SESSIONS
Effectiveness of Resolution Sessions in Reaching Settlement AgreementsCADRE, Richard Zeller and Aimee Taylor
This document summarizes indicator B-18 for Part B SPPs. This indicator is one of four potential dispute resolution indicators for Part B. Indicator B-18 is:
“Percent of hearing requests that went to resolution sessions that were resolved through resolution session settlement agreements.”
This is a new requirement under IDEA 04, effective July 1, 2006. As a result, data necessary to calculate this indicator were not included in Attachment 1 of the SPP for school year 2004-05. The first year of data (2005-06 school year) and the establishment of baselines for this indicator will be reported in the Annual Performance Report due February 1, 2007. Measurement of this indicator is defined, with the label and cell designations from Attachment 1, as:
Percent = [3.1(a) divided by (3.1)] times 100.
where,
(3.1)(a) = [resolution session] “Settlement agreements”(3.1) = “Resolution sessions” [held]
METHODOLOGY:
CADRE compiled the Indicator B-18 sections from the SPPs of all 50 states, DC, BIA, five outlying areas (AS, CNMI, GU, PR, VI), and the three Freely Associated States (FSM, ROP, RMI). For purposes of this report, these 60 entities are referred to in aggregate as “states.” Each state report was summarized to capture the following information:
Baseline reported for Indicator B-18 Improvement/maintenance practices described (in many cases it is not possible
to distinguish improvement from maintenance) Description of the “measurable and rigorous target” for Indicator B-18
Two or more reviewers read and compiled data for each of the above elements for each state. Reviewers entered the resulting summaries into an Excel data base, with a focus on capturing in brief the language each state used. The authors of this document then coded these summaries in order to categorize improvement or maintenance strategies, assertions of effectiveness, and measurable and rigorous target descriptions.
138
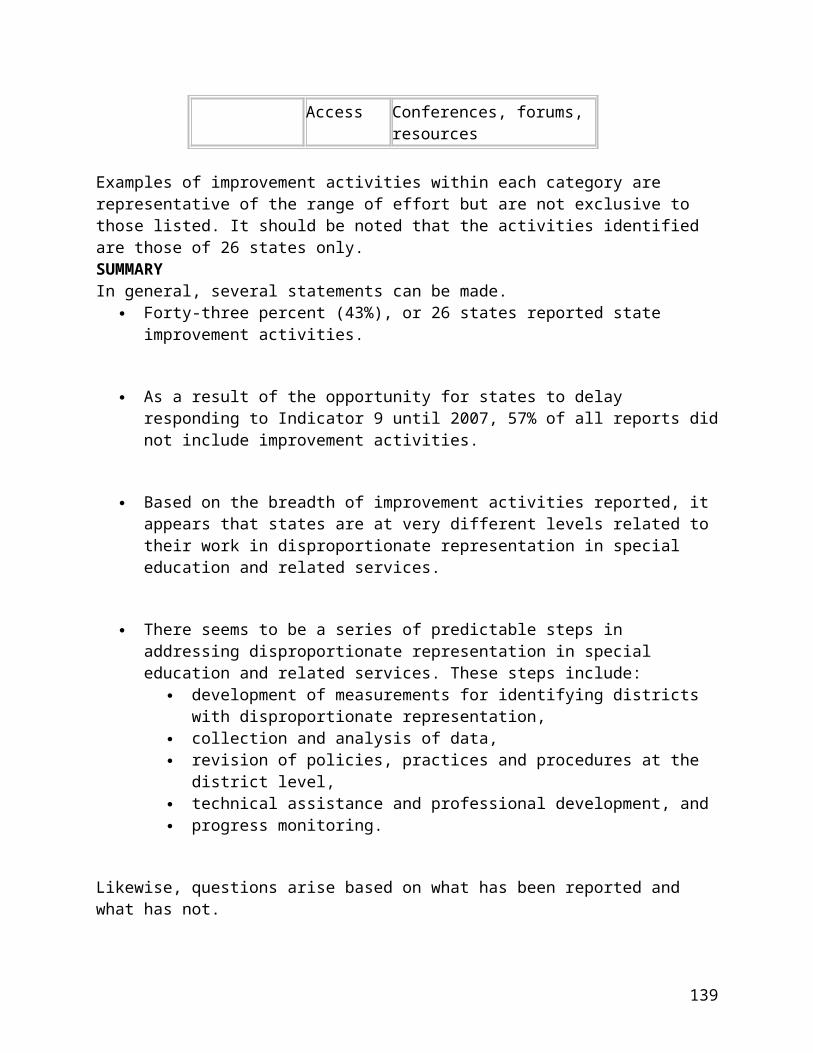
SUMMARY AND ANALYSIS:
Baseline to be Reported for Indicator B-18
No states reported baseline for this indicator, although a few states make reference to the successful use of “informal settlement conferences,” or “reconciliation conferences” as processes that have been available in their states previously. In addition to creating several new data reporting elements, the formalization of the “resolution session” in IDEA 04 may add a new dimension in the options schools and parents have in dealing with conflict. In some states, it will name and formalize some existing practices. Except for a few states that did not include anything on this indicator, almost all states said that they would begin data collection as of July 1, 2005.
Improvement/Maintenance Practices Described
This indicator is new and the requirement to collect data on resolution sessions did not take effect until July 1, 2005. As a result, “improvement strategies” listed by 26 states that included them were really “implementation strategies” for the new requirement. Below are the types of improvement strategies and the number of states that included them in their SPPs under All Indicators and under Indicator B18:
Improvement “Strategies” All Indicators Indicator B-18 Training and Technical Assistance 53 11 Data collection and tracking systems 46 22 Review data & plan system changes 29 7 Guidance/public awareness materials 26 4 Satisfaction surveys and user feedback systems 23 3 PTI, stakeholders, and advisory Involvement 18 4 Assign or adjust FTE of staff as needed 11 0 Promote ADR options 26 1 Forms and templates to expedite processes 21 9
Because the resolution session must be convened by the local district, many states do not see a staffing responsibility in this area. In some cases, states noted under indicator 17 (hearing timeliness) that they were assigning responsibility for tracking and reporting on resolution sessions to the hearing officer. Clearly, most states are awaiting clarification in the final regulations, but some are proceeding to provide guidance to LEAs in how to conduct an effective resolution session. Many states indicated that they will add resolution session data to their tracking system, but only a handful specified the data to be collected and who would actually collect it. Several states indicated they will provide training to local staff in how to conduct an effective resolution session, and a handful of states indicated they will train “facilitators” to assist in conducting effective resolution sessions. The coming year will hold opportunities to make the resolution session an effective element of a states dispute resolution system.
Description of the “Measurable and Rigorous Target” for Indicator B-18
139
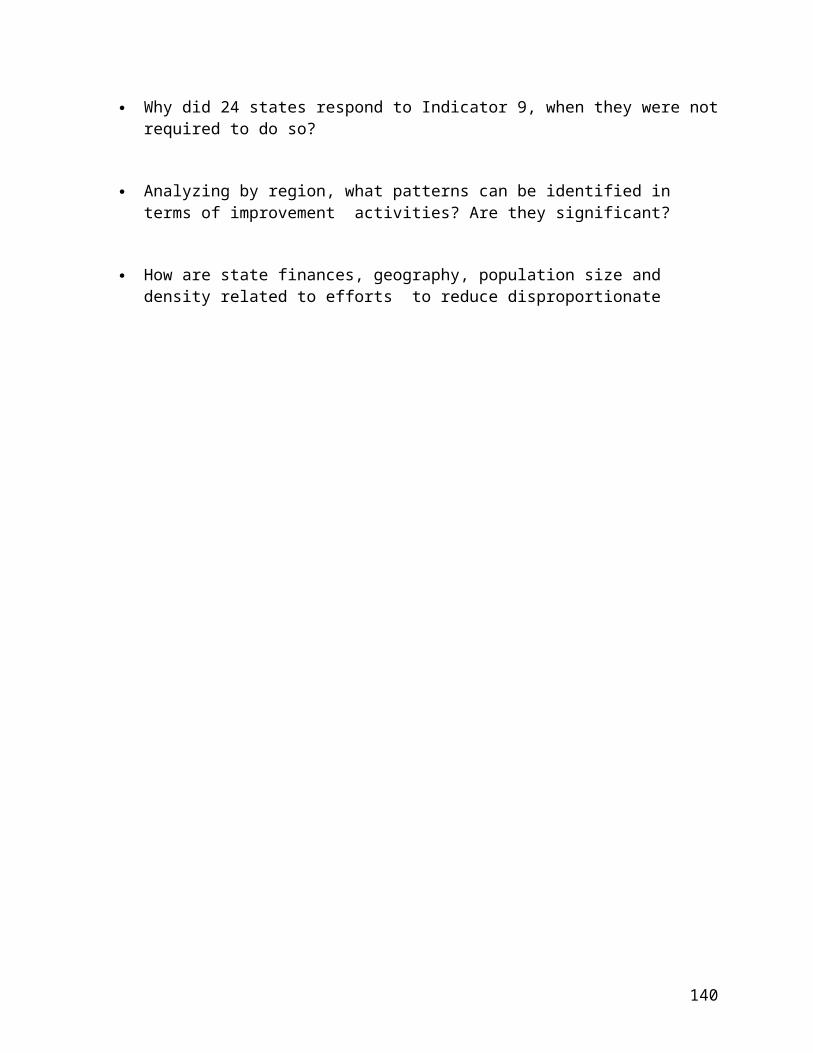
Almost all states indicated that a target was not yet applicable, because they have not collected any baseline data yet. States will report baseline data in and set targets for this indicator in their first APR due February 1, 2007.
Two states reported from past experience that “conciliation conferences” or “informal settlement” conferences had been effective in resolving disputes prior to hearings. Other states might consider any informal data they have on due process requests resolved without hearing as an indicator of past experience as they set targets in the 2005-06 APR.
CADRE RECOMMENDATIONS FOR INDICATOR B-18
Improve the documentation and quality of data to support assertions about effective practices;
Establish and use performance indicators for all dispute resolution system management beyond the four required performance indicators;
Establish integrated dispute resolution data systems for formal complaints, due process, resolution sessions, mediations, other dispute resolution approaches, and for tracking of expressed parent concerns;
Establish procedures to ensure that LEAs meet timelines for “convening” resolution sessions and that data on the sessions and any resulting settlement agreements are provided by the SEA;
Support other early and informal dispute resolution options (e.g., 48 hour response to expressed parent concerns, facilitated IEPs for complex issues);
Train staff and parents with a focus on dispute resolution options and effective collaborative working relationships, whether in resolution sessions or in other venues;
Develop parent/provider surveys to measure awareness of DR options, understanding of rights, and satisfaction with special education services and dispute resolution processes.
Consider establishing data collection systems that will support good management of resolution sessions systems, including:
o Resolution session heldo # days from filing that the session was heldo Resolution settlement agreement finalized and issues addressedo # days from filing that the agreement was reachedo Use of 3 day period to rescind agreement and by which partyo Issues agreed to in settlement agreemento Whether any issues in the original due process filing proceed to hearing or
are otherwise unresolvedo Resolution process elements (use of facilitator, participants)
140

INDICATOR 19: MEDIATION AGREEMENTS
Effectiveness of Mediation in Reaching Mediation AgreementsCADRE, Richard Zeller and Aimee Taylor
This document summarizes indicator B-19 for Part B SPPs. The indicator is one of four dispute resolution indicators for Part B. Indicator B-19 is:
“Percent of mediations held that resulted in mediation agreements.”
Data necessary to calculate this indicator were included in Attachment 1 of the SPP for school year 2004-05 and have been included in the two previous Annual Performance Reports (2002-03 and 2003-04 school years). Measurement of this indicator is defined, with the label and cell designations from Attachment 1, as:
[(2.1(a)(i) + 2.1(b)(i)) divided by (2.1)] times 100.
where,
(2.1(a)(i) = “Mediations [held] related to due process”(2.1(b)(i) = “Mediations [held] not related to due process”
(2.1) = “Mediations [held]”
METHODOLOGY:
CADRE compiled the Indicator B-19 sections from the SPPs of all 50 states, DC, BIA, five outlying areas (AS, CNMI, GU, PR, VI), and the three Freely Associated States (FSM, ROP, RMI). For purposes of this report, these 60 entities are referred to in aggregate as “states.” Each state report was summarized to capture the following information:
Baseline reported for Indicator B-19 Number of years of data reported in the SPP text Improvement/maintenance practices described (in many cases it is not possible
to distinguish improvement from maintenance) Assertions of effectiveness regarding the state’s mediation system Description of the “measurable and rigorous target” for Indicator B-19
Two or more reviewers read and compiled data for each of the above elements for each state. Reviewers entered the resulting summaries into an Excel data base, with a focus on capturing in brief the language each state used. The authors of this document then
141

coded these summaries in order to categorize improvement or maintenance strategies, assertions of effectiveness, and measurable and rigorous target descriptions.
SUMMARY AND ANALYSIS:
2004-05 School Year Baseline reported for Indicator B-19
Seven states report having no mediations or agreements. Of the 53 states reporting mediation agreement rates, 7 states report 100% agreement rates, but in only two of these states were there ten or more mediations. The range of mediation rates for all 60 states is shown below.
Mediation Rate Reported Number of States Reporting(No mediations or agreements) 7
100% 785% - <100% 975% - <85% 1460% - <75% 16
<50% 7
In the text of the SPPs, the 53 states report a total of 7,295 mediations, resulting in 5,382 agreements (for a 74% national rate of agreement). The 12 most active states also have an average 74% agreement rate together, with a total of 82% of all the mediation activity nationally. The distinction between mediations related to due process and those not so related will await a complete analysis of the Attachment 1 data. Most states did not comment on these two measures in the text portion of the SPP.
Number of Years of Data Reported in the SPP Text
The data necessary to calculate this performance indicator has been a part of the Annual Performance Report and now the SPP for three years. Most states did not report baseline beyond the single year covered by this SPP (2004-05). It is hard to determine, from the SPPs alone, whether mediation activity has increased or decreased over time.
Fifteen (15) states reported two or more years of data for this indicator, with 14 of them reporting three or more years. Many of these states used the mutli-year data to highlight trends in mediation use and agreement rate over time. States reported multiple years of data on this indicator more often than on any of the other SPP dispute resolution indicators.
Improvement/Maintenance Practices Described
States varied widely in the level of practice descriptions they provided in the SPP. What states reported in the SPP is summarized here, although CADRE is aware of innovative and effective state practices that were not included in the SPPs. This summary is also limited by:
142

States differing in their willingness to report non-required activities in the SPP; Difficulty in distinguishing improvement from maintenance activities; Difficulty in finding the connection between apparent improved performance and
what the states see as their effective practices; Differing terminology (e.g., states use “train, develop personnel, provide TA/
support, conduct annual conference” to describe similar activities); Sketchiness and variability of report detail (e.g., “annual training” v. “30 hours of
mediation training & 24 hours IDEA update training”); States using a standard format for improvement activities; for 19 states,
improvement activities were the same for all indicators and differed, if at all, only in terminology (e.g., “hearing officer training” v. “mediator training”).
Because Improvement strategies for many states followed a common format across dispute resolution indicators, the summary below lists types of improvement strategies and the number of states that included them in their SPPs under All Indicators and under Indicator B19:
Improvement “Strategies” All Indicators Indicator B-19 Training and Technical Assistance 53 39 Data collection and tracking systems 46 21 Review data & plan system changes 29 6 Guidance/public awareness materials 26 12 Satisfaction surveys and user feedback systems 23 18 PTI, stakeholders, and advisory Involvement 18 7 Assign or adjust FTE of staff as needed 11 5 Promote ADR options 26 14 Forms and templates to expedite processes 21 2
Most of the above activities would seem to be basic components of a state system. The absence of reporting, however, does not necessarily indicate an absence of activity. For states with integrated dispute resolution systems, redundancy across indicator reports might be inevitable, because the state sees different dispute resolution processes as closely related.
States use the terms training, technical assistance, personnel development, annual conference, etc., to designate activities with the same function. Many states list “training” without any further specification. Some states emphasized training in rights and procedural safeguards, while others focused on specific communications skills and dispute resolution approaches. Several states indicated they were exploring web-based skills training approaches.
While training, technical assistance and data collection feature prominently among mediation related Improvement strategies, in this arena states are more likely than in other dispute resolution areas to stress guidance/public awareness, satisfaction
143
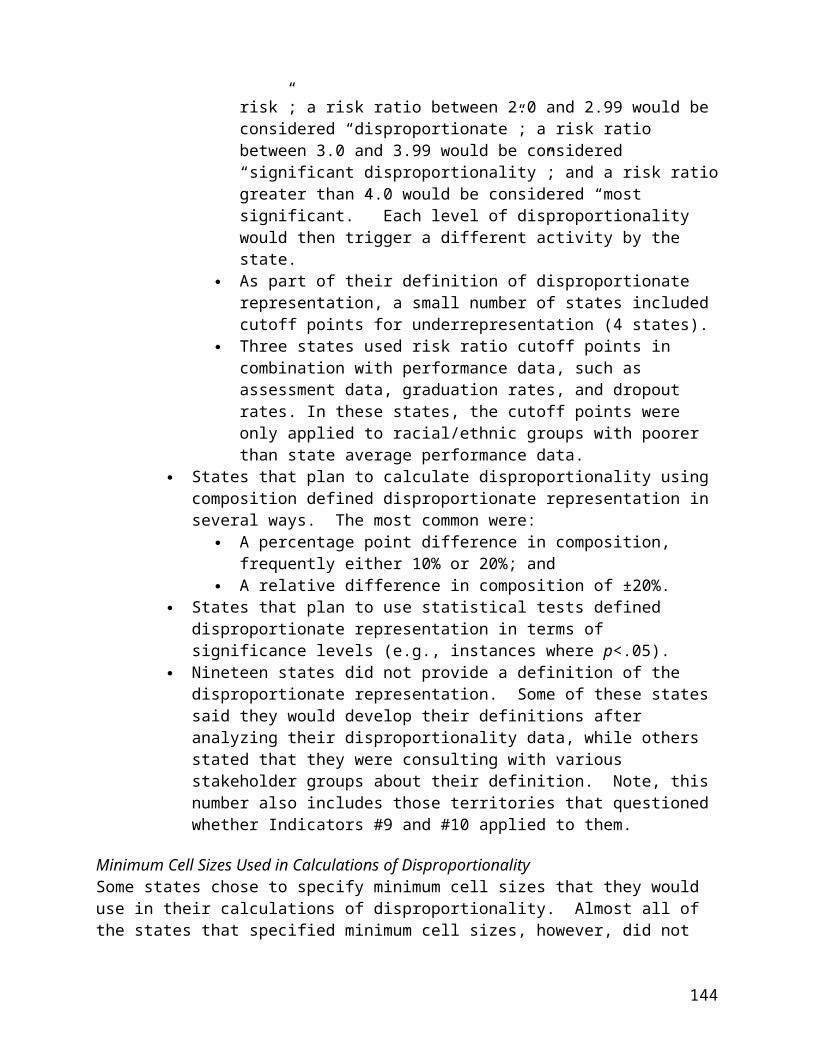
surveys, stakeholder involvement, and promotion of alternate dispute resolution. In some cases, these strategies appear across dispute resolution functions perhaps because states see the dispute resolution system as a whole and want to promote more collaborative dispute resolution in general. In other states, however, there is a tendency to limit these more cooperative orientations to the “mediation system.” It is difficult to tell whether this reflects differences in state practice and management, or reflects something else (e.g., that the SPPs were written by different staff).
Common early dispute resolution processes supported include training in communications and negotiation skills, a focus on conflict prevention, informal systems for the expression and attention to parent concerns, active PTI support for training on and promotion of ADR and mediation approaches.
Assertions of Effectiveness Regarding the State’s Mediation system
CADRE identified assertions of effectiveness about the mediation and other dispute resolution systems in 12 states. Specific data supporting the assertion were rarely provided, but more often in this area states say that parent and district satisfaction data support the effectiveness of their efforts. Among the effective practices states identified were the following:
Increase fast resolution of conflict: several states arrange mediation sessions or IEP facilitation on an accelerated timeline (e.g., a mediation session within 5 days of request and agreement within two weeks);
Increase mediation use through training, promotion of the positive results of mediation to parents and districts, in some cases with PTI collaboration;
Increase the rate of mediation agreements through specific skills training for mediators, training for parents and districts, careful tracking of agreement rates, and use of satisfaction surveys and monitoring data to inform mediation.
Description of the “Measurable and Rigorous Target” for Indicator B-19
Forty-seven (47) Part B states indicated a target(s) for mediation agreement rates. In most cases, these targets represent a starting rate (frequently the same as the current year’s agreement rate) and the highest (usually final) agreement rate for 2010-2011 school year. The lowest starting rate among the states was 15% (the current agreement rate for that state) and the highest starting rate was 100% (in six states this was the target for all six years). Only two other states set the same agreement rate across years (less than 100%), although several states set slightly increasing rates (by as little as a fraction of 1% increase per year).
7 states set no target, indicating that no target is required for <10 mediations 4 states set targets as percentage increases per year 2 states set same ranges across the six years 6 states set target at 100% 42 states set target ranges, generally in the range from 70% to 90% agreement
144
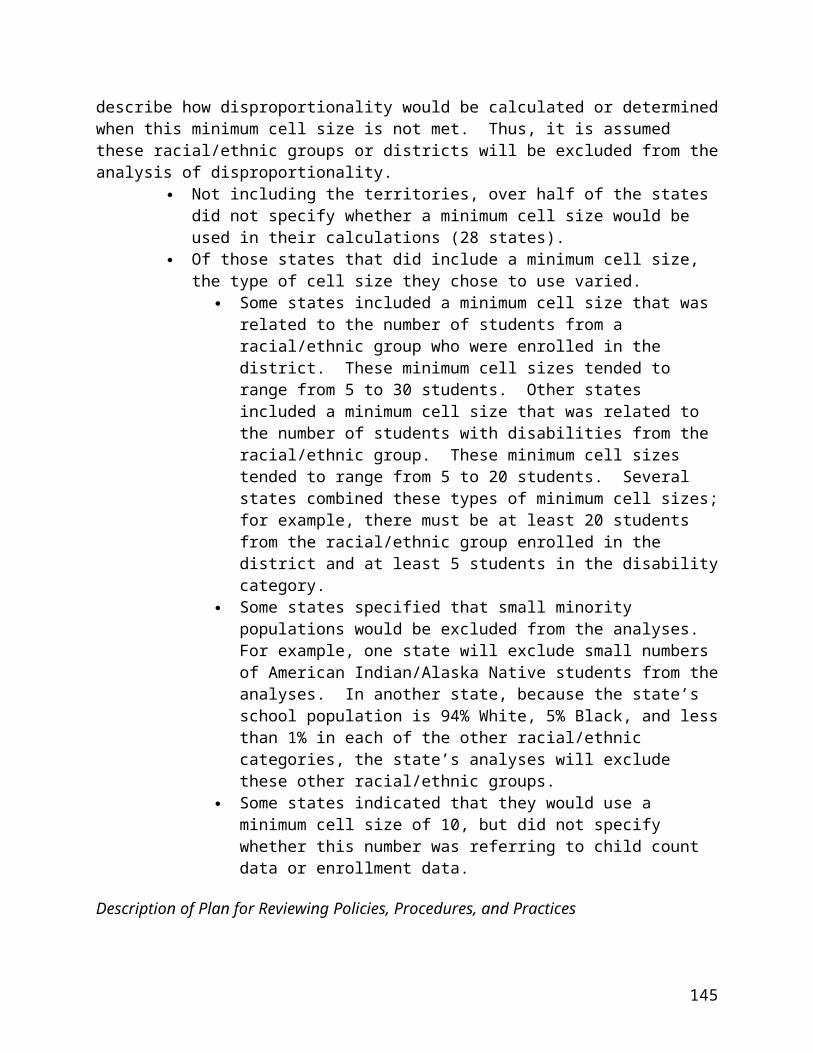
The rates that seem most common (about two thirds of the states) vary from about 70% to 90%. For many states this will represent modest increases compared to current agreement rates. This range is comparable to what CADRE has found to be the normal rates of agreement in other areas of mediation. There is a concern that setting a very high rate for agreements (e.g., 100%) could introduce coercion into the process by the mediator, especially if the mediator’s job performance is judged on the basis of agreement rate achieved. This will remain an active topic of discussion among the states.
CADRE RECOMMENDATIONS FOR INDICATOR B-19
Improve the documentation and quality of data to support assertions about effective practices;
Establish and use performance indicators for all dispute resolution system management beyond the four required performance indicators;
Establish integrated dispute resolution data systems for formal complaints, due process, resolution sessions, mediations, other dispute resolution approaches, and for tracking of expressed parent concerns;
Support early and informal dispute resolution options (e.g., accelerated access to mediation, response to informally expressed parent concerns, facilitated IEPs for complex issues);
Provide training for staff and parents focused on dispute resolution options and effective collaborative working relationships;
Provide guidance to mediators, local providers and families on how to improve the quality and durability of mediation agreements;
Provide focused skills training for mediators: addressing the dynamics of mediation, listening and communication skills, interest-based mediation, techniques to avoid impasse, and writing clear and complete mediation agreements;
Develop parent/provider surveys to measure awareness of DR options, understanding of rights, and satisfaction with special education services and dispute resolution processes;
Specific training on procedural safeguards, mediation skills, dispute resolution options, and collaborative decision making seem critical if are to avoid more contentious and formal dispute resolution options.
145

INDICATOR 20: STATE REPORTED DATA
Summary of Westat’s Analysis of the Part B SPP Indicator 20
Part B Accuracy
Indicator #20: State reported data (618 and State Performance Plan and Annual Performance Report) are timely and accurate.
Measurement of this indicator was defined in the SPP requirements as: State reported data, including 618 data and annual performance reports, are: … (b) Accurate (describe mechanisms for ensuring accuracy).
Westat reviewed all of the SPPs for the 50 states, DC and 9 outlying areas. (For purposes of this discussion, we will refer to all as states, unless otherwise noted.) Our analysis focused on 4 accuracy principles and 16 critical elements supporting the principles. These principles were developed in conjunction with OSEP, using various ED and Westat documents. If states implement these principles and elements systematically, data accuracy will be enhanced. It should be noted that states did not have these critical principles and elements before they prepared the 2004-05 SPP.
PRINCIPLE #1: Data Collection: State has a data collection plan that includes policies and procedures for collecting and reporting accurate Section 618 and SPP/APR data.
Critical Element 1:Clear straightforward data collection instruments are used.
None of the 60 states reported on this element.
Critical Element 2: Data collection instruments are designed to collect valid and reliable data that accurately reflect reality/practice1.
None of the 60 states reported on this element.
Critical Element 3: A data dictionary containing written definitions of key terms is made available to all data providers through a variety of media.
6 states reported having database or technical assistance manuals containing a data dictionary. Two of these states reported posting their manuals on the state website.
14 states reported having users manuals, bulletins or handbooks, but none of them described these documents as having a data dictionary containing written definitions of key terms.
1 Data satisfy the requirements of their intended use and are consistent across school/district/state databases or Part C program/regional/state databases.
146

Critical Element 4: If sampling is used, a technically sound sampling plan is utilized and implemented.
1 state reported on this element and included a detailed sampling plan.
Critical Element 5: Guidance, training and ongoing technical assistance/support are provided to all data providers (including data entry personnel) on a regular basis and are evaluated for effectiveness.
37 states reported providing guidance, training and ongoing technical assistance/support to data providers in a variety of formats and timeframes. Although the states reported that training was provided to a variety of data providers, only 2 of these 37 states reported providing training specifically to data entry personnel.
None of the 37 states described any evaluation of the effectiveness of guidance, training and technical assistance/support.
Critical Element 6: Data providers are regularly consulted in the development of data policies and procedures.
6 states reported meeting and consulting with data providers in the development of data policies, procedures and database system changes.
PRINCIPLE #2: Data Editing and Validation: State has procedures in place for editing and validating data submitted by data providers.
Critical Element 7: Electronic data edits are in place that include: (a) data definition edits (i.e. What values are put in what fields); (b) out-of-range edits; (c) cross-field or relationship edits on child-level and aggregate-level data; (d) historical or year-to-year edits; (e) double-checks of counts with 10% differences from previous report(s) (except as small numbers prevent doing so); and (f) checks to ensure that all entities provide data.
26 states reported using edit and/or error checks to verify the accuracy of their data. Although these states reported the use of edit/error checks, none of them described the edits outlined in this critical element.
Critical Element 8: Large changes or unusual findings are discussed with primary data providers to determine if errors in data collection or reporting occurred.
19 states reported having methods and procedures for discussing large changes or unusual findings with data providers. Some of these methods included monitoring, “curious” data faxes and verification reports.
147

Critical Element 9: Regular reviews/monitoring of programs/public agencies practices in collecting, editing, and reporting data are conducted that include: (a)
verification of data validity and reliability; (b) checks to show that data at all levels match from the district or Part C program database to the state database; and (c) assessment of whether or not definitions and time periods are followed.
None of the 60 states reported on this element.
PRINCIPLE #3: Data Reporting: State has procedures for reporting data quality problems with findings.
Critical Element 10: SPP, APR, and Section 618 data are made available to the public in user-friendly formats.
10 states reported making data available to the public on state websites. However, it was unclear whether this public reporting included the SPP, APR and 618 data in all cases.
2 states reported posting only the statewide assessment on their websites. It was unclear whether they also posted data on the SPP, APR and 618.
Critical Element 11: Limitations of the reported data are clearly explained in all reports.
None of the 60 states reported on this element.
PRINCIPLE #4: System Management and Documentation: State has system management policies and procedures for maintaining the integrity of the data collection and reporting system.
Critical Element 12: Written documentation for collecting, reviewing and reporting data exists and is regularly updated.
1 state reported on this element.
Critical Element 13: Data reports and related supporting documents are retained for 3 years.
None of the 60 states reported on this element.
Critical Element 14: A formal, written contingency plan is maintained for IDEA data management information functions.
None of the 60 states reported on this element.
148

Critical Element 15: Barriers are identified that impede the State’s ability to accurately and reliably collect and report 618 data and SPP/APR data.
14 states reported barriers that impede the state’s ability to accurately and reliably collect 618 and SPP/APR data. Some of these barriers included incompatibility with the state’s Student Accountability Information System (SAIS), need for extensive modification to existing data management systems to add the new requirements of the SPP, personnel vacancies, and general education data collections and timelines differ from special education data collection requirements.
Critical Element 16: A plan is in place that addresses identified barriers and improve the data being collected.
26 states reported plans or activities to either address identified barriers or enhance their ability to collect and report data. These strategies included hiring new personnel, piloting new data systems, upgrading existing information management systems, adding a focused monitoring verification report and developing web-based systems.
Part B Timeliness
Indicator #20: State reported data (618 and State Performance Plan and Annual Performance Report) are timely and accurate.
Measurement of this indicator was defined in the SPP requirements as: State reported data, including 618 data and annual performance reports, are: (a) Submitted on or before due dates (February 1 for child count, including race and ethnicity, placement and November 1 for exiting, discipline, personnel, and February 1 for Annual Performance Reports);…
Westat reviewed all of the SPPs for the 50 states, DC and 9 outlying areas. (For purposes of this discussion we will refer to all as states, unless otherwise noted.) First, our analysis focused on whether states met the OSEP due dates for the Section 618 data. Where possible, this was done for each individual data collection. (Note that this could not be done for some states because they only indicated that their data were submitted on time.) Second, we compared state reports of timeliness with Westat’s receipt logs for the 618 data. Third, we noted whether states’ APRs were submitted on the due date with and without extensions. We did not examine the timeliness of states’ SPPs as OSEP informed us that all SPPs had been received by the due date or with approved extensions.
Results
Forty-four states reported that their Section 618 data were submitted on time; 15 states reported they did not submit their data on time. One state did not provide information in its SPP on the timeliness of its 618 data. Eight states reported their data were timely, but Westat’s records indicated that one or more of their submissions were not timely.
Forty-seven states reported that their APRs were submitted on time without an OSEP extension. Three states indicated that they submitted their APRs on time with an extension from OSEP. One state noted that its APR submission was not timely, but it did not note that an
149
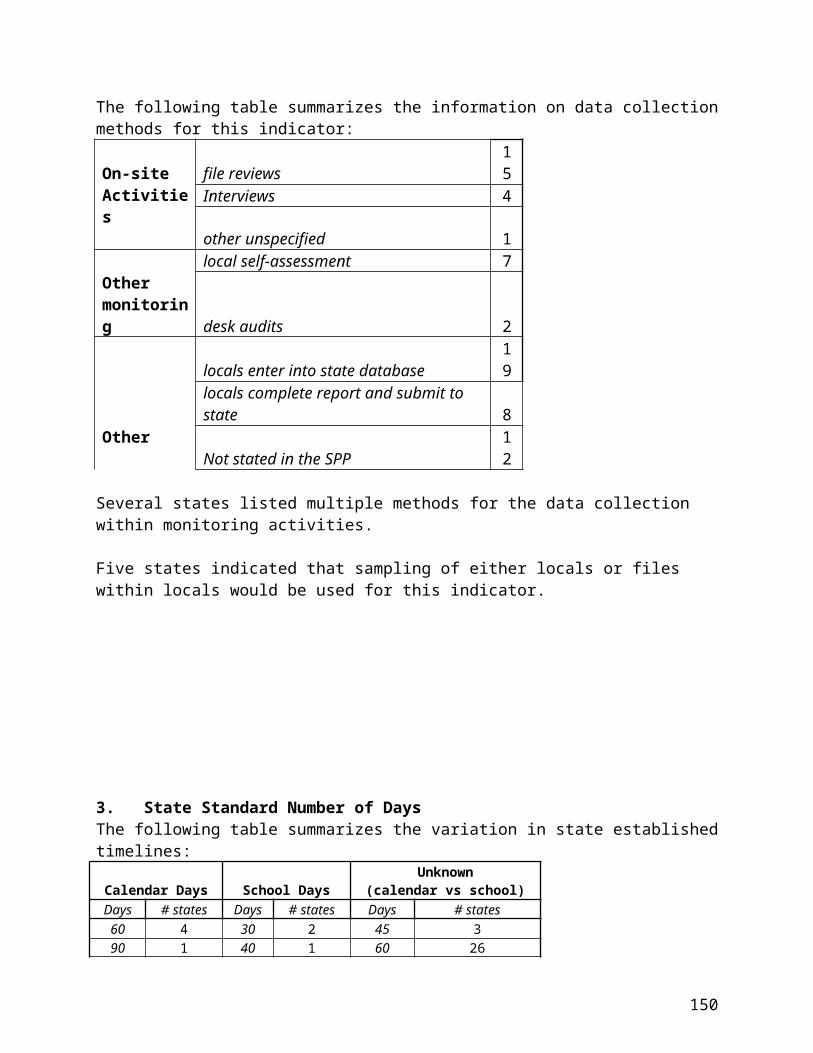
extension had been granted. Nine states provided no information in their SPPs concerning the timeliness of their APRs.
150