indicator approach to develop a chemosensor for the … · · 2011-02-28indicator approach to...
TRANSCRIPT
Supplementary Material (ESI) for Analyst This journal is (C) The Royal Society of Chemistry 2011
Indicator approach to develop a chemosensor for the
colorimetric sensing of thiol-containing in water and its
application for the thiol detection in plasma
Fang-Jun Huo,a Yu-Tao Yang,b Jing Su,b Yuan-Qiang Sun,a Cai-Xia Yin,* bXu-Xiu Yanb aResearch Institute of Applied Chemistry andbKey Laboratory of Chemical Biology and Molecular Engineering of Ministry of Education, Institute of Molecular Science, Shanxi University, Taiyuan
030006, China.
Figure S1 : Choice of pH-range for the Measurement
Figure S2: The experiments of UV-vis spectrophotometer titration for Cu2+: XO
Figure S3: The determination of the stoichiometry for Cu2+:Cys using the experiments
of UV-vis Spectrophotometer Titration
Figure S4: Data of Absorbance for the ensemble of Cu2+-XO-Cys
Figure S5: Other amino acids do not affect on Cys detection
Figure S6: The color change photograph for Cys and other amino acids
Figure S7: Excluded various anions interfering to determination of Cys
Figure S8: Choice of metal ions Part I
Figure S9: Choice of metal ions Part II
Figure S10: The binding constants
Figure S11: Xylenol orange changes its color from yellow to red due to the solution pH
change with a conversion point at pH≈6.3 (yellow when pH<6.3 and red
while pH>6.3)
Figure S12: A detection of Homocysteine (Hcy) with Cu2+-XO ensemble
Figure S13: The color picture of aminothiols from plasma
Supplementary Material (ESI) for Analyst This journal is (C) The Royal Society of Chemistry 2011
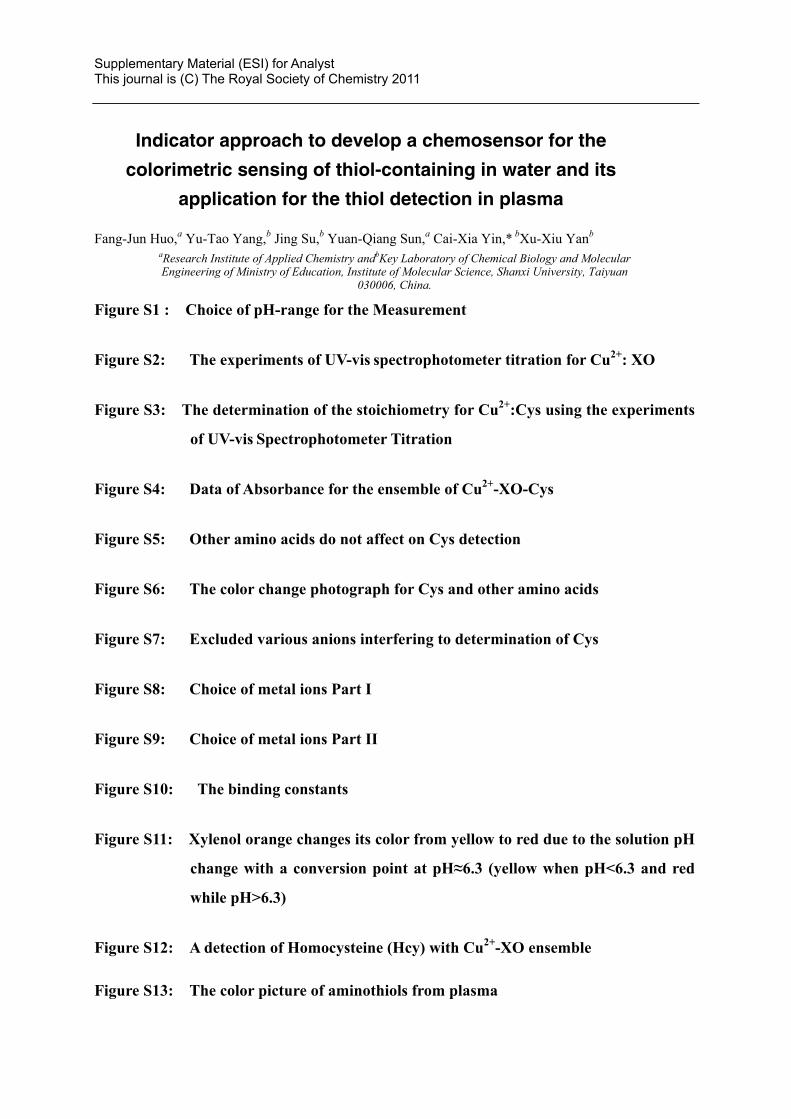
Figure S1 Choice of pH-range for the Measurement.
The absorbance under various pH values. These black lines represent the absorbance of XO (25 μM), red ones are the absorbance of [Cu(XO] (25 μM, XO + 25 μM CuCl2), and the green ones the absorbance of the ensemble when 80 μM Cys was added into the solution of [Cu(XO] (25 μM). The pH (5.0-8.0) of the buffers (10 mM HEPES) was adjusted with 5 M NaOH or 6 M HCl.

Supplementary Material (ESI) for Analyst This journal is (C) The Royal Society of Chemistry 2011
Figure S2 The experiments of UV-vis spectrophotometer titration for Cu2+: XO
Figure S3 To determine the coordination ratio of Cu2+ to Cys. Cys was added to the solution of Cu2+-XO (25 μM) in HEPES (10 mM) buffer.
Supplementary Material (ESI) for Analyst This journal is (C) The Royal Society of Chemistry 2011
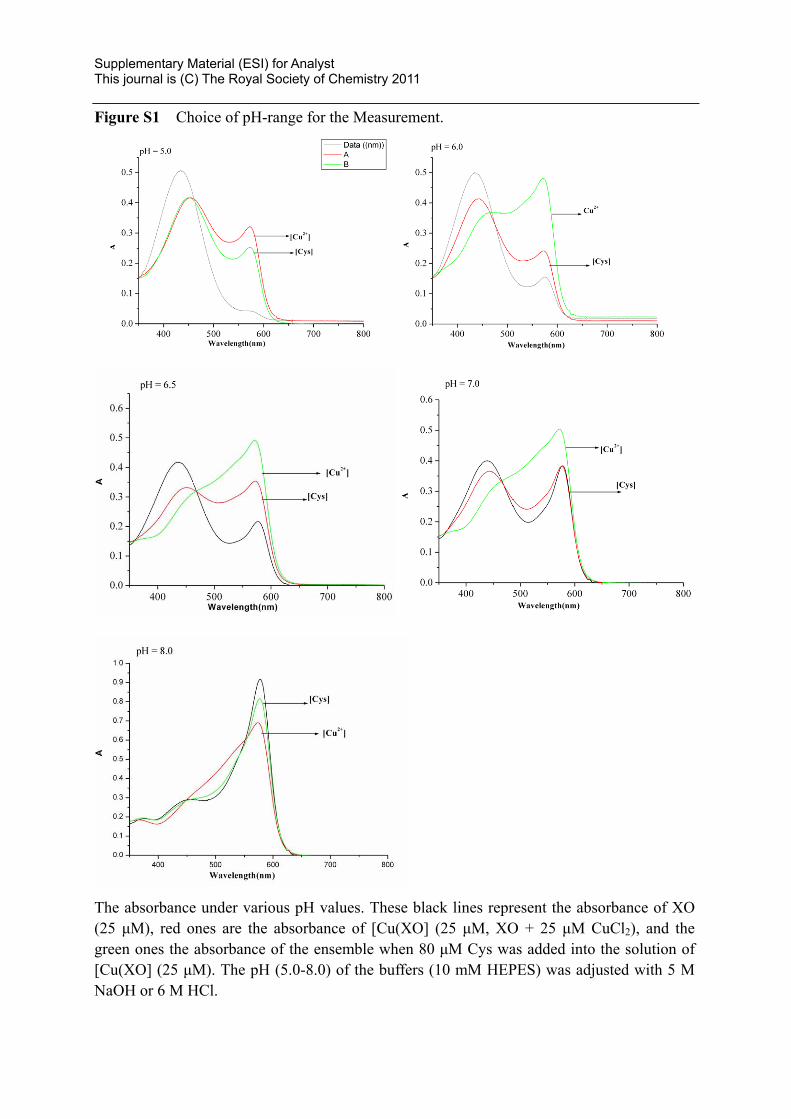
Figure S4 Dada of Absorbance for the Ensemble of Cu2+-XO-Cys
The working curve for Cys measurement (Figure S4) was plotted with the absorbance value against various concentrations of Cys ( 12, 24, 48, 96, 192 μM) (Table S1). The average of ε is 6350 L·mol-1·cm-1. Base a hypothetic equation: A=Kc+B. These data was analyzed using the software OriginPro 7.0.
Table S1 Conc. of Cys / μM Absorbance
12.0 0.1274 24.0 0.2634 48.0 0.3952 96.0 0.7436
192.0 1.2811
Plot the absorbance value against total concentrations of Cys. Dots are experiments data, the
curve is best fit with linear regression R^2=0.9953

Supplementary Material (ESI) for Analyst This journal is (C) The Royal Society of Chemistry 2011
Figure S5 A color change photograph for Cys and other amino acids
Only cysteine causes the color change from violet-red to yellow. Concentrations: Cu2+-XO (25 μM); [Cys]=100 μM; [other amino acids] = 5000 μM. Figure S6 Other amino acids do not affect Cys.
UV/Vis spectra of the [Cu(XO)] mixture (25 μM in a pH 6.0, 10 mM HEPES buffer solution) was added with various other amino acids 5000 μM and Cys 100 μM in final concentration.

Supplementary Material (ESI) for Analyst This journal is (C) The Royal Society of Chemistry 2011
Figure S7 Excluded various anions interfering to determination of Cys

Supplementary Material (ESI) for Analyst This journal is (C) The Royal Society of Chemistry 2011
Figure S8 Cd2+, Zn2+, Ca2+, Ni2+, Mn2+, Co2+, Pb2+, Yb3+, Tb3+, Eu3+, Ce3+, Nd3+ ions (metal ions Part I).

Supplementary Material (ESI) for Analyst This journal is (C) The Royal Society of Chemistry 2011
UV/Vis spectrophotometry showed that other metal ions could not play the same sensor-role for the assay. These metal ions can lead XO indicator color change from yellow to purple-red and give rise to UV-vis spectra variation, however, their XO ensembles were incapable of detecting Cys based on the above facts that the systems had almost not any response to adding Cys in UV-vis spectra.
Supplementary Material (ESI) for Analyst This journal is (C) The Royal Society of Chemistry 2011
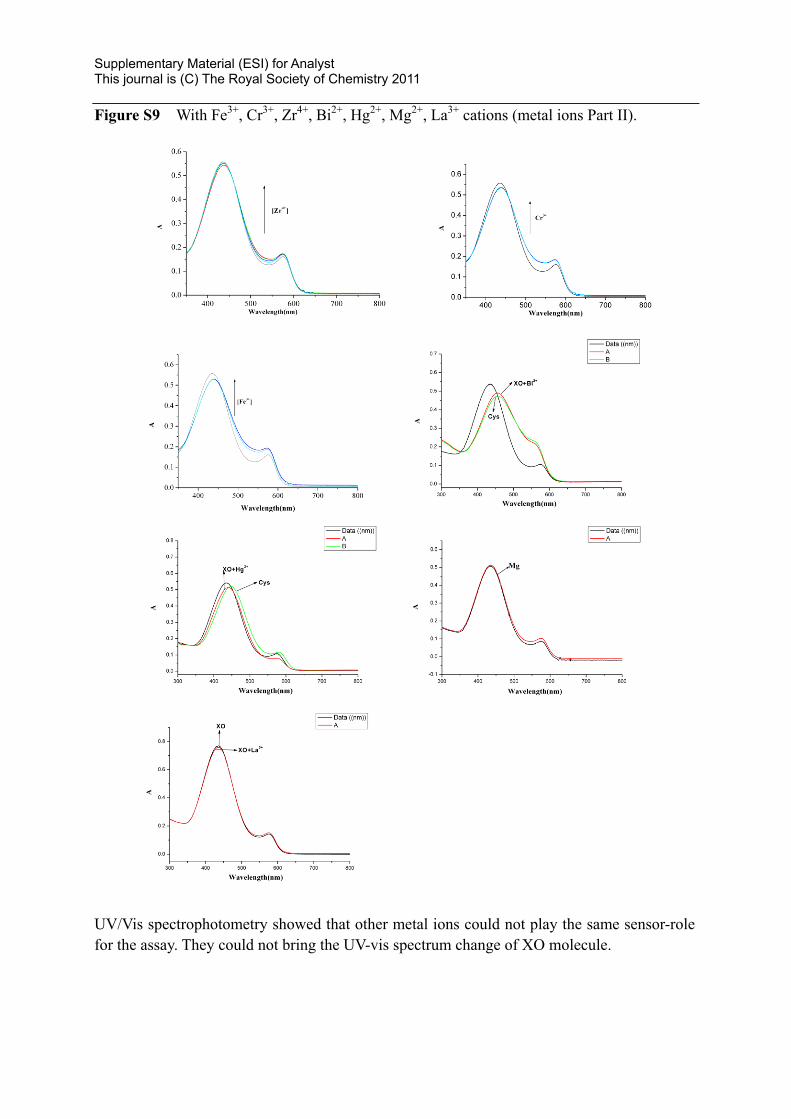
Figure S9 With Fe3+, Cr3+, Zr4+, Bi2+, Hg2+, Mg2+, La3+ cations (metal ions Part II).
UV/Vis spectrophotometry showed that other metal ions could not play the same sensor-role for the assay. They could not bring the UV-vis spectrum change of XO molecule.
Supplementary Material (ESI) for Analyst This journal is (C) The Royal Society of Chemistry 2011
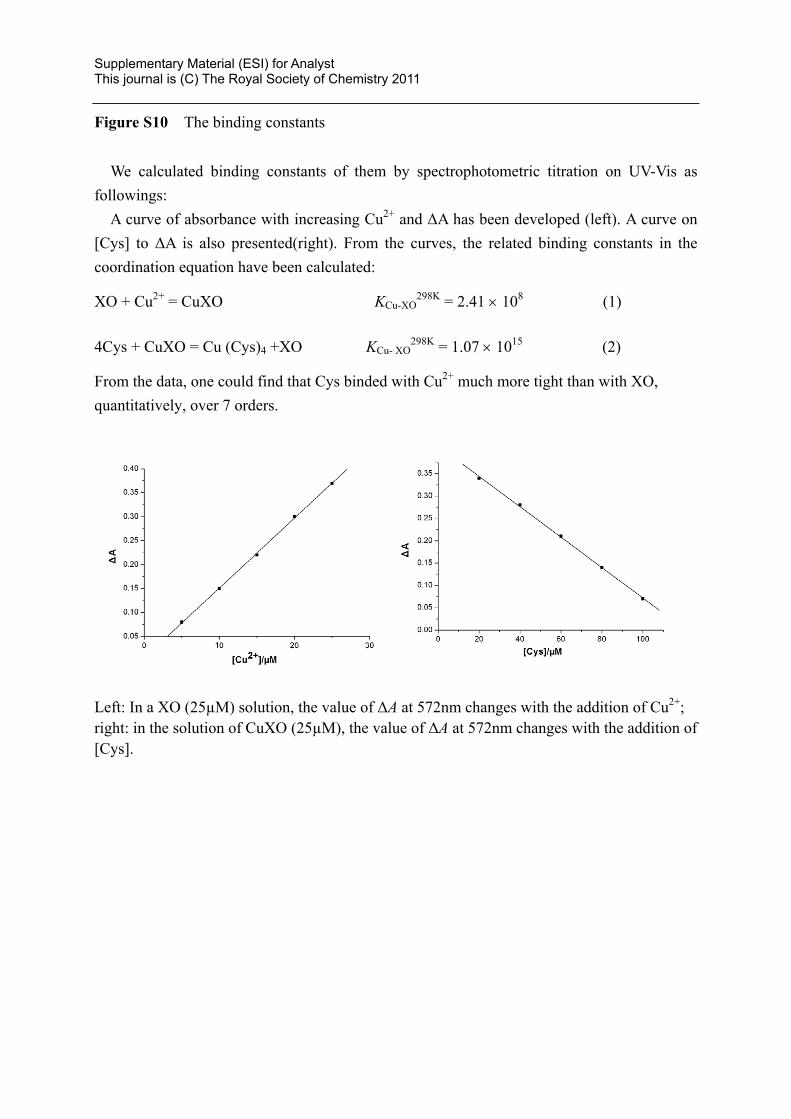
Figure S10 The binding constants
We calculated binding constants of them by spectrophotometric titration on UV-Vis as followings:
A curve of absorbance with increasing Cu2+ and ΔA has been developed (left). A curve on [Cys] to ΔA is also presented(right). From the curves, the related binding constants in the coordination equation have been calculated:
XO + Cu2+ = CuXO KCu-XO298K = 2.41 × 10⁸ (1)
4Cys + CuXO = Cu (Cys)4 +XO KCu- XO298K = 1.07 × 10¹⁵ (2)
From the data, one could find that Cys binded with Cu2+ much more tight than with XO, quantitatively, over 7 orders.
Left: In a XO (25µM) solution, the value of ΔA at 572nm changes with the addition of Cu2+; right: in the solution of CuXO (25µM), the value of ΔA at 572nm changes with the addition of [Cys].

Supplementary Material (ESI) for Analyst This journal is (C) The Royal Society of Chemistry 2011
Figure S11 Xylenol orange changes its color from yellow to red due to the solution pH
change with a conversion point at pH≈6.3 (yellow when pH<6.3 and red while pH>6.3)

Supplementary Material (ESI) for Analyst This journal is (C) The Royal Society of Chemistry 2011
Figure S12 A detection of Cu2+-XO for Homocysteine (Hcy) by UV-vis spectra and
naked-eye.
The UV-vis spectral changes of Cu2+-XO (25 μM) upon addition of Hcy [final concentration:
0, 40, 80, 120, 160, 200, 240, 280, 320, 360, 400, 440, 480, 500 μM]
The Hcy detection color changes picture of different concentrations based on Cu2+-XO (25
μM) system

Supplementary Material (ESI) for Analyst This journal is (C) The Royal Society of Chemistry 2011
Figure S13 The color picture of aminothiols from plasma.