indices of social development launch 16 march 2011 roberto foa arjan de haan irene van staveren...
TRANSCRIPT

Indices of Social Development
Launch 16 March 2011
Roberto FoaArjan de Haan
Irene van StaverenEllen Webbink
Herman Hardenbol

Contents
Why social development indices ? Arjan de Haan
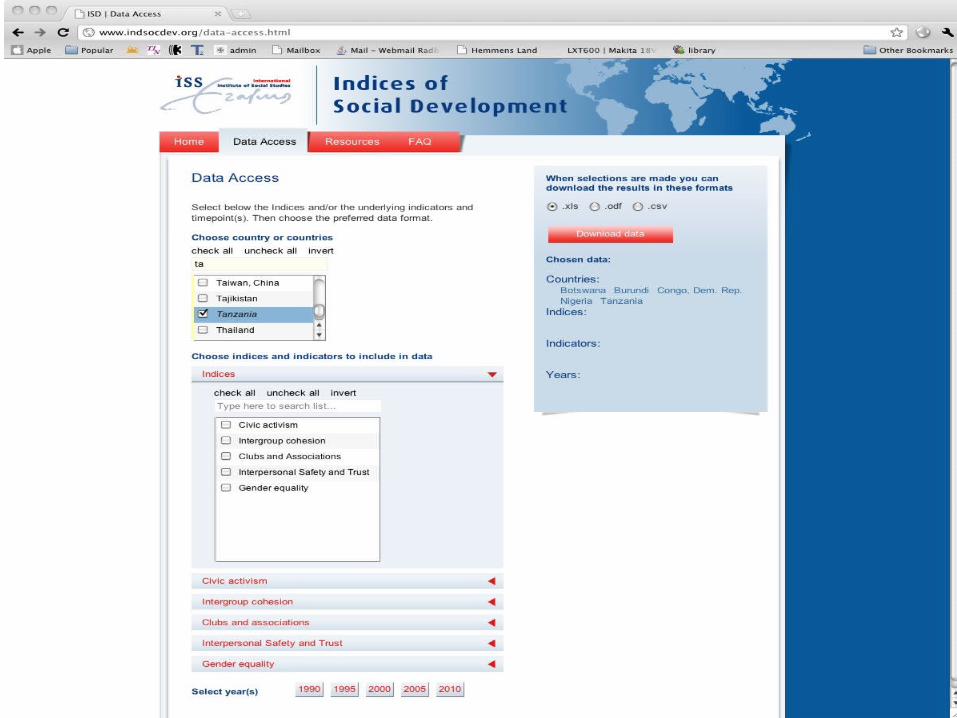
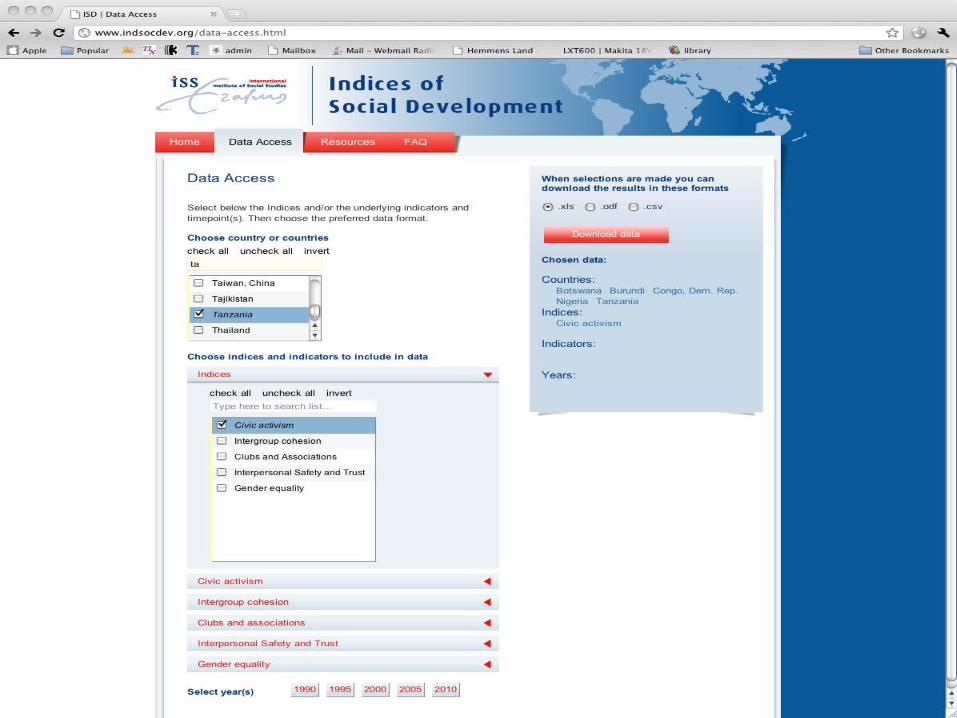
IndSocDev.org – a demonstration Ellen Webbink
How the indices are composedIrene van Staveren
Examples of applicationsIrene van Staveren
Questions and comments
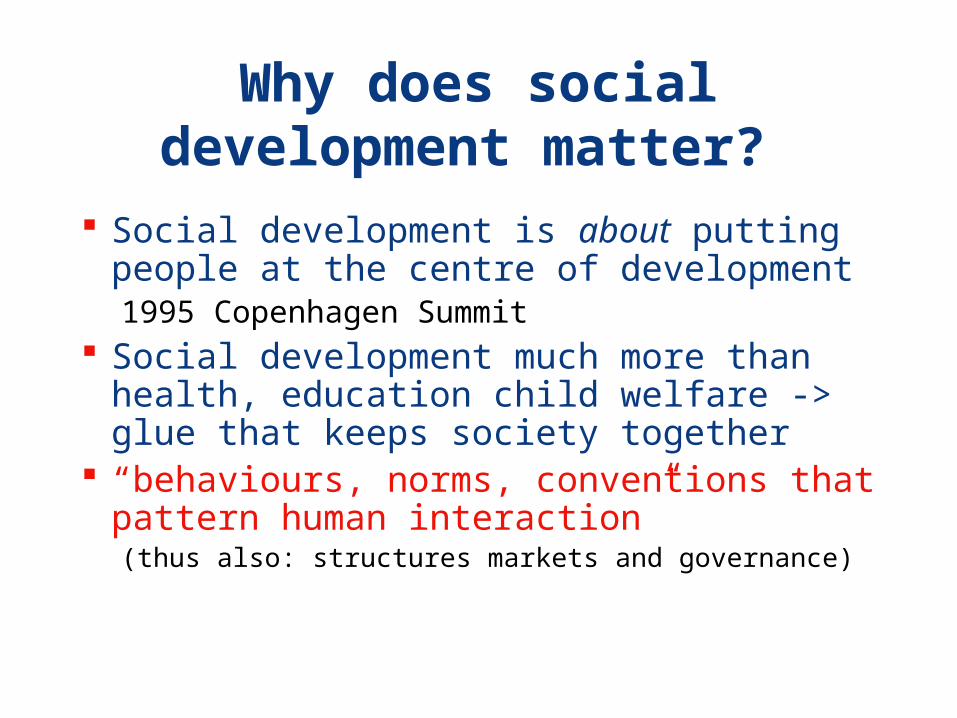
Why does social development matter?
Social development is about putting people at the centre of development 1995 Copenhagen Summit
Social development much more than health, education child welfare -> glue that keeps society together
“behaviours, norms, conventions that pattern human interaction”(thus also: structures markets and governance)

Why should we measure it ? Social development usually terrain of more qualitative
methods and disciplines Measurements of development have been broadening:
steel, GDP, HDI, Governance, happiness SocDevInd = last mile in this sequence The promise:
- systematise and compare different aspects of social development
- relate those to other development outcomes
- trends over time

What did we decide to measure
Design on basis of iterative process of expert discussions + comparison with available data
IndSocDev focus on five aspects (indices) of social development, based on:
200 indicators from 25 reputable and independent data
sources, aggregated into Indices using ‘matching percentiles’

Matching percentiles & how we cover 200 countries
Combining sources more reliable than single source (minimum 3 sources)
Many indicators limited coverage between 15 and 200
Aggregating and comparing allows to enhance coverage – details explained later
Progressively more reliable
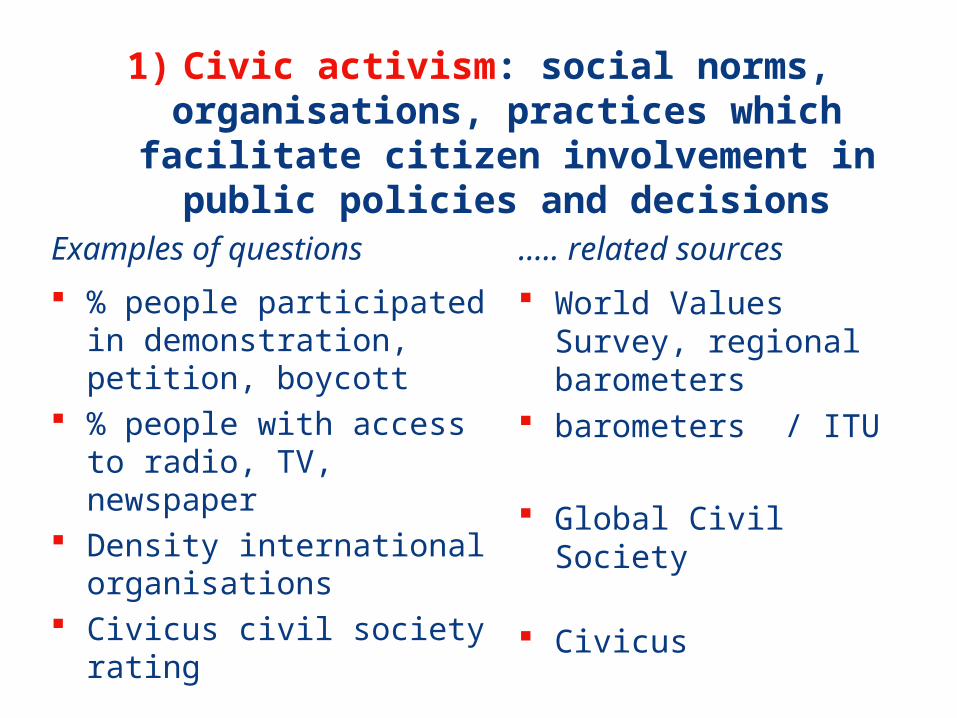
1) Civic activism: social norms, organisations, practices which facilitate citizen involvement in
public policies and decisions
Examples of questions
% people participated in demonstration, petition, boycott
% people with access to radio, TV, newspaper
Density international organisations
Civicus civil society rating
….. related sources
World Values Survey, regional barometers
barometers / ITU
Global Civil Society
Civicus

For example: Civic Activism Scores for Middle East and North Africa
0.38
0.4
0.42
0.44
0.46
0.48
0.5
0.52
0.54
Bah
rain
Tur
key
Qat
ar
Egy
pt, A
rab
Rep
.
Iran
, Isl
amic
Rep
.
Uni
ted
Ara
b E
mira
tes
Mor
occo
Tun
isia
Jord
an
Pak
ista
n
Sau
di A
rabi
a
Alg
eria
Sud
an
Liby
a
Syr
ian
Ara
b R
epub
lic
Yem
en, R
ep.

2) Clubs and associations: strength of ties to neighbourhood and associational life
(voluntary groups, time with clubs, community meets, development associations)
Examples of questions
% people using free time for groups and associations
% people members of clubs Spent time socialising % people state people
‘generally help one another’
….. related sources
Latinobarometer, WVS
barometers, WVS, World Values Survey ICVS

3) Inter-group cohesion: relations of cooperation and respect between predominant identity
groups in a society
Examples of questions
Incidences of riots, terrorist acts Levels ethnic/religious tension Group disparities and
discrimination Proportion people who reject
others as neighbours
….. related sources
Databanks, EIU ICRG Minorities at Risk, Fund
for Peace World Values Survey

4) Interpersonal safety and trust: extent that individuals feel they can rely on
people they have not met before
Examples of questions
% people experienced theft, robbery etc.
% people that feel safe Perception people can be
trusted, are fair Crime as business constraint
….. related sources
Afrobarometer, ICVS, Interpol
ICVS Barometers, World Value
Survey World Development
Indicators

5) Gender equality: extent to which women face the same opportunities and constraints with
family, work, society
Examples of questions
Perceptions equality of rights and opportunities
Rating economic rights Ratio of women in education,
labour force Wage rates
….. related sources
barometers, WVS
CIRI WDI
ILO
www.IndSocDev.org
how does it work ?


IndSocDev
matching percentiles

Methodology ISD combines over 200 indicators from 25 independent and
reputable sources Uses ‘matching percentiles’ method used for Corruptions
Perceptions Index
Lambsdorff 1999www.transparency.org/policy_research/surveys_indices/cpi/2010/in_detail#4
Rationale for matching percentiles– Combination of sources measuring same phenomenon more reliable
than each source separately– Indices broaden the coverage compared to single source
Minimum 3 independent sources to develop index Note: 2010 data reported but is still incomplete
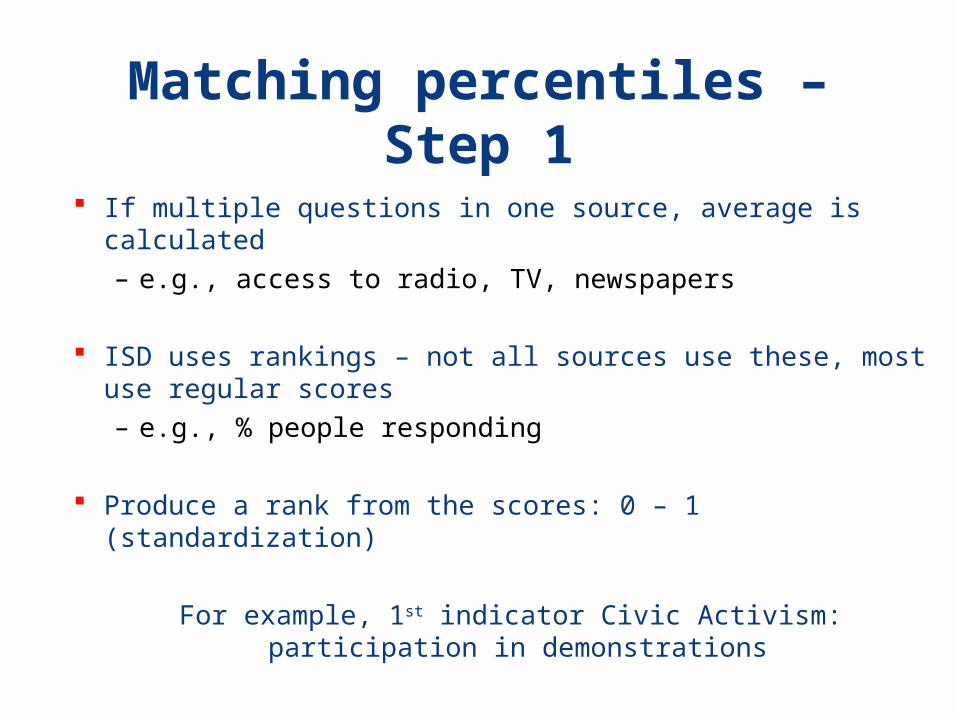
Matching percentiles – Step 1
If multiple questions in one source, average is calculated
– e.g., access to radio, TV, newspapers
ISD uses rankings – not all sources use these, most use regular scores
– e.g., % people responding
Produce a rank from the scores: 0 – 1 (standardization)
For example, 1st indicator Civic Activism: participation in demonstrations

Step 1:Standardising
Botswana
Nigeria
Tanzania
Burundi
Congo, DR
Other countries
0.24
0.22
0.08
0.05
0.04
participation in demonstrations, petitions,
boycotts - Rank
1
2
3
4
5
% of people participated in demonstrations (World Values Survey)
Botswana 28 %
Nigeria 25 %
Tanzania 10%
Burundi 3 %
Congo 2 %

Step 2 2nd source: scores from second indicator (from different
source) matched to first (‘master’) indicator based on
ranking of shared countries in the master indicator
For example, attending meetings

Matching Equally Ranked Values
Botswana
Nigeria
Tanzania
Burundi
Congo, DR
Other countries
0.24
0.22
0.08
0.05
0.04
Botswana
Tanzania
Nigeria
Burundi
Congo, DR
0.24
0.22
0.08
0.05
0.04
% respondent participation in demonstrations, petitions,
boycotts (WVS)
Respondent has often attended meetings of a local
development association (Afrobarometer)
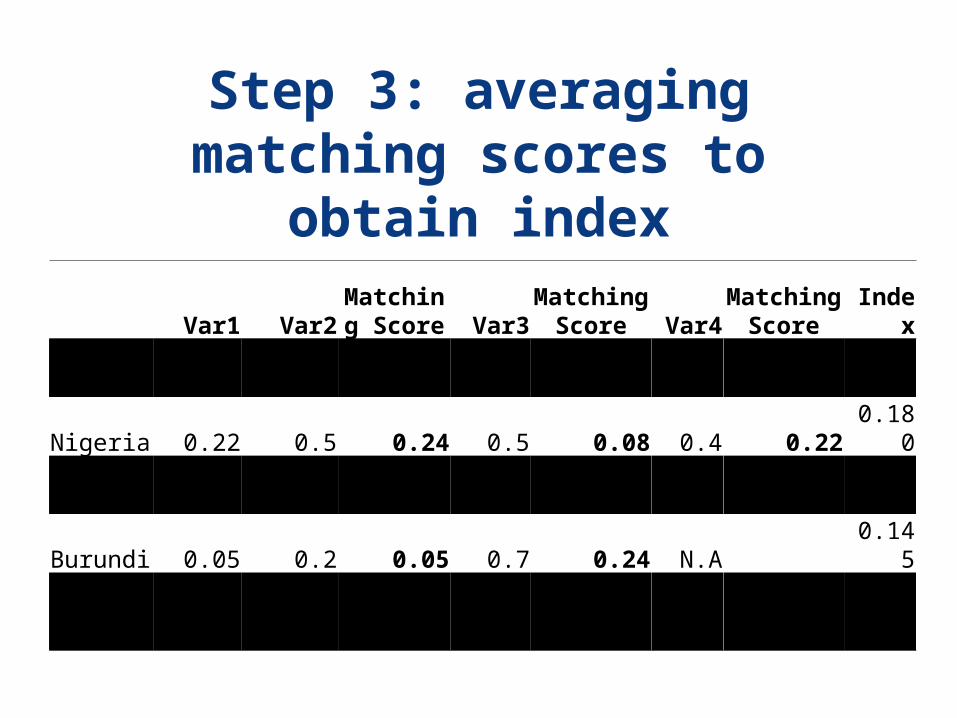
Step 3: averaging matching scores to obtain index
Var1 Var2Matching
Score Var3Matching
Score Var4Matching
Score Index
Botswana 0.24 0.4 0.22 0.4 0.05 0.5 0.24 0.170
Nigeria 0.22 0.5 0.24 0.5 0.08 0.4 0.22 0.180
Tanzania 0.08 0.3 0.08 0.6 0.22 0.3 0.08 0.127
Burundi 0.05 0.2 0.05 0.7 0.24 N.A 0.145
Congo, DR 0.04 0.1 0.04 N.A. N.A N.A

Etcetera …. We repeat the same procedure with
different choice of master variable (random score 0 – 1) 1,000 times
Reducing random error with each iteration To arrive at a final score for the index Index score for a country is only produced
if at least 3 independent sources for that country are available

Which in example produces:
2005 data (real data)country year civic_activism se_civicactivismBotswana 2005 0.490108 0.0081118Burundi 2005 0.447529 0.0150729Congo, Dem. Rep. 2005 0.4507487 0.0119878Nigeria 2005 0.4772647 0.0211548Tanzania 2005 0.4702644 0.0113484

How do we know we can trust matching percentiles ?
robustness
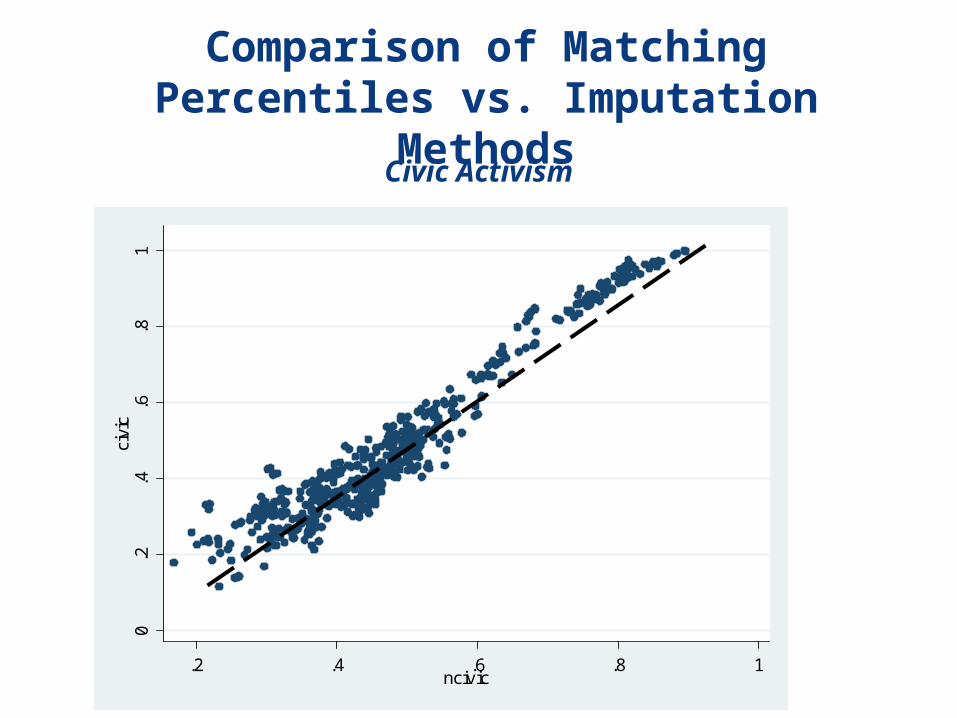
Comparison of Matching Percentiles vs. Imputation Methods
0.2
.4.6
.81
civi
c
.2 .4 .6 .8 1ncivic
Civic Activism
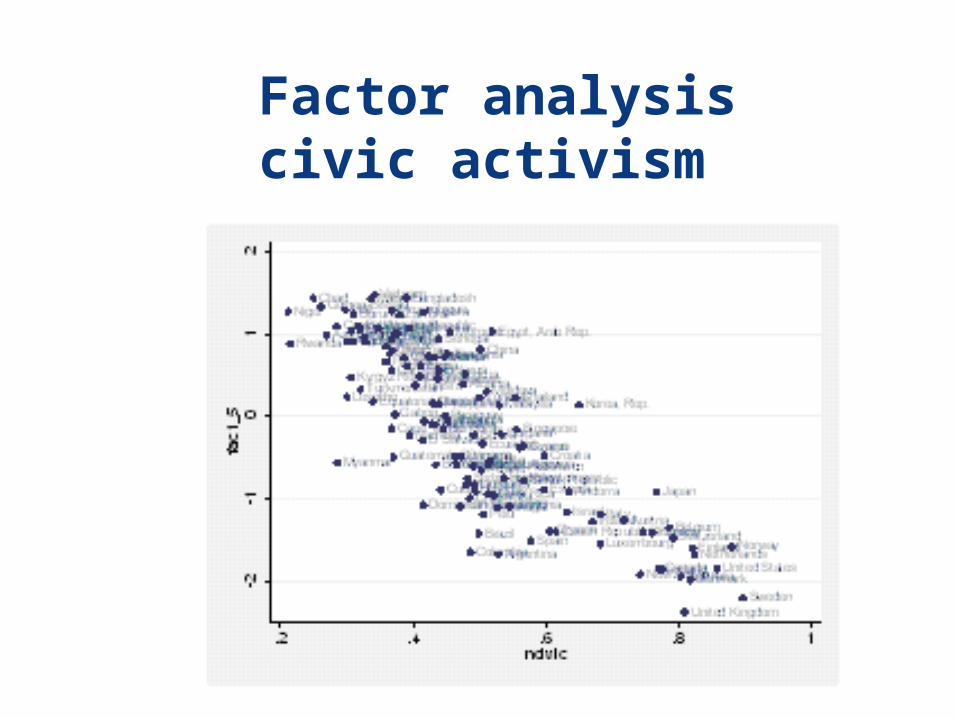
Factor analysiscivic activism

IndSocDev
examples of applications

Trends Over TimeRising Gender Equality in the Middle East, 1990-2007
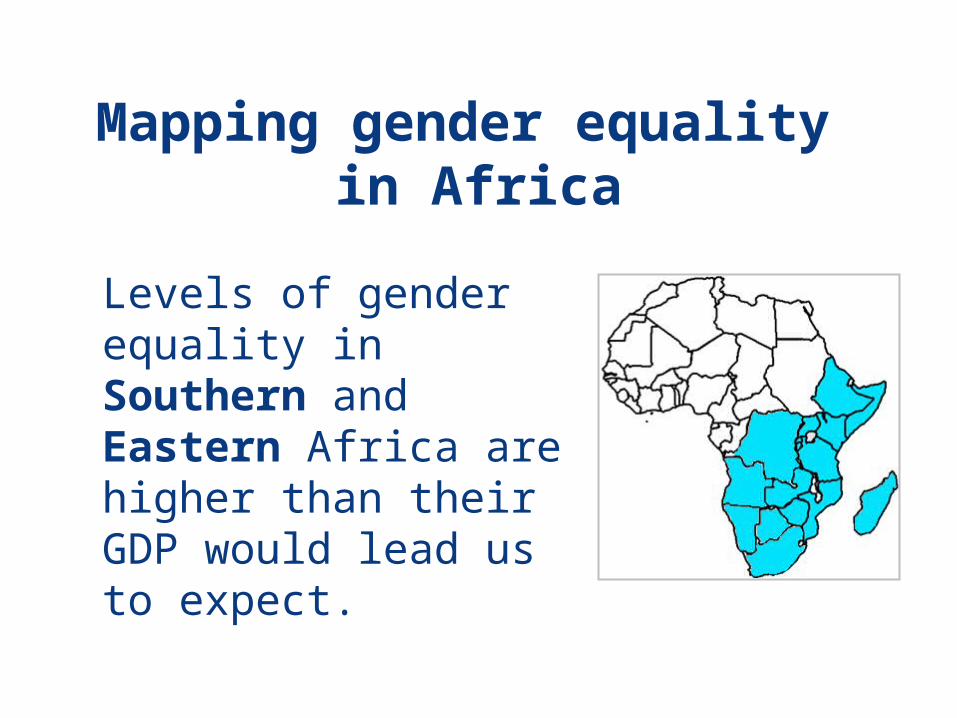
Mapping gender equality in Africa
Levels of gender equality in Southern and Eastern Africa are higher than their GDP would lead us to expect.

Gender Equality in Africa
Albania
Algeria
Antigua and Barbuda
Armenia
Australia
Austria
Azerbaijan
Bahamas, The
Bahrain
Bangladesh
Belarus
Belgium
Benin
Bolivia
Bosnia and Herzegovina
Bulgaria
Burkina Faso
Cambodia
Canada
Cape Verde
Central African Republic
Chad
China
Cote d'Ivoire
CroatiaCyprus
Czech Republic
Denmark
Djibouti
Dominica
Egypt, Arab Rep. Equatorial Guinea
Estonia
Fiji
Finland
France
French Polynesia
Gabon
Gambia, The
Georgia
Germany
Ghana
GreeceGrenada
Guinea
Guinea-Bissau
Hong Kong, China
Hungary
Iceland
India
Indonesia
Iran, Islamic Rep.
IrelandIsraelItaly
J apan
J ordan
Kazakhstan
Korea, Rep.
Kuwait
Kyrgyz RepublicLao PDR
Latvia
Lebanon
Lithuania
Luxembourg
Macao, China
Macedonia, FYRMalaysia
MaliMalta
Mauritania
Mauritius
MoldovaMongolia
Morocco
Nepal
Netherlands
New Caledonia
New Zealand
Niger
Nigeria
Norway
Oman
Pakistan
Papua New Guinea
PhilippinesPoland
Portugal
Romania
Russian Federation
Samoa
Saudi Arabia
Sierra Leone
Singapore
Slovak RepublicSlovenia
Solomon Islands
Spain
Sri Lanka
St. Kitts and NevisSt. Lucia
St. Vincent and the Grenadines
Sudan
Sweden
Switzerland
Syrian Arab RepublicTajikistan
Thailand
Togo
Tonga
TunisiaTurkey
Turkmenistan
Ukraine
United Arab Emirates
United Kingdom
United States
Uzbekistan Vanuatu
Vietnam
Yemen, Rep.
Angola
Botswana
Burundi
Cameroon
Comoros
Congo, Dem. Rep.
Congo, Rep.
EritreaEthiopia
Kenya
Lesotho
Madagascar
Malawi
Mozambique
Namibia
Rwanda
Senegal
SeychellesSouth Africa
SwazilandTanzania Uganda
ZambiaZimbabwe
0
0.1
0.2
0.3
0.4
0.5
0.6
0.7
0.8
6 6.5 7 7.5 8 8.5 9 9.5 10 10.5 11
Log GDP per capita
Gen
der
Eq
uit
y

Interpersonal Safety and Trust – Latin America and Caribbean
Albania
Algeria
Antigua and Barbuda
Armenia
Australia
Austria
Azerbaijan
Bahrain
Bangladesh
Belarus
Belgium
Benin
Bosnia and Herzegovina
Botswana
Bulgaria
Burundi
Cambodia
Cameroon
Canada
Cape VerdeCentral African Republic
China
ComorosCongo, Dem. Rep.
Cote d'Ivoire
Croatia Czech Republic
Denmark
Djibouti
Dominica
Egypt, Arab Rep.
Equatorial Guinea
Eritrea
Estonia
Ethiopia Fiji
Finland
France
Gabon
Gambia, The
Georgia
Germany
Ghana
Greece
Grenada
Guinea
Guinea-Bissau
Hong Kong, China
Hungary
Iceland
IndiaIndonesia
Iran, Islamic Rep.
Ireland
IsraelItaly
J apan
J ordan
Kazakhstan
Kenya
Korea, Rep.
Kuwait
Kyrgyz RepublicLao P DR Latvia
Lebanon
Lesotho
Lithuania
Luxembourg
Macedonia, FYRMadagascar
Malawi
Malaysia
Mali
MaltaMauritania
Mauritius
Moldova
Mongolia
Morocco
MozambiqueNamibia
NepalNetherlandsNew Zealand
NigerNigeria
NorwayOman
P akistan
P apua New Guinea
P hilippinesP oland
P ortugal
Romania
Russian Federation
Rwanda
Samoa
Saudi Arabia
Senegal
SeychellesSierra Leone
Singapore
Slovak Republic
Slovenia
Solomon Islands
South Africa
Spain
Sri LankaSt. Kitts and Nevis
St. Lucia
St. Vincent and the Grenadines
Swaziland
Sweden
Switzerland
Syrian Arab Republic
Tajikistan
Tanzania
Thailand
Togo
Tonga
Tunisia
TurkeyTurkmenistan
Uganda
Ukraine
United Arab Emirates
United Kingdom
United States
Uzbekistan
Vietnam
Yemen, Rep.
Zambia
Zimbabwe
Argentina
BelizeBolivia
Brazil
Chile
Colombia
Costa Rica
Dominican Republic
Ecuador
El Salvador
Guatemala
Guyana
Haiti
HondurasJ amaica
MexicoNicaragua
P anama
P araguay
P eru
P uerto Rico
Trinidad and Tobago
Uruguay
Venezuela, RB
0.1
0.2
0.3
0.4
0.5
0.6
0.7
0.8
0.9
1
5 6 7 8 9 10 11
Log GDP per capita
Per
son
al S
afet
y an
d S
ecu
rity

Residual Scatter Plot between gender equity and infant mortality, after controlling for: log GDP/capita, log GDP/capita2, female progression to secondary school (%), civic engagement,
governance (Voice and Accountability), HIV-AIDS infection rate
Chad
Togo
Cote d'Ivoire
Cameroon
Congo, Rep.Benin
Zambia
Niger
Bangladesh
Senegal
LesothoBurkina Faso
Mali
Morocco
India
Ethiopia
Burundi
Zimbabwe
Algeria
Malawi
MozambiqueEgypt, Arab Rep.
Ghana
Tanzania
Uganda
Suriname
Indonesia
Jordan
Guatemala
Korea, Rep.
Georgia
Tunisia
Lebanon
Namibia
South Africa
Botswana
MadagascarChile
Bolivia
Paraguay
Vietnam
Macedonia, FYREcuador
Mexico
Azerbaijan
Sri Lanka
China
Dominican RepublicArmenia
Mauritius
El Salvador
Cyprus
SwitzerlandAlbaniaColombia
Kyrgyz Republic
Ukraine
Israel
Venezuela, RBBelarusPanama
Malta
Peru
Slovak Republic
PhilippinesCroatia
ItalyRomania
Mongolia
Bulgaria
HungaryCzech RepublicCosta Rica
GermanyArgentinaFinland
LatviaEstonia
Denmark
MoldovaSlovenia
Australia
Lithuania
-60
-40
-20
020
Com
pone
nt p
lus
resi
dual
.2 .3 .4 .5 .6 .7ngender
p = 0.000***
Gender Equality and Infant Mortality

Partial Correlation (Residual Plot) between Intergroup Cohesion and (log) rate of deaths from natural disasters.
Sudan
Sri Lanka
India
Turkey
Algeria
Israel
Indonesia
Congo, Dem. Rep.
Pakistan
Guatemala
Mexico
Papua New GuineaNigeria
Bangladesh
Iran, Islamic Rep.Honduras
Sierra Leone
Dominican RepublicPhilippines
Ethiopia
Niger
Congo, Rep.
Nicaragua
SenegalRussian Federation
Peru
Georgia
South Af ricaCameroon
Egy pt, Arab Rep.
Ecuador
France
China
Boliv ia
Uganda
Croatia
Venezuela, RB
United Kingdom
Colombia
Latv iaPanama
Albania
RomaniaGuinea
Bulgaria
Togo
Saudi Arabia
Keny a
Greece
Jordan
Mali
Spain
Brazil
JapanPoland
Paraguay
Botswana
Italy
Sy rian Arab Republic
Germany
Slov ak Republic
Zambia
Ukraine
Malay sia
Guy ana
Thailand
Uruguay
Morocco
GhanaNamibia
Madagascar
Moldov a
Cote d'Iv oire
Canada
Czech RepublicChile
Switzerland
ArgentinaHungary
Belarus
Vietnam
Korea, Rep.
United States
New Zealand
Norway
Singapore
Australia
Sweden
-10
-8-6
-4-2
0C
ompo
nent
plu
s re
sidu
al
0 .2 .4 .6 .8ncohesion
Thank you !
Do let us know what you think
www.IndSocDev.org