indika energy group company update 3m21
TRANSCRIPT

PT Indika Energy Tbk.
3 May 2021
INDIKA ENERGY GROUP
COMPANY UPDATE
3M21

Investors and security holders are cautioned that this communication contains forward-looking statements
and that forward-looking statements are subject to various risks and uncertainties, many of which are difficult
to predict and are generally beyond the control of PT Indika Energy Tbk.
Neither PT Indika Energy Tbk., its affiliates nor any other person assumes responsibility for the accuracy
and completeness of the forward-looking statements in this communication.
This communication does not constitute an offer to sell or the solicitation of an offer to buy any securities in
the United States or any other jurisdiction in which such offer, solicitation or sale would be unlawful prior to
registration or qualification under the securities laws of any such jurisdiction.
Disclaimers
3
Table of Contents
Page #
▪ Indika Energy - Overview 4 - 5
▪ Income Statement Analysis 6 - 9
▪ Highlights – Latest Cash and Debt Position 10 - 11
▪ Proactive Liability Management amid Low Coal Price Environment 12 - 13
▪ Cost Saving and Improvement Initiatives 14 - 16
▪ Operational Performance YTD and Corporate Guidance 2021 17
▪ Coal Price & Sector Development 18 - 21
▪ Our Growth and Diversification Strategy 22 - 23
▪ New Growth Projects, Non-Coal Diversification 24 - 28
▪ ESG Highlights 28 - 33
▪ Appendix 34 – 57

4
Indika Energy is Indonesia’s Leading Integrated and Diversified Company
✓ Integrated energy value chain with portfolio spanning across Indonesia
✓ Well-placed to capture domestic economic growth and global economic
recovery
✓ Provides complementary products and services to domestic and international
customers
✓ Strong operating track-record, with focus on cost control and unlocking
synergies within the Group
✓ Ongoing diversification initiatives such as renewables, digital technologies and
gold mining (target 50% non-coal revenue by 2025)
✓ Strong focus on and commitment to ESG initiatives
✓ Prudent financial management, with established track record in debt and equity
capital markets
(1) As measured by 2019 production according to Wood Mackenzie
Energy Resources1
Indonesia’s 3rd largest coal miner(1)
Coal exploration and production through
flagship Kideco and MUTU
Coal trading (ICI and IETPL)
Energy Services2
Contract mining and E&C services for
the mining sector (Petrosea)
EPC and O&M services in oil & gas and
power generation (Tripatra)
Other Businesses4
Gold development project (Awak Mas,
Nusantara Resources)
Evaluating renewable energy technologies
and opportunities
Digital technology activities (integration of
Group ICT systems)
Energy Infrastructure3
River and sea transportation solutions
(MBSS)
Port and logistics services, as well as
fuel storage (Interport)
Electricity generation (CEP/CEPR)
Green Initiatives
Digital technology
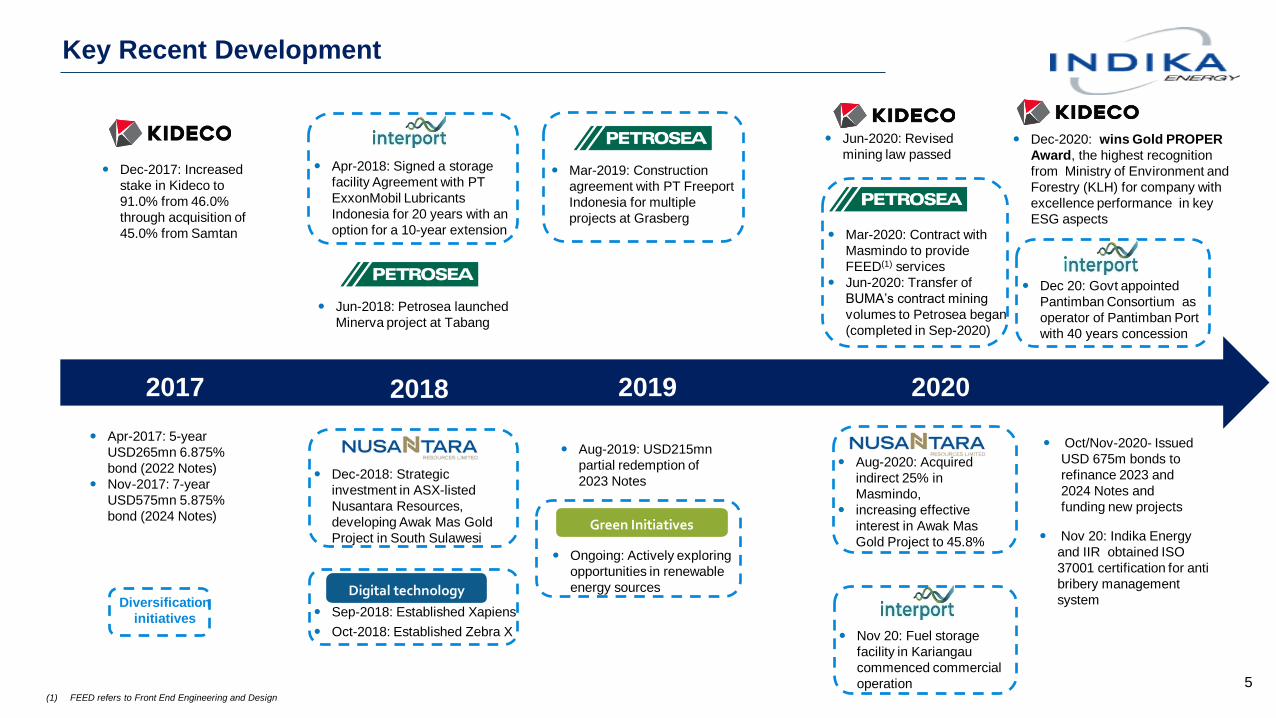
Key Recent Development
(1) FEED refers to Front End Engineering and Design
2017 2018 2019 2020
Apr-2018: Signed a storage
facility Agreement with PT
ExxonMobil Lubricants
Indonesia for 20 years with an
option for a 10-year extension
Mar-2019: Construction
agreement with PT Freeport
Indonesia for multiple
projects at Grasberg
Dec-2017: Increased
stake in Kideco to
91.0% from 46.0%
through acquisition of
45.0% from Samtan
Jun-2020: Revised
mining law passed
Dec-2018: Strategic
investment in ASX-listed
Nusantara Resources,
developing Awak Mas Gold
Project in South Sulawesi
Aug-2020: Acquired
indirect 25% in
Masmindo,
increasing effective
interest in Awak Mas
Gold Project to 45.8%
Sep-2018: Established Xapiens
Oct-2018: Established Zebra X
Digital technology
Apr-2017: 5-year
USD265mn 6.875%
bond (2022 Notes)
Nov-2017: 7-year
USD575mn 5.875%
bond (2024 Notes)
Mar-2020: Contract with
Masmindo to provide
FEED(1) services
Jun-2020: Transfer of
BUMA’s contract mining
volumes to Petrosea began
(completed in Sep-2020)
Ongoing: Actively exploring
opportunities in renewable
energy sources
Green Initiatives
Diversification
initiatives
Aug-2019: USD215mn
partial redemption of
2023 Notes
Jun-2018: Petrosea launched
Minerva project at Tabang
Nov 20: Fuel storage
facility in Kariangau
commenced commercial
operation
Oct/Nov-2020- Issued
USD 675m bonds to
refinance 2023 and
2024 Notes and
funding new projects
Dec 20: Govt appointed
Pantimban Consortium as
operator of Pantimban Port
with 40 years concession
Nov 20: Indika Energy
and IIR obtained ISO
37001 certification for anti
bribery management
system
Dec-2020: wins Gold PROPER
Award, the highest recognition
from Ministry of Environment and
Forestry (KLH) for company with
excellence performance in key
ESG aspects
5

Indika Energy’s Consolidated Income Statement Highlights
6
*) Consolidated EBITDA plus dividends received from associates
**) Core Profit refers to the current year’s profit attributable to the owner of the company, excluding non-operating gains / losses and
related taxes (amortization of intangible assets, impairment of assets, fair value changes on contingent consideration obligation, and
gain from a bargain purchase).
Summary P&L Quarter Data
3M21 3M20 YoY 4Q20 QoQ
Revenues 582.2 641.5 -9.2% 538.6 8.1%
COGS (461.2) (536.6) -14.0% (499.0) -7.6%
Gross Profit 120.9 104.9 15.3% 39.6 205.4%
SG&A Expenses (36.1) (36.2) 3.5% (32.5) 10.9%
Operating Profit 84.9 68.7 23.6% 7.1 1099.4%
Pre tax Profit 23.8 (16.8) -241.3% (49.9) -147.6%
Adjusted EBITDA *) 141.9 102.3 38.8% 47.5 198.7%
Income Tax (26.9) (0.9) 2892.1% (8.6) 213.5%
Core Profit (Loss) 12.5 0.9 1357.3% (46.7) -126.8%
Net Profit (Loss) (9.4) (21.0) -55.5% (65.0) -85.6%
Gross Margin(%) 20.8% 16.4% 7.4%
EBIT Margin(%) 14.6% 10.7% 1.3%
Core Profit Margin(%) 2.2% 0.1% -8.7%
Net Profit Margin(%) -1.6% -3.3% -12.1%

Indika Energy – 3M21 Revenue Contribution
7
4)
Revenue 3M21: US$582.2 million Revenue 3M20: US$641.5 million
3M21
Coal : 86.6%
Non-Coal : 13.4%
3M20
Coal : 77.2%
Non-Coal : 22.8%
Kideco65%
Indika Resources
9%
Petrosea 14%
Tripatra6%
MBSS3%
Interport1%
Others 2%
Kideco55%
Indika Resources
11%
Petrosea 15%
Tripatra15%
MBSS2%
Interport0%
Others 2%

8
3M21 Business Highlights – Revenue Breakdown
Subsidiaries3M21
(US$ mn)
3M20
(US$ mn)YoY Chg Remarks
Kideco 414.9 376.4 10.2% • ASP ▲ 5.1% (+US$2.2/ton) to US$45.2/ton in 3M21
• Sales Volume ▲ 4.9% (+0.4MT) to 9.2MT in 3M21
Petrosea 91.1 103.6 -12.1%
• Contract mining revenue ▲ US$3.7m to US$64.0m; OB volume : 27.6 mbcm in 3M21 vs 27.2
mbcm in 3M20; Coal getting : 7.8 MT in 3M21 vs 7.6 MT in 3M20
• ENC revenue ▼US$10.4m to US$12.8m, mainly due to lower contribution from Freeport project
• PLSS revenue ▼ US$5.0m to US$3.5m mainly due to completion of Tg Batu and lower activities
in Sorong
Tripatra 39.0 100.3 -61.1%• Lower contribution from Tangguh project (-US$50.9m) to US$33.4m
• Lower revenue from Emily project (US$3.2m for 3M21 vs US$12.6m for 3M20)
• Completion of Vopak project in 2020 (3M20: Vopak = US$1.8m).
Indika Resources 57.1 78.3 -27.1%• MUTU’s sales volume ▲ 25.1% (+0.1MT) to 0.4 MT in 3M21 with ASP ▲ 11.5% (+US$7.9 per
ton) to US$76.9 per ton in 3M21
• Coal traded volume ▼ 62,2% to 0.7MT in 3M21
MBSS 15.2 6.4 -7.3% • Barging revenue ▼(-US$1.3m)to US$10.7m in 3M21, volume ▼(-1.2MT) to 6.0MT in 3M21
• Transhipment revenue▲ (+US$0.1m) to US$4.5m, with slightly higher volume
Interport 7.1 1.2 513.3%
Others 13.0 12.0 7.6%
Total Gross Revenue 637.2 688.2 -7.4%
Elimination (55.2) (46.6) 18.4%
Total Net Revenue 582.2 641.6 -9.2%

9
3M21 Business Highlights- Gross Profit
Subsidiaries3M21
(US$ mn)
3M20
(US$ mn)
YoY
ChangeRemarks
Kideco 103.7 67.6 53.4%• Cash cost ex Royalty ▼ (+US$1.8/ton) from US$29.4/ton in 3M20 to US$27.6/ton in 3M21
• SR ▼ 1.9% to 5.2x from 5.3x in 3M20
• GM increased to 25.0% in 3M21 from 18.0%in 3M20
Petrosea 13.4 19.3 -30.6% • Contract mining gross profit margin increased to 23.6% in 3M21 compared to 21.2% in 3M20
• E&C gross profit margin decreased to 19.8% in 3M21 compared to 27.7% in 3M20
Tripatra (13.2) 7.1 -285.2% • Gross loss recognized on BP Tangguh of US$13.2m in 3M21 vs US$7.1m profit in 3M20
• Gross margin dropped to -33.7% in 3M21 from 7.1% in 3M20.
Indika Resources 14.9 8.1 84.0% • ASP ▲ 11.5% (+US$7.9 per ton) to US$76.9 per ton in 3M21
• Cash cost▼ -13.7% (-US$8 /ton) to US$50.1/ton in 3M21
MBSS 1.3 1.6 -18.6%• GM declined to 8.7% in 3M21 from 9.9% in 3M20, mostly from barging
Interport 1.2 0.2 413.3%
• Margin declined to 17.0% from 20.3% in 3M20 , mainly due to higher spare-parts and SAP
expenses.
Others 1.6 1.2 33.3%
Elimination (2.0) (0.3)
Total Gross Profit 120.9 104.9 15.3%

591.3
101.879.7
1,250.0
349.4
31.532.7
0.0
200.0
400.0
600.0
800.0
1000.0
1200.0
1400.0
1600.0
1800.0
CASH DEBT
Cash Fin. Assets Rest. Cash Bonds 2) Bank Loans 3) Leases 4) Other loans 5)
Indika Energy – Strong Cash Position
10
772.81)
1,665.9
US$ million
Cash and Debt Breakdown as of 31 March 2021
4)
1) PTRO: US$122.1m, MBSS: US$32.7m, Tripatra: US$42.2m, Kideco: US$212.1m, IIR: US$33.9m, Interport: US$14.6m, HoldCo: US$315.4m
2) US$575mn due 2024 and US$675m due 2025
3) PTRO: US$132.2m, MBSS: US$20.5m, Tripatra: US$19,6m; HoldCo: US$177,0m
4). PTRO US$31.5m
5) Tripatra : US$32,7m

Indika Energy – Sound Balance Sheet
11
Net Debt Ratio Long Dated Debt Maturity Profile
US$ millionUS$ million
Cash Breakdown by Subsidiaries LTM Free Cash Flow
US$ millionUS$ million
337.9 336.9 310.4392.3 392.3
144.4 171.3114.1
187.5 187.5 59.681.3
84.7
134.4 134.4 152.5133.6
154.3
42.7 42.7 34.6 4040.3
35.2 35.2
2017 2018 2019 2020 3M21
HoldCo & Others Kideco Petrosea Tripatra MBSS
211.0
323.0
198.4 176.4
223.3
0
50
100
150
200
250
300
350
2017 2018 2019 2020 3M21
147.1 109.0 86.0
651.1 675
0
100
200
300
400
500
600
700
800
2021 2022 2023 2024 2025 2026
2.4
1.1
2.1
3.3
2.9
0.6 0.6
0.9
1.1 1.0
-
0.5
1.0
1.5
2.0
2.5
3.0
3.5
4.0
-
100.0
200.0
300.0
400.0
500.0
600.0
700.0
800.0
900.0
1,000.0
2017 2018 2019 2020 3M21
Net debt Net debt to EBITDA Net debt to Equity

78 102 83 72 45
265 285
575 675
0
100
200
300
400
500
600
700
800
2020 2021 2022 2023 2024 2025 2026
Successful Refinancing to Support Future Growth
12
US$ million
Indika Energy successfully issued global bond of US$675million with 5-year tenor and 8.25% coupon
Sources & Uses
USD Million Sources
Original Issue (16 October 2020) 450
Tap Issue (28 October 2020) 225
Total 675
USD Million Uses
Call Balance 2022s, Including Call
Premium 274
Call Balance 2023s, Including Call
Premium 288
Repayment of principal debt matured in
202125
Diversification, and Transaction
Expenses 88
Total 675
Consolidated Debt Maturity Profile Post Liability Management
Loans & Lease Bonds
• Additional debt to support diversification plan
• Improve liquidity and lengthen maturity profile
• Obtained 85.9% consent from 2024 bondholders to align with new bond covenants.
• Rating agencies maintain debt rating:
Moodys : Ba3 (negative outlook)
Fitch : BB- (negative outlook)
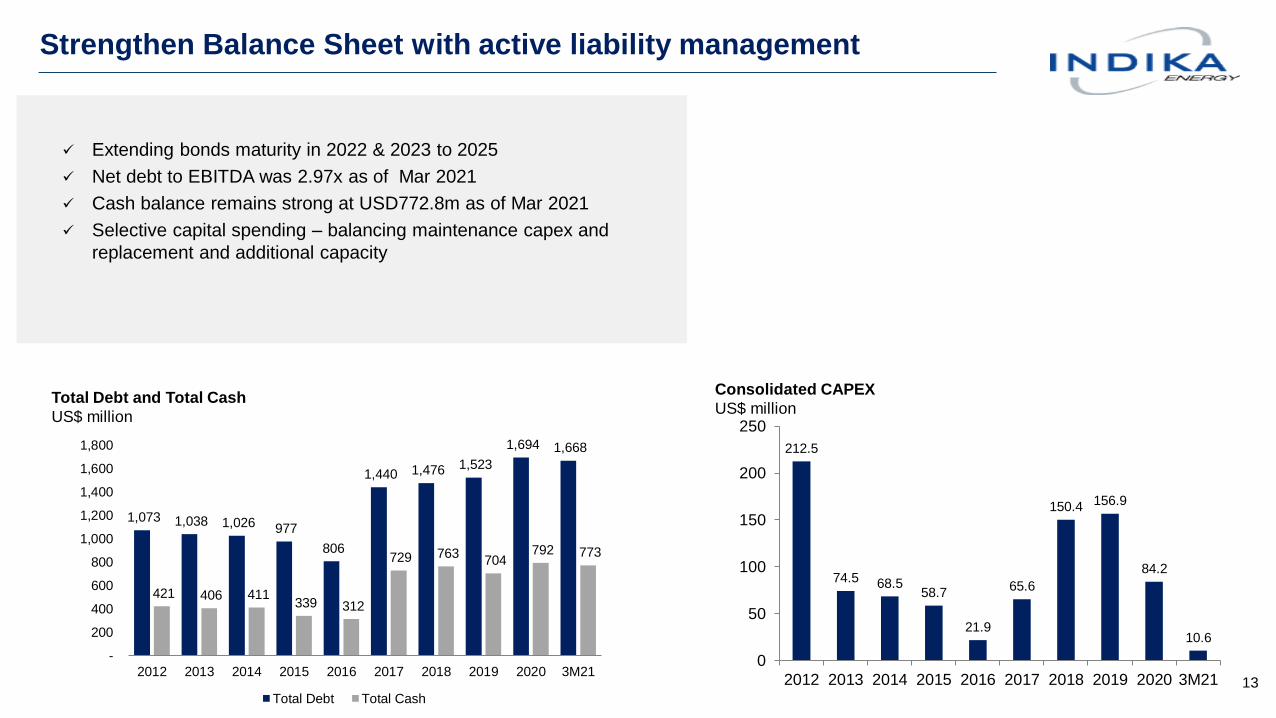
Strengthen Balance Sheet with active liability management
13
Consolidated CAPEX
US$ millionTotal Debt and Total Cash
US$ million
✓ Extending bonds maturity in 2022 & 2023 to 2025
✓ Net debt to EBITDA was 2.97x as of Mar 2021
✓ Cash balance remains strong at USD772.8m as of Mar 2021
✓ Selective capital spending – balancing maintenance capex and
replacement and additional capacity
1,073 1,038 1,026 977
806
1,440 1,476 1,523
1,694 1,668
421 406 411 339 312
729 763 704
792 773
-
200
400
600
800
1,000
1,200
1,400
1,600
1,800
2012 2013 2014 2015 2016 2017 2018 2019 2020 3M21
Total Debt Total Cash
212.5
74.5 68.558.7
21.9
65.6
150.4 156.9
84.2
10.6
0
50
100
150
200
250
2012 2013 2014 2015 2016 2017 2018 2019 2020 3M21

Group-wide Cost Saving and Operational Improvement Initiatives
14
Oil Brent Price
US$/bbl • Minerva Project - a technology-based initiative, using
digitalization and data analysis. Three main areas of
improvement:
✓ Fleet management system
✓ Mine planning
✓ Performance management
• The initiative is aimed to increase assets utilisation (e.g
fewer fleet requirement/ unit production), reduce cost (e.g fuel
consumption), and improve efficiency/ productivity.
• More contracts for Petrosea in Kideco and Awak Mas Project
• Expanding existing projects (e.g fuel storage)
Value Creation : Synergy / Integration
52
-
10
20
30
40
50
60
70
80Ja
n-1
9
Feb
-19
Mar-
19
Ap
r-1
9
May-1
9
Ju
n-1
9
Ju
l-19
Au
g-1
9
Se
p-1
9
Oct-
19
Nov-1
9
Dec-1
9
Ja
n-2
0
Feb
-20
Mar-
20
Ap
r-2
0
May-2
0
Ju
n-2
0
Ju
l-20
Au
g-2
0
Se
p-2
0
Oct-
20
Nov-2
0
Dec-2
0

15
Mine Operation Planning Dashboard (MOPAD)
Mine Operation Control Dashboard (MOCOM)
Fuel Consumption
Energy use management: Optimize mine design with effective haul distance through real-time mine planning
dashboard (MOPAD) and live planning (MOCOM) to provide dynamic mine planning for minimize fuel use
and hence emission
Mine Planning Optimization
Fuel consumption: provide real-time monitoring of Fuel performance with capturing man, machine and
environment parameters. Then integrate with operator individual performance reward.
Minerva App for monitor Operator individual performance
Realtime Fuel analyzer (Man, machine, and environment)
Digger Productivity
Gain 19% more digger productivity though Realtime
performance Advance
19%
Truck Productivity
Gain 14% more truck productivity through Dynamic dispatch and
Road Analyzer
14%
Fuel Ratio Reduction
Reduce 6% of fuel ratio through Fuel analyzer and Road Analyzer
6%
Overall reduction in fuel consumption at project level
15%
Some benefits of technological application in our operations:
Operational Improvement also reduces carbon emissions

16
Petrosea has been Inducted into WEF's Global Lighthouse Network
Industrial lighthouses are diversifying and digitizing beyond the four walls of the factory
Petrosea is the only local company in Indonesia and Southeast Asia with this status

Indika Energy’s Operational Highlights Vs 2020 Corporate Guidance
17
Operational Data Guidance
2021
3M21 %Budget 3M20
KIDECO
Production (MT) 30.0* / 34.0 9.1 8.8 3.4%
Strip Ratio (x) 5.5 5.2 5.3 -1.9%
Newcastle Benchmark ($/ton) 67 89.2 68.4 30.4%
Average Selling Price ($/ton) 42.2 45.2 43.0 5.1%
Cash Cost xRoyalty ($/ton) 27.5 27.6 29.4 -6.3%
Overburden Volume (BCM) 183 47.6 46.0 3.5%
PETROSEA
Overburden Volume (mBCM) 118 27.6 27.2 1.5%
Coal Getting (MT) 31 7.8 7.6 2.6%
MBSS
Barging Volume (MT) 22.1 6 7.2 -16.7%
Floating Crane Volume (MT) 10.2 2.1 2.0 5.0%
INDIKA RESOURCES
Coal Traded Volume (MT) 7 0.7 1.9 -63.2%
MUTU Production Volume (MT) 1.4 0.5 0.5 0.0%
CAPEX
2021
Budget 3M21 %
(US$M) (US$M)
Kideco 12.90.1
0.5%
Petrosea 807.9
9.8%
MBSS 6.91.5
21.7%
Tripatra --
0.0%
Indika Resources 7.7 0.1 0.9%
Interport 14.3 0.7 5.1%
Indika Holding
Company2.1 0.4 18.1%
IMP 0.9 - 0.0%
Total Capex 124.8 10.6 8.5%

18
Thermal Coal Price 2021 – Improved Coal Price Environment
Newcastle, ICI-4, QHD’55 & ASPUS$/ton
CNY/ton
• Coal price, including ICI-4, has started to recover as of October 20.
• China’s policy on coal remains key factor for price movement.
• Thermal coal buyers in China have been looking for alternate sources in the wake of China banning Australian coal imports
• Tight seaborne supply is seen due to heavy rainfall in Kalimantan. After CNY, China’s domestic coal price remains elevated, supported by limited
production quotas at pits and stronger demand.
• Noble forecasts seaborne thermal coal demand is likely to increase by 3.8% y/ to 960MT in 2021, led by an increase in consumption in
India and SE Asia on recovery in economic activity.
• Global coal demand recovery is also supported by Covid-19 vaccine availability in 2021.
USD/ton
52.8
95.7
80.1
95.2
117.5
65.9 68.4 54.2 66.1
89.2 94.8
26.6 32.2 42.0 40.1
48.0
33.5 37.6 33.0 34.2 24.2
32.3 40.8 44.7
37.9
37.3 42.7 51.856.4 53.3 47.1 44.4 45.1 43.0
36.4 36.335.4
366
655.7 597.2
701.5
632.1 586.1
514.5 570.1
636.0
759.8 716.5
0
100
200
300
400
500
600
700
800
0
20
40
60
80
100
120
140
1Q16 2Q16 3Q16 4Q16 1Q17 2Q17 3Q17 4Q17 1Q18 2Q18 3Q18 4Q18 1Q19 2Q19 3Q19 4Q19 1Q20 2Q20 3Q20 4Q20 1Q21 2Q21YTD
Newcastle ICI-4 ASP QHD'55
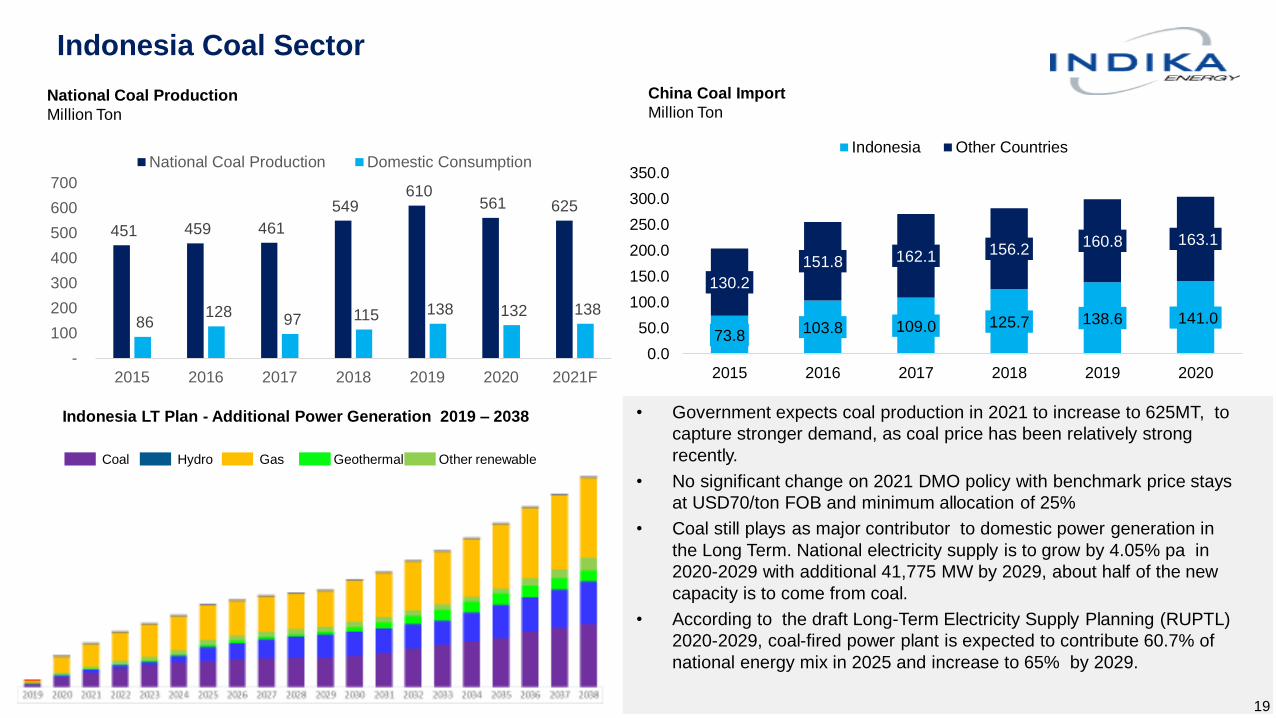
Indonesia Coal Sector
National Coal Production
Million Ton
China Coal Import
Million Ton
GW
Indonesia LT Plan - Additional Power Generation 2019 – 2038
Coal Hydro Gas Geothermal Other renewable
• Government expects coal production in 2021 to increase to 625MT, to
capture stronger demand, as coal price has been relatively strong
recently.
• No significant change on 2021 DMO policy with benchmark price stays
at USD70/ton FOB and minimum allocation of 25%
• Coal still plays as major contributor to domestic power generation in
the Long Term. National electricity supply is to grow by 4.05% pa in
2020-2029 with additional 41,775 MW by 2029, about half of the new
capacity is to come from coal.
• According to the draft Long-Term Electricity Supply Planning (RUPTL)
2020-2029, coal-fired power plant is expected to contribute 60.7% of
national energy mix in 2025 and increase to 65% by 2029.
73.8103.8 109.0 125.7 138.6 141.0
130.2
151.8 162.1 156.2160.8 163.1
0.0
50.0
100.0
150.0
200.0
250.0
300.0
350.0
2015 2016 2017 2018 2019 2020
Indonesia Other Countries
451 459 461
549 610
561 625
86 128
97 115 138 132 138
-
100
200
300
400
500
600
700
2015 2016 2017 2018 2019 2020 2021F
National Coal Production Domestic Consumption
19

20
Coal Outlook – LT Demand Remains Solid
Source: BP Energy Outlook 2019
• In the LT basis, International Energy Agency forecasts higher global coal
consumption by 2030 and only marginally lower consumption by 2040
• Thermal coal remains the largest power generator in the world
• Growing demand driven by China, India and SE Asia ( Vietnam, Indonesia)

21
Kideco: Impact of the Revised Mining Law
On 10-Jun-2020, the Indonesian parliament issued Mining Law No. 3 of 2020, which technically guarantees holders of CoW / CCoW
extensions for an effective:
(a) 20 years (in the form of two 10-year extensions) if the CoW or CCoW has never been extended; or
(b) 10 years (in the form of one 10-year extension) if the CoW or CCoW has been extended before
The authority to issue licenses and production approvals now are exclusively at the central government and ministry level, where it had
previously been at the governor and regency head. Additional guidance on the government royalty, income tax, and VAT to issued
Kideco’s existing CCoW expires in Mar-2023 and will be extended by conversion to an IUPK Continuation (IUPK sebagai Kelanjutan Operasi)
subject to application to the government including the submission of necessary documentation and other statutory requirements being fulfilled
Many large Indonesian miners have mining licenses that will expire before Kideco's
CCOW
1st Generation
Revised Mining Law No. 3
(2020)Key Highlights
Concession 49,000ha(1) Can Keep existing size of
concession(2)
Revised mining law allows for existing concession sizes to remain with
a conversion to IUPK
Licensing Period 2 x 10-year
extensions 2 x 10-year extensions
20 years (in the form of two 10-year extensions) if the CoW or CCoW
has never been extended; or
10 years (in the form of one 10-year extension) if the CoW or CCoW
has been extended before
% Government Royalty 13.5% TBD Royalty scheme will be further clarified in subsequent legislation
% Corporate Income Tax 45% 22% Separate legislation lowered Indonesian corporate income taxes
Additional Levy on Net Profit None 10% 10% levy on net profit introduced
Source: Mining Law 3/2020 (10-Jun 2020)
(1) Kideco’s size of concession
(2) Based on Mining Law 3/2020
Latest Developments

Strategies to Enhance Our Position as a Leading Integrated and Diversified
Indonesian Company
22
Diversify cash flows and increase revenue contribution from non-coal related businesses
• Increasing non-coal customer segments for energy-related services
• Exploring investment opportunities in non-coal mining sectors
• Developing other non-coal businesses
Strong focus and commitment to ESG in all aspects of our operations and management
• Continuing to maintain strong environmental management practices at our operations and promote green initiatives in the
community
• Continuing to be a leader in social responsibility through education, health, safety and community empowerment initiatives
• Maintaining a robust corporate governance framework and ensuring compliance with all prevailing laws and regulations
Continue to extract operational efficiencies and harness significant synergies among Group companies
• Continuing to increase operational efficiency and reduce costs
• Managing capital expenditure and negotiating with suppliers to distribute impact of adverse market conditions
• Continuing to provide a high-quality service and ongoing efficiency and optimisation improvements at coal mining services
business
• Continuing to leverage intra-Group cross-selling opportunities and integration of capabilities across businesses to increase
profitability
• Centralizing certain functions among Group companies (e.g. ICT, supply chain and procurement)
Continue to exercise prudent financial management and maintain healthy operating cash flows
• Using internally-generated cash ahead of external financing and maintaining a target total debt to EBITDA ratio
• Ongoing focus on delivering and controlling costs to position to be able to take advantage of future opportunities
• Generating sufficient cash flows from operations and diversifying access to available capital sources

23
Diversification Beyond Coal is a Core Part of Strategy
✓ Target non-coal related businesses to make up c.50% of total revenue
by 2025
✓ Seeking to transition toward lower contribution from coal-related
activities
✓ Various initiatives underway
✓ Energy Services and Energy Infrastructure targeting further
expansion into oil & gas and other sectors
✓ Diversification into minerals and precious metals
✓ Evaluation of opportunities in renewable energy
✓ Reducing exposure in coal related business through divestment
✓ Benefit of synergies across businesses (e.g. Petrosea providing FEED
to Awak Mas and also targeting E&C services)
✓ Financial prudence and discipline maintained for all investments
65%5%
4%
2%
10%
4%
6%
Kideco
MUTU
Others
Coal Trading
Tripatra
MBSS
2%Petrosea E&C & etc
Petrosea Mining
Interport
1%
Non Coal : 13.4%
Coal : 86.6%

24
Diversification Investments – Gold Asset Project
A Strategic investment in Nusantara Resources Limited (ASX: NUS). Nusantara
owned 100% PT Masmindo Dwi Area which has sole rights to exploit in Awak
Mas Gold Project
Location : South Sulawesi, 370 km from Makasar
Potential Resources : 2.35 million onz
Potential Reserves : 1.53 million onz *(1.33g/t)
License : COW (Contract of Work) amended in March 2018
Total concession : 14,390Ha, explored area ± 2,000Ha
Current Status : FEED
Definitive feasibility study has been completed in 2018
Ownership : Total 45.8% in Masmindo , through 27.8% in Nusantara
Resources Limited & 25% direct ownership in Masmindo (with
option to increase up to 40%)
Potential Direct or Indirect ownership = 56.7% (exc. Petrosea’s
portion in Masmindo)
* Reserve at USD1,400 per ounce gold price

Awak Mas/Masmindo Gold Project – Investment Structure
25
27.8%
Exercised 1st option:
USD 15m for 25% in MDWI
Indika Energy
Nusantara
(ASX Listed)
Masmindo DWI Area (gold project)
75%
Project Activities 2 stage
Stage 1 : To reach Final Investment Decision (1H21)
Complete: FEED
Detailed Design, permit for Tailings Storage Facility (TSF)
Land Access and compensation
Early Civil works
Conclude Debt and equity funding
Stage 2: Mid 2021
Award major contracts
Full scale construction
Commissioning is expected 2Y from Final Investment Decision
Ownership: Has exercised first stage option; paid USD 15m and
owns directly 25% of Masmindo. Transaction has been approved by
MEMR on 25 Aug 20.Direct 25%
Current
After 2nd
Option
Direct ownership 25.0% 40.0%
Indirect through Nusantara 20.8% 16.7%
Total 45.8% 56.7%
Current ownership: 45.8% Potential ownership: 56.7%
27.8%
Indika Energy
Nusantara
(ASX Listed)
Masmindo DWI Area (gold project)
60%
Direct: 40%
After 2nd option:
USD 25m for 15% in MDWI

26
Diversification Investments – Fuel Storage Project
Build and operate fuel storages exclusively for ExxonMobil
Location : Balikpapan, Kariangau, East Kalimantan
Project Company : PT Karingau Gapura Terminal Energy
Total Project Cost : US$115million
Funding Structure : US$75 million - bank loan & US$38 million - equity
Storage Capacity : 75ML – Diesel; 13ML – MoGas; - 8ML –B100
Construction Periods : 18 months starting January 2019
COD : Commercial operation as of 9 November 20
Contractors : Tripatra & Petrosea
Phase 1

27
Diversification Investments – Patimban Port
▪ A strategic infrastructure project development; as the first integrated supply chain port in Indonesia
▪ On 30 Dec 20, Ministry of Transport has appointed Consortium of Patimban as operator of Patimban Port
▪ Indika joined the consortium through Indika Logistic & Support Services (ILSS) with 29% stake
Location : Patimban, Subang West Java
Scheme : Procure – Operate – Transfer
Concession Period : 40 years (2021 to 2061)
Capacity : 3.75 million TEUs for container terminal
600,000 CBU for car terminal
Development : 4 phases
Phase I
• Car terminal with capacity of 218,000 CBU (expected to operate by end
2021)
• Container terminal with area of 10.74 ha and capacity of 250,000 TEUs
Phase II
• Development will be in 2021-2027
• Car terminal with capacity of 382,000 CBU
• Container terminal with area of 63.45 ha and total capacity of 3.75 million
TEUs

28
INVESTASI
• Indika Energy formed a JV to operate solar power business with Fourth Partner
Energy, India’s leading solar developer, called Empat Mitra Indika Tenaga Surya
(EMITS), with 51% stakes.
• EMITS will provide a one-stop-shop, renewable energy solutions platform for
Indonesia’s commercial and industrial sectors.
• EMITS aims to install 500MW in the next 5 year in Indonesia, combination of
Utilities, Commercial & Industrial and Off Grid/ Min Grid
DIVERSIFICATIONINVESTMENT
Renewable Energy
Diversification Investments – Renewable Energy
Solar PV
• Indika Energy, through PT Electra Mobilitas Indonesia, plans to develop two-
wheeler electric vehicle business in Indonesia.
Electric Vechicle
• Indika Energy, through Indika Multi Property is developing more than 24,000 ha
industrial forest area for the development of biomass – wood pellet and exploring
the potential carbon credit
Industrial Forestry

Strong Focus on and Commitment to ESG Initiatives
29
Environmental
✓ Comply with all Indonesian environmental laws,
regulations and standards
✓ Strong focus on five key elements
✓ Climate change (Greenhouse gas and carbon
emissions)
✓ Water & effluents
✓ Waste management
✓ Biodiversity conservation
✓ Environmentally friendly initiatives
✓ Environmentally friendly technologies at operations
✓ Ultra-supercritical coal-fired technology which reduces
CO2 emissions
✓ Solar panels at Kideco and CEP
✓ Low ash and sulfur Kideco coal relatively cleaner
burning
✓ Industry 4.0 (decreased materials, fuel and spare parts
usage)
✓ Environmental management practises recognized by
governments
✓ Kideco received Gold PROPER award from Ministry of
Environment and Forestry
✓ Promote green activities, including by partnering with
local communities
✓ Contribute to Indonesia’s wildlife protection efforts
Social Responsibility
✓ Focus on supporting long-term economic growth and
improving the quality of life in regions of operation
Governance
✓ Continuously implementing and improving good
corporate governance
✓ Recent addition of three individuals to Board of
Directors, including a female member (representing
20% of the board)
✓ Robust anti-bribery management system – Indika
Energy, IIR and Petrosea obtained ISO37001, while
the other subsidiaries are in the process of obtaining
✓ Complying with prevailing laws and regulations
Transparency
Accountability
Responsibility
Independence
Fairness & Equality
Corporate Principles
Education Develop education infrastructure
Provide scholarships and key skills
vocational training
Health and
Safety
Employees receive mandatory health
and safety specialized training
Comply with Indonesian safety and
health standards
Engage in programs to promote
healthier living in the community
Community
Significant portion of site workforce
from local areas
Support small community businesses
Sponsor infrastructure development in
local communities
Collaboration with key welfare
organisations (Indorelawan)
Intercultural Innovation Awards (UNAOC(1) and
BMW Group)1
“Achievements in promoting national tolerance and diversity”
(1) United Nations Alliance of Civilizations

Awards / Recognition/Certification
• Kideco has won Gold PROPER National Award from Ministry
of Environment and Forestry (KLH) - 2020
• Out of 2,038 national companies participated in the evaluation,
only 32 companies including Kideco received the Gold
award in Dec 2020
• Gold is the highest rank that given only for companies that
have demonstrated environmental excellence in their production
and services. They also have conducted business that is highly
ethical, socially responsible as well as commitment in
sustainability development.
PT Indika Energy Tbk has been ranked 1st in the Basic Materials
Sector of the 2020 Global Fixed-Income Investor Relations
ranking by Institutional Research for the following categories:
✓ 1st Best Investor Relation - High Yield (2019-2020)
✓ 1st Best Use of Debt – High Yield (2019-2020)
✓ 2nd Best Use of Debt – Investment Grade (Asia)
Evaluation were based on 5 areas:
1. Balance sheet transparency
2. Communication of strategy shifts
3. Clarity of debt covenant calculations and other provisions
4. Responsiveness to questions on debt ratings
5. Engagement with bondholders
Indika Group (including subsidiaries) has received ISO 37001
certification for anti bribery system at end of 2020
✓ Indika Energy Tbk (INDY)
✓ PT Kideco Jaya Agung
✓ Petrosea Tbk
✓ Tripatra
✓ Mitrabahtera Segara Sejati Tbk (MBSS)
✓ Indika Resources
✓ Interport

31
Our Commitment to the Environment
Lower Carbon Emission
Scope 1 GHG
emissions*
1,350,268 Ton CO2 eq
12.6%
Total energy usage**
13,573,347 GJ 6.8%
Total fuel
consumption***
466,587,377 liter
12.2%
GHG emission
intensity**
0,031
3,1%
Energy intensity
ratio**
0,41
3,3%
Efficient Use of Water
Total water
consumption*
4,546,611 M3
8.9%
Waste Management
Total usage of
recycled waste**
504.6 ton
73.1%
Total weight of
reused waste**
2,065.0 ton85.7%
Reclamation
Reclamation and
reforestation**
5,101.2Ha
9.1%
Biodiversity Preservation
Together with local organizations and communities,
we protect and preserve biodiversity, flora and
fauna. We monitor and minimize impact on
biodiversity through rehabilitation program,
reforestation, seed nursery, land reclamation and
develop conservation areas and wildlife corridors in
East Kalimantan.
Developing Solar PV panel for
Kideco camp and officeAll information in this page, based on activities in:
*) Kideco, Petrosea and Tripatra
**) Kideco
***) Kideco and Petrosea
32
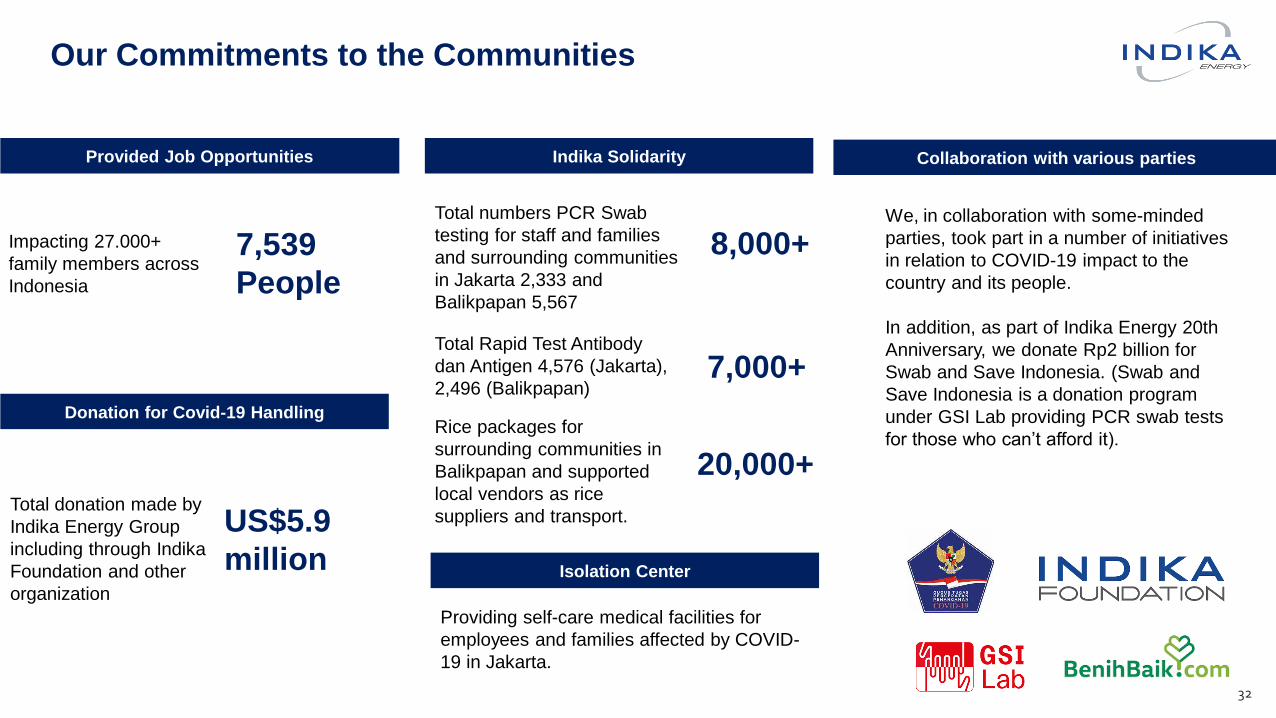
Our Commitments to the Communities
Provided Job Opportunities
Impacting 27.000+
family members across
Indonesia
7,539
People
Donation for Covid-19 Handling
Total numbers PCR Swab
testing for staff and families
and surrounding communities
in Jakarta 2,333 and
Balikpapan 5,567
8,000+
Indika Solidarity Collaboration with various parties
Total donation made by
Indika Energy Group
including through Indika
Foundation and other
organization
US$5.9
million
Total Rapid Test Antibody
dan Antigen 4,576 (Jakarta),
2,496 (Balikpapan) 7,000+
Rice packages for
surrounding communities in
Balikpapan and supported
local vendors as rice
suppliers and transport.
20,000+
Isolation Center
Providing self-care medical facilities for
employees and families affected by COVID-
19 in Jakarta.
We, in collaboration with some-minded
parties, took part in a number of initiatives
in relation to COVID-19 impact to the
country and its people.
In addition, as part of Indika Energy 20th
Anniversary, we donate Rp2 billion for
Swab and Save Indonesia. (Swab and
Save Indonesia is a donation program
under GSI Lab providing PCR swab tests
for those who can’t afford it).

33
Our Commitment to Good Governance
Strong Business Ethics
Obtained
ISO37001:2016 for Anti-
Bribery Management
System from British
Standard Institute
Transparency and Communication
with Investors
20%
Board Diversity Share Buyback
Voted by Institutional
Investor in the 2020
Global Fixed Income
Investor Relations survey
as: 1st Best Overall IR
(High-yield) and 2nd Best
Use of Debt in Asia
(Investment Grade), in
Basic Material Sector
+3New members of the
Board of Directors to
strengthen management
Dividend
Indika Energy distributed cash dividend of
Rp467.0 billion (Rp89,6 per share) from its
retained earnings to the shareholders.
The Company bought back 7.5 million shares with
avergae price of Rp 692.99 per share.Board of Directors is
Female
Rp 467.0 Billion
7,500,000 shares

Appendix
34

35
PT Indika Energy Tbk.
Energy Services Energy InfrastructureEnergy Resources
▪
-Established since 1991
-3rd largest coal producer
-Resources 1,625 MT, reserves
569 MT as of end Dec 2017
-91.0% ownership as of 6 Dec.
2017
▪
-Established since 1989
-Bituminous thermal & coking coal
-Resources 75.2 MT, reserves
40.6 MT
-85.0% ownership
▪
-Established since 2012
-Coal trading, ~7.0 MT volume
▪
-Established since 1994
- Integrated water coal transportation
and logistic
-51% ownership
▪
-Established since 2007
-20.0% owned 660MW, enviro-
friendly supercritical technology
-6.25% owned 1000MW expansion ,
ultra supercritical technology (under
construction)
▪
-Established since 2018
- Integrated logistic services
-Build and operate fuel storage
facility
-Port Business Entity license to
operate and provide port and logistic
services at all Indonesia major ports
▪
-Established since 1973
-Leading EPC and O&M services in
oil & gas and power generation
-100% ownership
▪
-Established since 1972
-Coal contract mining and E&C
capabilities in mining and oil and
gas
-69.8% ownership
Other Portfolios
▪
-Established since 2011
- Investment company in mineral
mining
-Developing gold project Awak Mas
in South Sulawesi
-Resources 2 million oz, reserves
1,1 million oz
-21% ownership
4321
Indika Energy, Indonesia’s leading fully integrated energy company
36
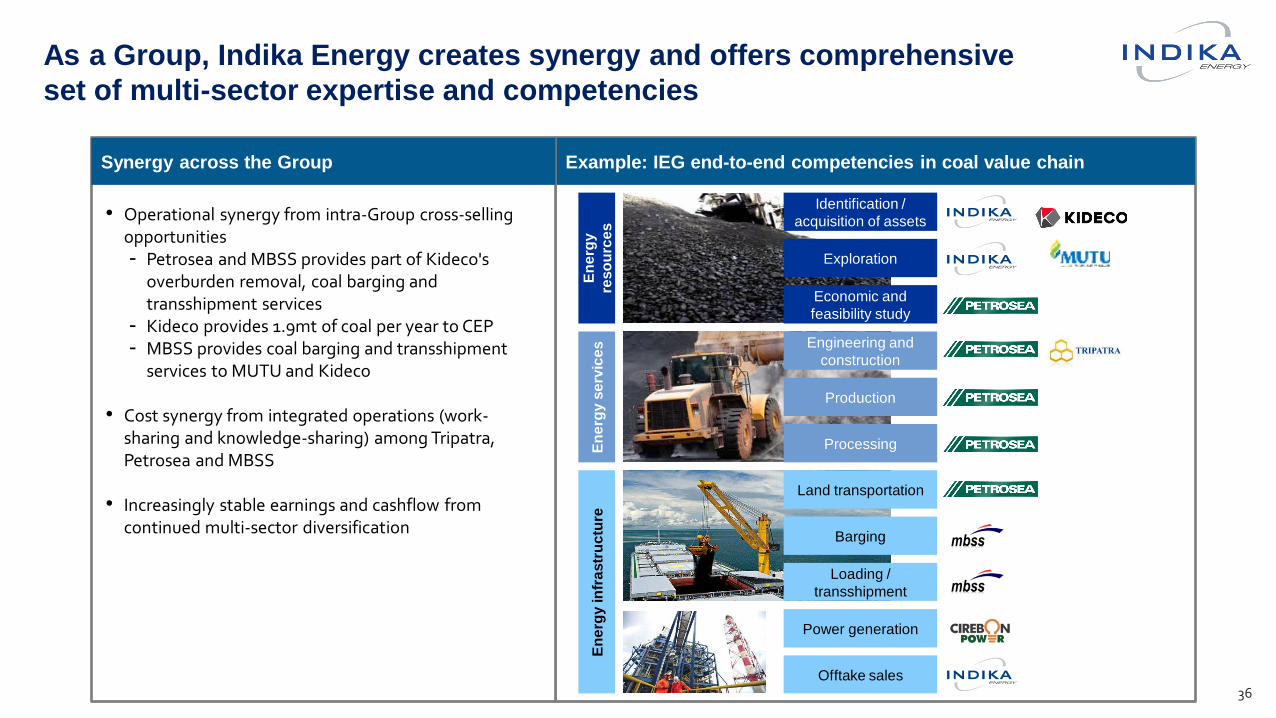
As a Group, Indika Energy creates synergy and offers comprehensive
set of multi-sector expertise and competencies
Example: IEG end-to-end competencies in coal value chain
En
erg
y
reso
urc
es
En
erg
y s
erv
ice
sE
ne
rgy in
fra
str
uc
ture
Identification /
acquisition of assets
Exploration
Economic and
feasibility study
Engineering and
construction
Production
Processing
Land transportation
Barging
Loading /
transshipment
Power generation
Offtake sales
• Operational synergy from intra-Group cross-selling opportunities- Petrosea and MBSS provides part of Kideco's
overburden removal, coal barging and transshipment services
- Kideco provides 1.9mt of coal per year to CEP- MBSS provides coal barging and transshipment
services to MUTU and Kideco
• Cost synergy from integrated operations (work-sharing and knowledge-sharing) among Tripatra, Petrosea and MBSS
• Increasingly stable earnings and cashflow from continued multi-sector diversification
Synergy across the Group

Total Backlog Total Backlog Total Backlog 660MW Power Plant
$760.0M $91.7M $136.4M
3M21 Net Income 3M21 Net Income 3M21 Net Income 3M21 Net Income
$3.8M - $1.6M -$19.3M $2.3M (20% Indika)
3M21 EBITDA Margin 3M21 EBITDA Margin 3M21 Adj. EBITDA Margin 3M21 EBITDA Margin
24.4% 28.2% -42.5% 31.7%
ROE ROE ROE ROE
6.5% - 9.6% -36.9% 6.1%
37
Indika Energy Subsidiary Results
Petrosea MBSS Tripatra Cirebon Electric Power
• Coal contract mining and E&C
capabilities
• Opportunity to increase group
synergies by winning more Kideco
contracting share
• 69.8% ownership
• Integrated coal transport & logistics
business
• Consists of 78 barges, 87 tugboats,
1 support vessel, 4 floating cranes
and 2 floating loading facilities
• 51% ownership
• Multi-disciplined engineering/EPC
and project capabilities
• Two subsidiaries:
1. PT Cotrans Asia – 45% stake
barging / transportation business
2. PT Sea Bridge Shipping – 46%
stake; domestic coal
transshipment for Kideco
• Kideco cross sells approximately
1.7MT to CEP annually
• Indika’s portion of net income in
FY19 is US$6.9M
• 20% ownership of CEP
• 6.25% ownership of CEP II
(expansion project)

Indika Energy’s Subsidiaries Backlog
38
Descriptions
Remaining
Contract Value
New Contract/
Adjustment ValueRevenue
Recognition
Remaining
Contract Valuein 2020
Per 31 Dec 2020 Per 31 Mar 2021 Per 31 Mar 2021
Petrosea
Contract mining 750.6 4.3 64.0 690.9
E&C 47.3 3.3 12.8 37.8
POSB 32.1 2.7 3.5 31.3
Total (USD mn) 830 10.3 80.3 760.0
Tripatra
Tripatra Engineers & Constructors 129.2 23.5 34.3 118.4
Tripatra Engineering 17.8 4.8 4.7 18.0
Total (USD mn) 147.0 28.4 39.0 136.4
MBSS
Barging 47.6 13.5 10.7 50.4
Floating Crane 44.9 0.8 4.5 41.2
Total (USD mn) 92.5 14.4 15.2 91.7
Total Consolidated (USD mn) 1,069.5 53.1 134.5 988.1

39
Indika Energy’s Financial Highlights
Gross Profit (USD mn) Operating Profit (USD mn)
Income from Associates (USD mn)Core Profit/Loss**
(USD mn)
Net Profit/Loss*(USD mn)
* Profit/loss for the period attributable to owners of the company** Core Profit refers to the current year’s profit attributable to the owner of the company, excluding non-operating gains / losses and related taxes
(amortization of intangible assets, impairment of assets, fair value changes on contingent consideration obligation, gain on revaluation, acceleration on
amortization of bond issuance cost, gain from bargain purchase).
.
Revenues (USD mn)
1,098.8
2,962.9
2,079.9 2,077.2
582.2
-
500.0
1,000.0
1,500.0
2,000.0
2,500.0
3,000.0
3,500.0
2017 2018 2019 2020 3M21
122.9
641.2
426.7
253.9
120.9
0
130
260
390
520
650
780
2017 2018 2019 2020 3M21
34.1
508.1
289.5
115.984.9
0
100
200
300
400
500
600
700
800
2017 2018 2019 2020 3M21
136.2
20.6 30.0 32.6
8.9
0
40
80
120
160
2017 2018 2019 2020 3M21
335.5
80.1
(18.2)(117.5) (9.4)
-120
-20
80
180
280
380
2017 2018 2019 2020 3M21
94.5
168.4
75.5
(52.2)
12.5
-100
-50
0
50
100
150
200
2017 2018 2019 2020 3M21

Gross Debt & Net Debt / LTM Adj. EBITDA (x)
LTM Adj. FCF / Debt (%)
Debt / Capital (%)
40
Indika Energy’s Key Business and Credit Ratios
LTM Adj EBIT / Interest (x)
LTM Adj EBITDA* (USD mn) & LTM Adj EBITDA
Margin (%)
LTM Adj EBIT (USD mn) & EBIT Margin (%)
291.9
652.5
436.0
274.1 313.6
26.6%
15.6%15.7%
13.2%
15.5%
0.0%
5.0%
10.0%
15.0%
20.0%
25.0%
30.0%
-
200.0
400.0
600.0
800.0
1,000.0
2017 2018 2019 2020 3M21
EBITDA EBITDA Margin
330.8
519.9
298.7
132.7 158.0
30.1%
17.5%
10.7%6.4%
7.8%
0.0%
5.0%
10.0%
15.0%
20.0%
25.0%
30.0%
35.0%
0.0
200.0
400.0
600.0
800.0
1000.0
2017 2018 2019 2020 3M21
Adj. EBIT EBIT Margin
4.9
2.3
3.5
6.2
5.3
2.4
1.1
1.9
3.3 2.9
-
1.0
2.0
3.0
4.0
5.0
6.0
7.0
2017 2018 2019 2020 3M21
56.4% 56.7%
59.9%
66.1% 65.8%
50.0%
52.0%
54.0%
56.0%
58.0%
60.0%
62.0%
64.0%
66.0%
68.0%
2017 2018 2019 2020 3M21
0.4
5.1
2.6
1.1 1.2
0.0
1.0
2.0
3.0
4.0
5.0
6.0
2017 2018 2019 2020 3M21
15.7%
21.9%
13.0%
10.4%
13.4%
0.0%
5.0%
10.0%
15.0%
20.0%
25.0%
2017 2018 2019 2020 3M21

39.0
32.1 32.034.0 34.3 33.0
30.0
4.0
2015 2016 2017 2018 2019 2020 2021F
Actual Gov Approval Additional Target
41
Kideco – Leading Coal Producer in Indonesia
SM 4200-4300 Kcal
65%
Blended 4500 Kcal
8%
Roto 4900 Kcal
27%
Kideco Product Mix Kideco Production
Million Ton
34.0
Kideco Sales – by country
• Third largest coal producer in Indonesia
• Environmental friendly thermal coal with ultra-low sulphur of 0.1% and low ash of
(2.1% to 4.9%)
• Attractive location with well-built infrastructure, and integrated value chain within
the group, allowing for strong control over operation
• Low cost coal producer
• Resources of 1,550 MT and reserves of 531 MT based on JORC report Dec 2019
• Geographically diversified customer base
China37%
Indonesia34%
Korea2%
India10%
Taiwan2%
Southeast Asia14%
Japan0%
Others1%

42
Kideco’s Financial Highlights
Revenues (USD mn) Gross Profit (USD mn) Operating Profit (USD mn)
Net Profit (USD mn) EBITDA (USD mn) Cash Balance (USD mn)
1,633.0
1,802.2
1,574.2
1,249.5
414.9
0
400
800
1,200
1,600
2,000
2017 2018 2019 2020 3M21
527.8492.1
248.5
177.2
103.7
0
100
200
300
400
500
600
2017 2018 2019 2020 3M21
469.4450.3
208.2
138.3
91.7
0
100
200
300
400
500
2017 2018 2019 2020 3M21
277.1260.1
119.8
75.4
51.1
0
50
100
150
200
250
300
2017 2018 2019 2020 3M21
526.0489.5
245.7
160.7
97.2
0.0
100.0
200.0
300.0
400.0
500.0
600.0
2017 2018 2019 2020 3M21
144.4
171.3
114.3
187.5
212.1
0
50
100
150
200
250
2017 2018 2019 2020 3M21

43
Kideco’s Operational Highlights
Cash Cost Breakdown Coal Production (mn ton) Coal Sales (mn ton)
Stripping Ratio (x) Average Selling Price (USD/ton) Cash Cost (USD mn)
Contract Mining + Rental54%
Gov. Royalty
17%
Material9%
Freight7%
O/H11%
Labor1%
Others1%
32.034.0 34.3 33.0
9.1
0.0
15.0
30.0
45.0
2017 2018 2019 2020 3M21
31.534.1 34.9
33.0
9.2
0
15
30
45
2017 2018 2019 2020 3M21
6.1 6.3 6.35.7
5.2
0
2
4
6
8
2018 2018 2019 2020 3M21
51.9 52.9
45.1
37.8
45.2
0.0
15.0
30.0
45.0
60.0
2017 2018 2019 2020 3M21
34.437.8 37.3
31.833.3
28.030.9 31.2
27.0 27.6
2017 2018 2019 2020 3M21
Incl Royalty Excl Royalty

Kideco’s Operational Highlights
44
Summary P&L (US$mn)Quarter Data
1Q21 1Q20 YoY 4Q20 QoQ
Sales 414.9 376.4 10.3% 330.9 25.4%
Gross profit 103.7 67.6 53.4% 47.5 118.2%
Operating profit 91.7 56.9 61.2% 37.2 146.3%
Net income 51.1 25.1 103.5% 21.4 139.0%
EBITDA 97.2 62.3 56.0% 42.8 127.2%
Gross margin 25.0% 18.0% 39.2% 14.4% 74.0%
Operating margin 22.1% 15.1% 46.2% 11.2% 96.4%
Net margin 12.3% 6.7% 84.5% 6.5% 90.6%
EBITDA margin 23.4% 16.6% 41.5% 12.9% 81.2%
Overburden (mn bcm) 47.6 46.5 2.4% 45.6 4.3%
Production volume (Mt) 9.1 8.8 3.6% 9.1 0.1%
Sales volume (Mt) 9.2 8.8 4.9% 9.4 -1.9%
Stripping ratio (X) 5.2 5.3 -1.2% 5.0 4.3%
Cash Cost excl royalty (US$/ton) 27.6 29.4 -6.3% 25.4 8.6%
Average selling price (US$/ton) 45.2 43.0 5.1% 35.4 27.8%

Peer Comparison (FY20 Data)
45
EBITDA MARGIN
PRODUCTION ANNUAL (MT) STRIP RATIO (x)
RESERVE/RESOURCE RATIO
CASH COSTS ex Royalty (US$/t)
Domestic Sales/ Total (DMO 25%)
*Kideco only
DMO requirement
55
33
25
18
0
10
20
30
40
50
60
ADRO INDY * PTBA ITMG
4.43.8
5.7
10.1
0
2
4
6
8
10
12
PTBA ADRO INDY * ITMG
35%
25%
16%13%
0%
5%
10%
15%
20%
25%
30%
35%
40%
ADRO PTBA ITMG INDY*
54%
33%
22%18%
0%
10%
20%
30%
40%
50%
60%
PTBA INDY ADRO ITMG
16%
22%
31%
40%
0%
5%
10%
15%
20%
25%
30%
35%
40%
45%
ITMG ADRO INDY PTBA
36 39
33
53
-
10
20
30
40
50
60
ADRO PTBA INDY * ITMG

46
Petrosea’s Financial Highlights (1)
Revenues (USD mn)
*
EBITDA (USD mn)Coal Getting Volume (MT) Net Profit/Loss* (USD mn)
Gross Profit (USD mn) Overburden Removal (mbcm)
313.5
465.7 476.4
340.7
91.1
0
100
200
300
400
500
600
2017 2018 2019 2020 3M21
45.7
73.1
81.1 74.9
14.2
0
20
40
60
80
100
2017 2018 2019 2020 3M21
97.6
121.1 123.5
94.4
27.6
0
35
70
105
140
2017 2018 2019 2020 3M21
24.8
34.6
31.0
26.7
7.8
0
8
16
24
32
40
2017 2018 2019 2020 3M21
74.6
116.8127.1
112.9
23.0
0
30
60
90
120
150
2017 2018 2019 2020 3M21
11.6
23.4
31.3 32.5
3.8
0.0
15.0
30.0
45.0
2017 2018 2019 2020 3M21

47
Petrosea’s Financial Highlights (2)
*
Revenues Breakdown by Value
*Cost Structure
3M21: US$91.1 mn 3M21: US$103.6 mn
3M21: US$77.7 mn 3M20: US$84.3 mn
Contract Mining50.5%
E&C10.1%
POSB2.8%
KPI28.6%
Others8.1%
Contract Mining58.1%
E&C22.4%
POSB8.1%
KPI10.2%
Other1.2%
Salary32.6%
Operations25.4%
Depre20.0%
Subs & Rental12.7%
Rental1.5%
Amortization0.6%
Material4.9%
Other2.3%
Salary31.0%
Operations24.8%
Depre19.6%
Subs & Rental17.0%
Rental3.5%
Amortization0.2%
Material2.2%
Other1.7%
48
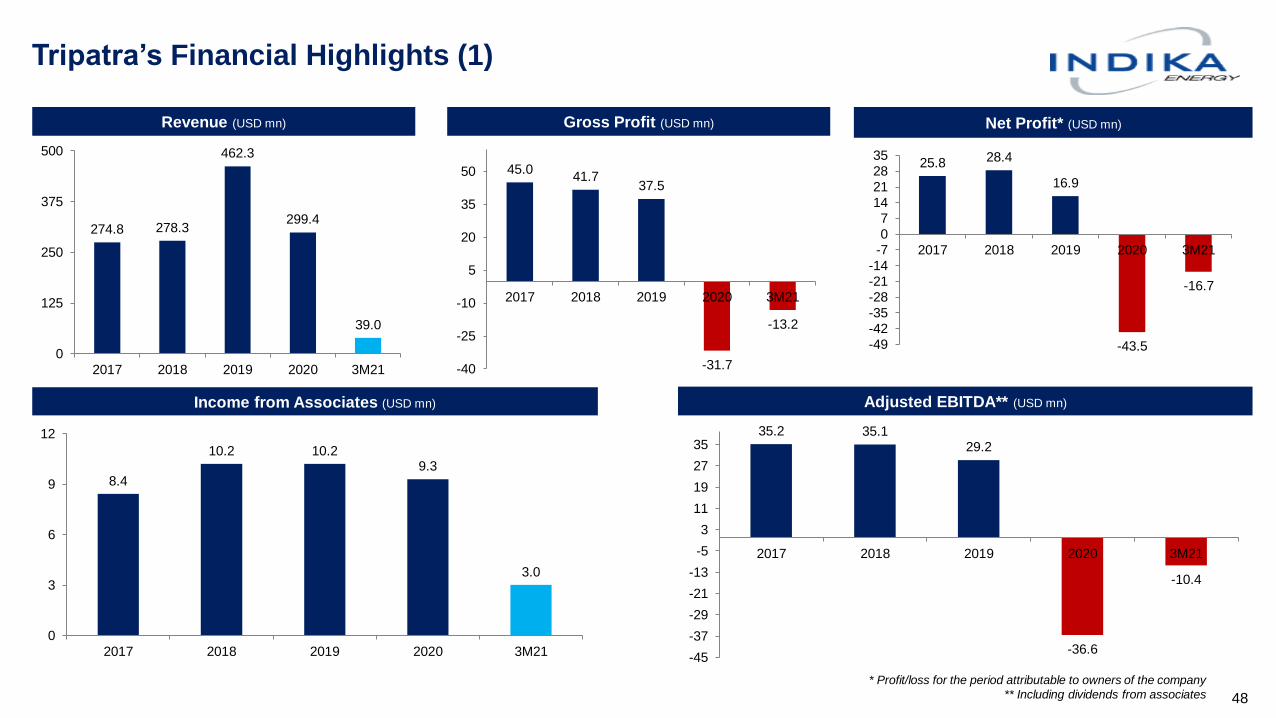
Tripatra’s Financial Highlights (1)
* Profit/loss for the period attributable to owners of the company
** Including dividends from associates
Month/year Month/year
Revenue (USD mn) Gross Profit (USD mn) Net Profit* (USD mn)
Income from Associates (USD mn)
Month/year Month/year
Adjusted EBITDA** (USD mn)
274.8 278.3
462.3
299.4
39.0
0
125
250
375
500
2017 2018 2019 2020 3M21
45.041.7
37.5
-31.7
-13.2
-40
-25
-10
5
20
35
50
2017 2018 2019 2020 3M21
8.4
10.2 10.29.3
3.0
0
3
6
9
12
2017 2018 2019 2020 3M21
35.2 35.129.2
-36.6
-10.4
-45
-37
-29
-21
-13
-5
3
11
19
27
35
2017 2018 2019 2020 3M21
25.8 28.4
16.9
-43.5
-16.7
-49
-42
-35
-28-21
-14
-7
0
714
21
28
35
2017 2018 2019 2020 3M21

49
Tripatra’s Financial Highlights (2)
*
Revenues Breakdown by Value
Cost Structure
3M21: US$39.0mn 3M20 : US$100.3mn
3M21 US$52.1 mn 3M20: US$93.2 mn
TPEC88.0%
TPE12.0%
TPEC92.0%
TPE8.0%
Material18.6%
Sub Contractors
39.3%
Salary6.2%
Handling1.2%
Rental9.7%
Others25.0%
Material41.1%
Sub Contractors
30.0%
Salary6.1%
Handling4.5%
Rental7.8%
Others10.4%

50
MBSS’ Financial Highlights (1) *
Revenues (USD mn)
Net Profit (USD mn)
EBITDA (USD mn)
Floating Crane Vol. (mn ton)Barging Vol. (mn ton)
Gross Profit (USD mn)
68.5 75.4 77.8
54.9
15.2
-
25.0
50.0
75.0
100.0
2017 2018 2019 2020 3M21
2.5
4.9
18.4
3.9
1.3
0
4
8
12
16
20
2017 2018 2019 2020 3M21
18.4
24.0
27.7
14.8
4.39
0
5
10
15
20
25
30
2017 2018 2019 2020 3M21
-8.9
-18.2
4.3
-14.9
-1.6
-20
-15
-10
-5
0
5
10
15
20
2017 2018 2019 2020 3M21
18.5
22.1
25.1 24.6
6.0
0
5
10
15
20
25
30
2017 2018 2019 2020 3M21
8.7
11.810.1
8.1
2.1
0
5
10
15
20
25
2017 2018 2019 2020 3M21

51
MBSS’ Financial Highlights (2)
*
Revenues Breakdown
*Cost Structure
3M21: US$13.9 mn 3M20: US$14.8mn
3M21 US$15.2mn 3M20: US$13.0mn
Barging70%
FC 30%
Barging73%
FC 27%
Depreciation37%
Fuel16%
Salaries12%
Port charges5%
Spareparts12%
Insurance2%
Others16%
Depreciation36.7%
Fuel15.6%
Salaries12.6%
Port charges7.7%
Spareparts13.5%
Insurance2.6% Others
11.3%

Indika Resources’ Financial Highlights
Revenues (USD mn)
Net Profit (USD mn)
Gross Profit (USD mn)
MUTU Production Vol. (mn ton)Coal Trading Vol. (mn ton)
Cost of Good Sold (USD mn)
52
319.8
398.8
325.9
192.9
56.2
-
50.0
100.0
150.0
200.0
250.0
300.0
350.0
400.0
450.0
2017 2018 2019 2020 3M21
306.5
359.4
300.8
167.9
41.8
-
50.0
100.0
150.0
200.0
250.0
300.0
350.0
400.0
2017 2018 2019 2020 3M21
13.3
36.2
21.3 22.6
14.4
-
5.0
10.0
15.0
20.0
25.0
30.0
35.0
40.0
2017 2018 2019 2020 3M21
(142.4)
2.4 4.3 2.2 8.7
(160.0)
(120.0)
(80.0)
(40.0)
-
40.0
2017 2018 2019 2020 3M216.8
8.4
6.5
4.3
0.7
0
2
4
6
8
10
2017 2018 2019 2020 3M21
0.5
1.2
1.6
1.3
0.5
0
0.5
1
1.5
2
2017 2018 2019 2020 3M21
53
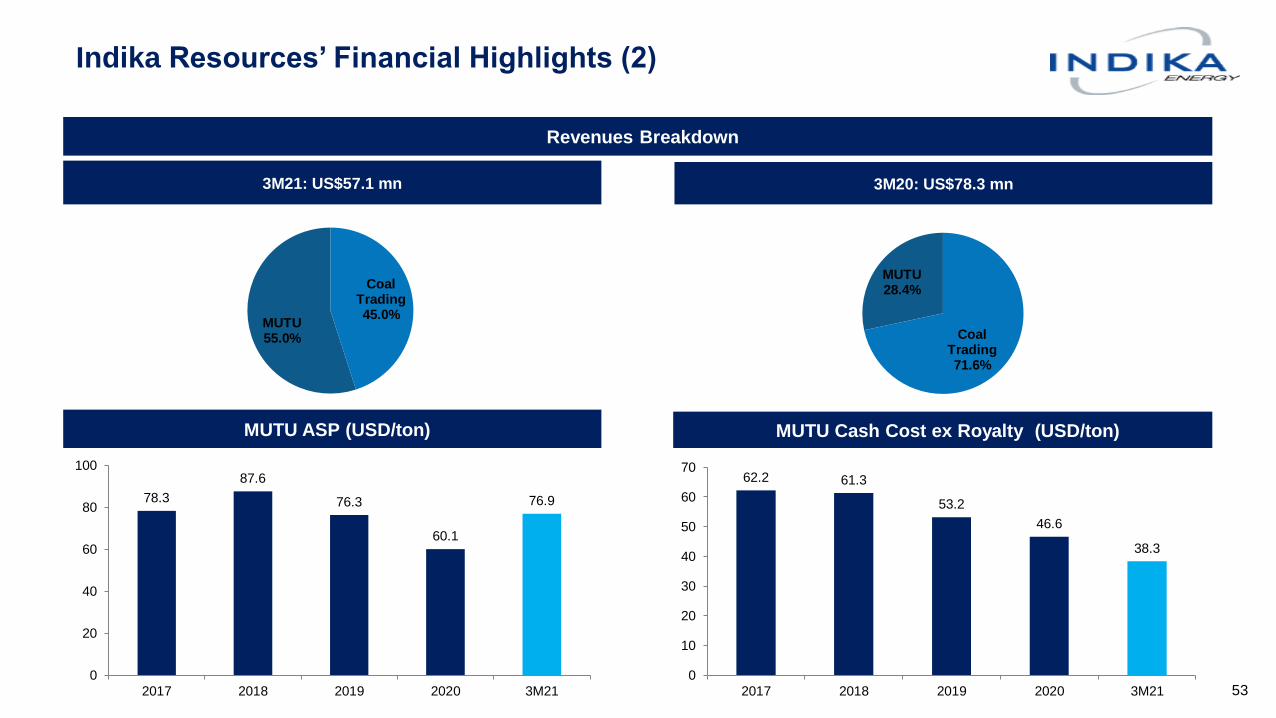
Indika Resources’ Financial Highlights (2)
*
Revenues Breakdown
*MUTU ASP (USD/ton)
3M21: US$57.1 mn 3M20: US$78.3 mn
MUTU Cash Cost ex Royalty (USD/ton)
Coal Trading45.0%
MUTU55.0% Coal
Trading71.6%
MUTU28.4%
78.3
87.6
76.3
60.1
76.9
0
20
40
60
80
100
2017 2018 2019 2020 3M21
62.2 61.3
53.2
46.6
38.3
0
10
20
30
40
50
60
70
2017 2018 2019 2020 3M21
54
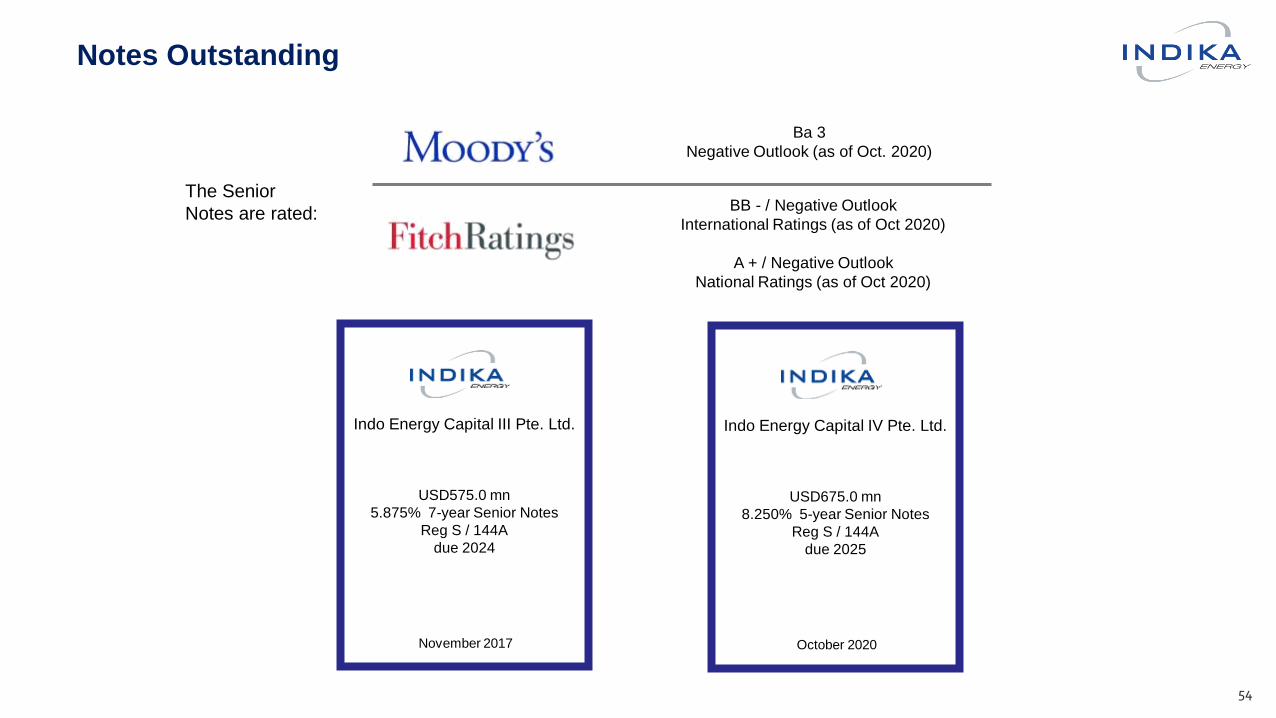
Notes Outstanding
The Senior
Notes are rated:BB - / Negative Outlook
International Ratings (as of Oct 2020)
A + / Negative Outlook
National Ratings (as of Oct 2020)
Ba 3
Negative Outlook (as of Oct. 2020)
Indo Energy Capital IV Pte. Ltd.
USD675.0 mn
8.250% 5-year Senior Notes
Reg S / 144A
due 2025
October 2020
Indo Energy Capital III Pte. Ltd.
USD575.0 mn
5.875% 7-year Senior Notes
Reg S / 144A
due 2024
November 2017
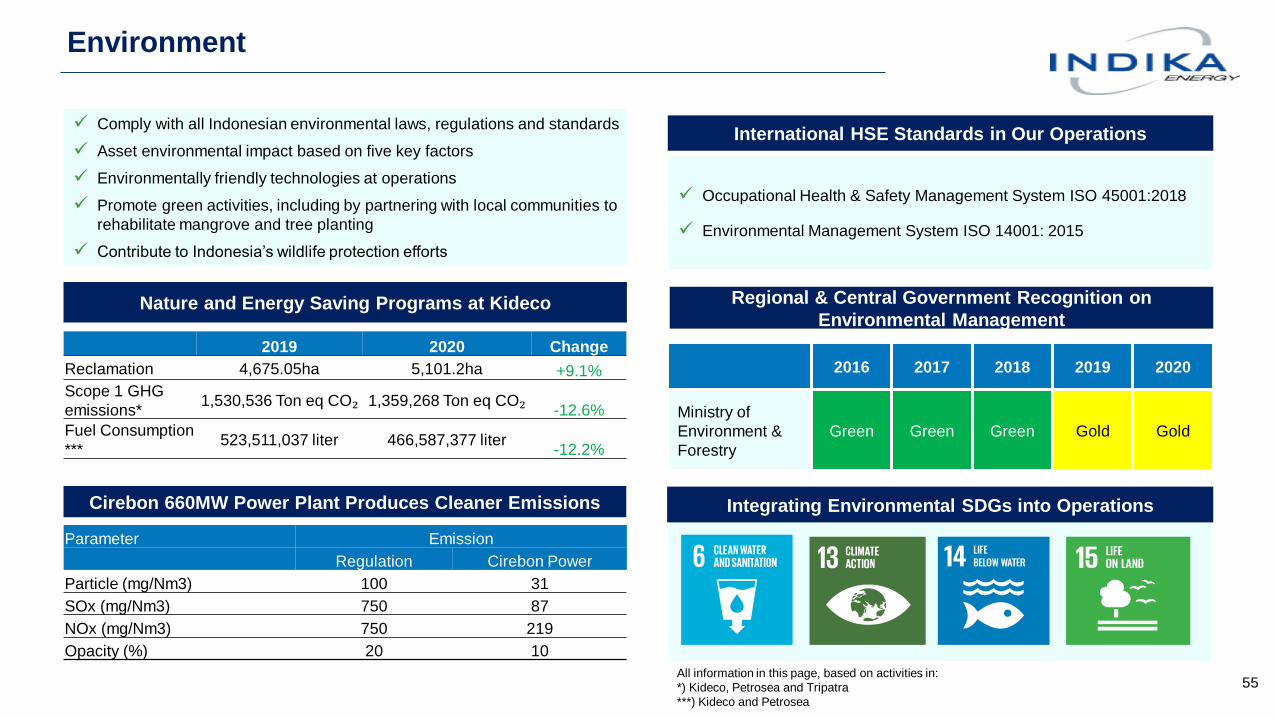
Environment
55
Integrating Environmental SDGs into Operations
Regional & Central Government Recognition on
Environmental Management
2016 2017 2018 2019 2020
Ministry of
Environment &
Forestry
Green Green Green Gold Gold
International HSE Standards in Our Operations
✓ Occupational Health & Safety Management System ISO 45001:2018
✓ Environmental Management System ISO 14001: 2015
✓ Comply with all Indonesian environmental laws, regulations and standards
✓ Asset environmental impact based on five key factors
✓ Environmentally friendly technologies at operations
✓ Promote green activities, including by partnering with local communities to
rehabilitate mangrove and tree planting
✓ Contribute to Indonesia’s wildlife protection efforts
Parameter Emission
Regulation Cirebon Power
Particle (mg/Nm3) 100 31
SOx (mg/Nm3) 750 87
NOx (mg/Nm3) 750 219
Opacity (%) 20 10
Cirebon 660MW Power Plant Produces Cleaner Emissions
Nature and Energy Saving Programs at Kideco
2019 2020 Change
Reclamation 4,675.05ha 5,101.2ha +9.1%
Scope 1 GHG
emissions*1,530,536 Ton eq CO₂ 1,359,268 Ton eq CO₂
-12.6%
Fuel Consumption
***523,511,037 liter 466,587,377 liter
-12.2%
All information in this page, based on activities in:
*) Kideco, Petrosea and Tripatra
***) Kideco and Petrosea

Social Responsibility
56
Education
Develop education infrastructure
Provide scholarships and key skills vocational training
Engineering camps
Provide computer literacy and education equivalency programs for school
students
Educational programs for remote indigenous people and marginalized
communities
Health and Safety
Engage in programs to promote healthier living in the community
Working with local governments on managing COVID-19 pandemic
Comply with Indonesian health and safety standards
HSE management system in accordance with OHSAS 18001:2007
Employees receive mandatory health and safety specialized training
Personal protective equipment provided for all employees
Established emergency medical facility at mine sites
Established committee who review Occupational, Health and Safety issues
Community
Empowerment
Significant portion of site workforce from local areas
Donate to local schools in communities surrounding our operations
Entrepreneurship programs
Assist in disaster relief programs
Support small community businesses (capacity building and microfinancing)
Sponsor infrastructure development in local communities
Key Initiatives
Protect health and wellbeing of Indika’s people and have a positive impact in the community
Indika Foundation
✓ Established in 2017
✓ Key initiatives and programs
✓ Education
✓ Health
✓ Community and economic empowerment
✓ Promoting national peace and tolerance
Intercultural Innovation Awards (UNAOC(1) and BMW Group)1
“Achievements in promoting national tolerance and diversity”
(1) United Nations Alliance of Civilizations

Governance
57
✓ Continuously implementing and improving good corporate governance
✓ Recent addition of three individuals to Board of Directors, including a
female member (representing 20% of the board)
✓ Women in key executive positions increased from 8% to 12% in 2019
✓ Robust anti-bribery management system – Indika Energy, IIR and Petrosea
obtained ISO37001 while other subsidiaries are in the process of obtaining
✓ Complying with prevailing laws and regulations, including those established
by the OJK(1) and Indonesian Stock Exchange
Recognition on Transparency and Disclosure to Stakeholders
Ranked 1st Most Honoured Company (basic materials sector) in 2019 –
from Institutional Investor
Awarded The Best Public Company, Energy sector in 2019 – from CNBC
Indonesia
Criteria Evaluation:
Balance sheet transparency
Communication strategy shifts
Clarity on debt covenant calculation and other provisions
Responsiveness to questions on debt ratings
Engagement with bondholders
High Commitment on
GCG Principles
Commitment to Highly Ethical Business
Practices
1. Transparency
2. Accountability
3. Responsibility
4. Independency
5. Fairness & Equality
1. High integrity in business
2. Mandatory integrity pact for all employees
3. Anti-corruption and Anti-bribery
4. Whistle blowing system
5. Avoiding conflicts of interest
Organisational Structure
General Shareholders’
Meeting
Board of Commissioners
Board of Directors
Managing Director/ CEO
Management Executives
Human Capital
Committee
Audit, Risk &
Compliance Committee
Project & Investment
Committee
Corporate Secretary
Internal Audit
CEO Office
(1) Otoritas Jasa Keuangan (Financial Services authority)
Protocols in place for the supervision and assessment of the
Board of Commissioners and Board of Directors