indirect medical education p are too hig - gao.gov · payments among teaching and nonteaching...
TRANSCRIPT

United States General Accounting Office
GAO 1 Report to Congressional Committees
January 1989 MEDICARE ~ ,.,\J Indirect Medical Education P Are Too Hig
nts
GAO/HRD-89-33 ..$

-. . *
About Our New Cover... The new color of our report covers represents the latest step in GAO’s efforts to improve the presentation of our reports.

Human Resources Division
B-233646
January 5,1989
The Honorable Lloyd Bensten Chairman, Committee on Finance United States Senate
The Honorable John D. Dingell Chairman, Committee on Energy and Commerce House of Representatives
The Honorable Dan Rostenkowski Chairman, Committee on Ways and Means House of Representatives
In accordance with the requirements of section 9202(d)(l) of the Consolidated Omnibus Budget Reconciliation Act of 1985, we examined the variation in Medicare costs and payments among teaching and nonteaching hospitals and identified the factors that explain such variation. Our analysis shows that the add-on payments to teaching hospitals for the indirect cost of medical education are too high, and the report recommends that the Congress reduce the teaching adjustment factor, which helps determine these payments.
The report reflects comments from the Department of Health and Human Services and the Association of American Medical Colleges.
We are sending copies of this report to interested congressional committees and subcommittees; the Director, Office of Management and Budget; the Secretary of Health and Human Services; and other interested parties.
This report was prepared under the direction of Michael Zimmerman, Senior Associate Director. Other major contributors are listed in appendix V.
Lawrence H. Thompson Assistant Comptroller General
Executive Summaxy
Purpose Under Medicare’s prospective payment system (Pm), teaching hospitals receive extra payments as compensation for higher patient care costs associated with providing graduate medical education. In fiscal year 1986, the additional payments to teaching hospitals were about $2.1 bil- lion, of which $1 billion represents compensation for direct medical edu- cation costs and $ 1 , 1 billion represents compensation for the indirect cost of medical education.
Section 9202 of the Consolidated Omnibus Budget Reconciliation Act of 1985 required GAO to study the variation in Medicare payments (1) among hospitals with large teaching programs and those with smaller teaching programs and (2) between teaching and nonteaching hospitals.
Because variations in Medicare payments among hospitals should ulti- mately be explained by factors that affect hospital costs, GAO'S specific objectives were to (1) measure the differences in costs among major teaching, minor teaching, and nonteaching hospitals (see p. 16); (2) examine the factors explaining these differences, including the extent to which having a graduate medical education program contributes to the differences; and (3) estimate the size of the adjustment needed to com- pensate teaching hospitals for the indirect cost of medical education.
Background Medicare payments to hospitals for inpatient hospital services totaled about $45.6 billion in fiscal year 1986. This included PPS payments to all hospitals for their operating costs and separate payments for their capi- tal costs. In addition, under Medicare, teaching hospitals were compen- sated for the additional direct and indirect costs of their graduate medical education programs.
Medicare compensates teaching hospitals on a per-resident basis for its share of the direct costs of providing medical education-such as salaries and fringe benefits for residents and teaching physicians. (See p. 11.)
The indirect cost of medical education represents the portion of the higher patient care costs thought to be due to such factors as increased diagnostic testing, increased number of procedures performed, higher staffing ratios, and increased record keeping. Medicare reimburses teaching hospitals for these costs through an adjustment that increases the amount of their normal PPS payments.
P8ge 2 GAO/HBo8939 Medicare Medical Education Payments

Executive Summary
Results in Brief
The adjustment is based on the number of interns and residents per hos- pital bed (intern-to-bed ratio) and a statistically estimated factor repre- senting the incremental patient care cost of providing graduate medical education. The Technical and Miscellaneous Revenue Act of 1988 sets the adjustment factor at 7.65 percent for fiscal years 1989-95 and at 8.29 percent beginning in fiscal year 1996.
- The higher costs at teaching hospitals are explained largely by the same factors that explain cost differences among all hospitals. Teaching hos- pitals are more frequently located in urban areas, where the costs of labor and purchased goods and services are higher than in rural areas. In addition, patients at teaching hospitals generally have conditions that are more costly than average to treat. Even after accounting for these factors, however, teaching hospitals have higher costs than do non- teaching hospitals. This residual cost difference has been attributed to the indirect cost of medical education.
The PPS payment formula accounts for the effects of some of the sources of hospital cost variation through adjustments for local wages, patient mix, and urban/rural location. However, some of the adjustments are imperfect, and other sources of cost variation are not accounted for in the PPS formula. These shortcomings tend to affect teaching hospitals disproportionately.
To compensate for the indirect cost of medical education-and partially for the shortcomings in the PPS formula-the statute provides that the fiscal years 1989-95 PPS payments to teaching hospitals are to be increased by 7.65 percent for each increment of 0.1 in the intern-to-bed ratio.
GAO estimates that if the PPS formula were expanded to incorporate other relevant cost factors not now considered explicitly, and if the fac- tors now considered were measured more accurately, the remaining cost variation associated with providing graduate medical education justifies an adjustment factor of only 3.73 percent. Considering only the cost fac- tors currently used in the formula, but measuring them more accurately, GAO estimates that the proper adjustment factor is 5.09 percent. On the other hand, if the teaching adjustment is to be used to compensate for the partial effect of factors not explicitly recognized by PPS as well as for shortcomings in the PPS rates, GAO estimates that the adjustment factor should be 6.26 percent.
Page3 GAO/HRD89-33Med-MedicalEducation Pa)mrnts
Jbecutive Summary
GAO believes that the most appropriate factor for fiscal years 1989-95 is 5.09 percent but observes that all of the estimates are lower than the factor currently contained in the statute.
Current law provides that in fiscal year 1996, when another change is to occur in the structure of the basic PPS payment formula, the indirect medical education factor is to be increased to 8.29 percent. GAO esti- mates that under the formula scheduled to take effect in 1996, the adjustment factor should be set within the range from 3.73 to 7.19 per- cent, depending on how other sources of cost variation are handled in the formula; GAO believes that an adjustment factor of 6.06 percent would be most appropriate after 1995.
GAO’s Analysis Hospital cost reports for 1985 show that the average operating cost per Medicare discharge at major teaching hospitals was $5,393, compared to $3,852 at minor teaching hospitals, and $2,829 at nonteaching hospitals. (See p. 18.)
GAO'S analysis showed a direct relationship between the level of hospital Medicare costs and such factors as hospital patient mix, size, and loca- tion. For example, major teaching hospitals tend to have patients that, on average, are about 17 percent more costly to treat than those at non- teaching hospitals, and patients at minor teaching hospitals are about 11 percent more costly to treat than those at nonteaching hospitals. Like- wise, 53 percent of the major teaching hospitals in the GAO analysis were located in the high-cost central city of the largest metropolitan statisti- cal areas (a population greater than 1 million), as compared to 31 per- cent of the minor teaching hospitals, and only 6 percent of the nonteaching hospitals. (See pp. 19-22.)
However, GAO'S analysis of hospital Medicare costs showed that after accounting for case mix, location, and size, teaching hospitals had higher patient care costs than nonteaching hospitals. Using a data base contain- ing hospital costs and other information on 8 million fiscal year 1985 Medicare discharges from 5,408 hospitals, GAO applied standard statisti- cal techniques to estimate the relationship between graduate medical education and Medicare operating cost per discharge while simultane- ously controlling for and measuring the effect of other cost-related fac- tors. GAO used a number of different models and examined the policy implications of each.
Page 4 GAO/HBD&933 Medicare Medical Education Paymenti

Executive Summary
The GAO analysis shows that the estimated effect of teaching on Medi- care costs is smaller or larger depending on what factors are included in the analysis and how they are measured. Including only those factors used in setting the PPS payment rates and measuring them at values cur- rently used in the PPS rates produces higher estimates of the effect of teaching. These estimates are higher because they pick up the partial effect of factors not explicitly recognized by PPS as well as the partial effect of shortcomings in the current PFS rates. Conversely, including more of the relevant cost factors that explain hospital cost differences, and excluding the influences of shortcomings in the PPS rates, produces lower estimates that are probably closer to the “true” indirect cost of medical education. (See pp. 23-3 1.)
Recommendations to The Congress should reduce the teaching adjustment factors for fiscal
the Congress years 1989-95 and for fiscal year 1996 and beyond to the levels shown by GAO’S analysis of Medicare hospital costs. If the Congress wants to use the savings from the lower payments to teaching hospitals to reduce overall Medicare outlays, the legislation should specifically reflect this decision. The Congress also should include provisions directing the Sec- retary of Health and Human Services (HHS) to reestimate periodically the effects of graduate medical education on Medicare costs based on the most current hospital cost data available at the time.
Agency Comments HHS agreed with GAO’S principal finding that the indirect medical educa- tion payment has been, and could continue to be, too high. HHS also agreed that the adjustment factor should be lowered and be reestimated periodically using current data. HHS stated, however, that it believed that some of GAO’S technical decisions on data and regression methods were inappropriate, and thus the specific values in the draft report were too high. (See p. 36.)
The Association of American Medical Colleges stated that the GAO’S esti- mates for the teaching adjustment factor were too low, and it does not believe that the adjustment factor should be lowered. (See p. 36.)
Page 6 GAO/HRD-8933 Medicare Medical Education Pa) menta

Contents
Executive Summary 2
Chapter 1 8 Introduction The Medicare Program 8
Medicare Payments for Inpatient Hospital Services 9 History and Evolution of Indirect Medical Education 12
Payments Objectives, Scope, and Methodology 15
Chapter 2 18 Numerous Factors Patient Care Is More Costly at Teaching Hospitals 18
Contribute to Higher Factors That Explain Variations in Hospital Costs 19
Costs at Teaching The Estimated Effect of Graduate Medical Education on 23
Hospital Costs
Hospitals SummarY 31
Chapter 3 32 Teaching Adjustment Average Medicare Payments to Teaching and 32
Factors for Fiscal Nonteaching Hospitals
Years 1989 and Indirect Medical Education Payments Contribute to 33
Overall Payment Differences
Ekyond Are Too High Teaching Adjustment Factors for Fiscal Year 1989 and Beyond Should He Lowered
34
Conclusion 36 Recommendations to the Congress 36 Agency Comments and Our Evaluation 36
Appendixes Appendix I: Factors Affecting Medicare Operating Cost Per Discharge (Fiscal Year 1985)
Appendix II: Description of Factors Used in Hospital Cost Analysis
Appendix III: Comments From the Department of Health and Human Services
Appendix IV: Comments From the Association of American Medical Colleges
Appendix V: Major Contributors to This Report
Tables Table 1.1: Medicare Expenditures for Inpatient Hospital Services (Fiscal Years 1985 and 1986)
Table 1.2: Adjustments for the Indirect Cost of Medical Education (Fiscal Years 1980-96)
Table 2.1: Average Medicare Cost Per Discharge at Major, Minor, and Nonteaching Hospitals (Fiscal Year 1985)
40
43
45
54
58
12
15
19
Page 6 GAO- Medicare Medical Education Payments

Contents
Table 2.2: Comparison of Specific Cost Factors by Hospital Type
Table 2.3: Statistical Estimates of the Effect of Teaching (Intern-to-Bed Ratio) on the Medicare Cost Per Discharge
Table 2.4: Statistical Estimates of the Effect of Teaching (Intern-to-Bed Ratio) Using Three Different Regression Methods
Table 3.1: Average Medicare Payment Per Discharge to Major, Minor, and Nonteaching Hospitals (Fiscal Year 1985)
Table 3.2: Comparison of the Actual Teaching Adjustment Factor and the GAO Estimate (Fiscal Years 1989-95, 1996)
Table I. 1: Factors Affecting Medicare Operating Cost Per Discharge (Ln AVG MCD), Fiscal Year 1985 (Without Outliers)
Table 1.2: Factors Affecting Medicare Operating Cost Per Discharge (Ln AVG MCD), Fiscal Year 1985 (With Outliers)
Table 1.3: Factors Affecting Medicare Operating Cost Per Discharge (Ln AVG MCD), Fiscal Year 1985 (Without Outliers, Constraining Case Mix and Wages)
Abbreviations
AAMC AVGMCD BDS BIS CBO cc CMI COBRA DRG DSH GAO HCFA HHS IRB MBA Pps Pl-OPAC WI
me7
Association of American Medical Colleges average Medicare cost per discharge number of beds Bureau of Labor Statistics Congressional Budget Office central city case mix index Consolidated Omnibus Budget Reconciliation Act of 1985 diagnosis related group disproportionate share General Accounting Office Health Care Financing Administration Department of Health and Human Services intern-to-bed ratio metropolitan statistical area prospective payment system Prospective Payment Assessment Commission wage index
GAO/EEDS%M Medicare Medical Education Payma

Chapter 1
Introduction
Teaching hospitals provide graduate medical education in conjunction with patient care. The costs incurred for this teaching activity are financed primarily from patient care revenues. Under the Medicare pro- spective payment system (pps), teaching hospitals receive supplemental payments intended, in part, to compensate them for the additional patient care costs associated with graduate medical education. Thus, Medicare payments to teaching hospitals are generally higher than pay- ments to nonteaching hospitals for treating similar conditions. In fiscal year 1988 these additional payments-adjustments for the “indirect cost of medical education” -are expected to total over $2 billion.
Section 9202 of the Consolidated Omnibus Budget Reconciliation Act of 1985 (COBRA, Public Law 99-272, Apr. 7, 1986) required us to study the variation in the amounts of Medicare payments among teaching and nonteaching hospitals and to identify the factors that explain such variation.
The Medicare Program Medicare is a federal program, authorized by title XVIII of the Social Security Act, that assists most of the elderly and some disabled in pay- ing for their health care. The program provides two basic forms of protection:
l Part A, Hospital Insurance, which is financed primarily by Social Secur- ity payroll taxes, covers inpatient hospital services, post-hospital care in skilled nursing facilities, hospice care, and care provided in patients’ homes. In fiscal year 1986, part A covered 30.9 million enrollees and benefits amounted to about $48.9 billion.
l Part B, Supplemental Medical Insurance, which is a voluntary program financed by enrollee premiums (25 percent of total costs) and federal general revenues, covers physician services and a variety of other health care services, such as laboratory and outpatient hospital services. In fiscal year 1986, part B covered 30.4 million enrollees and benefits totaled about $25.9 billion.
The Health Care Financing Administration (HCFA), within the Depart- ment of Health and Human Services (HHS), is responsible for administer- ing Medicare, establishing policy, and developing operating guidelines. HCFA operates the program with assistance from contracting insurance companies, called intermediaries under part A and carriers under part B. The insurance companies process and pay claims for covered >ledi- care services.
Page 8 GAO/ISlDW33 Medicam Medical Education Pa) ments

chapter 1 InMuctton
Medicare Payments Of the total part A expenditures of $48.9 billion in fiscal year 1986,
for Inpatient Hospital about $45.6 billion (93 percent) was for inpatient hospital services pro- vided to Medicare beneficiaries. These expenditures include four types
Services of payments-payments to all hospitals to compensate them for their operating costs and payments for their capital costs, as well as pay- ments to teaching hospitals for both the direct and indirect cost (see p. 11) of providing graduate medical education in conjunction with patient care.
Medicare Payments for Hospital Operating Costs
The Congress established PPS in the Social Security Amendments of 1983 (Public Law 98-21). Under PPS, predetermined payment rates are estab- lished for hospital services. The payments compensate hospitals for operating costs associated with providing routine, ancillary, and inten- sive care inpatient services. Each Medicare discharge is assigned to 1 of 473 diagnosis related groups (DRGS) based on the patient’s principal diagnosis. Each DRG is supposed to be made up of diagnoses (or proce- dures) that are expected to consume about the same amount of hospital resources to treat1
The amount a hospital receives for its operating costs is determined by two factors-the “weight” of the DRG into which the patient was classi- fied and the standard payment amount for the discharging hospital. The weight for a given DRG represents the national average resources used to care for Medicare patients in that DRG relative to the national average resources used to treat all Medicare patients. Thus, a patient in a DRG
with a weight of 2.0 is expected to require about twice the amount of hospital resources to treat compared to an average Medicare patient.
The DRG weight is multiplied by the discharging hospital’s standard pay- ment amount, which is the national average cost of treating a Medicare patient, adjusted to reflect wage rates in the hospital’s area and the hos- pital’s location (urban or rural). The PPS payment determined in this manner is adjusted upward for teaching hospitals (see p. 11) and for hospitals that treat a disproportionate share of low-income patients.
Under PPS, hospitals can also receive additional payments for “outlier cases” -cases that have either an extremely great length of stay ( day outliers) or extraordinarily high costs (cost outliers) compared to most
‘In an April 22,1988, report, Medicare: Refinement of Di osis Related Groups Needed to Insures Payment Equi;x (GAO/HRD-@341), we present evidenw%at this objective is not beq mrr for about one-thir of the DRGs. We found wide variations in treatment costs in 148 of the 406 CM A reviewed.
Page 9 GAO/HRLMWM Medicare Medical Education Pa) ments

chapter 1 Introduction
discharges classified in the same DRG. A discharge qualifies as a day out- lier if the length of stay exceeds the average for the DRG by a fixed number of days or a fixed number of standard deviations, whichever is less. Hospitals receive an additional per diem amount for each covered day of care beyond the threshold.
Upon a hospital’s request, an extraordinarily high-cost case that does not qualify as a day outlier can qualify for an outlier payment if covered charges, adjusted to operating costs, exceed a fixed multiple of the fed- eral prospective payment rate or a fixed dollar amount, whichever is greater.*
In fiscal year 1986, Medicare paid about $39.1 billion to approximately 6,700 hospitals for their operating costs. About 5,700 of these hospitals were paid under PPS.~
Medicare Payments for Hospital Capital Costs
Medicare also reimburses hospitals for capital costs, which include
l depreciation expense on buildings and on fixed and movable equipment, l leases and rentals (including license and royalty fees) for the use of
assets that would be depreciable if the provider owned them outright, l interest expense incurred in acquiring land or depreciable assets (either
through purchase or lease) used for patient care, l insurance on depreciable assets used for patient care or insurance that
provides for the payment of capital-related costs during business inter- ruptions, and
l taxes on land or depreciable assets used for patient care.
Hospitals are reimbursed, baaed on reasonable costs, for that portion of their capital costs attributable to Medicare patients. In fiscal year 1986, Medicare made capital payments to hospitals totaling about $3.8 billion.
*Analysis by HCFA and the Prospective Payment Assessment Commi&on (ProPAC) has shown that additional compensation is warranted for the moat expensive outlier cases. HCFA recently ample mented a new outlier payment policy that changes the ratea for coat outhers, effective duruV fiscal year 1989. ProPAC is continuing to analyze the outlier payment policies.
3When PPS began in fiscal year 1984, four States-Maryland, Massachusetts, New Jersey. and New York-were given waivers from participating. In fiscal year 1986, Massachusetts and Sew ‘I’ork ended their waivers. Psychiatric, children’s, and rehabilitation hospitals are exempt from PPS
Page 10 GAO/HRD&Wg Medicare Medical Education Payments

chapter 1 Introduction
Additional Payments to Teaching Hospitals
About 17 percent of the hospitals in our analysis of Medicare costs and payments met Medicare’s definition of a teaching hospital.4 At teaching hospitals, residents and interns, with varying degrees of supervision and instruction from teaching physicians, learn by caring for patients. The expense of graduate medical education is financed primarily from patient care revenues, which account for about 90 percent of the total funding for teaching hospitals. In addition to the PPS and capital pay- ments made to all participating hospitals, Medicare reimburses teaching hospitals for both the direct and indirect costs of medical education.
The direct costs of providing medical education include salaries and fringe benefits for residents and teaching physicians, the cost of confer- ence and classroom space, the cost of additional equipment and supplies, and allocated overhead costs. These costs can be determined from hospi- tal accounting records; Medicare’s share is based on a ratio of Medicare utilization of services to total utilization of services by all hospital patients. Medicare payments for direct medical education are deter- mined from base year (generally fiscal year 1984) per-resident costs, adjusted for inflation. Direct medical education payments totaled about $1 billion in fiscal year 1986.
The indirect cost of medical education is the portion of the higher patient care costs at teaching hospitals thought to be due to such factors as increased diagnostic testing, increased number of procedures per- formed, higher staffing ratios, and increased record keeping. As com- pensation for these indirect costs, teaching hospitals receive an add-on to their PPS payments. The adjustment is based on the number of interns and residents per hospital bed (referred to as the intern-to-bed ratio) and a statistically estimated factor thought to represent the incremental patient care cost due to providing graduate medical education (see p. 12). Indirect teaching adjustments totaled about $1.1 billion in fiscal year 1986.
The various types of Medicare expenditures for inpatient hospital ser- vices in fiscal years 1986 and 1986 are summarized in table 1.1.
4Hospitals that received Medicare payments for “approved educational activities” (i.e., formally or@nized or planned programs of study usually engaged in by providers in order to enhance the quality of care in an institution).
Page 11 GAO/KRDM33 Mediate Me&al Education Payments

Chapter 1 Introduction
Table 1.1: Medicare Expenditures for inpatient Hospital Services (Fiscal Years 1985 and 1966)’
Dollars in bllhons
Expenditure Operattng costs
Capttal payments
Fiscal year 1985 1986 $399 $39 1
3.3 36 Direct medvzal education 0.7 1c
lndlrect medical education
Total
0.9 1 ’
544.8 --SC0
‘Prellmlnary estimates, data for fiscal years 1965 and 1966 are current through September 1987 but are still consldered Incomplete by HCFA.
History and Evolution As Medicare cost-containment efforts evolved-from cost limits under
of Indirect Medical the former cost reimbursement system through the enactment and refinement of PPS-HCFA has recognized that certain factors cause legiti-
Education Payments mate differences in costs among hospitals. Accordingly, Medicare pay- ments to hospitals have historically included some type of allowance for hospital location, the mix of patients treated, wage levels, and the indi- rect costs of medical education.
HCFA first made allowances for the indirect costs of medical education in 1980 by increasing for teaching hospitals the “section 223” cost limits in effect at that time. Section 223 of the Social Security Amendments of 1972 (Public Law 92-603) allowed HHS to set upper limits on the amount of hospital costs Medicare would recognize as reasonable. These limits were to be based on the estimated costs of providing needed services efficiently. Between 1974, when the implementing regulations were first published, and 1982 (see below), the limits applied only to routine inpa- tient hospital costs.
The cost limits and the method of setting them evolved throughout this period. In 1979, for example, the routine per diem cost limits were set at the 80th percentile of the cost of comparable hospitals. To determine comparability, HCFA grouped hospitals by size (number of beds) and location (urban/rural), and adjusted costs to reflect differences in area wage levels.
In 1980, HCFA lowered the section 223 limits for each group of compar- able hospitals. At the same time, however, HCFA stated that “increases in per diem costs occur because the provision of graduate medical educa- tion causes increases in certain types of costs that are only indirectly related to education programs.” Therefore, HCFA increased the cost limits
Page 12 GAO/wLD8933 Medicare Medical Education Payments

Chapter I Introduction
for teaching hospitals through an adjustment. This adjustment for the indirect cost of medical education was based on a statistical analysis which estimated that per diem costs increased by 4.7 percent for each 0.1 increase in the intern-to-bed ratio.
The Tax Equity and Fiscal Responsibility Act of 1982 (Public Law 97- 248, enacted Sept. 3, 1982) extended the section 223 limits to cover total operating costs per discharge and also set limits on the annual rates of increase in operating costs per discharge. Again, the limits were increased for teaching hospitals. Based on statistical analysis of the rela- tionship between the size of a teaching program and total Medicare operating cost per discharge, HCFA increased the new limits by 6.06 per- cent for each 0.1 increase in the intern-to-bed ratio.
The Social Security Amendments of 1983 established PPS and continued the adjustment for the indirect costs of medical education. HCFA revised its estimate based on more current (1981) data, finding that the adjust- ment factor should be 5.795 percent for each 0.1 increase in the intern- to-bed ratioe6 The PFS legislation doubled the factor to 11.59 percent (i.e., used a multiplier of 2) because of congressional concern that the DRG
payment rates would not adequately compensate teaching hospitals for the higher costs associated with their urban location, treating more severely ill patients, and treating a disproportionate share of low- income Medicare patients. Thus, the adjustment was used not only to compensate teaching hospitals for the indirect costs of medical educa- tion, but also for other factors that increase hospital costs.
The compensation for indirect medical education costs is made through an annual lump-sum payment to teaching hospitals. The amount of the payment is determined by multiplying the amount of the hospital’s PPS
payment by the adjustment factor and the intern-to-bed ratio.”
‘The results of the HCFA analysis are usually stated in this manner. However, the HCFA analysts. as well as our analysis dkuased in chapter 2, used the log of (1 + the intern-to-bed ratlo). Thus. a more technically accurate interpretation of the results is “a lO-percent increase in (1 + the intern-tr9xd ratio)” is associated with a corresponding percent increase in the average Medicare cost per dls- charge. The current payment formula, contained in statute, correctly reflects this latter mterpreta- tion. As a result, the teaching adjustment is made on a variable or “curvilinear” basis. In discussmg our results in this report, for convenience we refer to the percent increase in the intern-t&& ratio. rather than the more precise (1 + the intern-t&& ratio).
%efore fLscal year 1988, a hospital’s standard amount was a blend of the hospital specific pc~rtlon (based on the hospital’s actual costs in its base year) and a federal portion. ln fiscal year 1985 the federal potion was 50 percent of the standard amount. It was increased to 75 percent III fiial > t’ar 1987, and beginning in foal year 1988, it is 100 percent. The indirect teaching adjustment applied only to the federal portion.
Page 13 GAO/HBDss33 Medicare Medical Education Pa) mcnts

Chapter 1 Introduction
COBRA provided for an additional adjustment to the PPS payments for hospitals that treat a disproportionate share of low-income Medicare patients’ for the period May 1, 1986, through fiscal year 1988 and, dur- ing that time, lowered the teaching adjustment factor to 8.1 percent. The 8.1-percent factor was based on a 1985 statistical analysis of 1981 data done by the Congressional Budget Office (CBO) which showed that, after accounting for the effect of treating a disproportionate share of low- income Medicare patients, the average cost per Medicare discharge increased by 4.05 percent for each 0.1 increase in the intern-to-bed ratio. As with the previous HCFA estimate, the Congress doubled the cso esti- mate, resulting in an adjustment factor of 8.1 percent.
COBRA provided that the disproportionate share adjustment would expire at the end of fiscal year 1988. When that adjustment was to end, COBRA
provided that the teaching adjustment factor would rise to 8.7 percent (5.795 x 1.5) beginning in fiscal year 1989. The difference in indirect medical education payments to teaching hospitals caused by lowering the rate from 8.7 percent to 8.1 percent was thought to represent a por- tion of the overlap between the indirect teaching adjustment and the disproportionate share adjustment and was used to partially finance the disproportionate share payments. The remainder of the total dispropor- tionate share payments was financed by restandardizing the PPS rates.
The Omnibus Budget Reconciliation Act of 1987 (Public Law 100-203, enacted Dec. 22,1987) extended the disproportionate share adjustment through fiscal year 1990 and lowered the teaching adjustment factor from 8.1 to 7.65 percent for fiscal years 1989 and 1990. This was done by lowering the multiplier from 2 to 1.89, rather than by changing the statistical estimate of 4.05. When the disproportionate share adjustment expires, the teaching adjustment factor is to rise to 8.29 percent (5.795 x 1.43). The Technical and Miscellaneous Revenue Act of 1988 (Public Law 100-647, enacted Nov. 10,1988) extended the disproportionate share adjustment through fiscal year 1995.
The teaching adjustment factors from fiscal year 1980 through fiscal year 1996 are listed in table 1.2.
‘It is generally postulated that these patients tend to be more severely ill than other patients and require more hospital resources to treat. There is no direct measure of the number of low-~n~~~e Medicare patients treated by a hospital. Rather, a hospital’s share of low-income patients 13 &ter- mined by adding (1) the percentage of part A patient days that were attributable to parwn~~ rntltled to Supplemental Security Income (the cash assistance program for the aged, blind, and dlsahlec) and (2) the percentage of a hospital’s total patient days that were attributable to patlen& ell@hlt~ for Medicaid.
Page 14 GAO- Medicare Medical Education Payments

chapter 1 Introduction
Table 1.2: Adjustments for the Indirect Cost of Medical Education (Fiscal Years 1980-96)
Period July 1980- Seot. 30 1982
Type of adiustment Increased Payment Statistical Adjustment cost limit adjustment estimate Multiplier factor
X 4.7 . 47
Oct. 1, 1982. Sept. 30, 1983
Oct. 1, 1983- Apr 30, 1986
May 1, 1986- Sept. 30, 1988
X 6.06 . 6 06
X 5 795 2cO 11 59
X 405 2.00 81 Oct. 1, 1988- Sept. 30, 1995
After Sept. 30, 1995
X 405 1.89 7 65
X 5.795 1.43 8.29
Based in part on studies by the HHS Office of Inspector General and others that showed higher-than-average Medicare profit margins at teaching hospitals, HHS recommended in its fiscal year 1988 and 1989 budget proposals that the teaching adjustment factor be lowered to 4.05 percent.
I
Objectives, Scope, and Section 9202 of COBRA required us to study the variation in Medicare
Methodology payments (1) among hospitals with different size teaching programs and (2) between teaching and nonteaching hospitals. To the extent feasible, we were to account for the variations in payment amounts among these types of hospitals; that is, hospitals with large teaching programs, those with smaller teaching programs, and those without teaching programs. Because the PPS payment rate computation methodology-including adjustments such as for the indirect cost of medical education-is designed to reflect certain cost differences among hospitals, variation in payments should ultimately be explained by factors that affect hospital costs. Accordingly, our specific objectives were to
. measure the differences in costs among major teaching, minor teaching, and nonteaching hospitals;
. examine the factors explaining the cost differences, including the extent to which having a graduate medical program contributes to the differ- ences; and
. estimate the size of the adjustment needed to compensate teaching hos- pitals for the indirect cost of medical education.
Page 15 GAO/HBDs933 Medicare Medical Education Paymentll

chapter 1 Introduction
To measure the difference in hospital costs and payments (see pp. 18 and 32), we obtained HCFA’S computerized files of hospital cost reports for fiscal years 1984 and 1985, the latest available at the time of our fieldwork. From those tapes, we extracted information for all hospitals that had (1) cost reporting periods that ended between June 30 and December 31, 1985, and (2) complete data. For the 4,096 hospitals that met these criteria, we used the cost report data to determine each hospi- tal’s Medicare operating costs, capital costs, and direct medical educa- tion costs. We then used this information to compute an average total Medicare cost per discharge for each of the three hospital types-major teaching, minor teaching, and nonteaching. We also used the cost report data to determine the average payment per discharge for each of the three groups of hospitals.
To identify potential factors for explaining differences in costs among hospitals, we reviewed over 40 major research articles and studies that focused on such differences. The major factors identified in these stud- ies as explaining cost differences were
l location (rural vs. urban, central city vs. suburban location), l wage rates, . types of patients treated (“case mix”), l hospital size, and . presence of a teaching program.
To estimate the effect of these factors on hospital Medicare costs (see p. 23), we combined several of HCFA’S automated files to develop a data base that ultimately contained information on about 8 million Medicare discharges from 5,408 hospitals in fiscal year 1985. The primary files used to construct this data base were the 1985 patient bill file, which contains treatment information and charges for Medicare discharges in fiscal year 1985; the 1984 and 1985 hospital cost report files, which were used to convert billed charges to costs; and the provider specific and certification files, which were used to obtain, for each hospital. spe- cific information, such as wage indexes, number of beds, and number of interns and residents.
eWe wed HCF.4 criteria to group the hospitals. Major teaching hospitals have intern-tcrbd ratws of 0.2500 or greater, minor teaching have ratios of 0.2499 or less, and nonteaching have nc~ lntvms or restdents.
Page 16 GAO/[email protected] Me&are Medical Education Payments

To this data base, we applied a statistical technique known as multiple regression analysis, which estimates the relationship between a depen- dent variable (average Medicare cost per discharge) and selected inde- pendent variables, such as the cost factors mentioned above. This technique permits us to predict the change in Medicare hospital costs associated with a given change in an independent variable, such as the size of a hospital’s teaching program. Our approach in this analysis is similar to that taken in earlier studies by HCFA and CBO.
It is important to recognize that our results, like those from similar stud- ies, must be given a “predictive” rather than “causal” interpretation. That is, a particular variable, such as teaching status, may be associated with higher Medicare costs and thus be useful for prediction. However, teaching status may be causing only part of the increased costs and, through the regression analysis, may be picking up some of the influence of causal variables either poorly measured or omitted from the model. In this report, we use the terminology found in other studies and refer to the predicted change in average Medicare cost per discharge associated with a change in teaching status as the “effect” of graduate medical education on hospital costs.
Specific information on the models used (including the definition, data sources, and method of computation for each of the variables) is con- tained in chapter 2 and appendix II. We also estimated the effect of graduate medical education on hospital coats using additional models that included other variables (such as proxies for severity of illness) or different definitions of variables (such as disproportionate share of low- income patients) than those used in our basic model. However, none of these additional models significantly improved upon our basic model in explaining variation in hospital costs.
Because the principal source of our automated data was Medicare inter- mediary claims and hospital cost reports, which are subject to periodic HCFA reviews and examinations, we did not independently examine the internal and automatic data processing controls for the automated sys- tems. HCFA relies on the data obtained from these systems as evidence of Medicare-covered services, as well as expenditures, and to support its management and budgetary decisions. Except for this limitation, our work, which was done from June 1986 through June 1987, was per- formed in accordance with generally accepted government auditing standards.
P8ge17 GAO/ERD&XB bledicue Me&d Education Payments

Chapter 2
Numerous Factors Contribute to Higher Costs at Teaching Hospitals
In 1985, the average total Medicare cost per discharge at major teaching hospitals was 41 percent higher than at minor teaching hospitals and 95 percent higher than at nonteaching hospitals. Likewise, at minor teach- ing hospitals the average cost was 39 percent higher than at nonteach- ing hospitals.
Teaching hospitals tend to have a mix of patients that are more costly than average to treat, are concentrated in urban areas in general and the largest urban areas (population over 1 million) in particular, and have large numbers of beds. Each of these factors generally results in a hospi- tal having higher-than-average costs and, thus, helps explain why teach- ing hospitals have costs that are higher than other hospitals. However, even after accounting for these cost-increasing factors, teaching hospi- tals have higher costs than nonteaching hospitals. The residual higher costs have been labeled the “indirect cost of medical education.”
Some studies suggest that the indirect medical education costs result from the increased use of ancillary services at teaching hospitals. Others suggest that they reflect the additional costs, beyond those measured by the DRGS, of treating more severely ill patients at teaching hospitals. While we did not determine the exact source of these costs, we did sta- tistically estimate the relationship between teaching status and hospital costs. We estimate that a lo-percent increase in the ratio of interns to beds would be associated with an increase in the cost of a Medicare dis- charge ranging from 3.73 to 7.19 percent, depending on what other cost factors are considered and how they are measured.
Patient Care Is More To measure the difference in the Medicare cost per discharge among
Costly at Teaching Hospitals
major, minor, and nonteaching hospitals, we used the hospital cost reports for 4,096 hospitals that had an accounting year with ending dates from June 30 to December 31, 1985. Of these hospitals, 109 were major teaching hospitals, 525 were minor teaching hospitals, and 3.462 were nonteaching hospitals. Table 2.1 shows the average Medicare cost per discharge at the three hospital types.
Page 18 GAO/HRD-69-33 Me&are Me&al Education Payments

chapter 2 Numerous Factam Contribute to Eigber Caste at Tecrcbing Hoepitals
Table 2.1: Average Medicare Cost Per Dircharge at Major, Minor, and Nonteaching Hospital8 (Fiscal Year 1985)
Type of cost ODeratlnaa
Average cost per discharge Major Minor
teaching teaching Nonteaching $5,393 $3,852 $2.829
Capital 312 310 274 Direct medical education 357 143 Ob Total $6.062 54,305 $3.103
%cludes Indirect medrcal education
bOf the 3.462 nonteachlng hospitals. 264 reported dwect medical education costs averaging $35 per patient. These costs cover expenses related to tratnlng nurses and technlcians.
As shown in the table, each of the component costs-operating, capital, and direct medical education-on average were highest at major teach-
ing hospitals and lowest at nonteaching hospitals.
Factors That Explain Variations in Hospital COStS
Differences in total patient care costs among hospitals can be explained by three general factors- input prices, outputs, and efficiency. Input prices are those paid by hospitals for resources-such as labor, sup- plies, and utilities- consumed in providing inpatient hospital care. Out- put at most hospitals is the health care provided to patients. Teaching hospitals also provide graduate medical education in coqjunction with patient care. Efficiency is the ability to effectively treat patients while minimizing the use of resources. The same factors that affect total hos- pital costs also affect Medicare costs.
Studies by HCFA and others show that much of the variation in hospital costs to treat Medicare patients is explained by specific factors affecting input prices, such as location (e.g., rural, urban, central city); specific output variables, such as the mix of patients treated (“case mix”) and the presence of a graduate medical education program; and hospital size (number of beds), which is correlated with input prices and outputs.
We used our data base with information on 8 million fiscal year 1985 Medicare discharges and 5,408 hospitals to measure differences in each of these cost factors among major, minor, and nonteaching hospitals. The factors and the results of our analysis are discussed below.
Location A hospital’s location can affect its treatment costs. The cost of contract
services, food, supplies, and other goods and services consumed in pro- viding health care are generally higher in urban than in rural locatlons.
P8ge 19 GAO/IfRDS.W Medicare Medical Education Pa) mews

Chapter 2 Numerous Factors Contribute to Higher c0et.a at Teaching Hospitals
Some studies also show a direct relationship between hospital costs and the size of the metropolitan area in which the hospital is located. Like- wise, they suggest that hospitals located in the core or central city of large metropolitan areas tend to have higher costs than those in its sub- urban areas.
Major teaching hospitals tend to be located in large urban areas and, like other urban hospitals, have higher costs than hospitals in rural areas. About 95 percent of the 154 major teaching hospitals in our analysis were in urban areas; in contrast, only 41 percent of the 4,464 nonteach- ing hospitals were in urban areas. Likewise, 53 percent of the major teaching hospitals were in the central city of the largest metropolitan statistical areas (MSAS) (population greater than 1 million), while only 6 percent of the nonteaching hospitals were in such a location.
A major source of cost differences between urban and rural hospitals is in the wage rates paid to their employees. To illustrate this difference, we compared the fiscal year 1985 wage indexes’ applicable to teaching and nonteaching hospitals. Major teaching hospitals were in areas that had a wage index that, on average, was 18.7 percent higher than the wage index for nonteaching hospital locations; minor teaching hospitals were in areas that had a wage index that, on average, was 14.4 percent higher than that for nonteaching hospital locations.
Case Mix The mix of patients treated is another key factor in determining a hospi- tal’s Medicare costs. Patient resource requirements are determined, in part, by the patient’s diagnosis, the severity of the disease or condition, the presence or absence of secondary conditions that could complicate treatment, and whether the patient is treated medically or surgically. Thus, a hospital with a case mix made up of a high proportion of surgi- cal patients would probably have higher average treatment costs than a hospital treating mostly nonsurgical patients because of the additional costs of the ancillary services required (the operating and recovery rooms, radiology, and anesthesiology).
Under PFS, a hospital’s Medicare case mix is measured in terms of the DRGS into which patients are classified. Each DRG has a weight, which
‘The wage index is a relative measure of labor costs for each MSA and the rural areas of each state. The wage index used was for foal year 1986 and was computed by HCFA using calendar year 198 1 hospital wage and employment data obtained from the Bureau of Labor Statistics.
Page 20 GAO/HBD8933 Medim Medical Education Payments

Chapter 2 Nnmemua Factora Contribute to Higher coets at Teaching Aoapitala
reflects the average resources required to treat patients in that DRG rela- tive to all the other DRGS-the higher the DRG weight, the higher the treatment resource requirements. HCFA uses a case mix index, which is the ratio of a hospital’s average DRG weight for Medicare patients treated to the national average DRG weight for all Medicare patients treated. A case mix index of less than 1.00 indicates that a hospital is treating patients who are classified in the lower weighted DRGS and thus, on average, are expected to be less costly to treat. An index greater than 1.00 indicates that a hospital treats patients that, on average, are expected to cost more that the typical Medicare patient.
To compare the treatment resource requirements of the three hospital types, we computed an average case mix index for each. We found that the average case mix index at major teaching hospitals was 1.079, com- pared to 1.019 at minor teaching hospitals and 0.919 at nonteaching hos- pitals. Thus, patients treated at major teaching hospitals would be expected, on average, to be about 17 percent more costly to treat than those at nonteaching hospitals, and patients at minor teaching hospitals would be expected to be about 11 percent more costly to treat than those at nonteaching hospitals.
Another indicator of the costliness of a hospital’s patient mix is the average length of stay of patients. For a given hospital, generally the longer a patient stays in a hospital, the higher the hospital’s treatment costs. Our analysis showed that patients in major teaching hospitals tend to stay slightly longer on average (8.9 days) than those in minor teaching hospitals (8.6 days), and substantially longer than those in non- teaching hospitals (6.7 days).
A partial contributor to the greater length of stay at major teaching hos- pitals is the fact that they serve a higher proportion of low-income patients. Studies have shown that these patients tend to be sicker, require more hospital resources to treat, and stay longer than other patients. HCFA’S data show that, on average, almost 30 percent of the discharges at major teaching hospitals are low-income patients,2 com- pared to 17 percent at minor teaching hospitals and 19 percent at non- teaching hospitals.
E3ed Size Hospital size (frequently measured by the total number of beds) is another major factor that seems to help explain cost differences among
%NJ Medicare’s definition of low-income patients (see p. 14).
Page 21 GAO- Medicare Medial &cation Paymente

Chapter 2 Numerous Factors Contribute to Higher Costs at Teaching Hospitals
hospitals-that is, larger hospitals generally have higher operating costs. In part, this may be because large hospitals have a high percent- age of the expensive special care units, such as burn care and cardiac care units, which increase their total cost. In addition, size is strongly correlated with other factors associated with higher operating costs- that is, large hospitals also tend to be located in large urban areas and treat a more costly mix of patients.
Generally, major teaching hospitals are very large hospitals, with an average of 554 beds. Minor teaching hospitals have an average of 373 beds, while nonteaching hospitals have an average of 12 1.
Table 2.2 presents summary information on a number of important input and output factors for the 5,408 hospitals in our analysis.
Table 2.2: Comparison of Specific Cost Factors by Hospital Type
Cost factors Average Intern-to-bed ratlo
Average case mix Index
Average wage Index
Average number of beds
Average Medicare length of stay in days
Percent of hospitals classified urban
Percent of hospttals in central city of large MSA
Nonteaching (4,464)
.oo
919
946
121
6.7 41
Minor teaching
VW 08
1019
1082
373
86
93
Major teaching
(154) 42
1 079
1 123
554 --___ 8.9
95
6 31 53
Percent of discharges that were low-Income patients
- .___
19 17 30
In summary, there is a positive relationship between Medicare costs and such factors as hospital patient mix, location, and size. In addition. as can be seen from the table, there is also a positive relationship between these factors and the teaching status of hospitals. Thus, these factors, rather than the presence of a teaching program per se, help explain a large portion of the higher costs at teaching hospitals.
Page 22 GAO/HRD-S9-33 Medicare Medical Education Payments

Chapter 2 Numerous Factors Contribute to Higher Costs at Teaching Hospitals
The Estimated Effect In 1983, before the establishment of PPS, a HCF.A analysis of hospital
of Graduate Medical Medicare costs showed that even after accounting for case mix, location,
Education on Hospital and size, teaching hospitals had higher patient care costs than nonteach- ing hospitals. Using 1981 hospital cost report data and the statistical
costs technique of multiple regression analysis, HCFA estimated that Medicare cost per discharge increased by 5.79 percent for each 0.1 increase in the intern-to-bed ratio. The HCFA estimate was the original basis for deter- mining the additional payments to hospitals for the indirect cost of med- ical education under PPS.
Given the imprecise nature of the “indirect costs” of medical education and the absence of a more conventional way of measuring them, regres- sion analysis has given Medicare policymakers a means of adjusting PPS payment rates. Multiple regression analysis simultaneously estimates the effect of several factors (independent variables)-such as teaching, location, and case mix-on Medicare operating cost per discharge (the dependent variable). The estimated effect of teaching on Medicare costs-and the payment adjustment factor derived from this estimate- can be smaller or larger depending on what factors are included in the analysis and how they are measured.
Using fiscal year 1985 data, we applied regression analysis to estimate the relationship between graduate medical education and Medicare oper- ating cost per discharge in a number of different models and examined the policy implications of each. Specifically, we examined the differ- ences in estimates obtained by
l using “payment models,” as compared to augmented or more fully speci- fied models;
l doing the analyses with and without outliers; and l constraining the coefficients of certain variables used in the models to
their presumed PPS payment values.
Payment Models Versus Augmented Models
Some have argued that regression analysis used to estimate the effect of graduate medical education on Medicare costs for PPS payment purposes should include only those cost factors recognized in the PPS payment formula. To examine this approach, we incorporated in our first model the factors originally used in determining PPS rates-case mix. hospital wages, location, and the size of a hospital’s teaching program.
We calculated the average Medicare cost per discharge (AVG MCD) for 5,408 hospitals by converting the charges on 8 million fiscal year 1985
Page 23 GAO/HRM9-33 Medicare Medical Education Pa) ments

Chapter 2 Numerous Pactmu Contribute to Higher Casts at Teaching Hospitals
Medicare bills to costs using hospital-specific cost-to-charge ratios. In calculating the average operating cost per discharge for each hospital, we removed capital and direct medical education costs. We also excluded outlier cases from this calculation because of their atypical costs and the problems with the special payments made for such cases. At the time of our analysis, HCFA was revising the outlier payment policy in an attempt to make it more equitable.
Further, while the original PPS payments were adjusted on the basis of urban or rural location, beginning in fiscal year 1988 PFJS payments to hospitals also differ depending on the size of the urban area in which a hospital is located.3 We therefore divided the urban hospitals into three groups based on the population of the MSA in which the hospital is located.4 We measured the size of a hospital’s teaching program using the hospital intern-to-bed ratio (IRB), hospital case mix using the case mix index (au), and hospital wages by using the wage index (we) for the MSA or rural area in which the hospital is located.6 Thus:
Model (1): AVG MCD = f(cMI, WI, MSA, IRB)
From this first model, we estimate that a lo-percent increase in the intern-to-bed ratio is associated with a 6.06~percent increase in Medicare operating cost per discharge. The results of this analysis also suggest that hospitals in large urban areas have higher costs than hospitals in smaller urban and rural areas (see app. I).
In fiscal year 1988, hospitals that serve a disproportionate share of low- income patients (see p. 14) continued to receive an add-on adjustment to
3The hospital standard payment amount (see p. 9) is updated annually to reflect mcreases IIJ the pnce of goods and services purchased by hospitals (the hospital “market basket”) and other factors affect- ing hospital costs, such as technological developments and changes in productivity Before fiscal year 1988, the same update factor was used for all hospitals. The Omnibus Budget Reconclllatmn Act of 1987 set the update factor for fiscal year 1988 at 1.6 percent for hospitals in large urban areas 1.0 percent for those in other urban areas, and 3.0 percent for those in rural areas. For fiscal year 1989, the act set the update factors at the market basket percentage increase leas 2 percentage potnts for large urban areas, 2.5 percentage pointa for other urban areas, and 1.5 percentage pomrs for rural areas.
4The four groupings used were ruraI area smalI MSA (a population less than 250.000): m&urn MSA (populations between 250,ooO and 1,000,000); and large MSA (populations greater than I IMWHH)).
5A generally accepted assumption in hospital cost function analysis is that the relatIonshIp brf ween Medicare cost per case (the dependent variable) and the independent variables is multlpll<xrlve rather than additive. That is, the independent variables interact, and a change in any ontz of rhem brings about a proportional change in the dependent variable (Medicare cost per discharge 1 There- fore, to measure this proportional relationship, we converted the values of CMI. WI. IRB anti HDS into logarithms before doing the regre&on analysis. See appendix II for the source and dtr nptmn of aU variables used in our analyses.
Page 24 GAO/HED&N3 Me&are Medical Education Payments

Chapter 2 Numerous Factors Ckmtribute to Eigber Costa at Teaching Hospitala
their PPS payments. We added a continuous variable to our model that reflects the percent of low-income patients treated at hospitals that receive disproportionate share (DSH) payments6
Model (2): AVG MCD = f(CMI, WI, IN!%, DSH, IRB)
Adding the disproportionate share variable explains part of the varia- tion in Medicare costs attributed by the previous model to teaching sta- tus and lowers the estimated effect of teaching from 6.06 to 5.09 percent. The results from this model also suggest that only the larger urban hospital group treating a disproportionate share of low-income patients has higher costs than hospitals that do not treat a dispropor- tionate share.’
It is important to understand that the estimate obtained using this sec- ond model also reflects the influence of other relevant cost factors that are correlated with both teaching and Medicare operating costs, but were not included in the regression analysis. For example, the current PPS payment rates do not differentiate payments based on hospital size (number of beds), nor do we advocate that they should. However, because bed size has been found to be an important factor in explaining cost differences among hospitals, it has always been a part of the analy- ses used to determine the indirect teaching adjustment factor. Thus, we added the number of beds (BDS) to our model:
Model (3): AVG MCD = f(CMI, WI, hiSA, DSH, BD6, IRB)
With the addition of beds, the estimated effect of graduate medical edu- cation on Medicare costs decreases to 4.10 percent. This supports the hypothesis that there is a positive relationship between hospital bed size and Medicare cost per discharge, and between bed size and the size of a hospital’s teaching program. However, it is unclear exactly why bed size should increase costs independent of other factors. Some researchers believe that beds may be acting as a proxy for the additional costs of treating more severely ill patients beyond that reflected in the DRGbased
&le following hospitals are eligible for disproportionate share payments: (1) urban hospltak wth 100 or more beds and a share of low-income patients of at least 16 percent, (2) urban hospIrals wth fewer than 100 beds and a share of low-income patients of at least 40 percent, (3) rural hospltals with a share of low-income patients of at least 46 percent.
‘The analysis shows that the smaller urban hospitals treating a disproportionate share of low-mcome patients do not have significantly higher costa than hospitals not treating a high percentage of such patients. Costs at rural hospitals serving a dispropor&ionate share of low-income patients were s@ufi- cantly lower than those at hospitals not treating a high percentage of such patients. (See app 1 1
Page 26 GAO/HRIHSB Medlcace Medical Education Payments

Chapter 2 Numerous Factors Contribute to Higher Cotta at Teaching Hospitals
case-mix index. Others believe that number of beds may be a proxy for other measures of service intensity (longer lengths of stay and more ser- vices provided) not specifically included in the analysis.
Similarly, while it is not currently reflected in PPS payment rates, for analysis purposes we wanted to determine the effect of central city loca- tion on hospital Medicare costs. We therefore divided the hospitals iocated in the largest M&U into two groups-those in the central city and those located outside the central city -and added central city (cc) as an independent variable.
Model (4): AVG WCD = f(CMI, WI, MSA, DSH, BDS, CC, IRB)
Our results obtained from this model were generally consistent with those from earlier studies, which showed that hospitals located in the central city of large urban areas tend to have higher costs than other hospitals. In our analysis, the addition of the central city variable fur- ther reduced the estimated effect of teaching to 3.83 percent. The decrease in the estimate also suggests that the estimated effects of teaching on Medicare costs from the previous regressions were over- stated because they partially reflected the effect of central city location in addition to teaching.
Recent studies suggest that there are other measures of hospital inputs and outputs that also help explain differences in hospital costs, includ- ing additional measures of severity of illness; regional variation in medi- cal practice patterns; and other characteristics of a hospital’s market area, such as income level, physician density, and hospital bed density. We did not attempt to measure these factors or include them in our anal- ysis. However, to the extent that these and other factors can be mea- sured accurately, including them in a regression model might also affect the estimate of the indirect medical education costs.
In summary, the estimated effect of teaching on Medicare operating cost per discharge varies depending on the other cost factors included in the analysis. Considering only those variables used in calculating the PPS
payment rates produces an estimate that is biased upward, reflecting part of the effect of omitted factors that are positively related to both hospital costs and teaching status. Thus, if the indirect teaching adjust- ment factor were based on such a “payment model,” the resulting pay- ments to teaching hospitals would compensate them not only for the indirect cost of medical education, but also for other factors, such as bed size and central city location.
Page 26 GAO- Mdhare Medical Education Payments

Chapter 2 Ntunerous F&zt.om Contzibute to E&her&eta at Teaching Hospitals
One drawback to using the teaching adjustment factor to pay for factors not directly reflected in the PPS rates is that the compensation for these other factors would only be partial. In addition, some teaching hospitals not affected by these cost factors-for example, those not located in central cities-would be overcompensated, while some nonteaching hos- pitals that are affected-for example, large nonteaching hospitals located in central cities-would receive no additional payments for these other cost factors.
Outlier Cases Affect Estimates
The estimates obtained from multiple regression analysis are affected not only by what variables are included in the model, but also by how they are measured. One measurement issue concerns the dependent variable, average Medicare cost per discharge, and the effect of includ- ing or excluding outlier costs in its calculation. As discussed on page 24, we excluded all outlier costs in calculating the dependent variable (AVG MCD) used in our first four models. However, in commenting on the draft report, both HCFA and the American Association of Medical Colleges (AAMC) expressed concern that eliminating outlier cases could distort the results of our analysis because it eliminates one of the major sources of cost differences between teaching and nonteaching hospitals.
We therefore estimated the same four models using an average Medicare cost per discharge (AVG MCDJ that reflects total costs for outlier cases less the outlier payments6 A comparison of the estimates obtained by doing the analyses with and without outlier costs is shown in table 2.3.
Table 2.3: Statistical Estimator of the Effect of Teaching (Intern-to-Sod Ratio) on the Medicare Cost Per Discharge
Model number
Factors wed in analysis Estimated Estimated
effect without effect with Ca8e mix, wa
iii Di8pOpOr- Central outlien outliers
index. intam n MSA tionate share Beds CRY bercentY (percent)* 1 X X 6.06 651
2 X X X 5.09 516
3 X X X X 4.10 405 4 X X X X X 3.63 3 73
‘Percent increase In Medicare operating cost per discharge for each l&percent Increase In the Intern to-bed ratlo.
%ee p. 9 for a description of how the outlier payment amounts are determined.
Page 27 GAO- Medicsre Medical Education Payments

Chapter 2 Numeroua Factmm Contribute to Higher Coets at Teaching Hoepitrb
As can be seen in the table, including outlier costs produces somewhat higher estimates in the first two models, which used only the PPS pay- ment variables. One explanation for these higher estimates is the fact that outlier cases make up a higher percentage of the total Medicare dis- charges at teaching than at nonteaching hospitals (6.5 percent at major teaching hospitals as compared to 3 percent at nonteaching hospitals). Including the costs of these cases in our analyses, therefore, increases the difference in average Medicare cost per discharge between teaching and nonteaching hospitals and also increases the portion of cost varia- tion attributed to teaching in these two models.
However, adding bed size and central city location in the other two mod- els decreases the estimates for teaching and makes them somewhat lower than the estimates obtained in the comparable models that excluded outliers. Large hospitals and urban hospitals also tend to have a higher-than-average proportion of outlier cases, and the lower esti- mates in these models suggests that size and urban location-more than teaching-are associated with higher costs due to outlier cases.
Accordingly, we believe that there would be drawbacks to using the esti- mates obtained from the analyses that included outlier cases as the basis for the teaching adjustment factor. For example, using the higher esti- mates from the first two models that included outlier cases would implicitly compensate teaching hospitals for deficiencies in the current outlier payment policy. Thus, teaching hospitals would receive compen- sation for outlier costs from two sources-directly through the outlier payments and indirectly through the teaching adjustment. However, nonteaching hospitals that also treat a higher-than-average number of outlier cases (such as large urban hospitals) would receive no relief from the inadequacies of the current outlier payment policy.
We believe, therefore, that the analyses of the indirect cost of medical education done by excluding outlier cases are preferable for purposes of setting PPS payment rates and that the outlier payment policy issues should continue to be addressed directly through separate analyses.
There are other measurement issues that could also affect the estimate of the indirect cost of medical education obtained through regression analysis. For example, as discussed above, we used the HCFA case mix index to measure the relative costliness of a hospital’s patient mix. The case mix index is measured in terms of the DRGS into which patients are classified, and its accuracy depends upon how well the individual DRG
weights reflect the treatment resource requirements within the DRGS.
Page 28 GAO/IKMMM3M~mMedical Education Payments

Chapter 2 Numerous FUUMII Contribute to Higher Crete at Teach@ Hospitals
There has been concern, however, that the DRG classification system fails to measure fully severity of illness within the DRGS, thus “com- pressing” the values of the hospital case mix indexes. That is, the case mix index assumes that all patients within a DRG have the same resource requirements. Therefore, the costliness of the patient mix of hospitals that consistently treat more severely ill patients within the DRGS would be understated, while the costliness of the patient mix of hospitals that consistently treat less severely ill patients within the DRGS would be overstated. Compression could bias upward the estimated effect of teaching on hospital costs because differences in hospital costs that may actually be due to case mix would be attributed to teaching and other cost factors in the model.
Imprecision in measuring other independent variables included in the analyses, such as teaching intensity and/or wages, could also bias the resulting estimates of the effect of teaching on hospital costs.
Treatment of Other PPS Payment Issues Affects Teaching Estimates
The PPS payment methodology provides prior expectations of the coeffi- cients for the case mix index and the wage index that should be obtained in regression analysis of hospital operating costs. For example, under PPS a hospital’s operating cost per discharge should be directly propor- tional to the DRGbased case mix index; that is, a l-percent increase in the case mix index should bring about a l-percent increase in operating cost per discharge. Thus, the coefficient for the case mix index esti- mated from a regression analysis of hospital operating costs theoreti- cally should be equal to 1.
Likewise, one might expect that the coefficient for the wage index should be 0.75 because of the method used to adjust the “standard amount” (see p. 9) for variation in wage levels under PPS. That is, the standard amount is divided into a labor and a nonlabor portion, and only the labor portion is adjusted for wages. HCFA has determined that, on average, labor-related costs make up about 75 percent of inpatient hos- pital operating costs.
In the regression models discussed thus far, our estimates for the case mix index and wage index differed from their theoretical PPS payment values. For example, in our four models discussed on pages 24-26, the estimated coefficients for case mix ranged from 1.27 in our first pay- ment model to 1.07 in our most fully specified model. The latter coeffi- cient suggests that a 1.0~percent increase in the costliness of a hospital’s
P8ge 29 GAO- Medicare Medical Educadon Payments

Chapter 2 Numerous Fartota Contribute to Higher Coste at Teaching Hospitals
case mix is associated with a 1.07-percent increase in the average Medi- care cost per discharge.9
Our estimates for the wage index (0.95 to 0.93) were significantly higher than the theoretical PPS payment value (0.75). This difference suggests that the wage index variable in the regression analysis may be picking up part of the effect of nonlabor input prices-such as food or contract services-which are sensitive to area wage rates. It could also indicate that labor costs may make up a greater portion of hospital operating costs than is reflected in the PPS payment rates. If either assumption is correct, the PPS wage adjustment may be inadequate for hospitals in high-wage areas.
For this reason, AAMC, in commenting on the draft report, stated that we should “constrain” the coefficients for case mix and wages to their theo- retical PPS payment values in order to estimate an “appropriate” teach- ing adjustment factor-that is, a higher teaching adjustment factor that would implicitly compensate for any deficiencies in the PPS wage adjustment.
To illustrate AAMC’S position, we reestimated the four models discussed previously, constraining the coefficient for the case mix index to 1 .O and the coefficient for the wage index to 0.75. Table 2.4 shows the estimates obtained by doing the analyses (1) unconstrained, without outliers; (2) unconstrained, with outliers; and (3) constrained, without outliers.
Table 2.4: Statistical Estimates of the Effect of Teaching (Intern-to-Bed Ratio) Using Three Different Regression Methods
Fiaures in oercent .a
Model number 1
Estimated effecP Unconstrained, Unconstrained, Constrained, without outliers with outliers without outliers
6.06 6.51 7 19
2 5.09 5.16 6.26
3 4.10 4.05 4 36
4 3.63 3.73 4 09
aPercent increase in Medlcare operattng cost per discharge for each lo-percent Increase In the Intern. to-bed ratlo.
As can be seen in the table, constraining the coefficients for case mix and wages does result in consistently higher estimates of the effect of
‘The difference between our estimated coefficient of 1.07 for the case mix index and 11s prw~ lmrd system value of 1.0 is not statistically significant at the 96-percent confidence level.
Page 30 GAO/W Me&are Medical Education Payments

ch8pt.m 2 Numerous Facton Contribute to Higher Ccmts at Teaching Hoepitrls
teaching on the Medicare cost per discharge. This is because the teach- ing estimate partially reflects the difference between the constrained and unconstrained values for case mix and wages. (App. I contains a complete list of the estimated effect of all variables in each of the four models, and under the three different methods of doing the regression analysis.)
If the indirect teaching adjustment were based on the higher estimates obtained from the “constrained” models, the resulting payments to teaching hospitals would implicitly compensate them for potential short- comings in the current PPS payment rates related to the case mix and wage indexes. The drawbacks to this approach are similar to those asso- ciated with using the teaching factor to compensate for shortcomings in the outlier payment policy (see p. 28) and for factors not reflected in the PPS payment rates (see p. 27). That is, while the payments to some teaching hospitals might be more equitable, other hospitals similarly affected by shortcomings in the PPS rates would receive no relief.
Again, we believe that estimates of the indirect cost of medical educa- tion-for PPS payment purposes-should be made independent of the other PPS payment rate issues. However, to ensure that PPS payments to all hospitals are equitable, deficiencies in other parts of the PPS payment mechanism should continue to be addressed and corrected through sepa- rate analyses.
Summary The estimated effect of teaching on Medicare costs is smaller or larger depending on what factors are included in the analysis, and on how the factors are measured. Including only the factors used in setting the PPS
payment rates and measuring them at their system values produces esti- mates that are biased upward, reflecting part of the effect of shortcom- ings in the current PPS rates as well as part of the effect of factors not explicitly recognized by PPS. Conversely, including more of the relevant cost factors that affect hospital costs, and excluding the influence of deficiencies in the PPS payment rates, produces lower estimates that are probably closer to the “true” indirect cost of medical education.
In chapter 3, we compare the various estimates discussed in this chapter to the teaching adjustment factors that will be used to pay teaching hos- pitals beginning in fiscal year 1989, and discuss the implications of this comparison.
Page 31 GAO/HBD8939 Medicare Medical Education Payments

Chapter 3
Teaching Adjustment Factors for Fiscal Years 1989andBeyondAreTooHigh
In fiscal year 1985, the average total Medicare payment per discharge was 106 percent higher at major teaching hospitals than at nonteaching hospitals and 45 percent higher at minor teaching hospitals than at non- teaching hospitals. Most of the payment difference between teaching and nonteaching hospitals was due to the higher payments for patient care made to teaching hospitals. These patient care payments reflected the fact that teaching hospitals receive patients that are more costly to treat than those at nonteaching hospitals, and that teaching hospitals are generally located in high-cost urban areas.
In addition, payments to teaching hospitals were higher than those to nonteaching hospitals in fiscal year 1985 because of the add-on pay- ments to teaching hospitals for indirect medical education costs. How- ever, these add-on payments were probably too high because the payment adjustment factor used to determine them-l 1.59 percent- was double HCFA'S statistical estimate of the indirect cost of medical edu- cation. Further, based on our analysis discussed in chapter 2, we believe that the adjustment factor for fiscal years 1989-95 should be at most 6.26 percent rather than the legislated 7.65 percent, and the factor to be used beginning in fiscal year 1996 should be at most 7.19 rather than the legislated 8.29 percent. Reducing the adjustment factor to levels sug- gested by our analysis could save the Medicare program from $1.4 to $4 billion over the 3-year period 1989-91.
Average Medicare We used HCFA'S automated cost report files for fiscal years 1984 and
Payments to Teaching 1985 to compare the average total Medicare payment per discharge at 109 major teaching, 525 minor teaching, and 3,462 nonteaching hospi-
and Nonteaching tals. We selected these 4,096 hospitals because they had an accounting
Hospitals period generally comparable to fiscal year 1985. Table 3.1 shows the results of our analysis.
Table 3.1: Average Modkan Payment Per Discharge to Major, Minor, and Nonteaching Hospitals (Fiscal Year 1985) Type of payment
Patient care
Indirect medical education
Capital
Direct medical education
TOtd
Average payment per discharge Major teaching Minor teaching Nonteaching
$5,594 $4,300 $3,121
731 176 0 .--. ____ 312 310 274 -~~~ 357 143 0
96,994 $4,929 $3,395
Page 32 GAO- Medicare Medical Education Payments
Clupter3 Tuc~AdjrutmentFutorsforPimxl Yem1@89uul&yondhnTooH&l1
The $6,994 average total Medicare payment per discharge to major teaching hospitals in 1985 was $3,599 (about 106 percent) higher than the $3,395 average payment per discharge to nonteaching hospitals. Likewise, the $4,929 average total payment per discharge to minor teaching hospitals was $1,534 (about 45 percent) higher than that to nonteaching hospitals.
About 69 percent of the payment difference between major and non- teaching hospitals and 77 percent of the payment difference between minor and nonteaching hospitals was due to the higher payments for patient care made to teaching hospitals. As discussed in chapter 2, teaching hospitals receive patients who require more hospital resources to treat. In general, higher treatment costs are reflected by higher weighted DRGS into which these patients are classified, and higher weighted DRGS mean higher PPS payments. The fact that teaching hospi- tals are generally located in high-cost urban areas also helps explain the higher Medicare patient care payments to these hospitals.
Indirect Medical Aside from the differences in Medicare payments for patient care, the
Education Payments most significant difference in the average Medicare payment per dis- charge to teaching and nonteaching hospitals in 1985 was the add-on
Contribute to Overall payment made to teaching hospitals for the indirect cost of medical edu-
Payment Differences cation. On average, major teaching hospitals received an add-on of $731 per discharge and minor teaching hospitals received $176.
As discussed earlier (see p. 13), these payments were based on an adjustment factor derived from a HCFA analysis of 1981 hospital cost data which estimated that hospital costs increased by 5.795 percent for each 0.1 increase in the intern-to-bed ratio. The HCFA estimate of 5.795 percent was doubled to 11.59 percent because of congressional concerns about the adequacy of the DRG payment rates.
However, HHS believes that these 1986 add-on payments to teaching hos- pitals for the indirect cost of medical education were too high. In its fis- cal year 1986 budget proposal, HHS stated that “there is no empirical justification” for doubling the estimate and recommended eliminating the “inappropriate doubling” of the indirect medical education payment beginning on October 1,1986.
Our analysis supports the HI-IS position that teaching adjustment factor of 11.59 percent used in fiscal year 1986 was too high. Our first cost function model (discussed on p. 24) included only those factors that
P4e33 GAO/EUDB33M~MedialEdncadonP~ymente


chapter 3 Teaching Adjustment Factors for Foci Yeara 1989 and Beyond Are Too H&h
were used to determine PPS payments in fiscal year 1985 and estimated that a lo-percent increase in the intern-to-bed ratio was associated with a 6.06~percent increase in Medicare operating cost per discharge. This estimate would have partially compensated teaching hospitals for other cost factors-hospital size, central city location, serving a dispropor- tionate share of low-income patients-as well as for indirect medical education costs.
Teaching Adjustment The Omnibus Budget Reconciliation Act of 1987 lowers the adjustment
Factors for Fiscal YeaX factor used to compute the add-on payments to teaching hospitals from 8.1 to 7.65 percent (4.05 x 1.89) beginning in fiscal year 1989. However,
1989 and Beyond our analyses of hospital costs (see ch. 2) suggest that the teaching factor
Should l3e Lowered should be no higher than 6.26 percent and could be as low as 3.73 per- cent, depending on the policy and budgetary objectives to be satisfied.
Our estimate of 6.26 percent is based on essentially the same factors that will be used to determine PPS payment rates during the period. A teaching Nustment factor based on this estimate would compensate teaching hospitals for the indirect cost of medical education, and implic- itly for other factors, such as bed size and central city location, as well as for deficiencies in the current PPS payment rates (see pp. 30-31).
Our estimate of 6.09 percent represents what we believe to be the best alternative for determinin g the additional payments to teaching hospi- tals. Again, this estimate considers essentially the same factors that will be used to determine the PPS payment rates during the period, but is generally free from the influence of other issues affecting these rates. Thus, the teaching acijustment factor would not be used to compensate for deficiencies in the current rates-deficiencies that are best addressed through separate analyses so that all hospitals may benefit. At the same time, however, an adjustment factor based on this estimate would still compensate teaching hospitals for more than just the indirect cost of medical education, implicitly recognizing such factors as bed size and central city location (see p. 25).
If, however, it is intended that the teaching adjustment factor be used to compensate for only the indirect cost of medical education, our estimate of 3.73 percent (see p. 27) could be used because it takes into account a more complete set of factors that affect hospital costs.
Beginning in fiscal year 1996, when the disproportionate share adjust- ment is scheduled to be discontinued, the teaching adjustment factor
Page 34 GAO/HWMB33 Medicare Medical Education Payments
chapter 3 Teaching Adjmtment Fectma for Fiscal Yeam 1989 and Beyond Are Too High
The $6,994 average total Medicare payment per discharge to major teaching hospitals in 1985 was $3,599 (about 106 percent) higher than the $3,395 average payment per discharge to nonteaching hospitals. Likewise, the $4,929 average total payment per discharge to minor teaching hospitals was $1,534 (about 45 percent) higher than that to nonteaching hospitals.
About 69 percent of the payment difference between major and non- teaching hospitals and 77 percent of the payment difference between minor and nonteaching hospitals was due to the higher payments for patient care made to teaching hospitals. As discussed in chapter 2, teaching hospitals receive patients who require more hospital resources to treat. In general, higher treatment costs are reflected by higher weighted DRGS into which these patients are classified, and higher weighted DRGS mean higher PPS payments. The fact that teaching hospi- tals are generally located in high-cost urban areas also helps explain the higher Medicare patient care payments to these hospitals.
Indirect Medical Aside from the differences in Medicare payments for patient care, the
Education Payments most significant difference in the average Medicare payment per dis- charge to teaching and nonteaching hospitals in 1985 was the add-on
Contribute to Overall payment made to teaching hospitals for the indirect cost of medical edu-
Payment Differences cation. On average, major teaching hospitals received an add-on of $731 per discharge and minor teaching hospitals received $176.
As discussed earlier (see p. 13), these payments were based on an adjustment factor derived from a HCFA analysis of 1981 hospital cost data which estimated that hospital costs increased by 5.795 percent for each 0.1 increase in the intern-to-bed ratio. The HCFA estimate of 5.795 percent was doubled to 11.59 percent because of congressional concerns about the adequacy of the DRG payment rates.
However, HHS believes that these 1985 add-on payments to teaching hos- pitals for the indirect cost of medical education were too high. In its fis- cal year 1986 budget proposal, HHS stated that “there is no empirical justification” for doubling the estimate and recommended eliminating the “inappropriate doubling” of the indirect medical education payment beginning on October 1,1985.
Our analysis supports the HHS position that teaching adjustment factor of 11.59 percent used in fiscal year 1985 was too high. Our first cost function model (discussed on p. 24) included only those factors that
Page 33 GAO/BRDSSB Medicare bledlcd J%duution Payments

Chapter 3 Teaching Adjustment Factors for Fiscal Yeam 1989 and Beyond Are Too High
Conclusion In fiscal year 1985, the average Medicare payment to teaching hospitals was significantly higher than that to nonteaching hospitals because the PPS rates generally reflected the more resource-intensive cases treated by teaching hospitals as well as their higher costs associated with urban locations. The add-on payments to teaching hospitals for the indirect costs of medical education also contributed to this payment differential because the statistical estimate that formed the basis for these pay- ments was doubled. Further, based on the results of our analysis, we believe that the adjustment factors for fiscal year 1989 and beyond are too high and could result in future overcompensation of teaching hospitals.
the Congress by our analysis of Medicare hospital costs, If the Congress wants to use the savings from the lower payments to teaching hospitals to reduce overall Medicare outlays, the legislation should specifically reflect this decision. The Congress also should include provisions directing the Sec- retary of HHS to reestimate periodically the effects of graduate medical education on Medicare costs based on the most current hospital cost data available at the time.
Agency Comments and Our Evaluation
our principal finding that the indirect medical education payment has been, and could continue to be, too high. Accordingly, HHS also agreed with our recommendation that the adjustment factor be lowered and that the factor be reestimated periodically using current data. HHS stated, however, that it believed that some of our technical decisions on data and regression methods were inappropriate and, thus, that the spe- cific values in the draft report were too high.
AAMC, in commenting on the draft report, also expressed a number of specific concerns about our methodology, but believed that our recom- mended values for the teaching adjustment factor were too low.
Both HI-IS and AAMC took exception to the fact that we excluded outlier cases from our calculation of the dependent variable, the average Medi- care cost per discharge, because they believed that outliers represent one of the major cost differences between teaching and nonteaching hos- pitals. We reestimated our regression models using a new dependent
Page 36 GAO/HBD8933 Medicare Medical Education Payments

chapter 3 Teaching wwtment Facto= for Fimxl Yeara 1999 and Beyond Are Too Hig!~
will rise to 8.29 percent (5.79 x 1.43). Again, our analysis suggests that the teaching adjustment factor should be lower. Our estimates range from a high of 7.19 percent-which would compensate partially for fac- tors not explicitly considered in the PPS payment rates and for deficien- cies in the rates (see p. 30-31)-to 3.73 percent. For the same reasons discussed above, we believe that our estimate of 6.06 percent represents the best policy choice.
The PPS payment rate variables, the payment adjustment factor estab- lished by the Omnibus Budget Reconciliation Act of 1987, and the com- parable GAO estimates for fiscal years 1989-95 and for fiscal year 1996 and beyond are shown in table 3.2.
Table 3.2: Comparison of the Actual leaching AdJustment Factor and the QAO Estimate (Fiscal Years 1989-95, 1996)
Omnibur Budget Reconciliation Act of 1997
Cost factors Statistical GAO reflected In estimate
leaching
Fiscal year PPS payments adjustment estimate
(percent) Multipller factor (percent) 1989-95 Case mix, 4.05 1.89 7 65 3 73-6 26
wages, location., disproportionate share, teaching
1996 Case mix, 5.79 1.43 8.29 3 73-7 19 wages, locations, teaching
%ite of the MSA.
In summary, our estimates of the indirect cost of medical education, based on actual PPS experience in fiscal year 1985, suggest that the teaching adjustment factors established by the Omnibus Budget Recon- ciliation Act of 198’7 are too high-regardless of whether the teaching adjustment is to be used only to compensate teaching hospitals for the indirect cost of medical education or to implicitly compensate them for other factors not fully accounted for in the current PPS rate-setting process.
Using our estimates could reduce add-on payments to teaching hospitals for the indirect cost of medical education from $416 million to $1.2 bil- lion in fiscal year 1989, from $458 million to $1.3 billion in fiscal year 1990, and from $543 million to $1.5 billion in 1991. These reductions in Medicare payments to teaching hospitals could be distributed to all hos- pitals by restandardizing the PPS payment rates or retained as savings by the Medicare program.
Page 36 GAO/HXb&N3 Mediure Medial Education Payments

Chapter 3 Teaching Adjustment Factors for Piacal Years 1999 and Beyond Are Too High
The four urban area variables that AAMC refers to (large Msx/central city, large MM/non-central city, medium MS, and small MSA) are used in our most fully specified model (model 4). We compared the estimate obtained from this augmented model to those obtained from the “pay- ment models” in order to examine the different policy implications involved. In this context, we believe that the location variables used were appropriate.
Based on MC’S comments, we redefined the disproportionate share variable so that it is now consistent with the PPS payment formula-that is, we used the percentage of low-income patients at hospitals that receive disproportionate share payments (see p. 25). The estimates of the effect of teaching obtained from three models that include the new disproportionate share variable (models 2,3,4) are now reflected in the report (see p. 27). However, these estimates are not significantly differ- ent from the those obtained using the categorical disproportionate share variable.
Finally, AAMC stated that our analyses “understate substantially” the appropriate indirect medical education adjustment because we did not restrict the case mix and wage index coefficients to their “actual values in the PPS payment system.” (See pp. to 54-56.)
We reestimated the four models discussed in the report, constraining the coefficients for the case mix and wage indexes as AAMC suggested. This produced higher estimates of the effect of teaching (see p. 30). As dis- cussed on page 30, this suggests that there may be measurement prob- lems in the PPS rate-setting process.
Using the higher estimates from the “constrained models” as the teach- ing adjustment factor would implicitly compensate teaching hospitals for these shortcomings as well as for the indirect cost of medical educa- tion. While this does represent a policy option, there are drawbacks to this approach, as discussed on page 31. As stated above, we believe that estimates of the indirect cost of medical education-for PPS payment purposes-should be made independent of the other PPS payment rate issues. However, we also believe that, in order to ensure equitable pay- ments to all hospitals, deficiencies in the PPS rate-setting process should continue to be addressed and corrected through separate analyses.
HHS’s technical comments are discussed further in appendix III ( pp. 50- 53), and MC’S specific comments are discussed further in appendix IV (P. 57).
Page 39 GAO/lflLD69-33 Medicare Medical Education Payments

chapter 3 Teaching AdJustment Factors for Fiscal Years 19M and Beyond Are Too High
variable (average Medicare cost per discharge) that included the uncom- pensated portion of outlier costs from the outlier cases that we had pre- viously omitted.
A comparison of the analyses done with and without outliers is now dis- cussed on pages 27-29. In summary, adding outlier costs to the analyses did not significantly change our previous estimates. Including outliers produces somewhat higher estimates in the two models that used only PPS payment variables, but lower estimates in the models that included bed size and central city location (see p. 28). This suggests that size and urban location-more than teaching-are associated with higher costs due to outlier cases.
As discussed on page 28, there are drawbacks to using estimates obtained from the analyses that include outlier cases as the basis for paying teaching hospitals. Thus, we continue to believe that the analy- ses of the indirect cost of medical education done by excluding outlier cases are preferable for purposes of setting PFS payment rates and that the adequacy of the outlier payment policies should continue to be addressed directly through separate analysis.
AAMC added that it believed that the dependent variable-average Medi- care cost per discharge- should be calculated by excluding direct medi- cal education, capital, organ acquisition, and exempt unit costs paid outside the framework of PPS. However, AAMC said that it was not clear from the draft report whether we had calculated our dependent variable exclusive of these costs.
While not clearly stated in the draft report, our dependent variable included only inpatient operating costs. Specifically, as now explained on page 24, patient bill charges were converted to costs using hospital-specific cost-to-charge ratios for each department. The cost-to- charge ratios were based on cost report data for inpatient hospital costs, exclusive of organ acquisition costs and costs from exempt units. Because the inpatient hospital costs did include direct medical education and capital costs, we removed these costs before developing the “operat- ing cost”-to-charge ratios.
AAMC also stated that our analysis would understate teaching hospital costs because we used (1) four urban area variables rather than the two actually used in defining PPS payments and (2) three disproportionate share proxy measures rather than disproportionate share payments actually received.
Page 37 GAO/RBD8933 Medhre Medical Education Payments

Appendix I
Factors Affecting Medicare Operating Cost Per Discharge (Fiscal Year 1985)
Table 1.1: Factors Affecting Medicare Operating Cost Per Discharge (Ln AVG MCD), Fiscal Year 1955 (Without Outllers) Variable
Intercept
Ln IRS
(1) 790
606
VW
Model number (2) (3) (4)
790 7 69 7 69 509 410 383
(-05) ( 05) I 05) Ln WI ,948 916 928 928
( 03) I 03)
( 03) ( 03) Ln CMI 1 27 1.27 1 08 1 07
( 03) > ,
( 03) > ,
( 04) I
( 041 MSAla 122 112 074
t.011 t.011 t.011 CClb 099
( 021
cc2 051
(01) MSA2 ,058 ,048 Ol? 015’
WI (.Ol) (-01) (01) MSA3 041 ,028 - oo4c - 002‘
(.Ol) t.011 (.Ol) (01) DSHl* 168 ,134 123 --
(.03) (.03) ( 03) DSH2 -.o; 3c’ 038c . O06c
(.W ( 05) ( 05) DSHB -.151 - 155 - 156
(.03) (.03) (.031 Ln t3DS 047 049
P4) ( 004) Number of observations 5,407 5,302 5,302 5 231 I32 648’ 660 ,668 668
Note: The absolute values of the standard errors are In parentheses. %SAl = populatron greater than 1 ,lOO.OOO; MSA2 = populatron between 250,000 and 1 .ooO CO3 MSA3 = populatron less than 250,ooO.
bCCl = located In the largest MSA and In the central crty; CC2 = located in the largest MSA. but not In the central city.
CCoefficrent IS not statistrcally srgnrficant; all other coefficients are significant at the 0 95 confidence level. -
*DSHl = urban hosprtals wrth 100 or more beds and disproportionate share of 15 percent or more DSH* = urban hosprtals with fewer than 100 beds and disproportronate share of 40 percent or more DSH3 = rural hosprtals wrth a disproportionate share of 45 percent or more.
Of?* IS a measure of how well the regression equation accounts for the variation in the dependen! vana- ble (in this case, variation In average Medicare cost per discharge). An R* of 0.50 means that 9 percent of the variation In the dependent vanable IS accounted for by the set of independent varrables used
Page 40 GAO/HBDs933 Medicare Medical Education Payments
P8ge 39 GAO/HRD&33 Medicare Medical Education Payments

Appendix 1 Fact.~rsAf’fecthgMedicareOpemtingCo~t Per Discharge (Fiscal Year 19f35)
Table 1.3: Factors Affecting Medicare Operating Coat Per Discharge (Ln AVG MCD), Fiscal Year 1985 (Without Outliers, Constraining Case Mix and Wages) Variable (1)
Intercept 7.84 Ln RI3 ,719
Model number (2) (3) (4)
7 85 7 63 7 63 626 ,436 409
( 05) ( 05) ( 05) ( 05) MSAl a ,199 .I81 126
( 01) (.Ol) (01) CClb 150
01
cc2 103
(01)
MSA2 ,115 099 046 048
C.01) (.Ol) (.Ol) (01) MSA3 a89 ,072 .020c 021c
t.011 LO11 C.01) (01,
DSHld ,154 ,131 121
(.03) ( 03) ( oi, ___. DSH2 -.056” 03gc 008’
t.03 (.05) ( 051 DSH3 - ;89’ - 172 - 172
(.03) (.03) ( 03) Ln BDS ,053 053
(.004) LOW) Number of observations 5,407 5,302 5,302 5,231
I? .204* ,221 240 -250
Note. The absolute values of the standard errors are In parentheses. %fSAl = population greater then 1,000,~; WA2 = population between 250.000 and 1 CC0 KC MSA3 = populatron less than 2!50.000
bCCl = located rn the largest MSA and In the central crty; CC2 = located In the largest MA but not In the central My
CCoefficrent IS not statrstrcally srgnrficant; all other coeffrcrents are signrficant at the 0 95 confidence level. -
dDSHl = urban hospitals with 100 or more beds and drsproportronate share of 15 percent or more DSH2 - urban hosprtals with fewer than lo0 beds and disproportionate share of 40 percent or more DSH3 = rural hosprtals with a disproportronate share of 45 percent or more.
The R* values In these models are not directly comparable to the R* values In tables I 1 and ; 2 because the dependent vanable In these models was redefined, reflecting he constrained case mix and Nage vanables
Page 42 GAO/ERLMS33 Medicare Medical Education Payments

Appendix I Facton~Af’fectingBfedi~OpelrtingC’aet Per Dbcharge (Fbcal Yenr 19@3)
Table 1.2: Factors Affecting Medicare Operatlng Coat Per Dircharge (Ln AVG MCD), Fiscal Year 1985 (With Outliers) Variable (1)
Model number (2) (3) (4)
Intercept 7.95 7.95 7 70 7 70
Ln IRB 651 516 ,405 373
Ln WI 956 ,922' ,939' C.03) (031 C.03) i 031
Ln CMI
t.031 (.W (.W (03) MSA18 131 ,118 ,074
(.Ol) (.Ol) (.Ol)
CClb 103
( 02) cc2 047
c.011
MSA2 ,062 048 .oo8c oloc
t.011 (.Ol) t.011 (01) MSA3 ,051 ,034 .oo3c - GQlC
(.Ol) (.Ol) (.Ol) i 01) DSHld ,239 202 185
t.031 f.03) (03) DSH2 -.017c .041C oo7c
(.05) t.051 (05) DSH3 -.137 -.143 - 143
(W (.03) ( 03) Ln BDS ,056 057
(.0041 (005) Number of observations 5,407 5,302 5,302 5,231 w 6730 ,687 .a36 697
Note: The absolute values of the standard errors are in parentheses. %fSAl = population greater than 1 ,ooO,OC0; MSA2 = population between 250,000 and 1 DO0 CC0 MS3 * population less than 250,000.
%Cl = located in the largest MSA and In the central city CC2 = located in the largest MSA but not m the central city
‘Coefficient is not statisttcally significant; all other coefficients are significant at the 0 95 confidence level. -
dDSHl - urban hospitals with 100 or more beds and disproportionate share of 15 percent or more DSH* = urban hospitals with fewer than 100 beds and disproportionate share of 40 percent or more DSH3 = rural hospitals with a disproportionate share of 45 percent or more.
OR2 is a measure of how well the regression equation accounts for the variation in the dependent #ana- ble (in this case, variation In average Medicare cost per discharge). An R2 of 0.50 means that M percent of the variation in the dependent vanable is accounted for by the set of independent variables used
P8ge 41 GAO/ERM933 Median Medlcd Education Payments

Appendix II Desdpdon of Factors Used in Hoepital chat ‘4nalysia
WI (wage index). The wage index is a relative measure of labor costs for each metropolitan statistical area and for the rural areas of each state. The wage index used was for fiscal year 1985 and was computed by HCFA using calendar year 1981 hospital wage and employment data obtained from the Bureau of Labor Statistics. The wage index for the area in which each hospital is located was obtained from HCFA'S fiscal year 1986 Pricer File.
IRB (intern/resident-to-bed ratio). This factor measures the size of the teaching program at each hospital. The ratio was obtained from HCFA'S fiscal year 1984 Provider Specific File.
BDS (number of hospital beds). This factor measures hospital size; it was obtained from HCFA'S Hospital Certification File (as of Dec. 3 1, 1986).
MSA (metropolitan statistical area). This factor divides the urban hospi- tals into three groups based on the size of the MSA in which they are located-areas with a population of less than 250,000; areas with a pop- ulation between 260,000 and 1 million; and areas with a population greater than 1 million. Counties that are not included in MSAS are defined as rural areas. This information was obtained from Bureau of the Cen- sus data.
Cc (central city location). This factor divides hospitals located in .MS.AS with a population greater than 1 million into two groups-those located in the central city (based on political boundaries) and those located outside the central city. This information was obtained from a Prospec- tive Payment Assessment Commission computerized file.
DSH (disproportionate share). This factor indicates the percentage of low-income patients served by a hospital. A hospital’s share of low- income patients is determined by adding (1) the percentage of part A patient days that were made up of patients entitled to Supplemental Security Income and (2) the percentage of a hospital’s total patient days that were made up of patients who were entitled to Medicaid. We used a continuous variable that reflects the percentage of low-income patients treated at hospitals that receive disproportionate share payments-( 1) urban hospitals with 100 or more beds and a disproportionate share of at least 15 percent, (2) urban hospitals with fewer than 100 beds and a disproportionate share of at least 40 percent, and (3) rural hospitals with a disproportionate share of at least 45 percent. This information was obtained from a HCFA computerized file.
Page 44 GAO- Medicare Medical Education Payments

Appendix II
Description of Factors Used in Hospital cost Analysis
A~G MCD (average Medicare cost per discharge). This factor measures the average cost of treating Medicare patients at each of 5,408 hospitals in fiscal year 1985. Using the 1985 Medicare Patient Bill File, we converted the charges on about 8 million Medicare claims to costs using hospital- specific cost-to-charge ratios for the hospital ancillary departments. These ratios were computed using the costs for each of these depart- ments as reported on the 1984 cost report.1 We also used the cost report to compute per-day rates for routine care, coronary care, and intensive care. Because the per-day rates were developed using fiscal year 1984 cost report data, we increased them by 6.24 percent-the fiscal year 1985 change in HCFA'S market basket index. The costs from all bills for each hospital were totaled and divided by the hospital’s total number of Medicare bills to arrive at the average cost per discharge. We deleted all claims identified on the file as being “outliers” (claims that have either extraordinarily high costs or lengths of stay) because of the atypical nature of these cases.
AVG MCD, (average Medicare cost per discharge/with outliers). The same as AVG MCD discussed above. However, we included the uncompensated portion of outlier costs (that is, the total cost of the discharge less the outlier payment).
CMI (case mix index). This factor measures costliness of the Medicare patients at each of the 5,408 hospitals relative to the national average costs of treating all Medicare patients. The case mix index for each hos- pital was computed by (1) converting all bill charges on the Medicare Patient Bill Pile to cost.& using the hospital-specific cost-to-charge ratios, (2) summing the cost for all bills for the 5,408 hospitals, (3) dividing the total cost by the number of bills (8 million) to obtain a national average cost per Medicare case, (4) following the same procedure for each DRG to obtain a national average cost per DRG, (5) determining the proportion of each hospital’s total Medicare cases that fell into each DRG, (6) multiply- ing the proportion for each DRG by the national average cost per DRG (item 5 multiplied by item 4) and s ununing the results, and (7) dividing this “hospital cost per case” obtained in this manner by the national average cost per case (item 6 divided by item 3). In effect, we “recalibrated” the DRGS based on 1986 relative resources used for each DRG.
‘The 1984 Cost Report File was used because the 1986 file was not available when this analysts was perfOI=Illd.
‘We standardized the patient charges to remove the effect of differences due to wages and teac,hlnp, intensity.
Page 43 GAO/EBLMW3 Medicare Medical Education Payments

Appendix ill Commenta From the Department of Health and Human Services
Seecommentl
Comments of the Department of Health and Human Services on the General Accounting Office Oraft Report,
"Indirect Medical Education Payments Are Too High"
Overview
GAO's draft report discusses its analysis of the differences in Medicare costs and payments among major teaching, minor teaching, and non-teaching hospitals. GAO has interpreted section 9202 of the Consolidated Omnibus Budget Reconciliation Act of 1985 (COBRA) as requiring GAO to study the variation in Medicare payments among hospitals with large teaching programs and those with smaller teaching programs, and the variation in payments between teaching and non-teaching hospitals. 1987.
The report was due to Congress by December 31,
According to GAO, in 1985, the average total cost per Medicare discharge at major teaching hospitals was 41 percent higher than at minor teaching hospitals and 95 percent higher than at non-teaching hospitals. Similarly, at minor teaching hospitals the average cost was 39 percent higher than at non-teaching hospitals. GAO's analysis shows that the adjustment factor currently provided by statute to compensate teaching hospitals for their higher costs attributable to the indirect costs of medical education is too high. GAO believes that reducing the adjustment factor to comport with its analysis would save an estimated total of $1.6 billion in fiscal years 1989 and 1990 and an estimated $805 million in fiscal year 1991.
We would agree with the principal finding of the GAO report that, since the start of the Prospective Payment System (PPS), the Indirect Medical Education (IME) payment adjustment has been higher than appropriate. This has resulted in windfall payments to teaching hospitals, as evidenced by the consistently higher than average Medicare margins for teaching hospitals. Our projections indicate that these higher margins for teaching hospitals are likely to continue.
Each year, the Administration has sought to rectify this situation by proposing a reduction of the adjustment factor to the value derived from a statistical analysis of Medicare costs. Therefore, we are pleased that GAO now also recommends a significant reduction in the IME adjustment factor. We also agree with GAO that the IME factor should be periodically reestimated using recent data. In fact, the Health Care Financing Administration (HCFA) is currently working to reestimate the factor.
We would point out, however, that HCFA has in the past taken issue with GAO's specific recotnnendation that the regression variables be limited to those hospital attributes for which Medicare makes payment. For example, a major question posed by the GAO recommendation has been the focus of long-standing dispute. It is whether or not to include a
Page 46 GAO/HID&93 Medicare Medical Education Payments

Appendix III
Comments From the Department of Health and HumaServices
supplementing those in the report text appear at the end of this appendix.
r DEPARTMENTOF HEALTH 8 HUMAN SERVICES Office of lns~ecfar General
Washlnglon. 0 C 20201
AUG 2 9 I98
MK. Lawrence H. Thompson Assistant Comptroller General U.S. General Accounting Office Washington, D.C. 20548
Dear Mr. Thompson:
Enclosed ace the Department's comments on your draft report, "Medicare: Indirect Medical Education Payments Are Too High." The enclosed comments represent the tentative position of the Department and are subject to reevaluation when the final version of this report is received.
The Office of Inspector General (OIG) agrees that teaching hospitals have been overcompensated as a result of receiving indirect medical education (IME) payments under the prospective payment system and endorses GAO's recommendation to reduce the current IME adjustment factor. The GAO's study confirms the OIG's prior analytical work (five audit reports issued from 1985 through 1988) which showed that hospitals were making excessive profits and recommended adjustments OK curtailment of IME payment levels.
The OIG reports have had a pronounced influence in leading to proposals to reduce IME paymentsr including the reduction resulting from the Consolidated Budget Reconciliation Act (COBRA) of 1985. Additional reductions have been and are actively under consideration. For Fiscal Year (FY) 1989 the Administration proposed a legislative amendment to cut the adjustment factor to 4.05 percent. This proposal was included in the President's FY 1989 budget.
The Department appreciates the opportunity to comment on this draft report before its publication.
Sincerely yours,
/,’ Richard P. Kusserow Inspector General
Enclosure
P8ge45 GAO/HBD8933 Medicare Medical Education Payments

Appendix III Commenta From the Department of Health and Human !Services
Seecomment2.
Seecomment3.
Seecomment4.
Page 3
However, we do not concur with GAO's specific reccxnmendation to reduce tne IME adJuStment factor from 7.65 percent to 5.13 percent for FY 1989-1990 and from 8.29 percent to 6.06 percent beginning in FY 1991. We reject their recommendation for the following reasons:
o We do not concur with GAO's recommended values of the IME adjustment factor (.5i3 and .606). We believe that some of their technical decisions on data and regression methods are inappropriate and should not become a precedent for future estimation of the IME adjustment factor. We have the following objections:
-- In constructing Medicare cost per discharge and the case mix index, GAO omitted outlier cases. The statement that outliers were omitted because of "the atypical nature of these cases," (footnote 2, Appendix II) is not valid. Omitting outliers is an arbitrary truncation of the cost distribution and may distort the means. While it may be appropriate to make an adjustment for the costs associated with the outlier portion of the stay, the entire case should not be omitted. For diagnosis related groups with large numbers of outlier cases, a substantial amount of information is being discarded.
-- For reasons not stated in the report, GAO computed average Medicare cost per discharge using a complicated case-by-case method. The method involves adjusting charges from hospital bills to costs using cost report information and aggregating the individual case costs to hospital level. It should be noted that this exercise is unnecessary and inefficient since Medicare operating costs and discharges are directly available from the cost report. In addition, whatever gain in consistency might accrue from the individual matching of bills and costs is probably offset by other problems associated with this approach. For example, 1985 bills were matched to 1984 cost reports. Also, departmental cost-to-charge ratios are notorious for extreme values which require adjustments that have unknown effects on the accuracy of the resulting estimates.
-- In estimating their IME adjustment factors, GAO used the Bureau of Labor Statistics (BLS) wage index. The fact that the BLS wage index was used for PPS payments in 1985 is not a good reason for using it in the regression equation. The best estimate of relative wage differences in 1985 should be used. We believe it would be better to use the HCFA wage index based on 1984 data.
Page 40 GAO/HBD-8933 Medicare Medical Education Payments
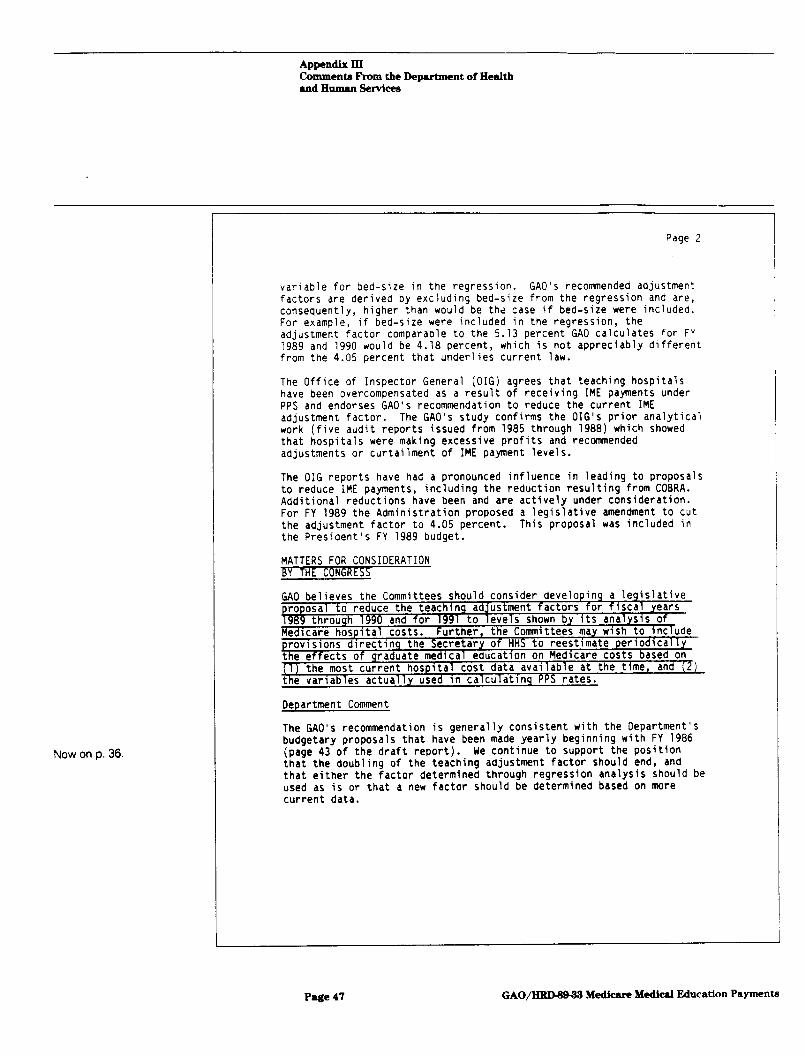
Appendix III Commenta From the Department of Health and Human Services
Nowonp.36.
Page 2
variable for bed-size in the regression. GAO's recommended adjustment factors are derived by excluding bed-size from the regression and are, consequently, higher than would be the case if bed-size were included. For example, if bed-size were included in the regression, the adjustment factor comparable to the 5.13 percent GAO calculates for FY 1989 and 1990 would be 4.18 percent, which is not appreciably different from the 4.05 percent that underlies current law.
The Office of Inspector General (OIG) agrees that teaching hospitals have been overcompensated as a result of receiving IME payments under PPS and endorses GAO's recommendation to reduce the current IME adjustment factor. The GAO's study confirms the OIG's prior analytical work (five audit reports issued from 1985 through 1988) which showed that hospitals were making excessive profits and recotmnended adjustments or curtailment of IME payment levels.
The OIG reports have had a pronounced influence in leading to proposals to reduce IME payments, including the reduction resulting from COBRA. Additional reductions have been and are actively under consideration. For FY 1989 the Administration proposed a legislative amendment to cut the adjustment factor to 4.05 percent. This proposal was included in the President's FY 1989 budget.
MATTERS FOR CONSIDERATION BY THE CONGRESS
GAO believes the Committees should consider developing a legislative roposal to reduce the teaching adJustment factors for fiscal years 989 through 1990 and for 1991 to levels shown by lts analysis of
Medicare hospital costs. Further, the Committees may wish to incrude provisions directing the Secretary of HHS to reestimate periodically the effects of graduate medical education on Medicare costs based on 11) the most current hospital cost data available at the time, and fl) the variables actually used in calculating PPS rates.
Department Comment
The GAO's recommendation is generally consistent with the Department's budgetary proposals that have been made yearly beginning with FY 1986 (page 43 of the draft report). We continue to support the position that the doubling of the teaching adjustment factor should end, and that either the factor determined through regression analysis should be used as is or that a new factor should be determined based on more current data.
J
P8ge 47 GAO/lJRW%N Medicare Medical Education Pay-menu

Appendix III Commenta From the Department of Health and Human !Services
The following are GAO'S comments on the Department of Health and Human Services’ letter dated August 29, 1988.
GAO Comments 1. HHS commented that, in the past, HCFA has taken issue with estimates of the indirect cost of medical education that were based on regression models that included only PPS payment variables. Specifically, HHS believes that hospital bed size should be included in the regression and thus disagreed with GAO'S estimates obtained from models that excluded this variable.
In chapter 2, we examined the estimates of the indirect costs of medical education obtained from “payment models”-those that include only factors explicitly recognized by the PPS payment rates-as well as esti- mates obtained from augmented models that include other variables, such as bed size. (See pp. 2426.) In general, we would agree with HHS that the more fully specified models provide a “truer” estimate of the effect of teaching on hospital costs. However, rather than recommending a specific estimate to be used as the teaching adjustment factor, our objective was to present Medicare policymakers with a range of values that could be used and to give them an understanding of the policy implications of each.
2. HHS noted that our analyses discussed in the draft report were done by excluding outlier cases. HHS commented that this would distort the analysis results and stated that outliers should not be omitted.
Based on HHS'S comments (and similar comments from NC), we redid our analyses to include the uncompensated portion of outlier costs. As discussed on pages 24-29, the addition of outlier cases did not signifi- cantly change our previous estimates. Regardless, for reasons discussed on page 29, we continue to believe that the analyses of the indirect cost of medical education done by excluding outlier cases are preferable for purposes of setting PPS payment rates and that the outlier payment pol- icy issues should continue to be addressed directly through separate analyses.
3. HHS questioned why we computed the average cost per Medicare dis- charge from the hospital bill file since operating costs and discharges are available from the hospital cost report file. HHS cited what it believed were two problems associated with this approach. First, HHS noted that the hospital cost reports used to construct departmental- specific cost-to-charge ratios were from 1984, whereas the bill charges
Page SO GAO/lWMCXW Medicare Medical Education Payments

Appendix III Comments From the Department of Health and Human Services
See comment 5
See comment 6.
Nowonpp.2andll.
See comment 7.
Nowonpp.2andll.
See comment 8.
Nowon p. 13.
See comment 9.
Page 4
o The structure of GAO's legislative recommendation will not produce savings because it neglects to amend Section 1886(d)(3)(C)(ii), which permits rates, restandardized for changes in the IME adjustment, to be reduced to achieve savings under certain circumstances. Without a modification of this section, a lower IME adjustment would result solely in restandardized rates, which would have no effect on Medicare expenditures.
We concur with GAO's recommendation that the Secretary reestimate the IME adjustment factor periodically but oppose having Congress specify how frequently reestimation should take place. We would particularly oppose annual reestimation because it would potentially introduce random fluctuations in the factor due to randomness in the data from year to year. It would also make PPS payments more variable (up or down) to the extent that the IME factor varied significantly.
Technical Connnents
1. At pages 3 and 13 of the GAO report, the report states that Medicare payments for the direct costs of graduate medical education are made on a reasonable cost basis. This is inaccurate since section 9202(a) of COBRA substituted a payment mechanism based on per-resident amounts.
2. Pages 2 and 9 of the GAO report contain inconsistent statements about the amounts paid for indirect medical education costs. Page 2 states that total direct and indirect costs were $2 billion; page 9 states that indirect costs alone were that much.
3. Footnote 5 at page 18 of the draft report would be more accurate if it stated that hospital-specific rates were based on the hospital's actual costs in a base year. It otherwise seems to imply that the hospital was reimbursed for current costs.
GAO/HUM&Xi Medicare Medical Education Payments

Appendix III Commenta Prom the DeparCment of Health and Human !krvIcea
4. HHS stated that it believes that the best estimate of relative wage dif- ferences in 1985 was the HCFA wage index based on 1984 data, rather than the Bureau of Labor Statistics (BIS) wage index that we used in our analyses.
HCFA'S 1984 wage index may be the best estimate of relative wage differ- ences at this time, and HCFA may wish to use this index in subsequent analysis of the indirect cost of medical education. However, there are several reasons why we used the BIS index at the time we did our analy- sis. First, as HI-E noted in its comments, the BIS wage index was used for PPS payments in 1985 (the year of our data). Thus, this variable was consistent with the others used in our analyses. In addition, we decided on the BIS index after consulting with HCFA officials. Further, because of errors in the 1984 wage survey data, HCFA had to perform several edits in 1987 (at the time we were doing our analyses) to ensure the accuracy of the data. Before publishing the May 27, 1988, proposed rules HCFA found it necessary to make additional changes and corrections to the 1984 wage data. Several changes were made because hospitals were incorrectly classified by wage areas (rural areas or MSAS). In fiscal year 1989, HCFA continues to use a blend of the 1984 wage index and the 1982 wage index.
5. HHS stated that unless section 1886(d)(3)(C)(ii) of the Social Security Act is amended, lowering the teaching adjustment factor will result in restandardized PPS rates rather than a reduction in Medicare expendi- tures. Thus, this section would have to be amended if savings are intended.
We agree with HHS and have now pointed out in our recommendations to the Congress that if lower payments to teaching hospitals are to result in a reduction in overall Medicare outlays, the Congress should specifi- cally reflect this decision in the legislation that reduces the teaching adjustment factor.
6. HHS stated that it would oppose annual reestimation of the teaching adjustment factor because it would potentially introduce random fluctu- ations in the factor due to randomness of the data from year to year.
Cur recommendations to the Congress state that the Congress should include a provision directing the Secretary to reestimate “periodically” the effects of graduate medical education on Medicare costs. We did not specify that this should be done annually.
Page 52 GAO/HRDW-33 Medicare Medical Education Payments

Appendix Ul Commenta From the Department of Health and Human Services
being converted with these ratios were from 1985. In addition, HHS said that the departmental cost-to-charge ratios are “notorious for extreme values,” which require adjustments that could affect the accuracy of the resulting estimates.
Our primary reasons for using the hospital bill file to compute the aver- age Medicare cost per discharge (the dependent variable in our analysis) were currency and consistency. At the time our analysis began, our choices in data sources were the 1985 bill file or the 1984 cost report file. Because one of our criteria for analyzing the variation in hospital costs was to use the most current PPS data available, we selected the 1985 bill file rather than the 1984 cost report file. Further, using the bill file allowed us to calculate the average Medicare cost per discharge and the case mix index from the same data. This consistency between the two variables was generally not present in other studies, which calcu- lated the dependent variable from the cost report and used a case mix index based on the hospital bills.
Also, the bill file provided us with additional capabilities for doing the analysis not available through the cost report data. For example, because the bills have diagnosis-related data as well as charge data, we were able to develop an additional measure of hospital case mix based on the procedures and diagnoses within DRGS. (As discussed on p. 17, the model that included this variable did not improve upon our basic models in explaining variation in hospital costs.)
As HHS noted, the 1985 hospital bill charges were converted to costs based on 1984 hospital cost report data (the most current cost report data available at the time). We do not believe, however, that the differ- ence in the dates of the two data sources should significantly affect the results of our analysis. First, the routine, coronary care, and intensive care per-day rates developed from the 1984 cost report data were increased by 6.24 percent-the fiscal year 1985 change in HCFA’S hospi- tal market basket index, which is designed to measure the changes in the prices hospitals pay for goods and services. In addition, it is unlikely that the hospital-specific cost-to-charge ratios for the hospital ancillary departments change drastically from year to year, and thus there should be little difference between the 1984 and 1985 ratios. Finally, in calcu- lating the cost-to-charge ratios, we eliminated the “extreme values” that HHS was concerned about by applying range edits. We do not believe this method of adjusting the data would significantly affect our results because of the overall number of cases-8 million-included in our analysis.
Page 51 GAO/HBDB933 ?&dic~~~ %dkd Education Payments

Appendix IV
Comments From the Association of America Medical Colleges
Note: GAO comments supplementing those in the report text appear at the end of this appendix.
321~ 1, 1988
Mr. Lawrence H. Thompson Assistant Comptrcller General Yuman Resources Divisicr. United States General Accounting Office Washington, D.C. 20548
Dear Mr. Thompson:
The Association of American Medical Colleges--a national organization representing academic medical center and community teaching hospitals, medical schools, and faculty societies-- appreciates the opportunity to comment on GAO's draft report, "Medicare: Indirect Medical Education Payments Are Too High." The indirect medical education adjustment in the Medicare Prospective Payment System (PPS) is a critically important equity factor included in PPS as a way to compensate teaching hospitals for the higher costs they incur in providing patient care. The AAMC has consistently taken the position that the adjustment must be preserved to enable teaching hospitals to viably care for Medicare patients, especially those whose atypical severity was documented in a prior GAO report, "Refinement of Diagnosis Related Groups Needed to Insure Payment Equity" (April 1988). In advocating retention of the adjustment, the AAMC's position iS
that the adiustment is most likely to be retaintd and meet its intended purpose if it is rtgularly recalculated using up-to-date data.
The AAMC is pleased that the draft GAO study recognizes that ttaching hospitals incur higher costs resulting from multiple factors such as location, wage rates, and case mix. Whilt the AAt4C btlievts it is important that GAO has undertaken its study recognizing thest teaching hospital difftrencts, wt art concerned that four features of the GAO methodology understate the appropriatt resident-to-bed adjustment for PPS.
Pirst, in both the text and the ttchnical appendix, the draft report does not clearly state that the dependent variable, AVG MCD. has betn detintd to exclude direct medical education, capital, organ acquisition and extmpt unit costs paid outside the framework of PPS. If these costs have not been rtmoved from the calculation of AVG MCD. the AAMC strongly rtcommtnds that GAO not release the present draft until a revistd analysis is completed that usts a dtptndent variable rtflecting only strvicts paid by PPS payments.
Qm Duponi Clrclt, N.W., Wshlngton, D.C. 20036
Page54

Appendix III Comments Fkom the Department of Health and Human Services
7. HHS pointed out that on pages 2 and 11 of the draft report, we had stated that Medicare pays for the direct cost of medical education on a reasonable cost basis. HHS stated that section 9202(a) of COBRA changed the payment method to a per-resident amount.
We have modified our discussions of the payments for the direct cost of medical education to reflect the COBRA change.
8. HHS believed that the draft report contained an inconsistency in that page 2 stated that total direct and indirect medical education costs were $2 billion, while page 11 stated that indirect costs alone were that much.
There was no inconsistency in the statements cited by nns-the total direct and indirect medical education costs referred to on page 2 were for fiscal year 1986, while the indirect costs referred to on page 11 were projected for fiscal year 1988.
9. HIS stated that footnote 6 would be more accurate if it stated that hospital-specific rates were based on the hospital’s actual costs in the base year.
We have made the recommended change.
Page 63 GAO/HRDW33 Medicare Medical Education Payments
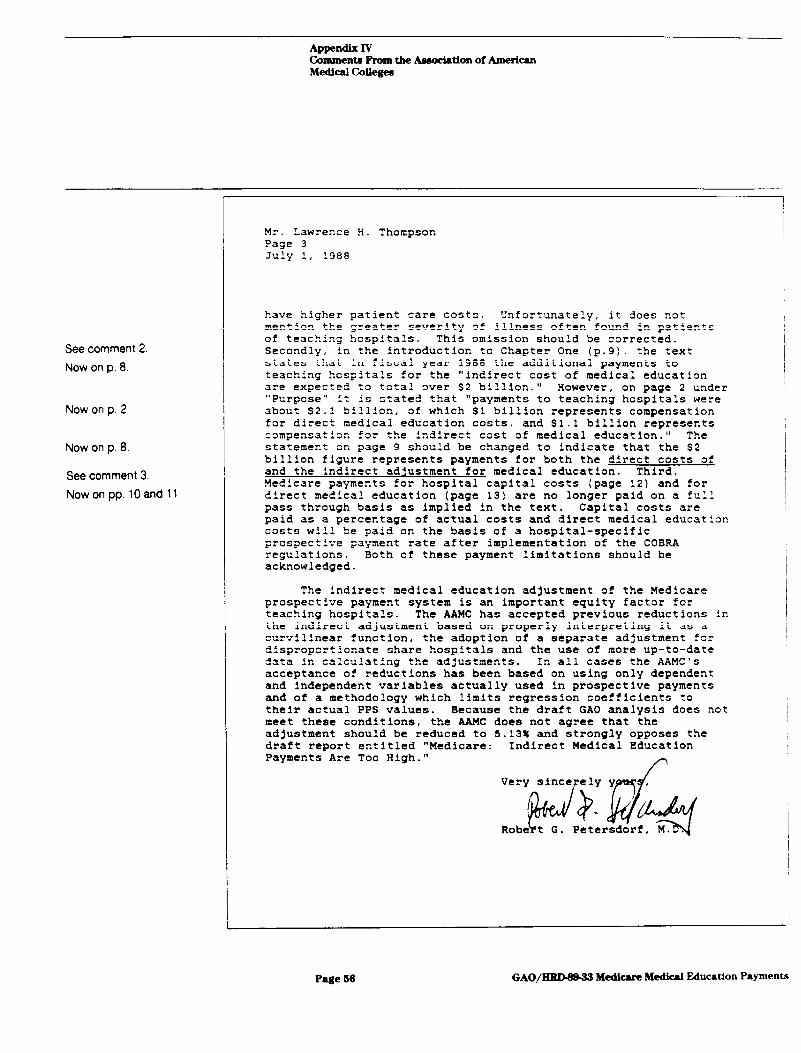
C4mmfmta Prom the Aaoochtion of American Medical Collegea
See comment 2
Now on p. 8.
Now on p. 2
Now on p. 8.
See comment 3.
Nowonpp.lOandll.
Mr. Lawre-ce Y. Thompson Page 3 July :, 1900
have higher patient care costs. Unfortunately. it does not mention the greater severity of illness often found in patier.ts of teaching !lOSpitalS. This omission should be corrected. Secondly, in the introduction to Chapter One (p.9). the text states that in fiscal year 1900 the additional payments to teaching hospitals for the "indirect cost of medical education are expected to total over $2 billion." Rowever, on page 2 under "Purpose" it is stated that "payments to teaching hospitals were abOat S2.1 billion, of which $1 billion represents compensation for direct medical education costs, and $1.1 billion represents compensa., . . for the indirect cost of medical education.” +io.. The statemelt on page 9 should be changed to indicate that the $2 billion figure represents payments for both the direct costs of and the indirect adjustment for medica? education. Third, Medicare payments for hospital capital costs (page 12) and for direct medical educatior. (page 13) are no longer paid on a fu?? pass through basis as implied in the text. Capital costs are paid as a percentage of actual costs and direct medical education costs will be paid on the basis of a hospital-specific prospec.,. ci.., payment rate after implementation of the COBRA regnlat ions. Both of these payment limitations should be acknowledged.
The indirect medical education adjustment of the Medicare prospective payment system is an important equity factor for teaching hospitals. The AAUC has accepted previous reductions in the indirect adjustment based on properly interpreting it as a curvilinear function, the adoption of a separate adjustment for dispropc rtionate share hospitals and the use of more up-to-date data ir. calculating t!-.e adjustments. In all cases the AAMC's acceptance of reductions has been based on using only dependent and independent variables actually used in prospective payments and of a methodology which limits regression coefficients to their actual PPS values. Because the draft GAO analysis does not meet these conditions, the AAUC does not agree that the adjustment should be reduced to 5.13% and strongly opposes the draft report entitled "Medicare: Indirect Medical Education Payments Are Too High."
P
P8ge 56 GAO- Medic8re Medical Education Payments

Appendix IV CommentaFromtheAaaociationofAmerican Medical Colleges
Now on p. 2.
See comment 1
Mr. Lawrence R. Thompson. Page 2 July t, 1900
Second, footnote 2 in Appendix II states, "We deleted al? claims identified on the file as being "outliers" (claims that have an extraordinary high cost) because of the atypical nat.2re of these cases." Teaching hospitals treat large numbers of these patients. According to ProPAC's June :900 Report to Conqress, teaching hospitals constitute 10 percent of all 'J.S. hospitals and treat 39 percent of Medicare discharges, but receive 61 percent of outlier payments. Studies by our members show the ??S payments are substantially below the costs of care for these patients. By removing these cases from the data base, GAC! has excluded from its analysis one of the major differences between teaching and non-teaching hospitals. The AAMC believes this is a serious methodological error which must be corrected by a complete recalculation of the data wh.ich includes outliers.
Third, in performing its regression analysis, GAO has not restricted the case mix and wage index coefficients to their actual values in the PPS payment system. Appendix I shows regressicn results with case mix coefficients ranging from :.C? to 1.27 while the PPS system presumes a coefficient of 1.30. The Appendix shows wage index coefficients cf 9.93 to l.C? while the PPS system presumes a coefficient of 0.15. By ail owing the case mix and wage index coefficients to have values other thar. those used to make actual payments, the analysis overstates the payments actually paid to teaching hospitals and understates substantially the appropriate indirect medical education adjustment. Thus, the analysis should be recalculated constraining the case mix and wage index coefficients to their ?PS values.
Fourth, in establishing the independent variables for the analysis, GAO has used four urban area variables rather than the two actually used in defining POS payments. Three disproportionate share proxy measures are used rather than disproportionate share payments actually received. The AAMC believes these additional variables overstate the actual payments made by Medicare. This results in a statistical estimate which understates the true difference in teaching hospital costs. The AAMC believes this understatement should be corrected with a methodology which uses the actual PPS variables for urban areas and actual measures of disproportionate share payments.
In addition to these major methodological concerns, the AAMC also suggests several changes to improve the clarity of the language in the report. First, on page 3, in the last paragraph of the Background Section of the Executive Summary, the report addresses some of the factors that cause teaching hospitals to
Page65 GAO/HBBW33 Medicare Medical Education Pa) mcnts

Ppe
k&k Contributors to This Report
Human Resources Division, Washington, D.C.
Michael Zimmerman, Senior Associate Director, (202) 275-6195 Thomas G. Dowdal, Group Director Terence J. Davis, Assignment Manager Robert C. DeRoy, Computer Analyst Edward H. Tuchman, Computer Analyst Steven R. Machlin. Statistician
Detroit Regional Office Donald P. Warsing, Evaluator-in-Charge Louis M. Ockunzzi, Staff Member Lawrence W. Stochl, Staff Member
(106294)
*“.s. c,.p.tJ. :;--..w’.:-u:51:-
GAO/HRDW33 Medhre Medical Education Payments

Appendix W Comments From the Association of American Medical Colleges
The following are GAO’S comments on the Association of American Medi- cal Colleges’ letter dated July 1, 1988.
GAO Comments 1. AAMC stated that the discussion on page 2 of the factors that cause teaching hospitals to have higher patient care costs did not mention the “greater severity of illness often found in patients of teaching hospitals.”
The discussion in question, contained in the executive summary, was intended to provide an initial understanding of the concept of the “indi- rect cost of medical education” rather than an all-inclusive listing of the factors that cause higher costs at teaching hospitals. As discussed on page 18, some studies do suggest that the indirect costs of medical edu- cation are due to the severity of illness of patients treated at teaching hospitals. However, there is no consensus on this issue.
2. AAMC believed that the draft report contained an inconsistency in that page 2 stated that total direct and indirect medical education costs were $2 billion, while page 8 stated that indirect costs alone were that much.
There was no inconsistency in the statements cited by MC-the total direct and indirect medical education costs referred to on page 2 were for fiscal year 1986, while the indirect costs referred to on page 8 were projected for fiscal year 1988.
3. AAMC was concerned that the draft report implied that hospital capital costs and direct medical education costs were still paid on a “full pass through basis.” AAMC pointed out that Medicare payments for capital are based on a percentage of actual costs, while payments for direct medical education costs are based on hospital-specific prospective payment rates.
Because the focus of this report is hospital operating costs, our discus- sions of capital and direct medical education costs were intended to be somewhat general. Nevertheless, in discussing hospital capital costs (see p. lo), we state that hospitals are reimbursed “based on” reasonable costs and we do not believe that this implies that they are still paid on a full pass through basis. We have clarified the discussion of Medicare payments for direct medical education, stating that these payments are based on per-resident costs in a base year (see p. 11).
Page 57 GAO/HUH943 Medicare Medical Education Payments

. I
Requests for copies of (;A() reports should be sent to:
U.S. General Accounting Office Post Office Box 6015 Gaithersburg, Maryland 20877
Telephone 2022756241
The first five copies of each report are free. Additional copies are $2.00 each.
There is a 2Y0 discount on orders for 100 or more copies mailed to a single address.
Orders must be prepaid by cash or by check or money order made out to the Superintendent of Documents.