individual account retirement plans: an analysis of the ... · plans such as 401(k) plans), as well...
TRANSCRIPT

A research report from the EBRI Education and Research Fund © 2018 Employee Benefit Research Institute
March 13, 2018 • No. 445
The Survey of Consumer Finances (SCF) is a leading source of data on Americans’ wealth,
as it provides information on the incidence of retirement plan ownership and account
balances that families have accumulated along with all the other assets that families may
have amassed. The questions in SCF allow for not only the calculation of the percentage of
families owning individual retirement accounts (IRAs) but also for estimation of the
distribution of IRA assets across types—regular, rollover, and Roth IRAs.
Individual Account (IA) plans include employment-based retirement savings plans financed
by both employer and employee contributions (most notably, defined contribution (DC)
plans such as 401(k) plans), as well as Keogh plans for the self-employed, and individual
retirement accounts (IRAs) for savings outside of the workplace.
Individual Account Retirement Plans: An Analysis of the 2016 Survey of Consumer Finances
By Craig Copeland, Employee Benefit Research Institute
A T A G L A N C E
Individual account (IA) retirement plans are the dominant source of financial assets for retirement income among
current and future retirees—and they continue to grow.
This Issue Brief assesses the status of American families' accumulations in IA plans, both in terms of ownership and
average amounts accumulated. The Survey of Consumer Finances (SCF), the Federal Reserve’s triennial survey of
wealth, is the basis for this study.
An Employee Benefit Research Institute (EBRI) analysis of SCF data finds that:
• In 2016, 66.5 percent of all families that had an active participant in an employment-based retirement plan
from a current employer had a DC plan only. Furthermore, 16.2 percent of these families had both a defined
benefit (DB) and DC plan, while 17.2 percent had a DB plan only.
• Among these families with an active participant, a significant shift occurred from 1992 to 2016; the percentage
having a DB plan only decreased from 40.0 percent in 1992 to the 17.2 percent in 2016. On the other hand,
the percentage of those families having a DC plan only surged, rising from 37.5 percent in 1992 to just above
66 percent in 2013 and 2016. The percentage of families with both types of plans decreased from 22.5 percent
in 1992 to 16.2 percent in 2016.
• The percentage of family heads who were eligible for defined contribution (DC) plans and chose to participate
increased from 78.7 percent in 2013 to 79.4 percent in 2016.
• The percentage of families owning IRAs or Keogh plans increased from 26.1 percent in 1992 and 28.1 percent
in 2013 to 29.9 percent in 2016.

ebri.org Issue Brief • March 13, 2018 • No. 445 2
• The percentage of families with an IA retirement plan from a current or previous employer or an IRA/Keogh
plan was 52.1 percent in 2016. The largest movement in this percentage of families with an IA plan occurred
among those families with the oldest heads (ages 75 or older), where the percentage reached 40.9 percent in
2016 from 29.0 in percent in 2013. In addition, the average account balance of those families owning IA plans
increased from $75,300 in 1992 and $208,639 in 2013 to $232,502 in 2016.
• As DC plans have proliferated in the private sector, the assets in all IA retirement plans have become the
predominate source of financial assets for American families holding these assets. In 2016, IA assets
constituted 67.9 percent of financial assets at the median among these families owning IA assets. This median
percentage of financial assets represented by IA assets is 3.7 percentage points higher than the median in
2007 and 23.6 percentage points higher than in 1992.
• By IRA type, regular IRAs accounted for the largest percentage of IRA ownership, but rollover IRAs had the
largest share of IRA assets in 2016.
• The percentage of IA plan assets in DC plans from a current employer amounted to 40.9 percent in 2016. The
percentage in a previous employer DC plan was 8.7 percent, while IRAs/Keogh plans held 50.4 percent of the
IA plan assets. As the age of the family head increased, the larger the percentage of IA plan assets that were
in IRA/Keogh plans. In 2016, the percentage of IA plan assets for families with heads ages 35-44 that were in
IRA/Keogh plans was 29.7 percent compared with 74.8 percent for families with heads ages 65 or older.
• Not only do IA assets make up a large portion of families’ financial assets, but those with IA assets also have
substantially higher levels of net worth than those families without IA assets. The median net worth for
families that owned IA assets was $249,950 in 2016 compared with $19,200 for families without IA assets.
While the results of this study do not answer questions about what is needed for retirement, they show the
continued growing importance of individual account retirement plans. Consequently, any policy that alters this
system could have consequences–either positive or negative–for Americans’ ability to fund a comfortable
retirement.

ebri.org Issue Brief • March 13, 2018 • No. 445 3
Craig Copeland is a senior research associate at the Employee Benefit Research Institute (EBRI). This Issue Brief was
written with assistance from the Institute’s research and editorial staffs. Any views expressed in this report are those of
the author and should not be ascribed to the officers, trustees, or other sponsors of EBRI, EBRI-ERF, or their staffs.
Neither EBRI nor EBRI-ERF lobbies or takes positions on specific policy proposals. EBRI invites comment on this
research.
Copyright Information: This report is copyrighted by the Employee Benefit Research Institute (EBRI). It may be
used without permission but citation of the source is required.
Recommended Citation: Craig Copeland, “Individual Account Retirement Plans: An Analysis of the 2016 Survey of
Consumer Finances,” EBRI Issue Brief, no. 445 (Employee Benefit Research Institute, March 13, 2018).
Report availability: This report is available on the internet at www.ebri.org
Table of Contents
Introduction .............................................................................................................................................. 5
Trends in Individual Account Retirement Plan Ownership .............................................................................. 6
Employment-based Retirement Plans from Current Employers ...................................................................... 8
Defined Contribution Plan Participation Rates of Family Heads ...................................................................... 8
IRA/Keogh Ownership ................................................................................................................................ 8
Retirement Plans from Any Source ............................................................................................................ 11
Individual Account Retirement Plan Balances ............................................................................................. 11
Average Values ....................................................................................................................................... 11
Median Values ......................................................................................................................................... 11
Percentage of Financial Assets from Individual Account Retirement Plans .................................................... 16
Distribution of Individual Account Retirement Plan Assets ........................................................................... 16
Distribution of IRA Types and Assets ......................................................................................................... 16
Comparison of Net Worth and Home Ownership for Those With and Without IA Assets ................................ 19
Conclusion .............................................................................................................................................. 20
References .............................................................................................................................................. 21
Endnotes ................................................................................................................................................ 23
Figures
Figure 1, U.S. Private Sector Retirement Plan and IRA Assets, 1996‒2016 ................................................................. 5
Figure 2, Distribution of Retirement Plan Types for Families With an Active Participant in an Employment-based
Retirement Plan, by Various Demographic Categories, 1992, 2010, 2013, and 2016 ....................................... 7
Figure 3, Participation Rates of Family Heads Eligible for an Employment-based Defined Contribution Plan, 1995, 2001,
2007, 2010, 2013, and 2016 ...................................................................................................................... 9
Figure 4, Percentage of Families With an IRA/Keogh, by Various Demographic Categories, 1992, 2001, 2007, 2010,
2013, and 2016 ...................................................................................................................................... 10

ebri.org Issue Brief • March 13, 2018 • No. 445 4
Figure 5, Percentage of All Families With a Retirement Plan From a Current or Previous Employer or an IRA/Keogh Plan,
2001, 2007, 2010, 2013, and 2016 ........................................................................................................... 12
Figure 6, Average Family IRA/Keogh Balances, Defined Contribution Plan Balances, and Total Balances, for Those
Families Owning These Accounts, by Various Demographic Categories, 1992, 2001, 2010, 2013, and 2016 ... 13
Figure 7, Median Family IRA/Keogh Balances, Defined Contribution Plan Balances, and Total Balances, for Those
Families Owning These Accounts, by Various Demographic Categories, 1992, 2001, 2010, 2013, and 2016 ... 14
Figure 8, Median Percentage of Financial Assets in Employment-based Defined Contribution Plans and IRAs/Keoghs for
Families With these Assets, by Various Categories, 1992, 2001, 2007, 2010, 2013, and 2016 ....................... 15
Figure 9, Distribution of Families' Individual Account Plan Assets, by Various Categories, 2016 .................................. 17
Figure 10, Percentage of Families' IRA Ownership and Percentage Share of IRA Assets Owned by Families, by IRA Type
or Combination of IRA Types, 2016 .......................................................................................................... 17
Figure 11, Percentage of Total IRA and Keogh Assets, by Keogh and IRA Type, 2016 ............................................... 18
Figure 12, Distribution of Families' IRA Assets, by Various Categories, 2016 ............................................................. 19
Figure 13, Median and Average Net Worth and Home Ownership for Families With and Without an IA Retirement Plan,
by Family Income and Age of the Family Head, 2016 ................................................................................. 19

ebri.org Issue Brief • March 13, 2018 • No. 445 5
Individual Account Retirement Plans: An Analysis of the 2016
Survey of Consumer Finances
By Craig Copeland, Employee Benefit Research Institute
Introduction
Individual account (IA) retirement plans are the dominant source of financial assets for retirement income for current
and future private-sector retirees; are gaining importance for public-sector retirees; and are continuing to grow in size.
IA plans include employment-based retirement savings plans financed by employer and employee contributions (most
notably, defined contribution (DC) plans such as 401(k) plans), as well as Keogh plans for the self-employed and
individual retirement accounts (IRAs) for savings outside of the workplace.
Among public-sector employers, defined benefit (DB) pension plans remain the predominant type of retirement plan,
although DC 401(k) plan-type options are increasing. Among private-sector employers, DB plans have been declining
for many years, as DC plans have become the retirement plan of choice. Total DC and IRA assets overtook private-
sector DB pension assets in 1996 (Figure 1). Furthermore, DB plans in many cases are not available for newly hired
private-sector workers, leaving these workers to build their retirement wealth through IA plans.
IRA assets have continued to grow in importance, overtaking assets in private sector DC plans in 2000, and reaching a
point of being 41 percent larger than assets held in DC plans by the end of 2016. This growth has been at least partially
attributable to rollovers from assets built up in employment-based plans. Consequently, much of the assets from DC
plans have ended up in IRAs, where individuals can draw them down to fund their retirement as necessary, or can at

ebri.org Issue Brief • March 13, 2018 • No. 445 6
least withdraw the assets as required by the required minimum distribution rules.1 Therefore, the amount of assets
currently accumulated in IA plans provides an indication of how prepared—or unprepared—workers will be to
supplement the Social Security benefits they will receive in retirement.
This Issue Brief assesses the status of American families' accumulations in IA plans, both through the incidence of
ownership and the average amounts accumulated. The Survey of Consumer Finances (SCF), the Federal Reserve’s
triennial survey of wealth, is the basis for this study. SCF is a leading source of data on Americans’ wealth, as it
provides information on the incidence of retirement plan ownership and account balances that families have
accumulated along with all the other assets that families may have amassed.2 Building on previous research by the
Employee Benefit Research Institute (EBRI) using prior SCF surveys,3 this study focuses specifically on IA retirement
plan assets.4 Using results from the prior studies, this report shows the changes in IA retirement plan assets as well as
changes in the incidence of these individual accounts both inside and outside of employment-based arrangements.5
Furthermore, particular attention is paid to ownership of IRAs, because they are the predominant source of retirement
assets and the questions in SCF allow for not only the calculation of the percentage of families owning them but also
for estimation of the distribution of IRA assets across types—regular, rollover, and Roth IRAs.6
The 2016 SCF shows that the median net worth of American families increased by 16 percent, after decreasing 2
percent from 2010 to 2013, and the median value of family income increased from 2013 to 2016 by 10 percent,
compared with a 5 percent decrease from 2010 to 2013. In prior survey study periods, American families’ median net
worth decreased 38.8 percent from 2007 to 2010, and increased 17.7 percent from 2004 to 2007; 1.5 percent from
2001–2004; 10.4 percent from 1998–2001; and 17.6 percent from 1995–1998.7
While asset accumulation is a vital component to consider when assessing retirement preparedness, it is not the only
factor that will determine financial security in retirement. The second vital component is the use of accumulated funds
such that retirees do not outlive their assets. Even for workers with DB plans, which are increasingly offering lump-sum
distributions both at preretirement termination of employment and on formal retirement from the work force, how and
when these assets are spent remains an important decision—especially when the lump-sum option is chosen.8 Because
of the growing prevalence of lump-sum distributions from employment-based retirement plans, increasing numbers of
workersand retired workerswill have the responsibility of managing their assets themselves, rather than having the
lifetime income of an annuity in retirement that DB plans historically have provided.
Thus, although this Issue Brief focuses on ownership of IA retirement plans, it must be stressed that this is only an
indicator of future potential financial security—because individuals’ financial security in retirement will ultimately be
determined by the source and amount of retirement resources, how distributions are taken from these sources, how
individuals invest them in the interim, and how fast assets are spent, along with individuals’ health status and life span.
This Issue Brief investigates the percentage of families who own various types of retirement plans, including IRAs.
Next, it provides both median and average estimates of the value of the assets in these accounts, as well as the
proportion of total financial assets represented and their relative percentages within the IA retirement plan universe. It
then focuses on the value of IRA rollovers as part of the total IRA market, in order to glean a sense of the full
contribution that the employment-based, retirement-plan system makes to total retirement assets.
Trends in Individual Account Retirement Plan Ownership
Employment-based plans are generally categorized as either defined benefit plans (pensions—traditional or cash
balance) or defined contribution plans (401(k)-type plans). Generally, traditional defined benefit plans provide benefits
according to a formula based on the worker’s tenure and salary history, and are not directly affected by the changes in
the investment returns of the plan assets. Contributions to these plans are generally made by the employer and in
some cases (most notably in the public sector) also by the individual participant. So-called hybrid individual account
defined benefit plans, most commonly cash balance plans, provide benefits that are generally based on contributions by
the sponsor and a credit rate set by the plan.9

ebri.org Issue Brief • March 13, 2018 • No. 445 7
Defined Defined Both Defined Defined Both Defined Defined Both Defined Defined Both
Benefit Contribution Plan Benefit Contribution Plan Benefit Contribution Plan Benefit Contribution Plan
Only Only Types Only Only Types Only Only Types Only Only Types
Total 40.0% 37.5% 22.5% 19.5% 57.7% 22.8% 15.3% 66.7% 18.0% 17.2% 66.5% 16.2%
Family Income
Less than $10,000 69.9 30.1 0.0 13.9 74.1 12.0 0.2 99.8 0.0 20.3 60.4 19.3
$10,000-$24,999 56.6 42.8 0.6 26.3 72.2 1.6 18.5 75.3 6.2 26.1 68.9 4.9
$25,000-$49,999 50.2 39.7 10.1 25.4 65.8 8.8 22.8 67.0 10.2 21.0 69.6 9.4
$50,000-$99,999 42.6 36.8 20.7 21.6 58.6 19.8 17.8 64.0 18.3 20.1 68.1 11.8
$100,000 or More 26.9 36.5 36.6 14.6 52.2 33.3 9.3 68.2 22.5 12.4 63.8 23.8
Age of Family Head
<35 37.0 47.7 15.3 14.6 69.9 15.5 16.0 71.4 12.6 18.4 68.7 12.9
35-44 39.5 35.8 24.7 16.5 59.4 24.1 13.1 70.0 16.8 15.0 68.7 16.3
45-54 40.1 31.8 28.2 23.9 48.5 27.6 17.4 62.9 19.8 15.4 68.3 16.3
55-64 43.8 33.4 22.8 23.8 53.4 22.9 12.9 66.0 21.1 18.8 61.6 19.6
65-74 57.9 30.7 11.5 29.0 58.7 12.3 23.5 56.0 20.5 24.9 57.6 17.6
75 or Older a a a a a a 9.4 51.5 39.2 8.2 91.7 0.1
Education of Family Head
Below HS Diploma 51.0 37.0 12.0 33.4 55.6 11.0 23.3 69.7 7.0 23.6 59.8 16.6
HS Diploma 43.6 37.3 19.2 21.1 58.9 20.0 20.9 60.2 19.0 19.2 67.3 13.6
Some College 38.5 39.8 21.7 18.8 60.1 21.1 14.4 67.3 18.3 16.9 66.3 16.9
College Degree 36.7 36.8 26.6 17.4 56.3 26.4 12.5 69.2 18.3 15.8 67.2 17.0
Race
White Non-Hispanic 37.9 37.6 24.4 18.9 56.5 24.7 14.3 66.8 19.0 14.4 68.3 17.3
Nonw hite 48.5 37.0 14.6 21.8 62.2 16.0 18.1 66.4 15.5 23.6 62.6 13.8
Work Status
of Family Head
Someone Else 39.4 37.2 23.4 19.0 57.4 23.6 14.9 66.5 18.6 16.9 66.7 16.4
Self-employed 40.5 43.9 15.7 23.9 61.8 14.4 16.0 74.4 9.6 15.5 71.6 12.9
Retired 66.0 18.6 15.4 24.0 52.0 24.0 16.3 59.7 24.0 25.0 58.4 16.6
Other Nonw ork 26.6 51.9 21.6 14.7 73.0 12.4 30.9 64.5 4.6 18.5 62.8 18.7
Net Worth Percentile
Bottom 25% 46.2 46.9 7.0 29.9 60.6 9.5 26.6 63.7 9.7 30.5 62.2 7.4
25-49.9 45.0 36.9 18.1 19.5 64.6 15.8 18.8 68.0 13.2 21.7 66.9 11.4
50-74.9 40.6 35.3 24.1 19.4 51.3 29.3 16.3 64.6 19.1 15.7 66.6 17.7
75-89.9 36.2 33.7 30.1 15.5 55.2 29.3 8.7 65.3 26.0 10.8 64.7 24.5
Top 10% 24.1 39.9 36.0 12.8 60.9 26.3 4.7 74.2 21.1 6.3 73.3 20.4
Source: Employee Benefit Research Institute estimates of the 1992, 2001, 2013, and 2016 Survey of Consumer Finances.
Note: All income values are in 2016 dollars. The 2013 and 2016 distirbutions are not directly comparable to 1992 and 2001 because of changes in the
survey that began in 2004.
a–Sample size is too small for a reliable estimate.
Figure 2
Distribution of Retirement Plan Types for Families With an Active Participant in an Employment-based
Retirement Plan, by Various Demographic Categories, 1992, 2001, 2013, and 2016
1992 2001 2013 2016

ebri.org Issue Brief • March 13, 2018 • No. 445 8
By contrast, defined contribution plans provide benefits that are determined by the level of contributions (both from the
worker and the employer) and any asset returns on these contributions. Workers not eligible for a plan through
employment, and in some cases workers wanting to augment employment-based plans, as well as nonworking spouses,
can set up an individual retirement account; and many self-employed workers can establish a Keogh plan to save for
retirement.
Employment-based Retirement Plans from Current Employers
In the 2016 SCF, 66.5 percent of all families that had an active participant in an employment-based retirement plan
from a current employer were found to have a DC plan only (Figure 2). Furthermore, 16.2 percent of these families had
both a DB and DC plan, while 17.2 percent had a DB plan only. Among these families with an active participant, a
significant shift occurred from 1992 to 2016; the percentage having a DB plan only decreased from 40.0 percent in
1992 to the 17.2 percent in 2016, which was up from 15.3 percent in 2013. On the other hand, the percentage of those
families having a DC plan only surged, rising from 37.5 percent in 1992 to just above 66 percent in 2013 and 2016. The
percentage of families with both types of plans decreased from 22.5 percent in 1992 to 16.2 percent in 2016.10
The type of retirement plan a family has is linked to the demographic characteristics of the family and the family head.
Families with the highest incomes were the most likely to have both a DB and DC plan. In 2016, 23.8 percent of
families with income of $100,000 or more with a plan had both a DB and DC plan, compared with 4.9 percent of the
families with income of $10,000–$24,999. 11 Also, families with heads ages 65-74 were the most likely to have both a
DB and DC plan, and families with higher net worth were more likely to have both plans.
However, across all demographic groups, families were most likely to have a DC plan only in 2016. This is a significant
change from 1992, when almost all categories were most likely to have had a DB plan only. For instance, in 1992, 57.9
percent of families with heads ages 65-74 had a DB plan only, but in 2016, 57.6 percent of these families had a DC
plan only.
Defined Contribution Plan Participation Rates of Family Heads
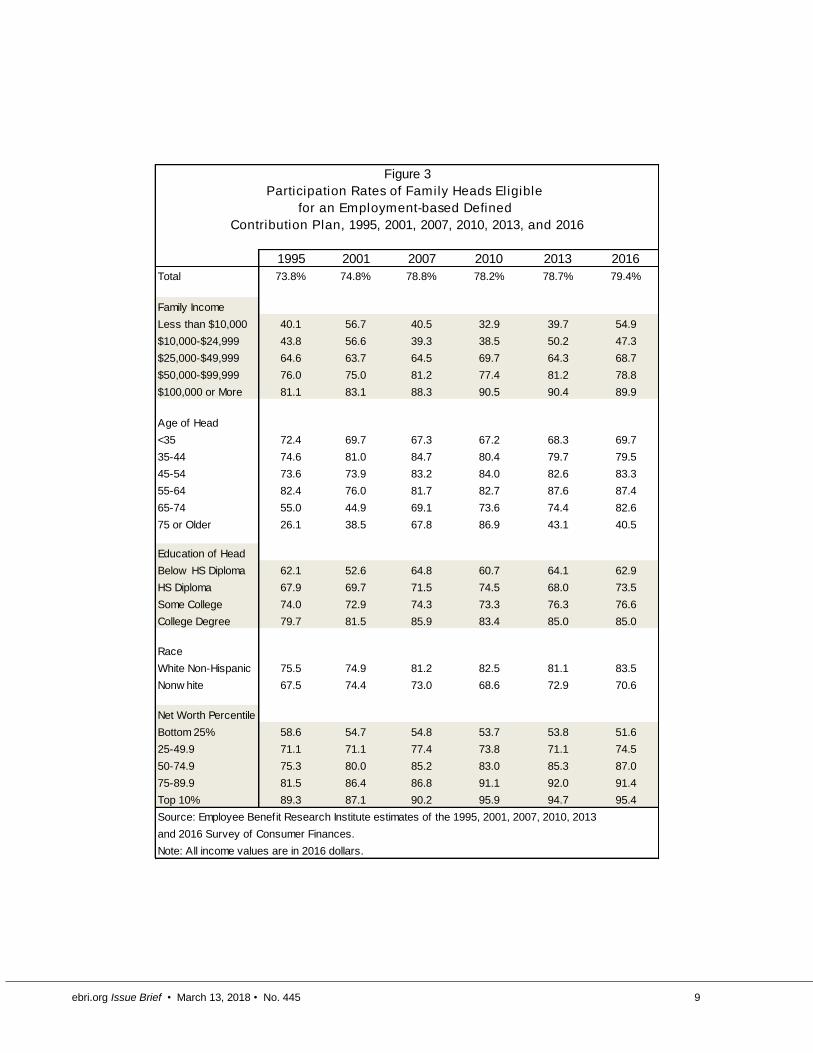
Overall, in 2016, 79.4 percent of defined contribution plan eligible family heads chose to participate in the plan
(conversely, just over 20 percent of eligible family heads chose not to participate). This was up slightly from 78.7
percent in 2013 (Figure 3).12
A number of demographic differences have persisted over the six survey periods: the increased likelihood of plan
participation with higher levels of family income (above $10,000), net worth, and educational attainment.13 For
example, in 2016, the participation rate was just 47.3 percent of family heads with annual family income of $10,000–
$24,999, compared with 89.9 percent for those with annual family income of $100,000 or more. Additionally, racial
disparities existed; white family heads were more likely to participate when eligible than nonwhite family heads. In
2016, 83.5 percent of white family heads who were eligible participated compared with 70.6 percent for nonwhite
family heads. In 2016, the likelihood of participating in a current employer plan when eligible increased with the age of
the family head through age 64, before declining for ages 65 and above. This same pattern resulted in 2013, but in
prior years the age of the family head did not have such a clear pattern for those ages 35-64, where the percentages
were similar across age groups and in some cases families with younger heads had higher likelihoods of participation.
IRA/Keogh Ownership
The percentage of families who owned either an IRA or a Keogh plan increased in 2016 to 29.9 percent from 28.1
percent in 2013 and 28.0 percent in 2010. This ownership rate was near the 2007 level of 30.6 percent but below the
peak level of 31.4 percent in 2001 (Figure 4).
Ownership of an IRA/Keogh increased with family income, the family head’s educational level, and the family’s net
worth. Of families with less than $10,000 a year in income, 5.2 percent owned an IRA/Keogh in 2016, compared with
59.3 percent of families with income of $100,000 or more. Not surprisingly, the percentage owning an IRA/Keogh
increased even more substantially when measured by net worth: in 2016, only 4.7 percent of those in the lowest 25th
ebri.org Issue Brief • March 13, 2018 • No. 445 9
1995 2001 2007 2010 2013 2016
Total 73.8% 74.8% 78.8% 78.2% 78.7% 79.4%
Family Income
Less than $10,000 40.1 56.7 40.5 32.9 39.7 54.9
$10,000-$24,999 43.8 56.6 39.3 38.5 50.2 47.3
$25,000-$49,999 64.6 63.7 64.5 69.7 64.3 68.7
$50,000-$99,999 76.0 75.0 81.2 77.4 81.2 78.8
$100,000 or More 81.1 83.1 88.3 90.5 90.4 89.9
Age of Head
<35 72.4 69.7 67.3 67.2 68.3 69.7
35-44 74.6 81.0 84.7 80.4 79.7 79.5
45-54 73.6 73.9 83.2 84.0 82.6 83.3
55-64 82.4 76.0 81.7 82.7 87.6 87.4
65-74 55.0 44.9 69.1 73.6 74.4 82.6
75 or Older 26.1 38.5 67.8 86.9 43.1 40.5
Education of Head
Below HS Diploma 62.1 52.6 64.8 60.7 64.1 62.9
HS Diploma 67.9 69.7 71.5 74.5 68.0 73.5
Some College 74.0 72.9 74.3 73.3 76.3 76.6
College Degree 79.7 81.5 85.9 83.4 85.0 85.0
Race
White Non-Hispanic 75.5 74.9 81.2 82.5 81.1 83.5
Nonw hite 67.5 74.4 73.0 68.6 72.9 70.6
Net Worth Percentile
Bottom 25% 58.6 54.7 54.8 53.7 53.8 51.6
25-49.9 71.1 71.1 77.4 73.8 71.1 74.5
50-74.9 75.3 80.0 85.2 83.0 85.3 87.0
75-89.9 81.5 86.4 86.8 91.1 92.0 91.4
Top 10% 89.3 87.1 90.2 95.9 94.7 95.4
Source: Employee Benefit Research Institute estimates of the 1995, 2001, 2007, 2010, 2013
and 2016 Survey of Consumer Finances.
Note: All income values are in 2016 dollars.
Contribution Plan, 1995, 2001, 2007, 2010, 2013, and 2016
for an Employment-based Defined
Participation Rates of Family Heads Eligible
Figure 3

ebri.org Issue Brief • March 13, 2018 • No. 445 10
1992 2001 2007 2010 2013 2016
Total 26.1% 31.4% 30.6% 28.0% 28.1% 29.9%
Family Income
Less than $10,000 5.1 5.9 8.0 9.0 6.6 5.2
$10,000-$24,999 6.1 10.0 9.0 9.0 7.2 7.5
$25,000-$49,999 18.4 19.8 20.4 19.6 19.3 18.6
$50,000-$99,999 31.6 33.4 33.2 30.3 32.2 32.8
$100,000 or More 59.5 60.3 57.2 56.9 58.6 59.3
Age of Head
<35 13.1 18.3 16.2 13.9 13.8 15.0
35-44 27.8 29.5 28.8 21.5 25.3 26.8
45-54 34.1 38.7 35.3 28.7 28.3 29.8
55-64 44.5 41.5 39.5 41.3 38.2 37.8
65-74 33.7 41.9 43.0 39.8 41.2 39.3
75 or Older 6.8 25.5 27.3 31.0 26.5 36.6
Education of Head
Below HS Diploma 7.6 8.7 9.4 6.2 4.0 8.2
HS Diploma 19.7 22.3 20.2 17.6 17.7 17.7
Some College 26.1 28.1 27.5 22.8 20.9 25.1
College Degree 43.8 52.3 50.1 46.6 46.8 51.2
Race
White Non-Hispanic 31.1 36.6 37.0 35.4 35.4 37.9
Nonw hite 10.8 14.7 15.1 12.8 13.1 15.3
Working Status
of Head
Someone Else 27.5 30.3 30.9 26.5 27.7 29.2
Self-employed 42.9 49.8 42.9 42.6 42.4 39.7
Retired 22.3 27.0 27.8 28.8 27.0 30.4
Other Nonw ork 8.5 20.6 16.5 13.4 14.7 15.3
Net Worth Percentile
Bottom 25% 2.4 4.8 4.6 5.6 4.5 4.7
25-49.9 12.9 16.9 17.3 13.4 11.8 14.9
50-74.9 29.6 35.1 35.9 29.2 30.5 34.9
75-89.9 52.5 60.3 57.4 55.3 57.2 57.0
Top 10% 69.9 81.2 74.5 76.9 78.2 77.7
Source: Employee Benefit Research Institute estimates of the 1992, 2001, 2007, 2010,
2013, and 2016 Survey of Consumer Finances.
Note: All income values are in 2016 dollars.
Percentage With an IRA/Keogh
Figure 4
Percentage of Families With an IRA/Keogh, by Various
Demographic Categories, 1992, 2001, 2007, 2010, 2013, and 2016

ebri.org Issue Brief • March 13, 2018 • No. 445 11
percentile of net worth owned an IRA/Keogh, compared with 77.7 of those in the top 10 percent. These differences
were consistent over the years of the study.
The ownership of IRA/Keoghs also increased with the family head’s age through age 74, but families with the oldest
heads had a lower likelihood of owning an IRA/Keogh than those whose heads were ages 55‒64. Families with a white
family head were significantly more likely to own an IRA/Keogh in 2016 than those with nonwhite heads (37.9 percent
versus 15.3 percent), and this has been the case going back to 1992.
Retirement Plans from Any Source
In 2016, 64.9 percent of families had a current or previous employer’s retirement plan (including DB plans) or an
IRA/Keogh (Figure 5). Fifty-two percent of families had individual account retirement plans (excluding DB plans). The
percentage with these plans (including DBs) increased with family income, net worth, and educational level of the
family head. Families with a white family head were more likely to own one of these plans. Less than 50 percent of
families with a head under age 35 (47.6 percent) had one of these plans, but this percentage increased with age to
72.8 percent for families with a head ages 55–74, before decreasing to 70.7 percent of families with heads ages 75 or
older.14
In 2001, 66.6 percent of all families had a current or previous employer’s retirement plan (including DB plans) or an
IRA/Keogh—the highest level seen from 2001‒2016. The highest year for ownership of IA retirement plans was 2007
at, 53.0 percent of all families. The same differences across demographic groups discussed above for 2016 were also
present in 2001–2013. In most cases, the 2001 and 2007 levels of ownership in these plans were higher than they
were in 2016.
Individual Account Retirement Plan Balances
Average Values
Among families with an IRA/Keogh plan, the average value of their account holdings was $203,904 in 2016, a 2 percent
real increase from $199,934 in 2013 (Figure 6).15, 16 From 1992–2016, the average IRA/Keogh balance increased 228
percent, from $62,147 (in 2016 dollars) in 1992.
The factors related to higher average IRA/Keogh balances were higher family income, older family head, higher
educational level of the family head, white family head, and higher net worth. For example, among families with heads
younger than age 35 who also owned an IRA/Keogh, the average plan balance was $19,672 in 2016 compared with
$314,924 among those IRA/Keogh owning families with heads ages 65 or older. In general, the same results for 2016
among the categories held true in the prior survey years.
Among families with a DC plan, the average balance in 2016 was $167,957. This was a real increase of 24.6 percent
from $134,815 in 2013.17 In addition, the average total balance of those families with at least one IRA/Keogh or DC
account increased 11.4 percent from $208,639 in 2013 to $232,502 in 2016. While the overall average total balance
increased, families in specific categories had declines in their average balances from 2013 to 2016. In particular,
families with heads ages 35‒44 or ages 65 or older, incomes less than $100,000, and those with a family head with
only some college education saw their average total balances decline from 2013 to 2016.
Median Values
Among all families with an IRA/Keogh in 2016, the median balance was $53,000 (Figure 7).18 This was a 109 percent
increase from the 1992 value of $25,401 and a 3 percent increase from the 2013 value of $51,555. The median
IRA/Keogh balance increased in 2016 with family income, family head age, and family net worth—a pattern that held
true in 1992–2013. Families with a white family head have consistently had higher median balances than those with
families with a nonwhite head. For example, the median balance of families with a white family head that had
IRA/Keoghs was $62,000 in 2016, compared with $23,000 for families without a white family head. The median

ebri.org Issue Brief • March 13, 2018 • No. 445 12
Excluding Including Excluding Including Excluding Including Excluding Including Excluding Including
DB DB DB DB DB DB DB DB DB DB
Total 52.8% 66.6% 53.0% 66.2% 50.4% 63.8% 49.2% 63.5% 52.1% 64.9%
Family Income
Less than $10,000 10.2 17.4 12.9 18.9 11.8 21.0 10.5 15.2 11.1 17.0
$10,000-$24,999 16.1 31.2 13.4 31.6 14.1 28.9 13.2 28.1 13.4 24.8
$25,000-$49,999 38.0 57.6 38.9 59.1 40.3 57.5 36.6 57.3 38.5 56.9
$50,000-$99,999 65.6 81.2 67.2 79.3 63.0 78.0 65.4 81.1 66.0 80.7
$100,000 or More 86.2 92.6 85.9 90.9 86.9 93.1 87.3 92.6 85.7 92.9
Age of Head
<35 45.3 51.0 42.1 48.5 41.1 46.5 39.3 45.4 42.2 47.6
35-44 61.6 70.2 57.8 63.9 52.2 60.4 55.4 61.8 56.7 63.4
45-54 63.8 75.7 65.4 73.2 60.0 68.8 56.5 65.8 59.8 67.5
55-64 59.3 77.1 61.2 78.6 59.8 73.9 59.3 73.9 59.3 72.8
65-74 45.4 69.1 51.7 73.5 48.9 70.4 48.0 74.0 49.8 72.8
75 or Older 27.6 58.7 30.0 65.5 32.7 70.3 29.0 65.8 40.9 70.7
Education of Head
Below HS Diploma 17.9 36.9 21.6 36.3 17.1 31.5 14.1 31.3 19.7 29.7
HS Diploma 46.1 61.6 43.3 59.3 40.6 57.5 37.6 56.6 40.5 58.3
Some College 53.7 67.0 53.0 65.8 48.6 62.3 43.8 58.6 49.6 62.7
College Degree 75.0 85.0 74.0 84.1 70.4 80.5 71.2 80.5 74.9 84.8
Race
White Non-Hispanic 57.5 71.5 58.6 72.0 58.1 71.6 56.7 71.6 60.4 73.4
Nonw hite 37.7 50.8 39.5 52.0 34.4 47.8 34.0 46.9 36.8 49.3
Work Status
of Head
Someone Else 61.8 71.8 62.7 71.5 59.6 68.4 59.5 68.0 62.0 69.5
Self-employed 58.9 67.6 54.5 58.0 54.6 61.6 53.2 61.0 52.0 60.4
Retired 30.9 59.6 34.4 63.3 34.4 63.9 32.2 62.5 37.5 64.1
Other Nonw ork 26.2 31.7 25.9 33.3 23.6 29.3 24.1 30.1 22.9 28.6
Net Worth Percentile
Bottom 25% 19.1 33.6 19.5 33.1 19.7 31.3 17.4 28.1 18.6 30.7
25-49.9 46.0 62.8 48.6 63.5 42.7 58.2 40.0 58.4 43.1 57.9
50-74.9 63.8 79.4 63.0 79.0 58.4 76.6 57.8 77.5 63.8 79.3
75-89.9 78.3 88.5 77.8 87.8 75.7 87.3 76.9 87.9 78.8 90.7
Top 10% 87.7 93.3 84.5 90.6 87.9 91.8 89.2 92.9 88.6 93.0
Source: Employee Benefit Research Institute estimates of the 2001, 2007, 2010, 2013, and 2016 Survey of Consumer Finances.
Note: All income values are in 2016 dollars.
Figure 5
Percentage of All Families With a Retirement Plan From a Current or Previous Employer
or an IRA/Keogh Plan, 2001, 2007, 2010, 2013, and 2016
2001 2007 2010 20162013

ebri.org Issue Brief • March 13, 2018 • No. 445 13
IRA
/D
efined
IRA
/D
efined
IRA
/D
efined
IRA
/D
efined
IRA
/D
efined
Keogh
Contr
ibutio
nTota
lK
eogh
Contr
ibutio
nTota
lK
eogh
Contr
ibutio
nTota
lK
eogh
Contr
ibutio
nTota
lK
eogh
Contr
ibutio
nTota
l
Tota
l$62,1
47
$58,5
79
$75,3
00
$131,8
36
$96,2
63
$141,9
83
$164,3
83
$144,4
61
$191,4
89
$199,9
34
$134,8
15
$208,6
39
$203,9
44
$167,9
57
$232,5
02
Fam
ily In
com
e
$10,0
00-$
24,9
99
21,0
59
13,2
16
19,1
93
30,3
21
13,0
09
24,2
60
65,8
42
22,4
16
51,0
58
99,1
46
32,9
41
71,4
68
33,1
86
25,8
78
32,6
16
$25,0
00-$
49,9
99
34,5
70
8,1
12
24,0
50
58,5
91
29,0
26
47,4
94
107,1
90
31,7
45
72,1
19
88,4
50
25,8
93
61,8
54
67,5
92
31,6
41
52,0
35
$50,0
00-$
99,9
99
41,9
71
33,6
48
45,4
33
79,2
43
49,3
85
74,9
75
107,9
28
61,4
55
95,3
10
122,3
14
70,6
91
112,7
83
120,7
40
68,3
06
107,8
22
$100,0
00 o
r M
ore
100,1
10
116,4
80
151,2
52
202,1
73
171,4
17
260,8
00
241,9
22
284,8
35
377,0
27
311,6
12
250,3
10
397,4
57
316,8
53
321,1
24
452,5
11
Age o
f H
ead
<35
17,7
29
21,0
16
23,6
26
20,4
06
21,5
10
25,5
47
21,6
90
27,4
23
30,0
79
23,5
79
25,0
01
29,7
98
19,6
72
30,8
66
32,7
53
35-4
438,3
65
35,8
42
46,5
40
58,0
29
73,6
17
87,6
99
71,9
55
75,4
52
94,2
42
75,8
18
98,8
99
117,2
31
63,9
92
85,1
87
101,9
53
45-5
472,9
08
101,9
03
117,9
13
136,5
76
123,6
68
171,7
88
140,4
87
153,9
01
191,1
60
121,2
12
150,5
92
183,6
24
136,1
50
184,5
27
219,4
24
55-6
477,9
06
117,5
94
119,0
55
216,9
42
202,5
92
270,7
46
202,8
57
292,3
28
330,7
62
236,2
25
202,9
78
294,2
66
271,4
01
302,3
03
384,5
05
65 o
r O
lder
92,0
12
41,5
27
93,3
58
194,8
93
183,8
93
212,5
81
245,7
93
256,1
41
285,3
91
350,3
29
278,6
61
387,1
55
314,9
24
286,6
81
350,2
58
Educatio
n o
f H
ead
Belo
w H
S D
iplo
ma
31,4
24
16,2
67
26,1
67
50,2
95
42,3
32
49,3
52
47,9
14
31,9
47
38,9
47
30,4
75
42,1
47
40,2
64
86,1
00
134,1
21
133,7
14
HS
Dip
lom
a49,2
33
33,2
18
47,2
28
74,1
54
46,2
85
67,2
11
83,4
32
67,5
77
84,0
48
89,1
81
69,2
15
89,8
44
86,2
45
86,8
57
98,5
14
Som
e C
olle
ge
42,7
33
32,5
14
46,6
24
83,4
61
72,3
22
92,0
49
93,4
45
72,9
38
94,9
82
138,3
65
95,6
14
136,3
50
119,0
05
95,9
40
128,5
23
Colle
ge D
egre
e77,4
71
87,7
77
108,6
78
175,1
34
140,6
31
214,5
26
213,0
82
217,7
79
289,9
20
251,2
31
180,9
34
290,4
82
275,4
45
248,0
43
352,7
24
Race
White
Non-H
ispanic
65,0
89
63,2
36
80,8
68
142,4
07
107,4
41
158,3
03
174,6
42
167,6
38
217,2
42
223,3
01
156,4
23
245,4
32
219,2
62
194,3
89
265,5
06
Nonw
hite
36,2
67
36,1
49
42,3
11
47,2
79
53,8
52
62,1
80
105,6
52
77,5
75
101,4
53
70,3
96
71,4
73
83,2
53
134,0
93
100,1
57
133,0
32
Net W
ort
h P
erc
entil
e
Bottom
25%
5,1
07
3,1
34
3,6
58
5,1
96
4,6
37
5,0
74
9,2
09
12,5
53
12,8
06
8,9
17
10,2
25
10,7
84
10,2
04
9,9
78
10,9
24
25-4
9.9
9,2
05
10,4
05
11,2
30
15,1
78
17,7
36
19,2
50
16,0
56
18,8
07
20,1
12
15,6
71
17,4
13
19,1
20
15,2
72
20,8
79
21,7
28
50-7
4.9
25,3
25
26,8
80
32,6
94
36,4
41
53,5
57
57,7
87
39,3
77
59,9
26
62,3
30
43,4
78
67,0
00
71,2
95
46,5
71
69,7
14
73,2
99
75-8
9.9
46,9
27
69,6
08
72,0
74
97,4
00
132,8
67
151,5
81
116,0
02
166,7
70
184,8
49
116,0
78
177,7
26
199,9
37
142,9
28
207,2
17
231,6
33
Top 1
0%
146,9
79
251,0
72
247,3
45
350,1
59
405,9
63
515,0
03
427,6
37
602,4
36
722,1
95
541,6
63
511,6
03
751,0
50
567,6
23
691,1
72
893,5
85
Sourc
e: Em
plo
yee B
enefit R
esearc
h In
stit
ute
estim
ate
s o
f th
e 1
992, 2001, 2010, 2013, and 2
016 S
urv
ey o
f C
onsum
er
Fin
ances.
Note
: A
ll in
com
e a
nd a
sset valu
es a
re in
2016 d
olla
rs. Fam
ilies w
ith in
com
es b
elo
w $
10,0
00 d
id n
ot have a
suff
icie
nt sam
ple
siz
e o
f observ
atio
ns to p
resent a r
elia
ble
estim
ate
.
Fig
ure
6
Ave
rag
e F
am
ily I
RA
/Ke
og
h B
ala
nce
s, D
efi
ne
d C
on
trib
uti
on
Pla
n B
ala
nce
s, a
nd
To
tal
Ba
lan
ce
s, f
or
Th
ose
Fa
mil
ies
Ow
nin
g
Th
ese
Acco
un
ts,
by V
ari
ou
s D
em
og
rap
hic
Ca
terg
ori
es,
1992,
2001,
2010,
2013,
an
d 2
016
2016
2010
2001
1992
2013

ebri.org Issue Brief • March 13, 2018 • No. 445 14
IRA
/D
efined
IRA
/D
efined
IRA
/D
efined
IRA
/D
efined
IRA
/D
efined
Keogh
Contr
ibutio
nTota
lK
eogh
Contr
ibutio
nTota
lK
eogh
Contr
ibutio
nTota
lK
eogh
Contr
ibutio
nTota
lK
eogh
Contr
ibutio
nTota
l
Tota
l$25,4
01
$13,5
47
$23,7
07
$36,5
59
$27,0
81
$39,8
09
$44,2
01
$35,3
61
$48,6
21
$51,5
55
$38,1
51
$60,8
35
$53,0
00
$43,0
00
$60,0
00
Fam
ily In
com
e
$10,0
00-$
24,9
99
8,9
57
2,5
84
7,7
52
14,8
94
2,9
79
7,4
47
22,2
17
5,1
95
13,2
64
25,7
78
5,1
56
10,3
11
9,0
00
5,0
00
7,6
00
$25,0
00-$
49,9
99
17,2
26
3,4
45
9,9
91
20,3
11
7,4
47
12,3
22
27,6
33
9,2
85
17,7
95
27,8
40
9,8
99
18,5
60
30,0
00
9,0
00
18,0
00
$50,0
00-$
99,9
99
20,6
71
12,0
58
20,6
71
27,0
81
20,3
11
31,1
43
33,1
59
26,5
27
33,1
59
41,2
44
27,8
40
43,3
06
36,0
00
30,0
00
40,2
00
$100,0
00 o
r M
ore
41,3
42
43,0
64
62,7
02
60,2
55
64,9
94
94,7
83
90,6
35
112,7
41
165,7
95
82,4
88
123,7
32
173,7
40
105,0
00
120,0
00
200,0
00
Age o
f H
ead
<35
8,6
36
5,0
80
7,8
91
9,4
78
8,1
24
9,4
78
11,0
50
11,0
50
11,7
13
10,3
11
10,3
11
12,3
73
10,0
00
10,0
00
12,0
20
35-4
418,6
27
10,1
60
15,2
40
20,3
11
32,4
97
38,5
90
20,9
96
33,1
51
34,2
56
25,7
78
37,2
23
44,0
28
26,0
00
30,0
00
37,0
00
45-5
429,6
34
33,8
68
44,0
28
54,1
62
40,6
21
64,9
94
44,2
01
55,2
51
66,3
02
47,4
31
75,2
70
89,7
06
49,0
00
66,0
00
82,0
00
55-6
438,9
48
30,4
81
50,8
01
62,2
86
68,3
79
74,4
72
66,3
02
83,9
82
110,5
03
72,1
77
77,3
33
107,2
34
80,0
00
87,0
00
120,0
00
65 o
r O
lder
33,8
68
8,4
67
33,8
68
74,4
72
67,7
02
77,1
80
77,3
52
83,9
74
78,4
57
111,3
59
62,8
97
121,6
70
117,0
00
100,0
00
120,0
00
Educatio
n o
f H
ead
Belo
w H
S D
iplo
ma
13,5
47
5,0
80
11,8
54
24,3
73
8,1
24
13,5
40
35,3
61
12,1
55
18,0
12
20,6
22
10,3
11
13,4
04
50,0
00
25,0
00
37,0
00
HS
Dip
lom
a22,0
14
7,2
82
16,9
34
24,3
73
16,2
48
24,3
73
26,5
21
22,1
01
27,6
26
36,0
89
24,7
46
34,2
33
34,0
00
28,0
00
36,0
00
Som
e C
olle
ge
20,3
21
10,6
68
20,3
21
23,0
19
24,3
73
27,0
81
33,1
51
23,5
81
29,8
36
41,2
44
30,3
14
42,2
75
30,0
00
22,6
00
34,6
00
Colle
ge D
egre
e30,4
81
23,7
07
36,4
08
48,7
45
40,6
21
67,7
02
60,8
87
58,5
67
85,0
87
63,9
28
58,7
73
94,8
61
81,0
00
79,0
00
118,0
00
Race
White
Non-H
ispanic
25,4
01
13,5
47
25,4
01
40,6
21
33,8
51
47,3
91
50,8
31
43,0
96
59,6
72
60,8
35
51,5
55
78,3
64
62,0
00
50,0
00
77,0
00
Nonw
hite
14,3
94
10,1
60
13,5
47
12,1
86
13,5
40
13,5
40
28,7
31
25,4
16
27,6
26
20,6
22
20,8
28
23,7
15
23,0
00
27,0
00
30,0
00
Net W
ort
h P
erc
entil
e
Bottom
25%
3,7
25
1,6
93
1,6
93
4,0
31
2,5
73
2,7
08
5,5
25
5,5
25
5,5
25
3,3
00
4,2
48
4,8
46
4,8
00
4,0
00
4,3
00
25-4
9.9
6,7
73
6,0
96
7,1
12
7,4
47
10,1
55
10,1
55
9,9
45
12,1
55
13,2
05
10,3
11
11,4
45
12,4
76
10,0
00
13,0
00
15,0
00
50-7
4.9
16,9
34
16,2
56
22,5
22
21,1
23
37,9
13
40,6
21
24,3
11
44,2
01
45,3
06
26,8
09
51,5
55
53,6
17
29,0
00
50,0
00
52,0
00
75-8
9.9
30,4
81
44,0
28
49,6
16
58,2
24
83,9
51
106,9
69
66,3
02
132,6
04
149,1
79
82,4
88
144,3
54
170,1
32
95,0
00
155,0
00
198,0
00
Top 1
0%
67,7
35
121,9
23
127,0
03
146,2
36
203,1
06
270,8
08
221,0
06
314,9
34
456,3
77
270,1
48
297,9
88
463,9
95
325,0
00
400,0
00
634,0
00
Sourc
e: Em
plo
yee B
enefit R
esearc
h In
stit
ute
estim
ate
s o
f th
e 1
992, 2001, 2010, 2013, and 2
016 S
urv
ey o
f C
onsum
er
Fin
ances.
Note
: A
ll in
com
e a
nd a
sset valu
es a
re in
2016 d
olla
rs. Fam
ilies w
ith in
com
es b
elo
w $
10,0
00 d
id n
ot have a
suff
icie
nt sam
ple
siz
e o
f observ
atio
ns to p
resent a r
elia
ble
estim
ate
.
Fig
ure
7
Me
dia
n F
am
ily I
RA
/Ke
og
h B
ala
nce
s, D
efi
ne
d C
on
trib
uti
on
Pla
n B
ala
nce
s, a
nd
To
tal
Ba
lan
ce
s, f
or
Th
ose
Fa
mil
ies
Ow
nin
g
Th
ese
Acco
un
ts,
by V
ari
ou
s D
em
og
rap
hic
Ca
terg
ori
es,
1992,
2001,
2010,
2013,
an
d 2
016
1992
2001
2010
2016
2013

ebri.org Issue Brief • March 13, 2018 • No. 445 15
1992 2001 2007 2010 2013 2016
Total 44.3% 50.6% 64.2% 70.3% 70.3% 67.9%
Family Income
Less than $10,000 35.3 21.5 82.3 63.5 51.5 45.7
$10,000-$24,999 35.3 50.5 51.3 52.5 59.6 56.7
$25,000-$49,999 46.2 51.4 69.8 72.2 69.4 68.6
$50,000-$99,999 45.6 53.3 69.7 71.2 75.7 70.3
$100,000 or More 43.4 49.1 59.1 69.6 64.9 66.2
Age of Head
<35 45.5 45.2 57.5 61.5 59.7 58.3
35-44 46.7 60.5 72.3 77.5 73.8 72.3
45-54 57.8 59.1 72.4 77.5 79.1 76.9
55-64 44.7 46.5 66.3 73.4 76.9 74.1
65 or Older 27.5 35.2 40.5 52.0 53.3 52.9
Education of Head
Below HS Diploma 54.4 50.0 77.3 81.8 78.9 83.3
HS Diploma 44.6 58.0 70.9 76.2 76.0 74.0
Some College 39.9 50.3 64.2 72.2 76.3 70.4
College Degree 44.7 48.2 58.7 64.9 64.6 61.5
Race
White Non-Hispanic 42.7 49.3 62.5 67.6 69.2 67.2
Nonw hite 56.3 57.0 71.3 76.8 73.3 69.7
Work Status
of Head
Someone Else 50.0 56.6 71.7 75.1 75.4 71.9
Self-employed 39.4 40.4 49.0 56.0 51.1 53.6
Retired 31.0 34.8 40.2 52.0 57.1 58.6
Other Nonw ork 57.5 38.1 69.6 71.4 73.8 68.5
Net Worth Percentile
Bottom 25% 63.4 58.0 72.3 76.9 75.5 61.7
25-49.9 50.0 61.6 73.0 77.2 74.7 70.9
50-74.9 46.9 56.0 71.5 73.9 78.2 73.1
75-89.9 41.1 46.9 62.6 69.9 68.8 71.1
Top 10% 32.3 32.0 42.6 48.5 49.2 47.7
Source: Employee Benefit Research Institute estimates of the 1992, 2001, 2007, 2010, 2013, and 2016
Survey of Consumer Finances.
*Includes DC balances w ith both current and previous employers.
Note: All income values are in 2016 dollars.
Median Percentage of Financial Assets in Employment-based Defined
Contribution Plans* and IRAs/Keoghs for Families With These Assets,
by Various Categories, 1992, 2001, 2007, 2010, 2013, and 2016
Figure 8

ebri.org Issue Brief • March 13, 2018 • No. 445 16
IRA/Keogh balance relationship with educational attainment has not been direct or consistent across years, except for
those with the highest educational attainment having the highest median balances each year.
The median DC balance for those owning them increased from 2013 to 2016, but the median total balance (IRA/Keogh
and/or DC plan balance) for those owning these accounts decreased. The median DC balance increased 13 percent
from $38,151 to $43,000,19 while the real median total balance decreased 1 percent from $60,835 to $60,000.
However, families with certain characteristics had changes opposite to the overall changes from 2013 for both median
DC balances and median total balances. For example, families with incomes of $100,000 or above, families with heads
ages 55-64, and families with a nonwhite head had increases in their median total balances, while families with heads
ages 45-54 had a decrease in their median DC balance.
Percentage of Financial Assets from Individual Account Retirement Plans
The importance of IA plans to the wealth of families with these plans can be measured by the percentage of financial
assets20 that their IA plan assets represent. In 2016, for families with IA plans, the median percentage of financial
assets that IA plan assets represented was 67.9 percent—down from 70.3 percent in 2013, but 3.7 percentage points
higher than in 2007 and 23.6 percentage points higher than in 1992 (Figure 8). Consequently, as defined contribution
plans have proliferated in the private sector, the assets in individual account retirement plans have become the
predominate source of financial assets for American families holding these assets.
Of families with IA assets in 2016, the median percentage of their financial assets that IA plan assets represented was
greater than 50 percent for all family categories examined in this study, except for those with incomes of less than
$10,000 and those in the top 10 percent of net worth. Thus, among families owning IA plan assets, these assets have
become a very important resource for those without the highest levels of assets. For example, in 2016, IA retirement
plan assets represented at the median 73.1 percent of total financial assets for families with net worth in the third
quartile, compared with 47.7 percent for families with net worth in the top 10 percent.
Distribution of Individual Account Retirement Plan Assets
IRA/Keoghs accounted for 50.4 percent of all IA retirement plan assets in 2016, while current-employer DC plan assets
accounted for 40.9 percent and previous-employer DC plan assets 8.7 percent (Figure 9). However, this distribution
was significantly different based on the families’ net worth, income, and age of the family head.
For example, for families in the lowest net worth quartile, 71.9 percent of IA assets were in current employer DC plans,
4.6 percent in previous employer DC plans, and 23.5 percent in IRA/Keoghs. For comparison, among families in the top
10 percent of net worth, 35.7 percent of IA assets were in current-employer DC plans, 8.6 percent in previous employer
DC plans, and 55.7 percent in IRA/Keoghs. Furthermore, for families with heads ages 35‒44, 65.8 percent of IA assets
were in current-employer DC plans, 4.5 percent were in previous-employer DC plans, and 29.7 percent were in
IRA/Keoghs; while for families with heads ages 65 or older, the respective percentages were 13.8 percent, 11.4
percent, and 74.8 percent.
Distribution of IRA Types and Assets
SCF categorizes IRA assets into three types—Roth, rollover, and regular IRAs.21 Measuring the amount of IRA assets
attributable to rollovers is important in ascertaining the full impact of wealth generated within the employment-based
retirement plan system, because rollover IRAs are primarily funded by assets generated in other types of retirement
plans (notably DB plans or 401(k) plans). This section analyzes the categorization of IRA assets to see the relative asset
values by types.
The analysis starts by determining the distribution of IRA types owned by families. The most prevalent owned IRA type
was regular IRAs only at 29.8 percent (Figure 10). The next most commonly owned IRA type was rollover only, at 23.9
percent, and the third most common type was the Roth only, at 22.6 percent. Next, Roth and regular IRAs owned
together accounted for 9.0 percent of IRAs held by families; rollover and regular IRAs accounted for 6.1 percent; Roth
and rollover IRAs, 5.3 percent; and rollover, regular, and Roth IRAs, 3.3 percent.

ebri.org Issue Brief • March 13, 2018 • No. 445 17
Defined Defined
Contribution Contribution
Current Employer Previous Employer IRA/Keogh
Total 40.9% 8.7% 50.4%
Family Income-Percentile
Bottom 25% 14.9 18.4 66.7
25-49.9 27.8 10.9 61.3
50-74.9 34.7 9.5 55.8
75-100% 43.3 8.2 48.5
Age of Head
<35 74.3 4.4 21.3
35-44 65.8 4.5 29.7
45-54 65.0 4.0 31.0
55-64 45.2 9.8 45.0
65 or Older 13.8 11.4 74.8
Net Worth Percentile
Bottom 25% 71.9 4.6 23.5
25-49.9 66.9 8.8 24.3
50-74.9 57.7 7.5 34.7
75-89.9 46.1 9.3 44.6
Top 10% 35.7 8.6 55.7
Source: Employee Benefit Research Institute estimates of the 2016 Survey of
Consumer Finances.
Figure 9
Distribution of Families' Individual Account Plan Assets,
by Various Categories, 2016

ebri.org Issue Brief • March 13, 2018 • No. 445 18
When the breakdown of IRA types was done by the amount of assets held in each type, the relative percentages
differed significantly from the ownership percentages. While 22.6 percent of families held only a Roth IRA, these IRAs
accounted for only 7.7 percent of total IRA assets (Figure 10). Conversely, the share of assets held by families with
combinations of IRA types greatly outweighed the prevalence of ownership. For example, 6.1 percent of IRA owners
owned rollover and regular IRAs together, but these IRAs represented 15.1 percent of all IRA assets. However, the
largest percentage of assets (25.4 percent) was held by those who owned only rollover IRAs, and was followed by 24.9
percent of assets held by those owning only regular IRAs (24.9 percent of assets).
Breaking out assets of IRAs versus Keoghs, the vast majority of assets are found to reside in IRAs: 98.3 percent (Figure
11). Roth IRAs held the lowest percentage of IRA/Keogh assets at 14.6 percent among the IRA types. Rollover IRAs
had the largest percentage of these assets at 46.2 percent. 22
Again, the distributions of assets by IRA type were different across families by net worth, income, and age of the family
head. For families with incomes in the lowest quartile, 12.5 percent of their IRA assets were in Roth IRAs, 26.9 percent
in rollovers, and 60.6 percent in regular IRAs (Figure 12). In contrast, families with incomes in the third quartile had
16.4 percent in Roth IRAs, 43.0 percent in rollovers, and 40.6 percent in regular IRAs. Families with younger family
heads had more assets in Roth IRAs than families with older family heads, while families with older heads had more
assets in rollover and regular IRAs than families with younger heads. Those families with the highest net worth had less
IRA assets in Roth IRAs, and correspondingly more assets in regular and rollover IRAs combined.

ebri.org Issue Brief • March 13, 2018 • No. 445 19
Comparison of Net Worth and Home Ownership for Those With and Without IA Assets
Not only do IA assets make up a large portion of families’ financial assets, but those with IA assets also have
substantially higher levels of net worth than those families without IA assets. The median net worth for families that
owned IA assets was $249,950 in 2016 compared with $19,200 for families without IA assets (Figure 13). This held
true across each quartile of income and all ages of family heads. Furthermore, families with an IA plan were much more
likely to own a home, where 78.5 percent of families with an IA plan owned a home, compared with 47.6 percent of the
families without an IA plan. Again, this held true across income groups and all ages of family heads.
Roth Rollover Regular
Total 14.8% 47.0% 38.2%
Family Income-Percentile
Bottom 25% 12.5 26.9 60.6
25-49.9 17.4 42.8 39.8
50-74.9 16.4 43.0 40.6
75-100% 14.3 48.7 37.0
Age of Family Head
<35 59.9 16.1 24.0
35-44 43.4 30.6 26.0
45-54 28.2 34.7 37.1
55-64 12.6 54.9 32.5
65 or Older 9.4 47.2 43.4
Net Worth Percentile
Bottom 25% 36.3 18.7 45.0
25-49.9 33.6 32.8 33.6
50-74.9 20.0 47.5 32.5
75-89.9 17.5 41.5 41.0
Top 10% 13.2 48.8 38.0
Source: Employee Benefit Research Institute estimates of the 2016 Survey of
Consumer Finances.
Figure 12
Distribution of Families' IRA Plan Assets,
by Various Categories, 2016
With IA Plan Without IA Plan With IA Plan Without IA Plan With IA Plan Without IA Plan
All $249,950 $19,200 $1,121,712 $225,407 78.5% 47.6%
Family Income-Percentile
Bottom 25% 80,120 5,810 313,994 54,809 61.1 33.4
25-49.9 92,180 23,202 198,708 122,117 61.8 50.7
50-74.9 178,100 62,000 329,707 213,223 77.9 64.2
75-100% 700,140 252,200 2,330,270 1,643,509 89.8 80.2
Age of Family Head
<35 42,200 4,800 102,979 57,997 50.4 20.5
35-44 148,400 9,660 440,472 92,242 71.7 39.6
45-54 270,280 16,060 1,054,528 240,186 83.7 46.6
55-64 420,200 30,600 1,783,119 283,012 87.3 54.1
65 or Older 569,000 101,840 1,847,107 398,209 91.3 71.9
Source: Employee Benefit Research Institute estimates of the 2016 Survey of Consumer Finances.
Home Ow nership
Figure 13
Median and Average Net Worth and Home Ownership for Families With and Without an
IA Retirement Plan, by Family Income and Age of the Family Head, 2016
Median Net Worth Average Net Worth

ebri.org Issue Brief • March 13, 2018 • No. 445 20
Conclusion
This analysis of various SCF survey years found that the percentage of all families with an employment-based
retirement plan from a current employer that had a DB plan only decreased substantially from 1992 to 2016, while the
percentage with a DC plan only surged during that same period. In 2016, the percentage with a DC plan only was 66.5
percent compared with 37.5 percent in 1992. In addition to the growth in DC plan participation, the percentage of
family heads who were eligible for DC plans and chose to participate increased in 2016 to 79.4 percent from 78.7
percent in 2013 and 73.8 percent in 1992.23
The percentage of families owning IRA/Keoghs also increased from 2013 at 28.1 percent to 29.9 percent in 2016.
Furthermore, the percentage of families with an IA retirement plan from a current employer or a previous employer
(excluding DB benefits) or an IRA/Keogh increased from 50.4 percent in 2010 to 52.1 percent in 2016, despite a slight
dip to 49.2 percent in 2013. When DB retirement plan participation was included, the percentage with any retirement
plan increased from 63.5 percent in 2013 to 64.9 percent in 2016.
In addition to the increases in ownership of employment-based plans and IRAs in 2016, the average account balances
of those families owning an IA retirement plan increased in 2016. The value was $75,300 in 1992, $208,639 in 2013,
and $232,502 in 2016.
The median percentage of families’ total financial assets comprised of IA retirement plan assets (assuming the family
had any) decreased to 67.9 percent in 2016 from the peak of 70.3 percent in 2010 and 2013, but it was still above all
prior years before 2010. Across all demographic groups in 2016, except for families with less than $10,000 in income
and for families in the top 10 percent of net worth, the share of these assets of total financial assets at the median was
above 50 percent, in some cases such as those families with heads ages 45-54 the median percentage exceeded 75
percent.
Lastly, a breakdown of IRA ownership by families was examined to determine the relative importance of various types
of IRAs. Regular IRAs were found to account for the largest percentage of IRA ownership, but rollover IRAs had the
largest share of assets at 47.0 percent in 2016, compared with 38.2 percent for regular IRAs and 14.8 percent for Roth
IRAs.
While this Issue Brief cannot determine whether the balances accumulated are sufficient to fund a comfortable
retirement, other studies completed by EBRI have attempted to answer this question. In particular, VanDerhei and
Copeland (2008) showed that 401(k) plans can generate significant multiples of workers’ preretirement income, if
workers have access to them and contribute to them during a large portion of their working lives. Furthermore,
VanDerhei (February 2014) determined the EBRI Retirement Readiness Rating™ for future American retirees by
comparing simulated retirement income and simulated expenditures in retirement for the American population,
concluding that about 41‒43 percent of Baby Boomers and Gen Xers were at risk for inadequate income in retirement.
While the results of this study do not answer questions about what is needed for retirement, they show the continued
growing importance of individual account plans. Consequently, any policy that alters this system could have
consequenceseither positive or negativefor Americans’ ability to fund a comfortable retirement.24

ebri.org Issue Brief • March 13, 2018 • No. 445 21
References
Bricker, Jesse, et al. “Changes in U.S. Family Finances from 2013 to 2016: Evidence from the Survey of Consumer
Finances.” Federal Reserve Bulletin. vol. 103, No. 3 (September 2017): 1–40,
https://www.federalreserve.gov/publications/files/scf17.pdf.
Copeland, Craig. “Individual Account Retirement Plans: An Analysis of the 2001 Survey of Consumer Finances.” EBRI
Issue Brief, no. 259 (Employee Benefit Research Institute, July 2003).
_______. “Retirement Plan Participation and Retirees’ Perception of Their Standard of Living.” EBRI Issue Brief, no. 289
(Employee Benefit Research Institute, January 2006).
_______. “Individual Account Retirement Plans: An Analysis of the 2004 Survey of Consumer Finances." EBRI Issue
Brief, no. 293 (Employee Benefit Research Institute, May 2006).
_______. “Individual Account Retirement Plans: An Analysis of the 2007 Survey of Consumer Finances, With Market
Adjustments to June 2009.” EBRI Issue Brief, no. 333 (Employee Benefit Research Institute, August 2009).
_______. “Individual Account Retirement Plans: An Analysis of the 2010 Survey of Consumer Finances.” EBRI Issue
Brief, no. 375 (Employee Benefit Research Institute, September 2012).
_______. “Employment-Based Retirement Plan Participation: Geographic Differences and Trends, 2013.” EBRI Issue
Brief, no. 405 (Employee Benefit Research Institute, October 2014).
_______. “Individual Account Retirement Plans: An Analysis of the 2013 Survey of Consumer Finances.” EBRI Issue
Brief, no. 406 (Employee Benefit Research Institute, November 2014).
_______. “Individual Retirement Account Balances, Contributions, Withdrawals, and Asset Allocation Longitudinal
Results 2010–2014.” EBRI Issue Brief, no. 429 (Employee Benefit Research Institute, January 17, 2017).
_______. “2015 Update of the EBRI IRA Database: IRA Balances, Contributions, Rollovers, Withdrawals, and Asset
Allocation.” EBRI Issue Brief, no. 437 (Employee Benefit Research Institute, September 12, 2017).
Copeland, Craig, and Jack VanDerhei. “Personal Account Retirement Plans: An Analysis of the Survey of Consumer
Finances.” EBRI Issue Brief, no. 223 (Employee Benefit Research Institute, July 2000).
Kennickell, Arthur B., and Annika E. Sundén. Pensions, Social Security, and the Distribution of Wealth. SCF Working
Papers. Finance and Economics Discussion Series 55 (October 1997).
Pension Benefit Guaranty Corporation. 2015 Pension Insurance Data Tables.
https://www.pbgc.gov/sites/default/files/2015-pension-data-tables.pdf
U.S. Department of Labor. Bureau of Labor Statistics. Employee Benefits in Medium and Large Private Establishments,
1995 (1998). www.bls.gov/ncs/ebs/sp/ebbl0015.pdf
________. Employee Benefits in Medium and Large Private Establishments, 1997 (1999).
www.bls.gov/ncs/ebs/sp/ebbl0017.pdf
________. National Compensation Survey: Health and Retirement Provisions in Private Industry in the United States,
2010 (August 2011) www.bls.gov/ncs/ebs/detailedprovisions/2010/ebbl0047.pdf
VanDerhei, Jack. “What Causes EBRI Retirement Readiness Ratings™ to Vary: Results from the 2014 Retirement
Security Projection Model.®” EBRI Issue Brief, no. 396 (Employee Benefit Research Institute, February 2014).

ebri.org Issue Brief • March 13, 2018 • No. 445 22
_______. “Contributory “Negligence”? The Impact of Future Contributions to Defined Contribution Plans on Retirement
Income Adequacy for Gen Xers.” EBRI Notes, No. 8 (Employee Benefit Research Institute, August 2014): 10–26.
VanDerhei, Jack, and Craig Copeland. “The Impact of PPA on Retirement Savings for 401(k) Participants.” EBRI Issue
Brief, no. 318 (Employee Benefit Research Institute, June 2008).
VanDerhei, Jack, Sarah Holden, Luis Alonso, and Steven Bass. “401(k) Plan Asset Allocation, Account Balances, and
Loan Activity in 2015.” EBRI Issue Brief, no. 436 (Employee Benefit Research Institute, August 3, 2017).
_______. “What Does Consistent Participation in 401(k) Plans Generate? Changes in 401(k) Account Balances, 2010–
2014.” EBRI Issue Brief, no. 426 (Employee Benefit Research Institute, September 8, 2016).

ebri.org Issue Brief • March 13, 2018 • No. 445 23
Endnotes
1 Beginning in the year individuals turn age 70-½, owners of tax-qualified plans/accounts (e.g., 401(k)-type plans
and traditional IRAs) are required to make an annual minimum distribution (withdrawal). The required minimum
distribution (RMD) is calculated by dividing the end of the prior-year balance by the longevity factor published by
the IRS. For those with more than one IRA, the required minimum distribution does not have to be taken from
each account but can be taken from only one account as long the total minimum amount withdrawn from that
one account equals the total that must be taken for all the accounts combined. Owners of Roth IRAs are not
required to take a distribution. For more information, see the IRS Publication 590, online
https://www.irs.gov/pub/irs-pdf/p590b.pdf
2 The basis of this survey is what the Federal Reserve refers to as a primary economic unit (PEU), which is a
subset of households and closely resembles families in its definition, although it is not precisely families. However,
families are the closest concise terminology for the PEU, so families are used in this study. For further information
about this issue as well as about SCF in general, see Bricker, et al. (2017).
3 See Copeland and VanDerhei (2000), Copeland (2003), Copeland (May 2006), Copeland (2009), Copeland
(2012), and Copeland (November 2014).
4 This study also supplements other studies from EBRI on participation in employment-based retirement plans
and account balances in such plans as well as participation in IRAs and asset levels in IRAs from other data
sources, most notably the EBRI IRA Database™ and the EBRI/ICI 401(k) database. For example, see Copeland
(October 2014), Copeland (September 2017), and VanDerhei, Holden, Alonso, and Bass (2017).
5 SCF is not a longitudinal survey, so the same families are not surveyed each year. Therefore, the changes within
the IA plans of those owning them year-to-year cannot be accessed. The EBRI’s databases on IRAs and 401(k)
plans allow for longitudinal results of the same IA owners. See Copeland (January 2017) for longitudinal results
on IRAs and VanDerhei, Holden, Alonso, and Bass (2016) for longitudinal results on 401(k) plans.
6 A regular (or traditional) individual retirement account allows individuals to contribute to an IRA and deduct the
contribution from their taxes (depending on their adjusted gross income and employment-based retirement plan
participation status), investment earnings accrue on a tax-deferred basis, and withdrawals in retirement are taxed
as ordinary income. In a Roth IRA, contributions are not tax-deductible, but investment earnings accumulate tax-
free and remain tax-free upon distribution. Other types of retirement IRAs include the SEP IRA (Simplified
Employee Pension) for self-employed workers, and the SIMPLE IRA (Savings Incentive Match Plan for Employees)
aimed at small employers. See Copeland (September 2017) for more detail on these accounts.
7 See Bricker, et al. (2017) for a further discussion of the changes in overall net worth from 2013 to 2016.
8 Lump-sum distributions are increasingly available in defined benefit (DB) plans. For example, in 2010, 46
percent of full-time employees in private-sector DB plans were eligible for a lump-sum distribution (U.S.
Department of Labor, 2011). That compares with 1997 and 1995, when 76 percent and 85 percent, respectively,
of full-time workers participating in a DB plan in a medium or large establishment were not offered a lump-sum
distribution (U.S. Department of Labor, 1999, 1998).
9 According to the Pension Benefit Guaranty Corporation (PBGC), 40.4 percent of participants in a private-sector
defined benefit plan are in a hybrid plan as of 2014 (PBGC).
10 The 2016 SCF completed 6,254 interviews of families. Therefore, caution should be used when interpreting the
results regarding specific plan types and breaks in demographics, as the sample size for these groups can be
small given the overall sample size of SCF. SCF does have the most in-depth questions on families’ wealth, but

ebri.org Issue Brief • March 13, 2018 • No. 445 24
must offset the completeness of the survey for a smaller sample size. Furthermore, identification of specific plan
types in self-reported surveys has been challenging; therefore, actual record-kept data can provide better results
for specific plans. However, SCF data gives the best picture of American families’ overall wealth.
11 In this Issue Brief, all income and asset values are in 2016 dollars.
12 The questions to determine participation rates for defined contribution plans were not added until the 1995
survey.
13 There is one exception to this trend—1.2 percentage point drop between those with a high school diploma and
those with some college in 2010.
14 In Copeland (January 2006), using SIPP data, 57.8 percent of all wage and salary workers ages 16 or older
were found to be either currently in an employment-based retirement plan or have at some point participated in
one. For those ages 51–60, 72.8 percent were found to be in or to have participated in such a plan.
15 To reiterate, all values of the account balances for all years in this study are expressed in 2016 dollars.
16 The average value for individuals from the EBRI IRA Database was $125,045 for year-end 2015 (Copeland
September 2017). This number was less than the SCF number due to the database number being an individual
number, whereas the SCF number is a family. The family (SCF) number would add any spouse or domestic
partner’s assets to that of the family head to arrive at one sum for the family. The SCF IRA number also includes
Keogh plan assets, while the EBRI database number only includes IRAs. Furthermore, the SCF number is for the
middle to the end of 2016, compared with end of year 2015 for the EBRI database number.
17 The average 401(k) plan balance from the EBRI/ICI 401(k) plan database was $73,357 for year-end 2015
(VanDerhei, Holden, Alonso, and Bass, 2017). There are various reasons for the EBRI/ICI number to be lower,
primarily because the EBRI/ICI number is based on individuals instead of the combination of all DC assets in the
family for SCF. Consequently, the SCF number could have more than one account added together to get one
observation, compared to the one account for each observation under EBRI/ICI. In addition, more than just
401(k) plans are included in the SCF number, so there is a higher likelihood for supplemental defined contribution
plans to be included in the SCF study. In addition, the EBRI/ICI number only includes current employer balances
not previous employer balances like the SCF number does. Furthermore, the SCF number is for the middle to the
end of year 2016, compared with end of year 2015 for the EBRI/ICI database number.
18 The median IRA balance from the EBRI IRA Database was $31,742 for year-end 2015 (Copeland, September
2017). See endnote 16 for a discussion of reasons for differences between the SCF numbers and the IRA
database numbers.
19 The median 401(k) plan balance from the EBRI/ICI 401(k) plan database was $16,732 for year-end 2015
(VanDerhei, Holden, Alonso, and Bass, 2017). See endnote 17 for a discussion of reasons for differences between
the SCF numbers and the EBRI/ICI database numbers.
20 Financial assets include assets that are generally liquid such as equities, bonds, and money or are financial
vehicles that include liquid assets such as mutual funds, individual account retirement plans, etc. They do not
include homes, vehicles, or collectibles.
21 A Roth IRA is a tax-qualified account that is financed by after-tax contributions but qualified distributions are
not taxed. A rollover IRA is a tax-qualified account that is established for the purpose of receiving a distribution
from another tax-qualified retirement plan (such as an employment-based defined contribution plan). A regular
IRA is a tax-qualified account that can be financed either by deductible contributions or by after-tax contributions

ebri.org Issue Brief • March 13, 2018 • No. 445 25
and has investment earnings on these contributions not taxed until the funds are withdrawn. (The deductible
contributions are taxed at withdrawal but the after-tax contributions are not taxed at withdrawal.) The primary
difference between a Roth IRA and a regular IRA with after tax (nondeductible) contributions is that the
investment earnings are taxed on withdrawal from a regular IRA but not from a Roth IRA. The eligibility criteria
for a Roth IRA are more stringent than that for a nondeductible regular IRA.
22 In Copeland (2012), a similar estimate was done from the 2010 SCF. In that study, regular IRAs represented
42.7 percent of the assets, while rollover IRAs share was 43.2 percent and Roth IRAs 11.1 percent. See also
Copeland (September 2017) for the EBRI IRA Database breakdown of IRA owners by IRA type.
23 While this Issue Brief focused on individual account retirement plans, families could have coverage under
“traditional” and/or “hybrid” defined benefit pension plans and would most likely have coverage under the Social
Security program. Although some information on workers’ ownership of defined benefit plans is presented in this
study, the value of this retirement income is difficult to determine because it depends on assumptions about
unknown future events—work decisions, earnings, inflation rates, plan changes, etc. Because of the lack of widely
agreed-upon standards for these assumptions, this Issue Brief does not include a measure of the present value of
such income in this analysis. However, the incidence of defined benefit plan ownership by family declined from
1992 to 2016. See Kennickell and Sundén (1997) for a description of one possible approach to using the SCF to
value the entire retirement income portfolio for the family.
24 See VanDerhei (August 2014) to see the impact of future years of eligibility in a 401(k) plan on the at-risk
rating among Gen Xers. For Gen Xers with no future years of 401(k) plan eligibility, 60.3 percent are at risk for
inadequate income in retirement, compared with 14.5 percent for those with 20 or more years of future eligibility.
EBRI Issue Brief is registered in the U.S. Patent and Trademark Office. ISSN: 0887137X/90 0887137X/90 $ .50+.50
© 2018, Employee Benefit Research InstituteEducation and Research Fund. All rights reserved.