individual moving range (i-mr) charts the swiss army knife of process charts€¦ · ·...
TRANSCRIPT
Individual Moving Range (I-MR) Charts
The Swiss Army Knife of Process Charts
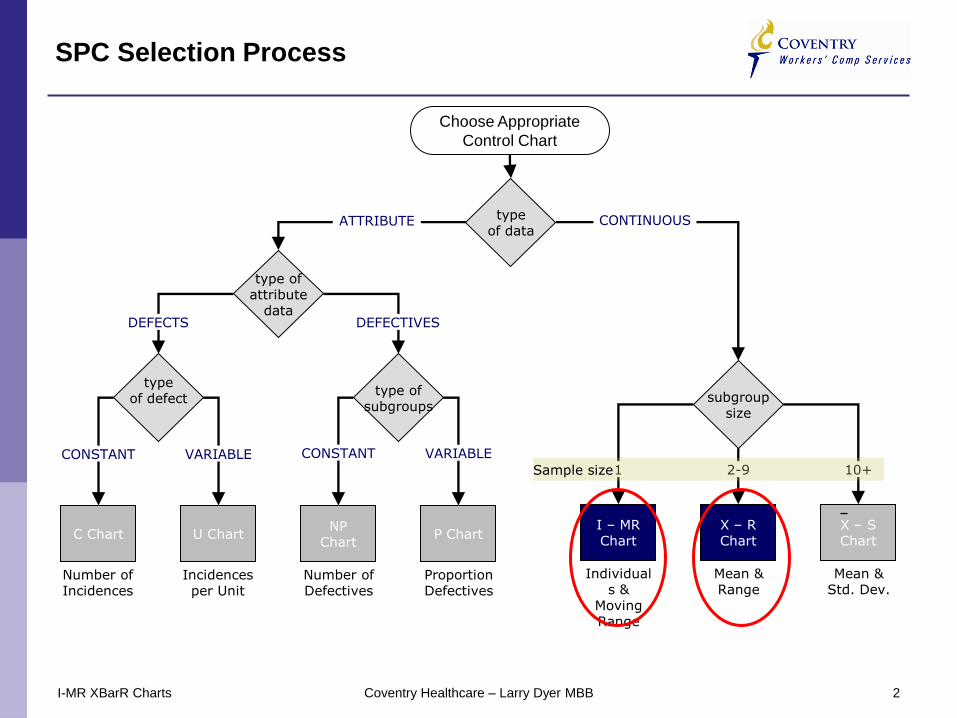
SPC Selection Process
Choose Appropriate
Control Chart
typeof data
type ofattribute
data
subgroupsize
I – MR Chart
X – R Chart
X – S Chart
C Chart U ChartNP
ChartP Chart
typeof defect
type ofsubgroups
ATTRIBUTE CONTINUOUS
DEFECTS DEFECTIVES
VARIABLECONSTANT CONSTANT VARIABLE
1 2-9 10+
Number of Incidences
Incidences per Unit
Number of Defectives
Proportion Defectives
Individuals &
Moving Range
Mean & Range
Mean & Std. Dev.
Sample size
2I-MR XBarR Charts Coventry Healthcare – Larry Dyer MBB
Individual Moving Range (I-MR Chart)
• Control charts for variables data
• Monitors the process over time
• Individual Chart
– Plots each measurement as a separate data point
– Each data point stands on its own (subgroup size = 1)
• Moving Range Chart
– Uses a default value of 2, which means each data point plots the
difference (range) between two consecutive data points as they come
from the process in sequential order
– There will be one less data point in the Moving Range chart than the
Individual chart
3I-MR XBarR Charts Coventry Healthcare – Larry Dyer MBB
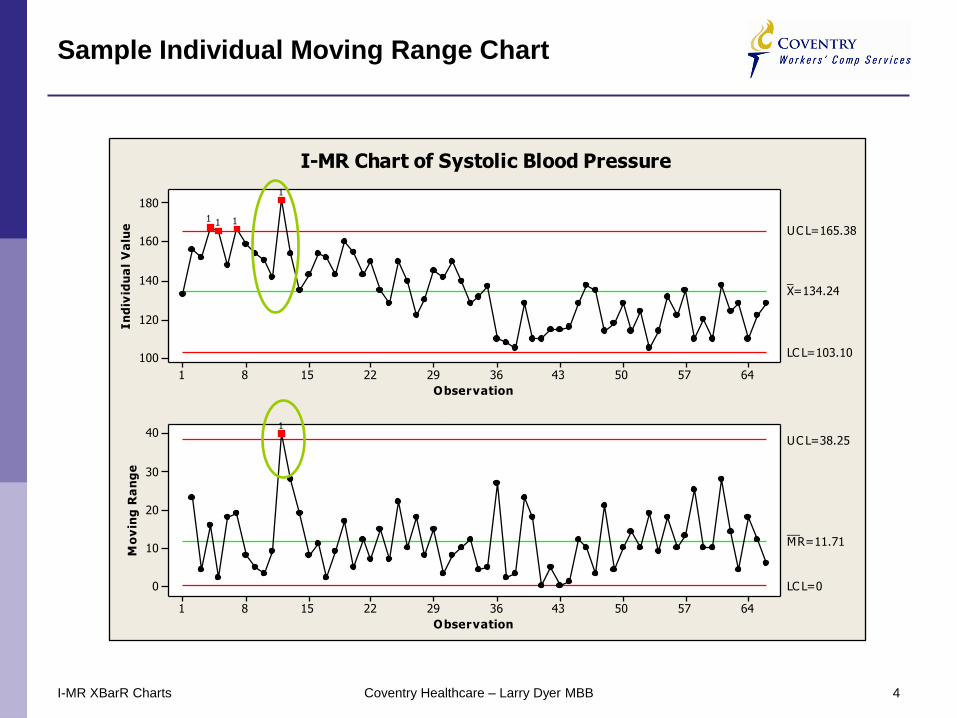
Sample Individual Moving Range Chart
4
645750433629221581
180
160
140
120
100
Observation
In
div
idu
al
Va
lue
_X=134.24
UC L=165.38
LC L=103.10
645750433629221581
40
30
20
10
0
Observation
Mo
vin
g R
an
ge
__MR=11.71
UC L=38.25
LC L=0
1
111
1
I-MR Chart of Systolic Blood Pressure
I-MR XBarR Charts Coventry Healthcare – Larry Dyer MBB
Xbar-R Charts
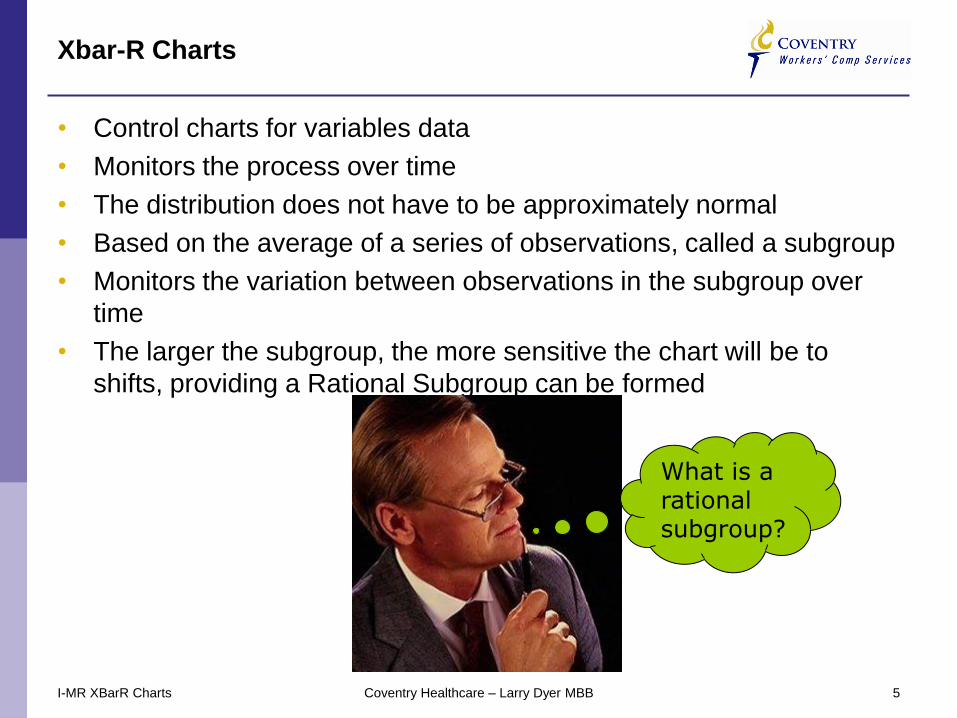
• Control charts for variables data
• Monitors the process over time
• The distribution does not have to be approximately normal
• Based on the average of a series of observations, called a subgroup
• Monitors the variation between observations in the subgroup over
time
• The larger the subgroup, the more sensitive the chart will be to
shifts, providing a Rational Subgroup can be formed
5I-MR XBarR Charts
What is arational subgroup?
Coventry Healthcare – Larry Dyer MBB
What is it and where does it come from?
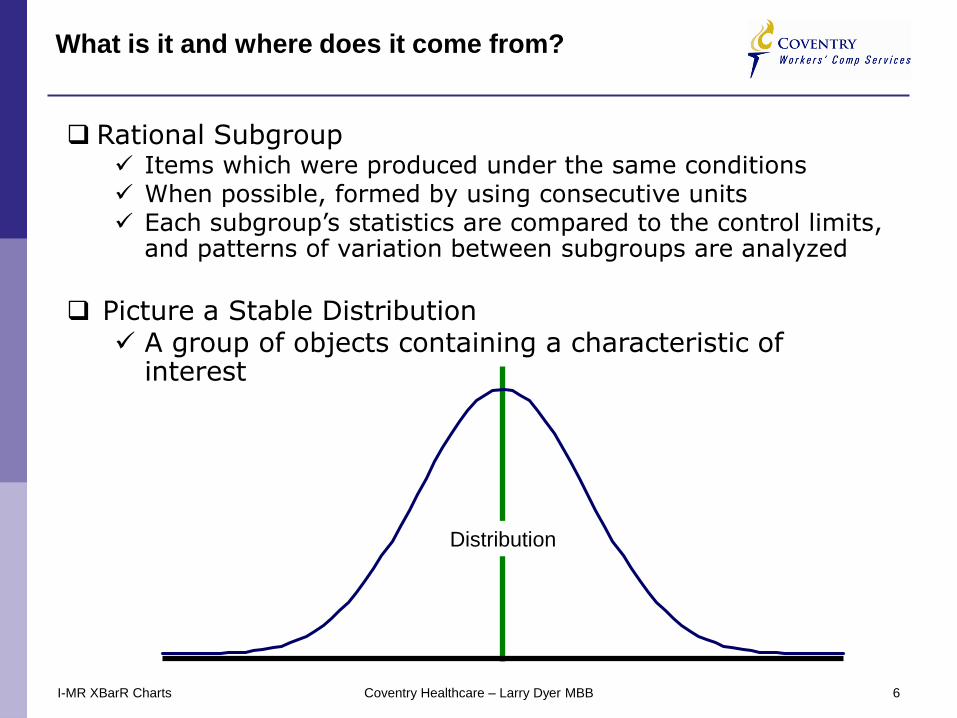
Rational Subgroup Items which were produced under the same conditions When possible, formed by using consecutive units Each subgroup’s statistics are compared to the control limits,
and patterns of variation between subgroups are analyzed
Picture a Stable Distribution A group of objects containing a characteristic of
interest
Distribution
6I-MR XBarR Charts Coventry Healthcare – Larry Dyer MBB

Where do Subgroups Come From?
Subgroup:• A subset of the distribution of interest
Subgroup 1
Subgroup 2
Subgroup 3
Subgroup N
…
7I-MR XBarR Charts Coventry Healthcare – Larry Dyer MBB

Sample Xbar-R Chart
8I-MR XBarR Charts
191715131197531
110
105
100
95
90
Sample
Sa
mp
le M
ea
n
__X=99.69
UC L=109.33
LC L=90.05
191715131197531
48
36
24
12
0
Sample
Sa
mp
le R
an
ge
_R=28.63
UC L=51.99
LC L=5.27
Xbar-R Chart of Glucose Readings
Coventry Healthcare – Larry Dyer MBB
When to Use I-MR/Xbar-R
• I-MR
– When you have a limited number of individual measurements
• Xbar-R
– When you can collect measurements in groups (subgroups) of between
two and ten observations
• For subgroup sizes greater than ten
– Use Xbar / Sigma charts
• Must have data that is time-ordered
9I-MR XBarR Charts Coventry Healthcare – Larry Dyer MBB
Interpreting R Charts
• Always look at the Range chart first
– Control limits on the I-MR are derived from the change in range (moving
range)
– The control limits on the Xbar-R chart are derived from the average
range
– If the Range chart is out of control, then the control limits on the
Individual and X-bar chart are meaningless.
• Look for out of control points
– Special causes must be eliminated
– There should be more than five distinct values plotted
– No single value should appear more than 25% of the time
10I-MR XBarR Charts Coventry Healthcare – Larry Dyer MBB
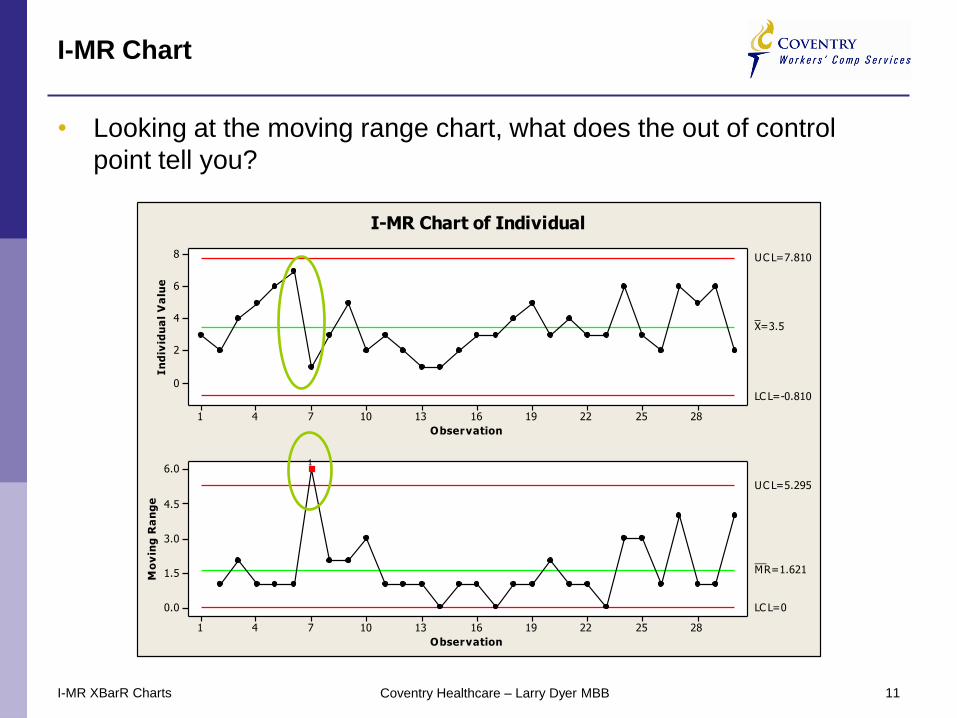
I-MR Chart
• Looking at the moving range chart, what does the out of control
point tell you?
11
28252219161310741
8
6
4
2
0
Observation
In
div
idu
al
Va
lue
_X=3.5
UC L=7.810
LC L=-0.810
28252219161310741
6.0
4.5
3.0
1.5
0.0
Observation
Mo
vin
g R
an
ge
__MR=1.621
UC L=5.295
LC L=0
1
I-MR Chart of Individual
I-MR XBarR Charts Coventry Healthcare – Larry Dyer MBB
Interpreting R Charts
• Average charts become more sensitive to process changes as the
subgroup size is increased
12I-MR XBarR Charts
What doesthat mean?
Coventry Healthcare – Larry Dyer MBB
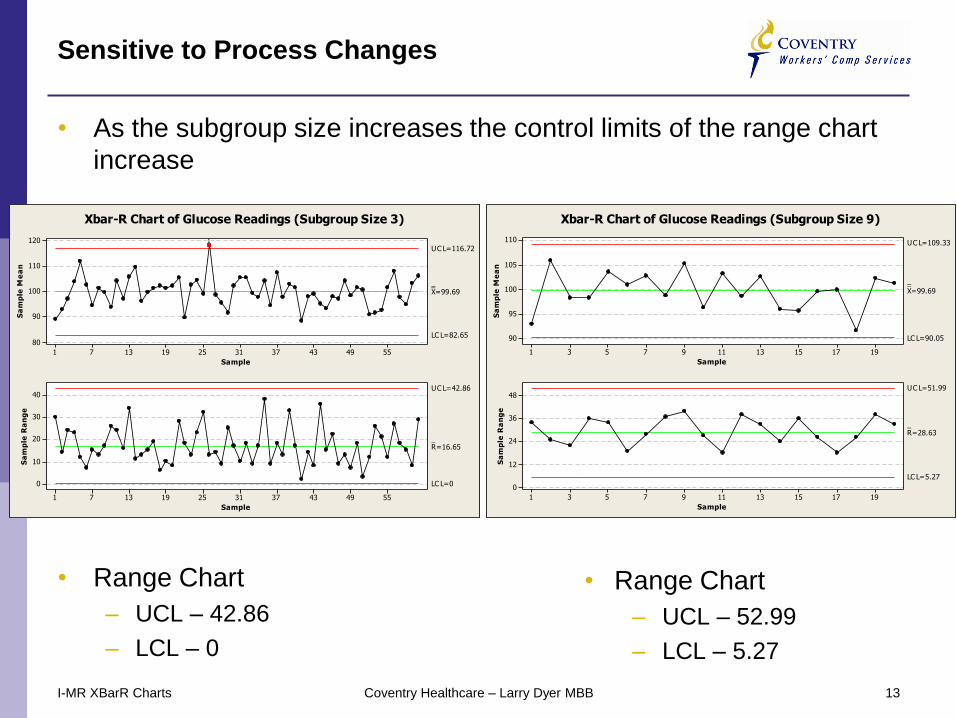
Sensitive to Process Changes
• As the subgroup size increases the control limits of the range chart
increase
• Range Chart
– UCL – 42.86
– LCL – 0
13I-MR XBarR Charts
• Range Chart
– UCL – 52.99
– LCL – 5.27
Coventry Healthcare – Larry Dyer MBB
191715131197531
110
105
100
95
90
Sample
Sa
mp
le M
ea
n
__X=99.69
UC L=109.33
LC L=90.05
191715131197531
48
36
24
12
0
SampleS
am
ple
Ra
ng
e
_R=28.63
UC L=51.99
LC L=5.27
Xbar-R Chart of Glucose Readings (Subgroup Size 9)
554943373125191371
120
110
100
90
80
Sample
Sa
mp
le M
ea
n
__X=99.69
UC L=116.72
LC L=82.65
554943373125191371
40
30
20
10
0
Sample
Sa
mp
le R
an
ge
_R=16.65
UC L=42.86
LC L=0
1
Xbar-R Chart of Glucose Readings (Subgroup Size 3)

Interpreting Individual/Xbar Charts
• Individual/Xbar Charts
Interpret the points on the X-bar chart relative to the control limits and
Run Tests
Look for out of control points
Look for obvious non-random behavior
• Averages in the Xbar Chart cannot be compared to requirements
14I-MR XBarR Charts
What doesthat mean?
Coventry Healthcare – Larry Dyer MBB

Xbar-R Cannot Be Compared to Requirements
• Both charts use same data set
• Look at the control limits on the Individual and Xbar Charts
– UCL – 131.17
– LCL – 68.2
15I-MR XBarR Charts
16314512710991735537191
140
120
100
80
60
Observation
In
div
idu
al
Va
lue
_X=99.69
UC L=131.17
LC L=68.20
16314512710991735537191
40
30
20
10
0
Observation
Mo
vin
g R
an
ge
__MR=11.84
UC L=38.68
LC L=0
I-MR Chart of Glucose Readings
191715131197531
110
105
100
95
90
Sample
Sa
mp
le M
ea
n
__X=99.69
UC L=109.33
LC L=90.05
191715131197531
48
36
24
12
0
Sample
Sa
mp
le R
an
ge
_R=28.63
UC L=51.99
LC L=5.27
Xbar-R Chart of Glucose Readings
– UCL – 109.33
– LCL – 90.05
Individual Readings Same Readings in Subgroups of 9
Coventry Healthcare – Larry Dyer MBB
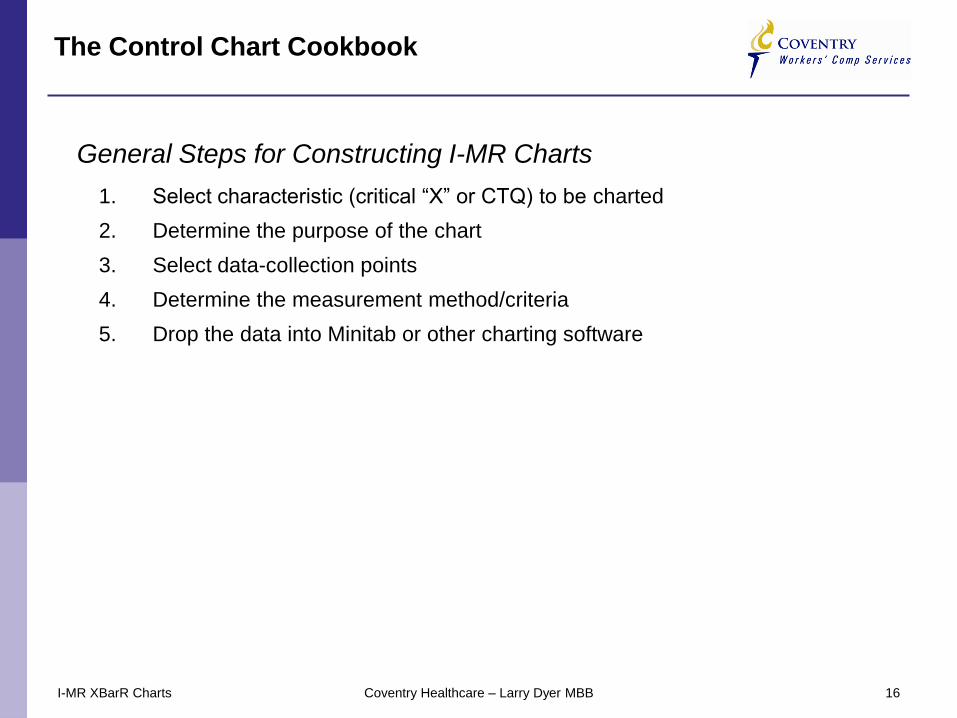
General Steps for Constructing I-MR Charts
The Control Chart Cookbook
1. Select characteristic (critical “X” or CTQ) to be charted
2. Determine the purpose of the chart
3. Select data-collection points
4. Determine the measurement method/criteria
5. Drop the data into Minitab or other charting software
16I-MR XBarR Charts Coventry Healthcare – Larry Dyer MBB

Questions?
I-MR XBarR Charts Coventry Healthcare – Larry Dyer MBB
Run Tests – Western Electric Rules
Average
UCL
LCL
-1
-2
+1
+2
Average
UCL
LCL
-1
-2
+1
+2
Average
UCL
LCL
-1
-2
+1
+2
Average
UCL
LCL
-1
-2
+1
+2
Average
UCL
LCL
-1
-2
+1
+2
Average
UCL
LCL
-1
-2
+1
+2
Average
UCL
LCL
-1
-2
+1
+2
Average
UCL
LCL
-1
-2
+1
+2
Average
UCL
LCL
-1
-2
+1
+2
Average
UCL
LCL
-1
-2
+1
+2
Average
UCL
LCL
-1
-2
+1
+2
Average
UCL
LCL
-1
-2
+1
+2
Average
UCL
LCL
-1
-2
+1
+2
Average
UCL
LCL
-1
-2
+1
+2
Average
UCL
LCL
-1
-2
+1
+2
Average
UCL
LCL
-1
-2
+1
+2
Average
UCL
LCL
-1
-2
+1
+2
Average
UCL
LCL
-1
-2
+1
+2
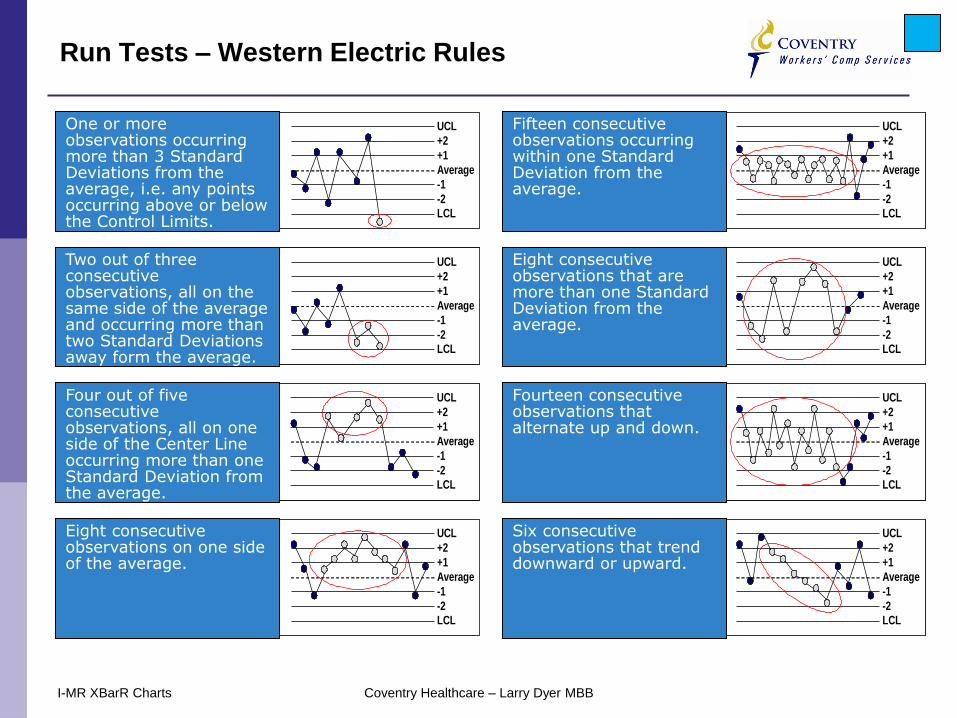
One or more observations occurring more than 3 Standard Deviations from the average, i.e. any points occurring above or below the Control Limits.
Two out of three consecutive observations, all on the same side of the average and occurring more than two Standard Deviations away form the average.
Fifteen consecutive observations occurring within one Standard Deviation from the average.
Four out of five consecutive observations, all on one side of the Center Line occurring more than one Standard Deviation from the average.
Eight consecutive observations on one side of the average.
Eight consecutive observations that are more than one Standard Deviation from the average.
Fourteen consecutive observations that alternate up and down.
Six consecutive observations that trend downward or upward.
I-MR XBarR Charts Coventry Healthcare – Larry Dyer MBB