indo mines 2017 annual report · rajawali group which he retired from at the end of june 2014. he...
TRANSCRIPT
A N N U A L R E P O R T
3 0 J U N E 2 0 1 7
ABN 40 009 245 210
INDO MINES LIMITED ANNUAL REPORT 2017
Page 1
CONTENTS PAGE
CORPORATE DIRECTORY 2
CEO'S REPORT 3
DIRECTORS' REPORT 4
AUDITOR'S INDEPENDENCE DECLARATION 15
CONSOLIDATED STATEMENT OF PROFIT OR LOSS AND COMPREHENSIVE INCOME 16
CONSOLIDATED STATEMENT OF FINANCIAL POSITION 17
CONSOLIDATED STATEMENT OF CASH FLOWS 18
CONSOLIDATED STATEMENT OF CHANGES IN EQUITY 19
NOTES TO AND FORMING PART OF THE FINANCIAL STATEMENTS 20
DIRECTORS' DECLARATION 48
INDEPENDENT AUDIT REPORT 49
ASX ADDITIONAL INFORMATION 56
INDO MINES LIMITED ANNUAL REPORT 2017
Page 2
CORPORATE DIRECTORY
Directors Mr Peter Chambers – Non-Executive Chairman
Mr Darryl Harris – Non-Executive Director
Mr Hendra Surya – Non-Executive Director
Chief Executive Officer Mr Arran Marshall
Company Secretary Mr Richard Edwards
Registered and Principal Office Level 2, 66 Hunter Street
Sydney, NSW, 2000
Australia
Telephone: +61 2 9300 3377
Facsimile: +61 2 9221 6333
Share Register Computershare Investor Services Pty Ltd
Level 4
60 Carrington Street
Sydney NSW 2000
Telephone: 1300 787 272
International: +61 3 9415 4000
Facsimile: +61 3 9473 2500
Stock Exchange Listing Australian Securities Exchange Limited
Home Branch – Perth
2 The Esplanade
Perth WA 6000
Indo Mines Limited shares are listed on the
Australian Securities Exchange (ASX).
ASX Code IDO – Fully paid ordinary shares
Solicitors Herbert Smith Freehills
QV.1 Building
250 St Georges Terrace
Perth WA 6845
Hadiputranto, Hadinoto & Partners
The Jakarta Stock Exchange Building
Tower II, 21st Floor
Sudirman Central Business District
Jl. Jendral Sudirman Kav 52-53
Jakarta 12190
Auditor PricewaterhouseCoopers
Brookfield Place
125 St Georges Terrace
Perth WA 6000
INDO MINES LIMITED ANNUAL REPORT 2017
Page 3
CEO’s Report Dear Shareholders, The 2017 financial year has been one of the toughest in the Company’s history, but thanks to project stakeholders, especially the majority shareholder, Rajawali Corpora, the Company continues to advance its goal of developing the Kulon Progo iron sand asset. Changes to the Indonesian export mineral law introduced in early 2017 were unfortunately not conducive to developing a beneficiation plant to export – namely because of the limited export time period of 5 years and the need to convert the Contract of Work (‘CoW’) to a comparatively less secure IUP-K mining license. The previous advanced technical work the Company has invested in has been invaluable, as renewed interest in the smelter project has seen genuine assessment of both the technical and financial viability by credible potential partners. Over the last 9 months the Company has come to final contractual terms with a potential strategic partner to develop a trial plant at the site. Indo Mines hopes that this relationship is finalised in the coming months before the close of the calendar year. The volatility in commodity pricing is not more pronounced than in the iron ore sector, seeing prices increase to over US$90 a ton for 62% fines delivered, to as low as US$53, with the last few months providing a more stable pricing range around US$70. Prices have been driven by changes in Chinese steel and pollution regulations, consolidation of large Chinese SOE steel companies and increased profit gains in the steel sector. In addition, vanadium, a key revenue source for the proposed smelter facility has more than doubled to US$9 per lb, with US warehouse pricing at US$18 per lb – this key alloy metal is pivotal to the wet cell vanadium battery industry, which focuses on renewable power storage on an industrial scale. The battery industry has been the primary driver behind demand and price increases. Supply simply has not been able to keep up because key sources of vanadium no longer operate (titano-magnetite smelter slag). Contributing to this, Chinese pollution regulations are restricting grades of vanadium slag entering the country, meaning refining of the product has to take place outside of China. Most recently shareholders voted on the divestment of Sapex with consideration being a 30% stake in a new listed entity on the NSX – this decision was made on the basis Indo Mines could not financially support Sapex’s growth strategy. Financial year 2017 was a very difficult operating period for the sector Sapex operates in, however the Company felt shareholders should benefit from the increased activity in the O&G sector that Sapex is currently exposed to and benefiting from. Sapex has very recently booked key 1st tier clients such as Talisman, Ophir Energy and a subsidiary of Newcrest. Indo Mines hopes in the coming months there may be a liquidity event that will see value returned for the initial investment Indo Mines made. In the meantime Sapex continues to grow and has access to potential financing possibilities that were previously unavailable. The CoW at Kulon Progo has successfully been put into suspension with the Indonesian Ministry for Resources ESDM. This suspension allows minimal ‘on-ground’ activity and investment, which means our total overall costs decrease at the local entity. This suspension must be renegotiated with ESDM on a yearly basis and there is no guarantee of renewal. Financially, Indo Mines has been able to continue operating as a going concern thanks to the continued support of the majority shareholder Rajawali Corpora – the major shareholder has provided loan facilities that have covered the company’s costs since March 2017. Management is grateful for this continued support and highlights the majority shareholder’s confidence that a deal can be finalised with a potential strategic partner in the near future. Indo Mines is energised with the successful listing of Sapex, renewed interest in our project by potential partners and the continued support of our major shareholder – management hopes it can build on these ‘small wins’ in an otherwise tough year by securing a development partner for the project. We thank you for your continued support
Arran Marshall Chief Executive Officer
INDO MINES LIMITED ANNUAL REPORT 2017
DIRECTORS’ REPORT 30 JUNE 2017
Page 4
The Directors of Indo Mines Limited present their report on the Consolidated Entity consisting of Indo Mines Limited (“the Company” or “Indo Mines” or “Parent Entity”) and the entities it controlled at the end of, or during, the year ended 30 June 2017 (“Consolidated Entity” or “Group”). DIRECTORS AND OFFICERS The names of Directors in office at any time during the financial year or since the end of the financial year are:
Mr Peter Chambers Non-Executive Chairman Mr Darryl Harris Non-Executive Director Mr Darjoto Setyawan Non-Executive Director (retired 24 January 2017) Mr Hendra Surya Non-Executive Director
Unless otherwise disclosed, Directors held their office from 1 July 2016 until the date of this report. Peter Chambers – Non-Executive Chairman Qualifications – B Bus.
Mr Peter Chambers most recently held the position of Managing Director - Strategy and Governance with the Rajawali Group which he retired from at the end of June 2014. He served as a member of the Board of Directors of PT. Rajawali Corpora from 2005 until his retirement from the Rajawali board. Mr Chambers is a member of the Board of Commissioners and the Remuneration and Compensation Committee of Excelcomindo, Indonesia's third largest mobile telephone operator. He was one of the key persons when Rajawali established Excelcomindo in the late 1990s. He has more than 20 years' experience in the finance and telecommunications industries having been the Head of the South East Asia Communication Practice of Coopers and Lybrand (Hong Kong based). Mr Chambers has also held executive roles with various international companies over the years. Mr Chambers graduated from the Royal Melbourne Institute of Technology in Melbourne, Australia, with a degree in Finance and Accounting. Mr Chambers was appointed a Director of Indo Mines on 26 November 2012 and he is also a director of Sapex Group Limited, listed on the National Stock Exchange of Australia. Darryl Harris – Non-Executive Director Qualifications - B.Sc. MAusIMM Mr Harris is an engineering metallurgist with over 35 years’ experience in the design and commissioning of mineral processing plants, across a range of different commodities. Mr Harris has had a long association with engineering companies including Nedpac, Signet Engineering, Lurgi and Outotec. He was involved in the development of various projects, including project coordinator for the An Feng-Kingstream Steel Project and other Australian ferrous projects as well a several projects in Indonesia. Mr Harris was appointed a Director of Indo Mines on 16 June 1987 and during the three year period to the end of the financial year, Mr Harris also held a directorship in Consolidated Tin Mines Limited (October 2010 – June 2016). Darjoto Setyawan – Non-Executive Director (retired 24 January 2017) Qualifications – BSc, Masters of Management Mr Darojoto Setyawan was employed with the Rajawali Group since 1996 and held the role of Managing Director - Mining & Resources since 2005. He was the President Director of the Bentoel Group, a subsidiary of Rajawali, from 1996 to 2006 and continued from 2006 - 2009 as the President Commissioner. Under his leadership, the Bentoel Group successfully negotiated with a syndicate of international banks as well as two leading State-Owned banks and restructured its loans. Mr Setyawan was appointed a Director of Indo Mines on 26 November 2012 and had not held a directorship in any other listed company in the past three years, prior to his retirement on 24 January 2017.
INDO MINES LIMITED ANNUAL REPORT 2017
DIRECTORS’ REPORT 30 JUNE 2017
Page 5
CURRENT DIRECTORS AND OFFICERS (continued) Hendra Surya – Non-Executive Director Qualifications – BSc, Masters of International Management Mr Surya joined the Rajawali Group in 2005 and is currently the Deputy Managing Director - Mining and Resources. Since he joined with the Rajawali Group, Mr Surya has played a significant role in the on-going success of Rajawali’s business in Mining and Resources. His main contributions and deliverables include M&A, Corporate Finance, Project Development and Operation of Rajawali’s mining assets. He currently holds executive management positions in the several subsidiaries and affiliates of Rajawali Group and is President Director of PT Jogja Magasa Iron. Prior to his role with the Rajawali Group, Mr Surya spent eight years with PricewaterhouseCoopers where he was involved with a number of government related projects and a wide number of privatisations and major project financings. He holds a Masters Degree in International Business from the American Graduate School of International Management in Arizona. Mr Surya was appointed a Director of Indo Mines on 6 February 2012 and has not held a directorship in any other listed company in the past three years. Chief Executive Officer Arran Marshall – BA, MBA Mr Marshall most recently held the role of Country Head for AWR Lloyd in Indonesia. AWR Lloyd is a specialist mining and energy advisor in South East Asia. He holds an MBA from the Auckland University of Technology and his core competencies are in the areas of business development, project management/development, financial analysis, strategy, investor relations and capital markets. Mr Marshall was appointed Chief Executive Officer of Indo Mines on 25 February 2014. He is also a director of Sapex Group Limited, listed on the National Stock Exchange of Australia. Company Secretary Richard Edwards – B Comm., CPA, SA Fin, FGIA Richard graduated with a Bachelor of Commerce degree from the University of New South Wales and is a Fellow of the Governance Institute of Australia and a member of CPA Australia and FINSIA. Following eight years as an owner/manager of his own business, Mr Edwards has worked for over ten years providing financial reporting and company secretarial services to a range of publicly listed companies in Australia with a focus on the mining sector, including as Company Secretary and Chief Financial Officer for Sumatra Copper & Gold plc and Callabonna Uranium Limited. He is also Company Secretary of ASX listed Collerina Cobalt Limited and unlisted public companies Nickel Mines Limited and Prospech Limited. Mr Edwards was appointed Company Secretary of Indo Mines on 31 October 2014.
INDO MINES LIMITED ANNUAL REPORT 2017
DIRECTORS’ REPORT 30 JUNE 2017
Page 6
MEETINGS OF DIRECTORS The following table sets out the number of meetings of the Company's Directors held during the year ended 30 June 2017, and the number of meetings attended by each Director.
Board Meetings Number eligible
to attend
Board Meetings Number
Attended
Audit Committee Meetings
Number eligible to attend
Audit Committee Meetings Number
Attended Peter Chambers 8 8 1 - Darryl Harris 8 6 - - Darjoto Setyawan 2 - - - Hendra Surya 8 3 1 1
PRINCIPAL ACTIVITIES The principal activities of the Consolidated Entity during the year consisted of mineral exploration and development activities at the Kulon Progo project. DIVIDENDS No dividends have been declared, provided for or paid in respect of the financial year ended 30 June 2017 (2016: nil). LOSS PER SHARE 2017
Cents 2016
Cents Basic loss per share (1.08) (0.70) Diluted loss per share (1.08) (0.70)
CORPORATE STRUCTURE Indo Mines is a company limited by shares that is incorporated and domiciled in Australia. The Company has prepared a consolidated financial report including the entities it incorporated and controlled during the financial year. A list of material subsidiaries is disclosed in Note 17. CONSOLIDATED RESULTS 2017
$ 2016
$ Loss of the Consolidated Entity before income tax expense (7,968,324) (4,682,159) Income tax expense - - Net loss (7,968,324) (4,682,159) Net loss attributable to non-controlling interest (2,161,119) (911,280) Net loss attributable to members of Indo Mines Limited (5,807,205) (3,770,879)
INDO MINES LIMITED ANNUAL REPORT 2017
DIRECTORS’ REPORT 30 JUNE 2017
Page 7
OPERATING AND FINANCIAL REVIEW Operating Review PT Jogja Magasa Iron (‘PT JMI’) is a joint venture between Indo Mines, which holds 70% of the issued capital and PT. Jogja Magasa Mining (‘PT JMM’) which holds the remaining 30%. PT JMM is a consortium of individuals, including the Sultan of Yogyakarta. Indo Mines and PT JMI are currently going through a restructuring process, from a mining company to a development organisation.
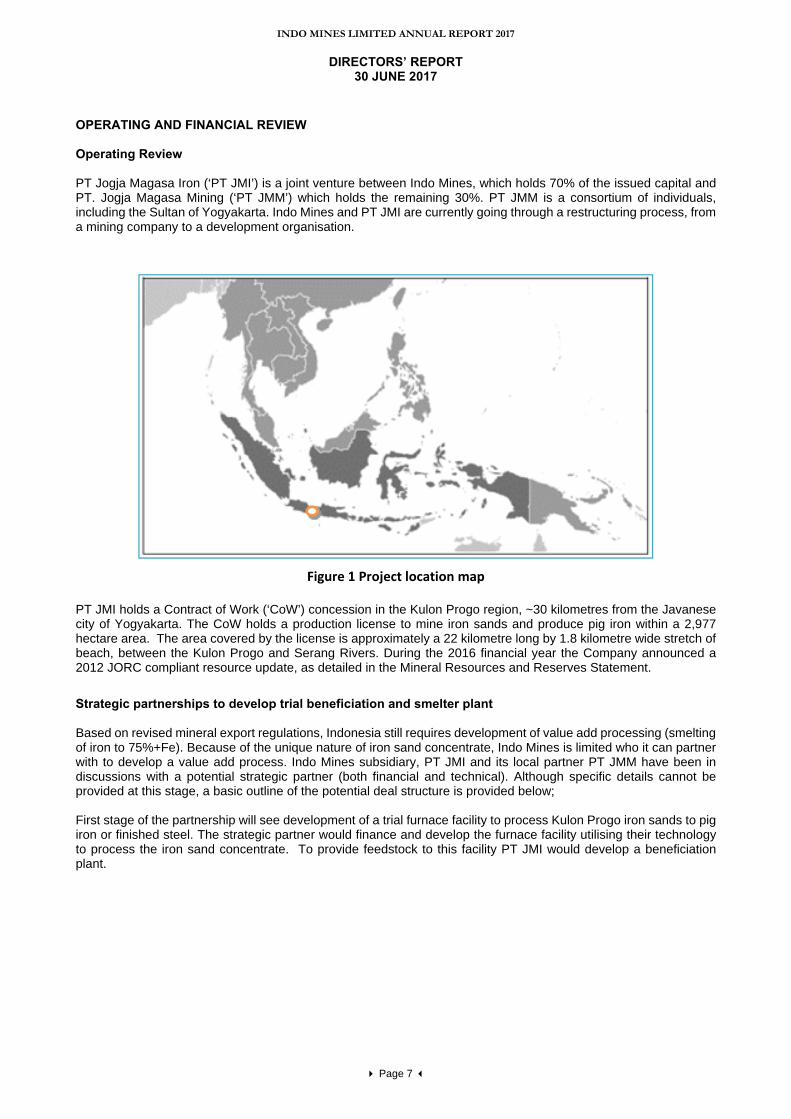
Figure 1 Project location map
PT JMI holds a Contract of Work (‘CoW’) concession in the Kulon Progo region, ~30 kilometres from the Javanese city of Yogyakarta. The CoW holds a production license to mine iron sands and produce pig iron within a 2,977 hectare area. The area covered by the license is approximately a 22 kilometre long by 1.8 kilometre wide stretch of beach, between the Kulon Progo and Serang Rivers. During the 2016 financial year the Company announced a 2012 JORC compliant resource update, as detailed in the Mineral Resources and Reserves Statement. Strategic partnerships to develop trial beneficiation and smelter plant Based on revised mineral export regulations, Indonesia still requires development of value add processing (smelting of iron to 75%+Fe). Because of the unique nature of iron sand concentrate, Indo Mines is limited who it can partner with to develop a value add process. Indo Mines subsidiary, PT JMI and its local partner PT JMM have been in discussions with a potential strategic partner (both financial and technical). Although specific details cannot be provided at this stage, a basic outline of the potential deal structure is provided below; First stage of the partnership will see development of a trial furnace facility to process Kulon Progo iron sands to pig iron or finished steel. The strategic partner would finance and develop the furnace facility utilising their technology to process the iron sand concentrate. To provide feedstock to this facility PT JMI would develop a beneficiation plant.
INDO MINES LIMITED ANNUAL REPORT 2017
DIRECTORS’ REPORT 30 JUNE 2017
Page 8
Key advantages of this structure include the following;
1. Lower capital cost commitment and financial raising would be required from PT JMI. 2. Removes the need to obtain an export license for iron sand concentrate. 3. Allows retention of the existing Contract of Work and removes the need to covert to an IUPK license. 4. PT JMI can focus on the less technically sensitive mining and beneficiation rather than the hot-metal and
steel production process. 5. The project is developed on a modular basis, and production capacity can be increased as market
conditions allow. The key stakeholders of the project, including the majority shareholder Rajawali Corpora, met in May 2017 and have agreed that the potential partner would add value to the project. An invitation has been sent to the potential partner to meet with the key stakeholders and formalise the agreements that have been negotiated. Sale of interest in Sapex Oilfield Services Limited (‘Sapex’) In recent months, the oil and gas sector has seen resurgence with requests for quotes for services increasing significantly from 2016. Sapex has entered into a consortium partnership with PT SAS International, a wholly owned subsidiary of Sapex, to service Durabase Mat rental contracts. The first of such clients is a major oil company which is a current client of PT SAS International and is currently expanding drilling operations in Java. In order to operate such contracts Sapex needs to expand its capital base and have access to additional working capital funding and capital for mat purchases. Indo Mines is not in a position to provide such capital and as such has looked at divesting its position in Sapex, so its capital raising options are not limited. Indo Mines entered into a conditional sale agreement with APAC Partners to sell its stake in Sapex. The consideration is a 30% stake in a proposed Sapex listed entity on the National Stock Exchange of Australia (‘NSX’). The listing will expand the capital base of Sapex, provide a $1,500,000 working capital facility and allow Sapex to operate major rental contracts in its pipeline and sales agreements. While options were considered to divest the stake completely, the Board considered the growth prospects of Sapex are attractive and found this option gave Indo Mines stakeholders the greatest exposure to growth while minimal capital outlay requirements as a shareholder. Indo Mines will provide two non-executive Directors to the listed entity and will remain a long term minority shareholder while the company executes its operating strategy. Subsequent to the end of the year, at a general meeting of shareholders, shareholders approved the sale of the stake in Sapex and on 15 September 2017 Sapex Group Limited was listed on the NSX. Continued support from majority shareholder During and subsequent to end of the year Indo Mines has received the financial support of the Company’s majority shareholder, Rajawali Corpora (‘Rajawali’), as the Company progresses discussions with a potential strategic partner in developing a trial smelter facility at the Company’s Kulon Progo project. To date this support has been by way of Loan Agreements totalling US$1,902,989, secured against a first priority payment on the sale of an interest in Sapex Oilfield Services Limited. In addition to the Loan Agreements, Rajawali has confirmed to the Directors of the Company of its ongoing financial assistance to Company as and when it is needed to enable the Company to continue its operations and fulfil all of its financial obligations for a period of at least twelve months from the date signing of the report.
INDO MINES LIMITED ANNUAL REPORT 2017
DIRECTORS’ REPORT 30 JUNE 2017
Page 9
Research & Development (R&D) Tax Rebate Shortfall As advised on 5 August 2016, a review and analysis of the R&D claims made by the Company for the 2014 and 2015 financial years concluded that the Company should voluntarily amend some of the R&D claims made in relation to those years. During the half year a payment arrangement was entered with the Australian Taxation Office (‘ATO’) regarding the shortfall amount arising from the 2015 claim. Under the payment arrangement the Company made a payment of $500,000 to the ATO, to be followed by monthly payments of $32,479 per month for the following 18 months. In February 2017 the Company entered into a new payment arrangement with the ATO following the finalisation of the amended 2014 claim. Under the new payment arrangement the Company will repay the combined shortfall for the 2014 and 2015 financial years by way of payment of $105,203 p/m for a period of 18 months, with the final payment under the arrangement to be made in July 2018. Finance Review At 30 June 2017, the Consolidated Entity held cash and cash equivalents of $50,629 (2016 - $3,598,563).
Operating activities consumed $2,962,252 (2016 - $3,770,848), including interest received of $7,003 (2016 - $49,412).
Investing activities consumed $1,789,373 (2016 - $200,086), which included expenditure on capitalised exploration and evaluation of $1,318,872 (2016 - $3,068,652) and property, plant and equipment assets of $138,410 (2016 - $2,752,421). The Group has total liabilities of $10,529,216, including short term liabilities of $10,030,589, which includes an amount of $1,293,588 payable to the Australian Taxation Office (‘ATO’) over which the Company has entered into a payment arrangement with the ATO to repay this amount by end of July 2018 and US$4,234,391 ($5,509,790) for the repayment of the Anglo Pacific Group plc convertible debenture facility. lncluded in the Consolidated Financial Statements for the year ended 30 June 2017 is an independent auditor's report which includes an Emphasis of Matter paragraph in regard to the existence of a material uncertainty that may cast significant doubt about the Group's ability to continue as a going concern. For further information, refer to Note 1 to the financial statements, together with the auditor's report. CORPORATE GOVERNANCE STATEMENT The Board is committed to maintaining the highest standards of Corporate Governance. Corporate Governance is about having a set of core values and behaviours that underpin the Company's activities and ensure transparency, fair dealing and protection of the interests of stakeholders. The Company has reviewed its corporate governance practices against the Corporate Governance Principles and Recommendations (3rd edition) published by the ASX Corporate Governance Council. The 2017 Corporate Governance Statement is dated as at 29 September 2017 and reflects the corporate governance practices throughout the 2017 financial year. The 2017 Corporate Governance Statement was approved by the Board on 29 September 2017. A description of the Company’s current corporate governance practices is set out in the Company’s Corporate Governance Statement which can be viewed at www.indomines.com.au. SIGNIFICANT CHANGES IN THE STATE OF AFFAIRS In the opinion of the directors, significant changes in the state of affairs of the Group that occurred during the year ended 30 June 2017 were as follows:
• Advancement of contractual terms with potential strategic partner to develop trial furnace facility at the Kulon Progo project.
• Successful suspension of the COW at Kulon Progo minimal ‘on-ground’ activity and investment. • Conditional agreement to the Sale of the Company’s 51% interest in Sapex Oilfield Services Limited, with
consideration received of a 30% stake in a proposed listed entity, Sapex Group Limited. • Continued financial support from the Company’s majority shareholder by way of loan facility agreements.
INDO MINES LIMITED ANNUAL REPORT 2017
DIRECTORS’ REPORT 30 JUNE 2017
Page 10
SIGNIFICANT POST BALANCE DATE EVENTS Subsequent to the end of the year:
• the Company has borrowed a further US$917,989 ($1,194,487) from PT Rajawali Corpora, the Company’s major shareholder, under the same terms as the Loan Agreements detailed in Note 14b.
• the Company entered into a conditional sale agreement to sell its 51% stake in Sapex Oilfield Services Limited (‘Sapex’). The consideration is a 30% stake in a proposed listed entity, Sapex Group Limited on the National Stock Exchange of Australia (‘NSX’).
• in September 2017 at a general meeting of shareholders, shareholders approved the sale of the stake in Sapex and on 15 September 2017 Sapex Group Limited was listed on the NSX. At the listing price of $1.00 per share, the 30% interest of the Company in Sapex Group Limited is valued at $5,785,922.
Outside of the matters outlined above there has not arisen in the interval between the end of the financial year and the date of this report any item, transaction or event of a material and unusual nature likely, in the opinion of the Directors of the Company, to affect significantly the operations of the Group, the results of those operations, or the state of affairs of the Group, in future financial years. ENVIRONMENTAL REGULATION AND PERFORMANCE The Consolidated Entity’s operations are subject to various environmental laws and regulations under the relevant government’s legislation. Full compliance with these laws and regulations is regarded as a minimum standard for all operations to achieve. Instances of environmental non-compliance by an operation are identified either by external compliance audits or inspections by relevant government authorities. During and subsequent to the financial year no new environmental policies which impact the Company and its operations have been introduced. There have been no significant known breaches by the Consolidated Entity during the financial year. LIKELY DEVELOPMENTS AND EXPECTED RESULTS During the coming year, the Company will look to complete final documentation with a strategic partner for the development of a trial smelter to facility to process Kulon Progo iron sands at the Kulon Progo project and to continue to reduce costs at both the corporate and Indonesian subsidiary level. SHARE OPTIONS During the financial year ended 30 June 2017 there were no options over unissued ordinary shares on issue and no options have been granted since the end of the year. The following table sets out each Director’s relevant interest in shares in the Company as at the date of this report:
Ordinary Shares Directors Peter Chambers - Darryl Harris 210,000 Hendra Surya - Darjoto Setyawan -*
* Number held at date of resignation as Director.
INDO MINES LIMITED ANNUAL REPORT 2017
DIRECTORS’ REPORT 30 JUNE 2017
Page 11
REMUNERATION REPORT (AUDITED)
The remuneration policy for the Group’s Key Management Personnel (including the Chief Executive Officer) has been developed by the Board taking into account:
• the size of the Group; • the size of the management team for the Group; • the nature of the Group’s current operations; and • market conditions and comparable salary levels for companies of a similar size and operating in similar sectors.
In considering the above general factors, the Board has also placed emphasis on the following specific issues:
• risks associated with resource companies whilst exploring and developing projects; and • other than income which may be generated from asset sales (if any), the Group does not expect to be
undertaking significant profitable operations until sometime after the successful commercialisation, production and sales of commodities from its Kulon Progo iron sands project, or the acquisition of a large scale profitable mining operation.
Remuneration Policy for Executives The Group’s remuneration policy is to provide a fixed remuneration component and a performance based component (incentive options, see below). The Board believes that this remuneration policy is appropriate given the stage of development of the Group and the activities which it undertakes and is appropriate in aligning Key Management Personnel objectives with shareholder and business objectives. Performance Based Remuneration – Incentive Options The Board has, in prior years, chosen to issue incentive options to Key Management Personnel as a key component of the incentive portion of their remuneration, in order to attract and retain the services of the Key Management Personnel and to provide an incentive linked to the performance of the Group. The Board considers that each Key Management Personnel’s experience in the resources industry will greatly assist the Group in progressing its projects to the next stage of development and the identification of new projects. As such, the Board believes that the number of incentive options granted to Key Management Personnel is commensurate to their value to the Group. Whilst no incentive options were granted during the current financial year, the Board’s policy has been to grant options to Key Management Personnel with exercise prices at and/or above market share price (at time of agreement). As such, incentive options granted to Key Management Personnel will generally only be of benefit if the Key Management Personnel perform to the level whereby the value of the Group increases sufficiently to warrant exercising the incentive options granted. Other than market-based vesting conditions, there have been no additional performance criteria on the incentive options granted to Key Management Personnel historically, as given the speculative nature of the Group’s activities and the small management team responsible for its running, it is considered the performance of the Key Management Personnel and the performance and value of the Group are closely related. Key Management Personnel are prohibited at all times from entering into margin lending or similar arrangements in respect to securities in the Company they hold or in which they have a relevant interest. Key Management Personnel are prohibited at all times from dealing in financial products issued or created over or in respect of the Company’s Securities. Impact of Shareholder Wealth on Key Management Personnel Remuneration The Board does not directly base remuneration levels on the Group’s share price or movement in the share price over the financial year. The Company does not expect to be undertaking significant profitable operations until sometime after the successful commercialisation, production and sales of commodities from its Kulon Progo iron sands project, or the acquisition of a large scale profitable mining operation. Accordingly the Board does not consider current or prior year earnings or share price movements when assessing remuneration of Key Management Personnel. The compensation structures take into account the capability and experience of the Key Management Personnel and their ability to assist Company performance. As a result of the Group’s exploration and development activities, the Board anticipates that it will retain future earnings (if any) and other cash resources for the operation and development of its business. Accordingly the Group does not currently have a policy with respect to the payment of dividends, and as a result the remuneration policy does not take into account the level of dividends or other distributions to shareholders (e.g. return of capital).
INDO MINES LIMITED ANNUAL REPORT 2017
DIRECTORS’ REPORT 30 JUNE 2017
Page 12
REMUNERATION REPORT (AUDITED) (continued) Impact of Earnings on Key Management Personnel Remuneration The Company does not expect to be undertaking significant profitable operations until sometime after the successful commercialisation, production and sales of commodities from its Kulon Progo iron sands project, or the acquisition of a large scale profitable mining operation. Accordingly the Board does not consider current or prior year earnings or share price movements when assessing remuneration of Key Management Personnel. The compensation structures take into account the capability and experience of the key management personnel and their ability to assist Company performance. Fixed Compensation Fixed compensation consists of base compensation (which is calculated on a total cost basis and includes any FBT charges related to employee benefits including motor vehicles), as well as employer contributions to superannuation funds. Compensation levels are generally reviewed annually by the Board through a process that considers individual, segment and overall performance of the Group. In addition, where necessary, external consultants provide analysis and advice to ensure the Directors’ and senior executives’ compensation is competitive in the market place. A senior executive’s compensation is also reviewed on promotion. No external consultants were engaged during the year ended 30 June 2017.
Remuneration Policy for Non-Executive Directors The Board policy is to remunerate Non-Executive Directors at market rates for comparable companies for time, commitment and responsibilities. Given the current size, nature and risks of the Group, incentive options have previously been used to attract and retain Non-Executive Directors. The Board determines payments to the Non-Executive Directors and reviews their remuneration annually, based on market practice, duties and accountability. Independent external advice is sought when required. No external consultants were engaged during the year ended 30 June 2017. The maximum aggregate amount of fees that can be paid to Non-Executive Directors is subject to approval by shareholders at a General Meeting. Fees for Non-Executive Directors are not linked to the performance of the Group. General Where required, Key Management Personnel receive superannuation contributions, which for the year ended 30 June 2017 was equal to 9.5% of salary. Key Management Personnel do not receive any other retirement benefit. From time to time, individuals have chosen to sacrifice part of their salary to increase payments towards superannuation. All remuneration paid to Key Management Personnel is valued at cost to the Company and expensed. Incentive options are valued using an appropriate option valuation methodology depending upon the terms of the options. The value of these incentive options is expensed over the vesting period. Chief Executive Officer Since the expiration of Mr Marshall’s previous employment contract, a new contract has not been signed and he is remunerated on a monthly basis. During 2017 Mr Marshall was paid a base salary of $16,667 per month and during the year $8,016 of medical insurance costs were paid on his behalf. Non-Executive directors Total compensation for all Non-Executive Directors, last voted upon by shareholders at the 2011 AGM, is not to exceed $500,000 per annum and is set with reference to fees paid to other non-executive directors of comparable companies. With effect from 10 April 2016, fees payable for the independent Non-Executive Directors are $45,872 per annum inclusive of superannuation contributions. Directors appointed by the Rajawali Group do not receive any Directors’ fees. Mr Surya was paid $6,296 (2016: $18,197) during the year as remuneration for his role as CEO of PT JMI. Since March 2016 Mr Chambers receives a fee in his capacity as Chairman of $5,000 per month. Non-Executive Directors did not receive any performance related compensation in 2017 (2016: Nil). Directors’ fees cover all main board activities and committee memberships. External consultants were not engaged in the preparation of the remuneration report.

INDO MINES LIMITED ANNUAL REPORT 2017
DIRECTORS’ REPORT 30 JUNE 2017
Page 13
REMUNERATION REPORT (AUDITED) (continued) Key Management Personnel Remuneration (Company and Consolidated) Details of the nature and amount of each element of the remuneration of each Director of the Group and each of the Group’s executives for the financial year are as follows:
Short-Term Post Employment
Other long term
$
Termination Benefits
$
Share-based
payments
Total Proportion of remuneration performance
related
Value of options
as proportion of remuneration
Directors
Salary & Fees
$
STI cash bonus
$
Non monetary benefits
$
Total
$
Super- annuation
$
Options and rights
$
$
%
%
Peter Chambers 2017 60,000 - - 60,000 - - - - 60,000 - - Non-Executive Chairman 2016 72,000 - - 72,000 - - - - 72,000 - - Darryl Harris 2017 36,698 - - 36,698 3,486 - - - 40,184 - - Non-Executive Director 2016 42,814 - - 42,814 4,067 - - - 46,881 - - Darjoto Setyawan (1) 2017 - - - - - - - - - - - Non-Executive Director 2016 - - - - - - - - - - - Hendra Surya (1) 2017 6,296 - - 6,296 - - - - - - - Non-Executive Director 2016 18,197 - - 18,197 - - - - 18,197 - - Executives Arran Marshall 2017 200,004 - 8,016 208,020 - - - - 208,020 - - Chief Executive Officer 2016 295,424 - - 295,424 - - - - 295,424 - - Total 2017 302,998 - 8,016 311,014 3,486 - - - 314,500 - - 2016 428,435 - - 428,435 4,067 - - - 432,502 - -
Notes (1) No Directors Fees were payable to Messrs Setyawan and Surya for the year ended 30 June 2017. Remuneration paid for Mr Surya for his role as CEO of PT JMI during the year
totalled $6,296 (2016 $18,197). Options Granted to Key Management Personnel No options were granted, exercised or lapsed during the year. End of Remuneration Report
INDO MINES LIMITED ANNUAL REPORT 2017
DIRECTORS’ REPORT 30 JUNE 2017
Page 14
INSURANCE OF OFFICERS AND AUDITORS Under the Constitution the Company is obliged, to the extent permitted by law, to indemnify an officer (including Directors) of the Company against liabilities incurred by the officer in that capacity, against costs and expenses incurred by the officer in successfully defending civil or criminal proceedings, and against any liability which arises out of conduct not involving a lack of good faith. The Company has in respect of any person who is or has been an officer of the Company or a related body corporate paid or agreed to pay a premium of $13,046 (2016: $14,246) in respect of a contract insuring against a liability incurred as an officer for the costs or expenses to defend legal proceedings. The Company has indemnified officers of the Company against a liability incurred as an officer including costs and expenses in successfully defending legal proceedings. The Company has not, during or since the end of the financial year, indemnified or agreed to indemnify an auditor of the Company or of any related body corporate against a liability incurred as such an auditor. NON-AUDIT SERVICES There were no non-audit services provided by the auditor (or by another person or firm on the auditor’s behalf) during the financial year. Details of the amounts paid or payable to the auditor (PricewaterhouseCoopers Australia) for audit services have been disclosed in Note 20. AUDITOR’S INDEPENDENCE DECLARATION The auditor’s independence declaration, as required under section 307c of the Corporations Act 2011, which forms part of this Directors’ Report, for the year ended 30 June 2017 is on page 15. This report is made in accordance with a resolution of the Directors made pursuant to section 298(2) of the Corporations Act 2001. For and on behalf of the Directors
PETER CHAMBERS Non-Executive Chairman Dated this 29th day of September 2017
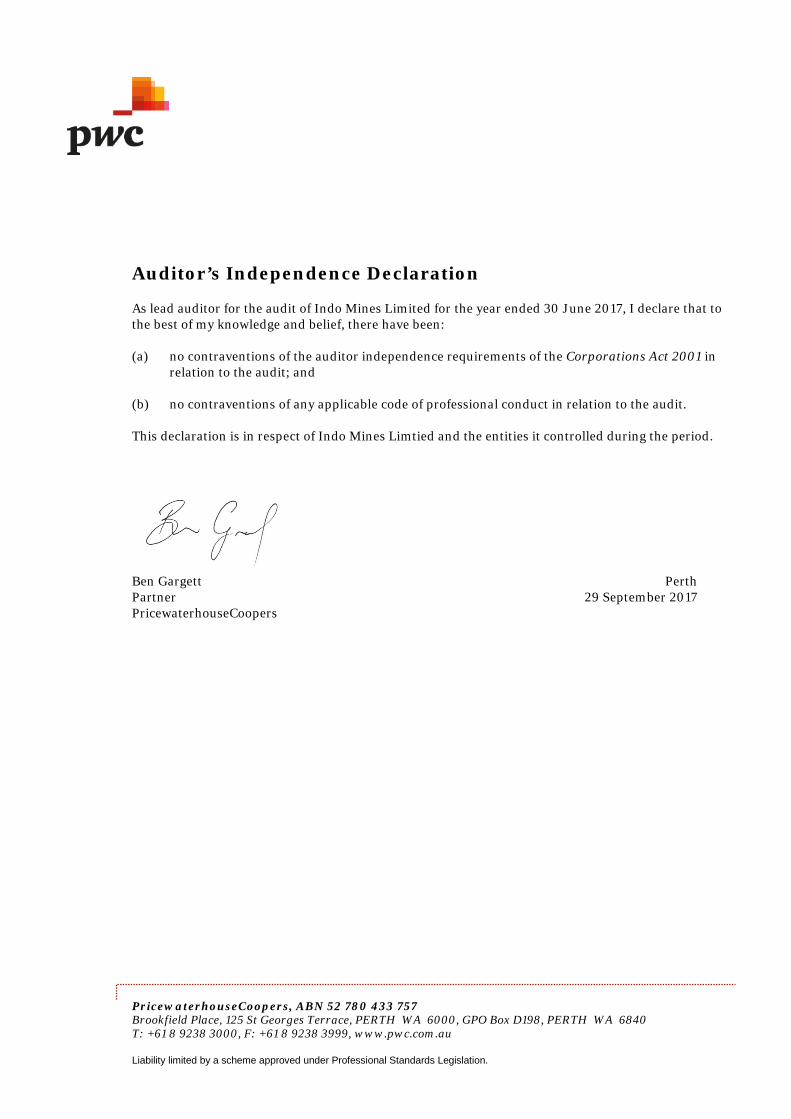
Auditor’s Independence Declaration
As lead auditor for the audit of Indo Mines Limited for the year ended 30 June 2017, I declare that to the best of my knowledge and belief, there have been:
(a) no contraventions of the auditor independence requirements of the Corporations Act 2001 in relation to the audit; and
(b) no contraventions of any applicable code of professional conduct in relation to the audit.
This declaration is in respect of Indo Mines Limtied and the entities it controlled during the period.
Ben Gargett Perth Partner 29 September 2017 PricewaterhouseCoopers
PricewaterhouseCoopers, ABN 52 780 433 757 Brookfield Place, 125 St Georges Terrace, PERTH WA 6000, GPO Box D198, PERTH WA 6840 T: +61 8 9238 3000, F: +61 8 9238 3999, www.pwc.com.au Liability limited by a scheme approved under Professional Standards Legislation.
INDO MINES LIMITED ANNUAL REPORT 2017
Page 16
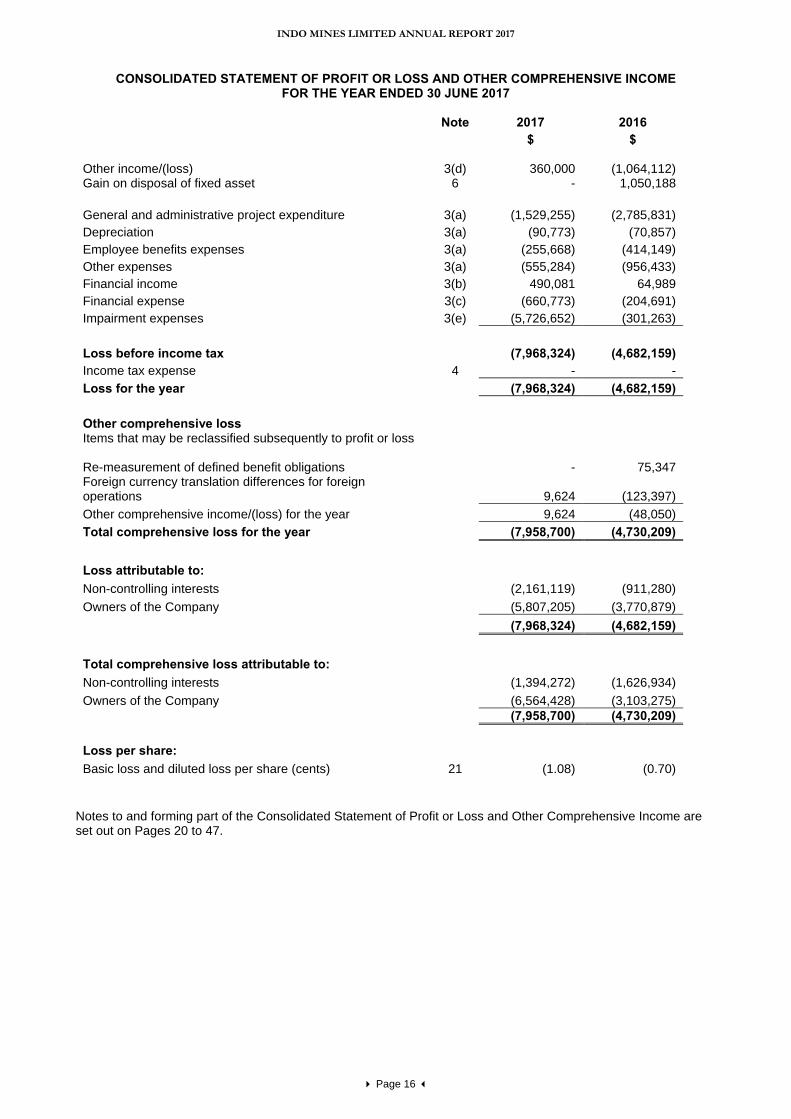
CONSOLIDATED STATEMENT OF PROFIT OR LOSS AND OTHER COMPREHENSIVE INCOME FOR THE YEAR ENDED 30 JUNE 2017
Note 2017 2016 $ $
Other income/(loss) 3(d) 360,000 (1,064,112) Gain on disposal of fixed asset 6 - 1,050,188
General and administrative project expenditure 3(a) (1,529,255) (2,785,831) Depreciation 3(a) (90,773) (70,857) Employee benefits expenses 3(a) (255,668) (414,149) Other expenses 3(a) (555,284) (956,433) Financial income 3(b) 490,081 64,989 Financial expense 3(c) (660,773) (204,691) Impairment expenses 3(e) (5,726,652) (301,263) Loss before income tax (7,968,324) (4,682,159) Income tax expense 4 - - Loss for the year (7,968,324) (4,682,159) Other comprehensive loss Items that may be reclassified subsequently to profit or loss Re-measurement of defined benefit obligations - 75,347 Foreign currency translation differences for foreign operations 9,624 (123,397) Other comprehensive income/(loss) for the year 9,624 (48,050) Total comprehensive loss for the year (7,958,700) (4,730,209) Loss attributable to: Non-controlling interests (2,161,119) (911,280) Owners of the Company (5,807,205) (3,770,879) (7,968,324) (4,682,159) Total comprehensive loss attributable to: Non-controlling interests (1,394,272) (1,626,934) Owners of the Company (6,564,428) (3,103,275) (7,958,700) (4,730,209) Loss per share: Basic loss and diluted loss per share (cents) 21 (1.08) (0.70)
Notes to and forming part of the Consolidated Statement of Profit or Loss and Other Comprehensive Income are set out on Pages 20 to 47.
INDO MINES LIMITED ANNUAL REPORT 2017
Page 17
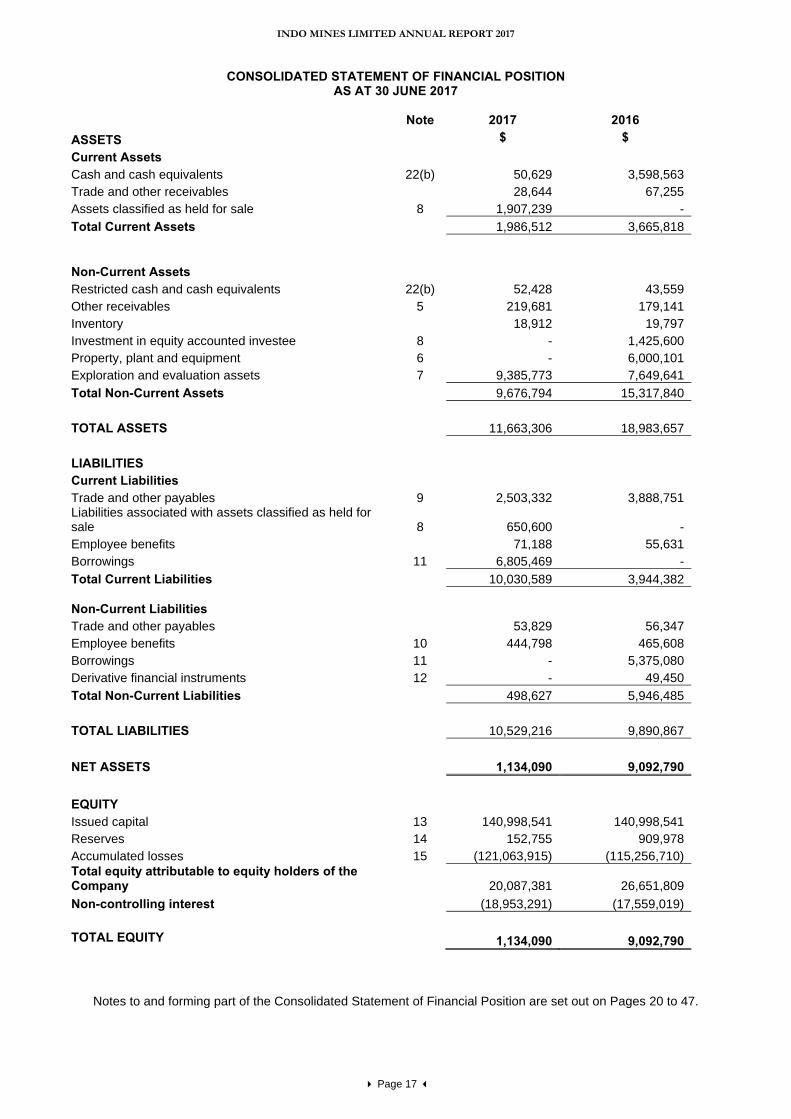
CONSOLIDATED STATEMENT OF FINANCIAL POSITION AS AT 30 JUNE 2017
Note 2017 2016
ASSETS $ $ Current Assets Cash and cash equivalents 22(b) 50,629 3,598,563 Trade and other receivables 28,644 67,255 Assets classified as held for sale 8 1,907,239 - Total Current Assets 1,986,512 3,665,818
Non-Current Assets Restricted cash and cash equivalents 22(b) 52,428 43,559 Other receivables 5 219,681 179,141 Inventory 18,912 19,797 Investment in equity accounted investee 8 - 1,425,600 Property, plant and equipment 6 - 6,000,101 Exploration and evaluation assets 7 9,385,773 7,649,641 Total Non-Current Assets 9,676,794 15,317,840 TOTAL ASSETS 11,663,306 18,983,657 LIABILITIES Current Liabilities Trade and other payables 9 2,503,332 3,888,751 Liabilities associated with assets classified as held for sale 8 650,600 - Employee benefits 71,188 55,631 Borrowings 11 6,805,469 - Total Current Liabilities 10,030,589 3,944,382 Non-Current Liabilities Trade and other payables 53,829 56,347 Employee benefits 10 444,798 465,608 Borrowings 11 - 5,375,080 Derivative financial instruments 12 - 49,450 Total Non-Current Liabilities 498,627 5,946,485 TOTAL LIABILITIES 10,529,216 9,890,867 NET ASSETS 1,134,090 9,092,790 EQUITY Issued capital 13 140,998,541 140,998,541 Reserves 14 152,755 909,978 Accumulated losses 15 (121,063,915) (115,256,710) Total equity attributable to equity holders of the Company 20,087,381 26,651,809 Non-controlling interest (18,953,291) (17,559,019) TOTAL EQUITY 1,134,090 9,092,790
Notes to and forming part of the Consolidated Statement of Financial Position are set out on Pages 20 to 47.
INDO MINES LIMITED ANNUAL REPORT 2017
Page 18
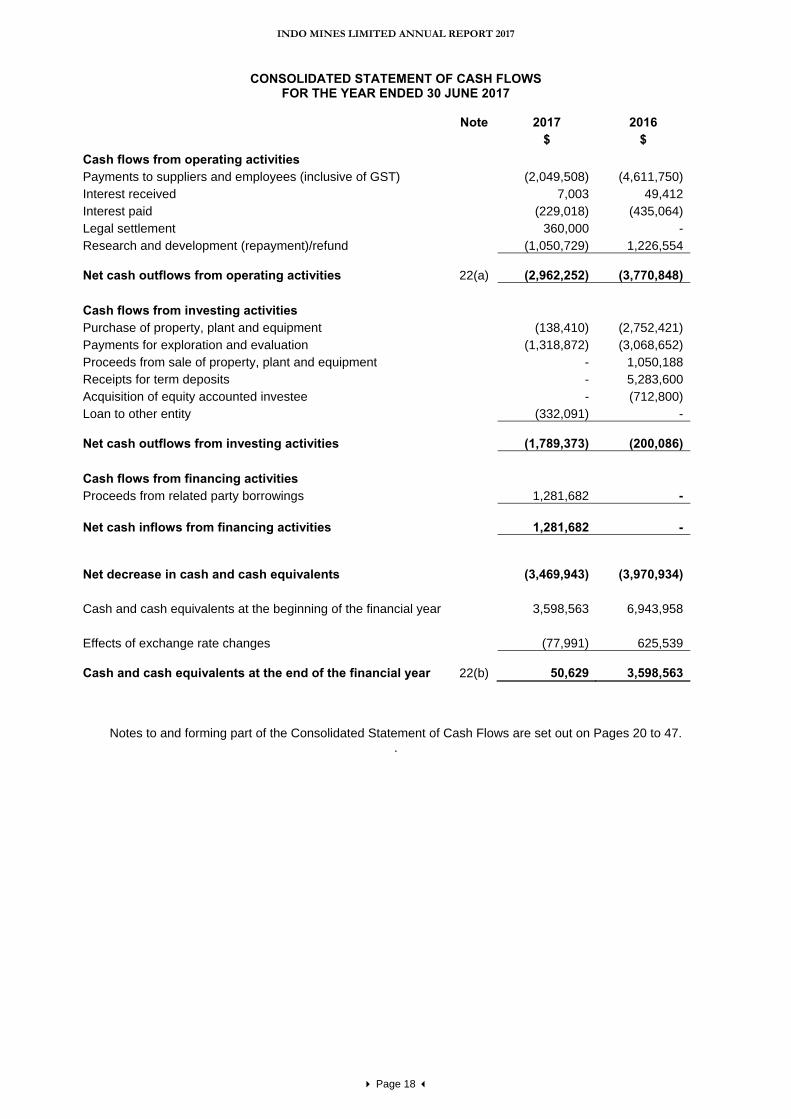
CONSOLIDATED STATEMENT OF CASH FLOWS FOR THE YEAR ENDED 30 JUNE 2017
Note 2017 2016
$ $ Cash flows from operating activities Payments to suppliers and employees (inclusive of GST) (2,049,508) (4,611,750) Interest received 7,003 49,412 Interest paid (229,018) (435,064) Legal settlement 360,000 - Research and development (repayment)/refund (1,050,729) 1,226,554 Net cash outflows from operating activities
22(a) (2,962,252) (3,770,848)
Cash flows from investing activities Purchase of property, plant and equipment (138,410) (2,752,421) Payments for exploration and evaluation (1,318,872) (3,068,652) Proceeds from sale of property, plant and equipment - 1,050,188 Receipts for term deposits - 5,283,600 Acquisition of equity accounted investee - (712,800) Loan to other entity (332,091) - Net cash outflows from investing activities (1,789,373) (200,086) Cash flows from financing activities Proceeds from related party borrowings 1,281,682 -
Net cash inflows from financing activities 1,281,682 - Net decrease in cash and cash equivalents (3,469,943) (3,970,934) Cash and cash equivalents at the beginning of the financial year 3,598,563 6,943,958 Effects of exchange rate changes (77,991) 625,539 Cash and cash equivalents at the end of the financial year
22(b) 50,629 3,598,563
Notes to and forming part of the Consolidated Statement of Cash Flows are set out on Pages 20 to 47. .
INDO MINES LIMITED ANNUAL REPORT 2017
Page 19
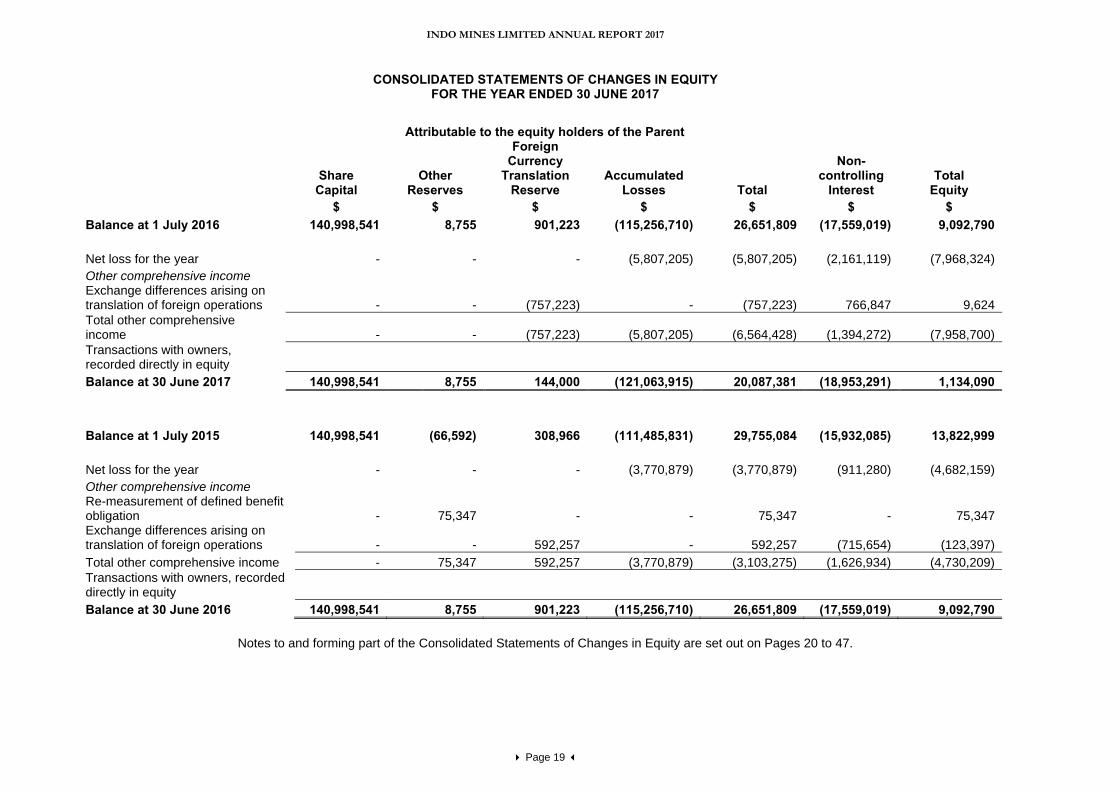
CONSOLIDATED STATEMENTS OF CHANGES IN EQUITY FOR THE YEAR ENDED 30 JUNE 2017
Notes to and forming part of the Consolidated Statements of Changes in Equity are set out on Pages 20 to 47.
Attributable to the equity holders of the Parent
Share
Capital Other
Reserves
Foreign Currency
Translation Reserve
Accumulated Losses
Total
Non-controlling
Interest Total
Equity $ $ $ $ $ $ $
Balance at 1 July 2016 140,998,541 8,755 901,223 (115,256,710) 26,651,809 (17,559,019) 9,092,790 Net loss for the year - - - (5,807,205) (5,807,205) (2,161,119) (7,968,324) Other comprehensive income Exchange differences arising on translation of foreign operations - - (757,223) - (757,223) 766,847 9,624 Total other comprehensive income - - (757,223) (5,807,205) (6,564,428) (1,394,272) (7,958,700) Transactions with owners, recorded directly in equity Balance at 30 June 2017 140,998,541 8,755 144,000 (121,063,915) 20,087,381 (18,953,291) 1,134,090
Balance at 1 July 2015 140,998,541 (66,592) 308,966 (111,485,831) 29,755,084 (15,932,085) 13,822,999 Net loss for the year - - - (3,770,879) (3,770,879) (911,280) (4,682,159) Other comprehensive income Re-measurement of defined benefit obligation - 75,347 - - 75,347 - 75,347 Exchange differences arising on translation of foreign operations - - 592,257 - 592,257 (715,654) (123,397) Total other comprehensive income - 75,347 592,257 (3,770,879) (3,103,275) (1,626,934) (4,730,209) Transactions with owners, recorded directly in equity Balance at 30 June 2016 140,998,541 8,755 901,223 (115,256,710) 26,651,809 (17,559,019) 9,092,790
INDO MINES LIMITED ANNUAL REPORT 2017
NOTES TO AND FORMING PART OF THE FINANCIAL STATEMENTS
Page 20
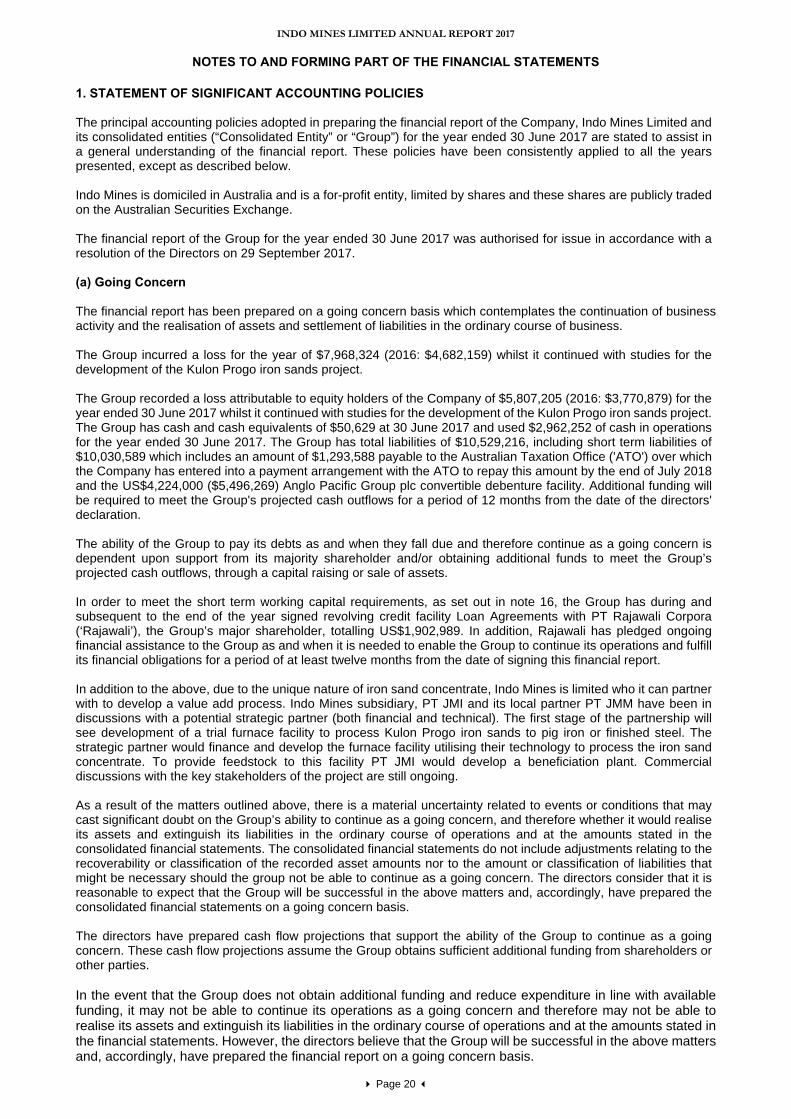
1. STATEMENT OF SIGNIFICANT ACCOUNTING POLICIES The principal accounting policies adopted in preparing the financial report of the Company, Indo Mines Limited and its consolidated entities (“Consolidated Entity” or “Group”) for the year ended 30 June 2017 are stated to assist in a general understanding of the financial report. These policies have been consistently applied to all the years presented, except as described below. Indo Mines is domiciled in Australia and is a for-profit entity, limited by shares and these shares are publicly traded on the Australian Securities Exchange. The financial report of the Group for the year ended 30 June 2017 was authorised for issue in accordance with a resolution of the Directors on 29 September 2017. (a) Going Concern The financial report has been prepared on a going concern basis which contemplates the continuation of business activity and the realisation of assets and settlement of liabilities in the ordinary course of business. The Group incurred a loss for the year of $7,968,324 (2016: $4,682,159) whilst it continued with studies for the development of the Kulon Progo iron sands project. The Group recorded a loss attributable to equity holders of the Company of $5,807,205 (2016: $3,770,879) for the year ended 30 June 2017 whilst it continued with studies for the development of the Kulon Progo iron sands project. The Group has cash and cash equivalents of $50,629 at 30 June 2017 and used $2,962,252 of cash in operations for the year ended 30 June 2017. The Group has total liabilities of $10,529,216, including short term liabilities of $10,030,589 which includes an amount of $1,293,588 payable to the Australian Taxation Office ('ATO') over which the Company has entered into a payment arrangement with the ATO to repay this amount by the end of July 2018 and the US$4,224,000 ($5,496,269) Anglo Pacific Group plc convertible debenture facility. Additional funding will be required to meet the Group's projected cash outflows for a period of 12 months from the date of the directors' declaration. The ability of the Group to pay its debts as and when they fall due and therefore continue as a going concern is dependent upon support from its majority shareholder and/or obtaining additional funds to meet the Group’s projected cash outflows, through a capital raising or sale of assets. In order to meet the short term working capital requirements, as set out in note 16, the Group has during and subsequent to the end of the year signed revolving credit facility Loan Agreements with PT Rajawali Corpora (‘Rajawali’), the Group’s major shareholder, totalling US$1,902,989. In addition, Rajawali has pledged ongoing financial assistance to the Group as and when it is needed to enable the Group to continue its operations and fulfill its financial obligations for a period of at least twelve months from the date of signing this financial report. In addition to the above, due to the unique nature of iron sand concentrate, Indo Mines is limited who it can partner with to develop a value add process. Indo Mines subsidiary, PT JMI and its local partner PT JMM have been in discussions with a potential strategic partner (both financial and technical). The first stage of the partnership will see development of a trial furnace facility to process Kulon Progo iron sands to pig iron or finished steel. The strategic partner would finance and develop the furnace facility utilising their technology to process the iron sand concentrate. To provide feedstock to this facility PT JMI would develop a beneficiation plant. Commercial discussions with the key stakeholders of the project are still ongoing. As a result of the matters outlined above, there is a material uncertainty related to events or conditions that may cast significant doubt on the Group’s ability to continue as a going concern, and therefore whether it would realise its assets and extinguish its liabilities in the ordinary course of operations and at the amounts stated in the consolidated financial statements. The consolidated financial statements do not include adjustments relating to the recoverability or classification of the recorded asset amounts nor to the amount or classification of liabilities that might be necessary should the group not be able to continue as a going concern. The directors consider that it is reasonable to expect that the Group will be successful in the above matters and, accordingly, have prepared the consolidated financial statements on a going concern basis. The directors have prepared cash flow projections that support the ability of the Group to continue as a going concern. These cash flow projections assume the Group obtains sufficient additional funding from shareholders or other parties. In the event that the Group does not obtain additional funding and reduce expenditure in line with available funding, it may not be able to continue its operations as a going concern and therefore may not be able to realise its assets and extinguish its liabilities in the ordinary course of operations and at the amounts stated in the financial statements. However, the directors believe that the Group will be successful in the above matters and, accordingly, have prepared the financial report on a going concern basis.
INDO MINES LIMITED ANNUAL REPORT 2017
NOTES TO AND FORMING PART OF THE FINANCIAL STATEMENTS
Page 21
1. STATEMENT OF SIGNIFICANT ACCOUNTING POLICIES (continued) (b) Basis of Preparation Statement of compliance The financial report is a general purpose financial report which has been prepared in accordance with Australian Accounting Standards (AASs) adopted by the Australian Accounting Standards Board (AASB) and the Corporations Act 2001. The consolidated financial report of the Group complies with International Financial Reporting Standards (IFRSs) adopted by the International Accounting Standards Board (IASB). Basis of measurement The consolidated financial statements have been prepared on the historical cost basis, as modified by the revaluation of financial assets and liabilities (including derivative instruments) at fair value through profit or loss.
Accounting policies adopted by the group during the year In the year ended 30 June 2017, the Directors have reviewed all of the new and revised Standards and interpretations issued by the Australian Accounting Standards Board that are relevant to the group and effective for the current annual reporting period. As a result of this review, the Directors have determined that there is no material impact of the new and revised Standards and interpretations on the group and therefore no material change is necessary to the group accounting policies.
New or revised accounting standards and interpretations not yet adopted
Certain new accounting standards and interpretations have been published that are not mandatory for 30 June 2017 reporting periods and have not been early adopted by the group. The group’s assessment of the impact of these new standards and interpretations is set out below.
AASB 9 Financial Instruments – (Effective date 1 January 2018)
AASB 9 addresses the classification, measurement and de-recognition of financial assets and financial liabilities and introduces new rules for hedge accounting. In December 2014, the AASB made further changes to the classification and measurement rules and also introduced a new impairment model. Management has assessed the assets, liabilities and contracts and believe they currently do not constitute financial instruments. Therefore application of the standard at the operative date is not expected to have a significant impact on the group’s accounting for financial assets and liabilities at the current time.
AASB 15 Revenue from Contracts with Customers – (Effective date 1 January 2018)
The AASB has issued a new standard for the recognition of revenue. This will replace AASB 118 which covers contracts for goods and services and AASB111 which covers construction contracts. The new standard is based on the principle that revenue is recognised when control of a good or service transfers to a customer, so the notion of control replaces the existing notion of risks and rewards. The standard permits either a full retrospective or a modified retrospective approach for the adoption. Management has assessed the impact of the new rules. At this stage, the application of the new rules on the Group’s financial statements will not constitute a material change, as the Company is not generating revenue.
AASB 16 Leases – (Effective date 1 January 2019)
AASB 16 was issued in February 2016. It will result in almost all leases being recognised on the balance sheet, as the distinction between operating and finance leases is removed. Under the new standard, an asset (the right to use the leased item) and a financial liability to pay rentals are recognised. The only exceptions are short-term and low-value leases. The accounting for lessors will not significantly change. At this stage the group does not intend to adopt any of the above standards before their effective date. There are no other standards that are not yet effective and that are expected to have a material impact on the consolidated entity in the current or future reporting periods and on foreseeable future transactions.
INDO MINES LIMITED ANNUAL REPORT 2017
NOTES TO AND FORMING PART OF THE FINANCIAL STATEMENTS
Page 22
1. STATEMENT OF SIGNIFICANT ACCOUNTING POLICIES (continued) (c) Principles of Consolidation Subsidiaries The consolidated financial statements incorporate the assets and liabilities of all subsidiaries of Indo Mines Limited as at 30 June 2017 and the results of all subsidiaries for the year then ended. Indo Mines and its subsidiaries together are referred to as the Group or the Consolidated Entity. Subsidiaries are all those entities (including special purpose entities) over which the Group has the power to govern the financial and operating policies, generally accompanying a shareholding of more than one-half of the voting rights. The existence and potential effect of potential voting rights that are currently exercisable or convertible are considered when assessing whether the Group controls another entity. The Group controls an entity when it is exposed to, or has rights to, variable returns through its power over the entity. Subsidiaries are fully consolidated from the date on which control is transferred to the Group. They are de-consolidated from the date that control ceases. Intercompany transactions and balances, and unrealised gains on transactions between Group companies, are eliminated. Unrealised losses are also eliminated unless the transaction provides evidence of the impairment of the asset transferred. Accounting policies of subsidiaries have been changed where necessary to ensure consistency with the policies adopted by the Group. Non-controlling interest The Group measures any non-controlling interest at its proportionate interest in the identifiable net assets of the subsidiary. Jointly controlled entities In the consolidated financial statements, investments in jointly controlled entities are accounted for using equity accounting principles. Investments in joint arrangements are carried at the lower of the equity accounted amount and recoverable amount. The Company's share of the jointly controlled entity's net profit or loss is recognised in the consolidated statement of comprehensive income from the date joint control commenced until the date joint control ceases. Other movements in reserves are recognised directly in the consolidated reserves. (d) Exploration and evaluation expenditure Exploration and evaluation expenditure encompasses expenditures incurred by the Group in connection with the exploration for and evaluation of mineral resources before the technical feasibility and commercial viability of extracting a mineral resource are demonstrable. Exploration and evaluation expenditure incurred by the Group is accumulated for each area of interest and recorded as an asset if:
(i) the rights to tenure of the area of interest are current; and (ii) at least one of the following conditions is also met:
(1) the exploration and evaluation expenditures are expected to be recouped through successful development and exploitation of the area of interest, or alternatively, by its sale; and/or
(2) exploration and evaluation activities in the area of interest have not at the reporting date reached a stage which permits a reasonable assessment of the existence or otherwise of economically recoverable reserves, and active and significant operations in, or in relation to, the area of interest are continuing.
For each area of interest, expenditure incurred in the acquisition of rights to explore is capitalised and recognised as an exploration and evaluation asset. Exploration and evaluation assets are measured at cost on recognition. Capitalised exploration costs are reviewed each reporting date to establish whether an indication of impairment exists. If any such indication exists, the recoverable amount of the capitalised exploration costs is estimated to determine the extent of the impairment loss (if any).
INDO MINES LIMITED ANNUAL REPORT 2017
NOTES TO AND FORMING PART OF THE FINANCIAL STATEMENTS
Page 23
1. STATEMENT OF SIGNIFICANT ACCOUNTING POLICIES (continued) (d) Exploration and evaluation expenditure (continued) Where a decision is made to proceed with development, accumulated expenditure is tested for impairment and transferred to development properties, and then amortised over the life of the reserves associated with the area of interest once mining operations have commenced.
Recoverability of the carrying amount of the exploration and evaluation assets is dependent on successful development and commercial exploitation, or alternatively, sale of the respective areas of interest. (e) Revenue Recognition Interest income Interest income is recognised in the Statement of Profit or Loss as it accrues, using the effective interest method. (f) Income Tax The income tax expense or revenue for the period is the tax payable on the current period’s taxable income based on the national income tax rate for each jurisdiction, enacted or substantially enacted, adjusted by changes in deferred tax assets and liabilities attributable to temporary differences between the tax bases of assets and liabilities and their carrying amounts in the financial statements, and to unused tax losses. Deferred tax assets and liabilities are recognised for temporary differences at the tax rates expected to apply when the assets are recovered or liabilities are settled, based on those tax rates which are enacted or substantively enacted for each jurisdiction. The relevant tax rates are applied to the cumulative amounts of deductible and taxable temporary differences to measure the deferred tax asset or liability. An exception is made for certain temporary differences arising from the initial recognition of an asset or a liability. No deferred tax asset or liability is recognised in relation to these temporary differences if they arose in a transaction, other than a business combination, that at the time of the transaction did not affect either accounting profit or taxable profit or loss. Deferred tax assets are recognised for deductible temporary differences and unused tax losses only if it is probable that future taxable amounts will be available to utilise those temporary differences and losses. Deferred tax liabilities and assets are not recognised for temporary differences between the carrying amount and tax bases of investments in controlled entities where the parent entity is able to control the timing of the reversal of the temporary differences and it is probable that the differences will not reverse in the foreseeable future. Current and deferred tax balances attributable to amounts recognised directly in equity are also recognised directly in equity. (g) Impairment of Non-Financial Assets Assets that have an indefinite useful life are not subject to amortisation and are tested annually for impairment. Assets that are subject to amortisation are reviewed for impairment whenever events or changes in circumstances indicate that the carrying amount may not be recoverable. An impairment loss is recognised for the amount by which the asset’s carrying amount exceeds its recoverable amount. The recoverable amount is the higher of an asset’s fair value less cost of disposal and its value in use. For the purposes of assessing impairment, assets are grouped at the lowest levels for which there are separately identifiable cash flows (cash generating units). (h) Cash and Cash Equivalents Cash and cash equivalents includes cash on hand, deposits held at call with financial institutions and other short-term highly liquid investments that are readily convertible to known amounts of cash (maturities of three months or less) and which are subject to an insignificant risk of changes in value. Bank overdrafts are shown within borrowings in current liabilities on the statement of financial position. Restricted cash and cash equivalents represents deposits held with financial institutions that are held as security and are not readily convertible to cash.
INDO MINES LIMITED ANNUAL REPORT 2017
NOTES TO AND FORMING PART OF THE FINANCIAL STATEMENTS
Page 24
1. STATEMENT OF SIGNIFICANT ACCOUNTING POLICIES (continued) (i) Trade Receivables Trade receivables are recognised initially at fair value and subsequently measured at amortised cost less an allowance for doubtful debts. Trade receivables are due for settlement no more than 30 days from the date of recognition. An estimate of doubtful debts is made when collection of the full amount is no longer probable. Bad debts are written off as incurred. (j) Non-current assets (or disposal groups) held for sale and discontinued operations Non-current assets (or disposal groups) are classified as held for sale if their carrying amount will be recovered principally through a sale transaction rather than through continuing use and a sale is considered highly probable. They are measured at the lower of their carrying amount and fair value less costs to sell, except for assets such as deferred tax assets, assets arising from employee benefits, financial assets and investment property that are carried at fair value and contractual rights under insurance contracts, which are specifically exempt from this requirement. An impairment loss is recognised for any initial or subsequent write-down of the asset (or disposal group) to fair value less costs to sell. A gain is recognised for any subsequent increases in fair value less costs to sell of an asset (or disposal group), but not in excess of any cumulative impairment loss previously recognised. A gain or loss not previously recognised by the date of the sale of the non-current asset (or disposal group) is recognised at the date of derecognition. Non-current assets (including those that are part of a disposal group) are not depreciated or amortised while they are classified as held for sale. Interest and other expenses attributable to the liabilities of a disposal group classified as held for sale continue to be recognised. Non-current assets classified as held for sale and the assets of a disposal group classified as held for sale are presented separately from the other assets in the balance sheet. The liabilities of a disposal group classified as held for sale are presented separately from other liabilities in the balance sheet. A discontinued operation is a component of the entity that has been disposed of or is classified as held for sale and that represents a separate major line of business or geographical area of operations, is part of a single co-ordinated plan to dispose of such a line of business or area of operations, or is a subsidiary acquired exclusively with a view to resale. The results of discontinued operations are presented separately in the statement of profit or loss. (k) Inventories Inventories are measured at the lower of cost and net realisable value. The cost of inventories is based on the first-in first-out principle, and includes expenditure incurred in acquiring the inventories, production or conversion costs and other costs incurred in bringing them to their existing location and condition. Net realisable value is the estimated selling price in the ordinary course of business, less the estimated costs of bringing the inventory into a saleable state and selling expenses. (l) Property, Plant and Equipment Plant and equipment is stated at historical cost less accumulated depreciation. Historical cost includes expenditure that is directly attributable to the acquisition of the items. Subsequent costs are included in the asset’s carrying amount or recognised as a separate asset, as appropriate, only when it is probable that future economic benefits associated with the item will flow to the Group and the cost of the item can be measured reliably. All other repairs and maintenance are charged to the income statement during the financial period in which they are incurred. Plant and equipment are depreciated or amortised on a straight line basis at rates based upon their expected useful lives as follows:
Life (years)
Buildings Machinery Office equipment
4-10 8-16
4 The assets’ residual values and useful lives are reviewed, and adjusted if appropriate, at each balance sheet date. Gains and losses on disposals are determined by comparing proceeds with carrying amount. These are included in the income statement.
INDO MINES LIMITED ANNUAL REPORT 2017
NOTES TO AND FORMING PART OF THE FINANCIAL STATEMENTS
Page 25
1. STATEMENT OF SIGNIFICANT ACCOUNTING POLICIES (continued) (m) Fair value estimation The fair value of financial instruments traded in active markets (such as publicly traded derivatives, and trading and equity securities) is based on quoted market prices at the balance sheet date. The quoted market price used for financial assets held by the Group is the current bid price; the appropriate quoted market price for financial liabilities is the current ask price. The fair value of financial instruments that are not traded in an active market (for example, over the counter derivatives) is determined using valuation techniques. The Group uses a variety of methods and makes assumptions that are based on market conditions existing at each balance date. Quoted market prices or dealer quotes for similar instruments are used for long-term debt instruments held. Other techniques, such as discounted cash flows, are used to determine fair value for the remaining financial instruments. The fair value of interest-rate swaps is calculated as the present value of the estimated future cash flows. The fair value of forward exchange contracts is determined using forward exchange market rates at the balance sheet date. (n) Investments and Other Financial Assets The Group classifies its investments in the following categories: financial assets at fair value through profit or loss, loans and receivables, loans and receivables held-to-maturity, held-to-maturity investments, available-for-sale financial assets and assets classified as held for sale. The classification depends on the purpose for which the investments were acquired. Management determines the classification of its investments at initial recognition and re-evaluates this designation at each reporting date. Financial assets at fair value through profit or loss are acquired for the purpose of selling in the short term with the intention of making a profit. Fair value movements are recognised in profit or loss. Loans and receivables are non-derivative financial assets with fixed or determinable payments that are not quoted in an active market. Such assets are recognised at fair value plus any directly attributable transaction costs. Subsequent to initial recognition, loans and receivables are measured at amortised cost using the effective interest method, less any impairment losses. They are included in current assets, except for those with maturities greater than 12 months after the reporting period, which are classified as non-current assets. The Group assesses at each balance date whether there is objective evidence that a financial asset or group of financial assets is impaired. In the case of equity securities classified as available-for-sale, a significant or prolonged decline in the fair value of a security below its cost is considered in determining whether the security is impaired. If any such evidence exists for available-for-sale financial assets, the cumulative loss – measured as the difference between the acquisition cost and the current fair value, less any impairment loss on that financial asset previously recognised in profit and loss – is removed from equity and recognised in the income statement. Impairment losses recognised in the income statement on equity instruments are not reversed through the income statement. (o) Trade and Other Payables
Liabilities for trade creditors and other amounts are carried at cost which is the fair value of the consideration to be paid in the future for goods and services received, whether or not billed to the consolidated entity. The amounts are unsecured and are usually paid within 30 days. Payables to related parties are carried at the principal amount. Payables not anticipated to be paid within twelve months are classified as non-current. (p) Employee Benefits (i) Short term benefits Liabilities for wages and salaries, including non-monetary benefits and annual leave expected to be settled within twelve months of the reporting date are recognised in provisions in respect of employees’ services up to the reporting date and are measured at the amounts expected to be paid when the liabilities are settled. Liabilities for non-accumulating sick leave are recognised when the leave is taken and measured at the rates paid or payable. Employee benefits payable later than one year are measured at the present value of the estimated future cash flows to be made for those benefits.
INDO MINES LIMITED ANNUAL REPORT 2017
NOTES TO AND FORMING PART OF THE FINANCIAL STATEMENTS
Page 26
1. STATEMENT OF SIGNIFICANT ACCOUNTING POLICIES (continued) (p) Employee Benefits (continued) (ii) Defined contribution plans A defined contribution plan is a post-employment benefit plan under which an entity pays fixed contributions into a separate entity and will have no legal or constructive obligation to pay further amounts. Obligations for contributions to defined contribution plans are recognised as an employee benefit expense in profit or loss in the periods during which services are rendered by employees. Prepaid contributions are recognised as an asset to the extent that a cash refund or a reduction in future payments is available. Contributions to a defined contribution plan that are due more than 12 months after the end of the period in which the employees render the service are discounted to their present value. (iii) Defined benefit obligation The Indonesian subsidiary is required to provide minimum benefits as stipulated in government labour law regulations. Since the regulations establish the formula for determining the minimum amount of benefits, in substance the pension obligation under the regulations represent a defined benefit obligation. In determining the estimated employee benefit obligations, the subsidiary determines the present value of the defined benefit obligation, current service costs and past service cost using the ‘Project Unit Credit’ actuarial valuation method, with actuarial gains or losses recognised in other comprehensive income. (q) Issued Capital Ordinary shares are classified as equity. Issued and paid up capital is recognised at the fair value of the consideration received by the Company. Incremental costs directly attributable to the issue of new shares or options are shown in equity as a deduction, net of tax, from the proceeds. (r) Dividends Provision is made for the amount of any dividend declared on or before the end of the year but not distributed at balance date. (s) Earnings per Share Basic earnings per share is calculated by dividing the profit/loss attributable to equity holders of the Company, excluding any costs of servicing equity other than ordinary shares, by the weighted average number of ordinary shares outstanding during the year, adjusted for bonus elements in ordinary shares issued during the year. Diluted earnings per share adjusts the figures used in the determination of basic earnings/loss per share to take into account the after tax effect of interest and other financing costs associated with dilutive potential ordinary shares and the weighted average number of shares assumed to have been issued for no consideration in relation to dilutive potential ordinary shares. (t) Goods and Services Tax
Revenues, expenses and assets are recognised net of the amount of GST except:
• where the GST incurred on a purchase of goods and services is not recoverable from the taxation authority, in which case the GST is recognised as part of the cost of acquisition of the asset or as part of the expense item as applicable; and
• receivables and payables are stated with the amount of GST included.
The net amount of GST recoverable from, or payable to, the taxation authority is included as part of receivables or payables in the balance sheet. Cash flows are included in the Cash Flow Statement on a gross basis and the GST component of cash flows arising from investing and financing activities, which is recoverable from, or payable to, the taxation authority are classified as operating cash flows.
INDO MINES LIMITED ANNUAL REPORT 2017
NOTES TO AND FORMING PART OF THE FINANCIAL STATEMENTS
Page 27
1. STATEMENT OF SIGNIFICANT ACCOUNTING POLICIES (continued) (u) Segment Reporting An operating segment is a component of the Group that engages in business activities from which it may earn revenues and incur expenses, including revenues and expenses that relate to transactions with any of the Group’s other components. All operating segments’ operating results are regularly reviewed by the chief operating decision maker to make decisions about resources to be allocated to the segment and assess its performance, and for which discrete financial information is available. The Chief operating decision maker is the CEO of the Group. Segment results that are reported include items directly attributable to a segment as well as those that can be allocated on a reasonable basis. Segment capital expenditure is the total cost incurred during the period to acquire property, plant and equipment, and intangible assets other than goodwill. (v) Finance income and finance costs Finance income comprises interest income on funds invested (including available-for-sale financial assets), dividend income, gains on the disposal of available-for-sale financial assets, changes in the fair value of financial assets and liabilities at fair value through profit or loss, and gains on hedging instruments that are recognised in profit or loss. Interest income is recognised as it accrues in profit or loss, using the effective interest method. Dividend income is recognised in profit or loss on the date that the Group’s right to receive payment is established, which in the case of quoted securities is the ex-dividend date. Finance costs comprise interest expense on borrowings, unwinding of the discount on provisions, dividends on preference shares classified as liabilities, changes in the fair value of financial assets at fair value through profit or loss, impairment losses recognised on financial assets, and losses on hedging instruments that are recognised in profit or loss. Borrowing costs that are not directly attributable to the acquisition, construction or production of a qualifying asset are recognised in profit or loss using the effective interest method. Foreign currency gains and losses are reported on a net basis. (w) Foreign Currency Both the functional and presentation currency of Indo Mines Limited at 30 June 2017 was Australian Dollars. The following table sets out the functional currency of the subsidiaries (unless dormant) of the Group: Company Name Functional Currency PT Jogja Magasa Iron Indonesian Rupiah PT Indomines Mineral Perkasa Indonesian Rupiah Each entity in the Group determines its own functional currency and items included in the financial statements of each entity are measured using that functional currency. Transactions in foreign currencies are initially recorded in the functional currency at the exchange rates ruling at the date of the transaction. Monetary assets and liabilities denominated in foreign currencies are retranslated at the rate of exchange ruling at the balance sheet date. All exchange differences in the consolidated financial report are taken to the income statement with the exception of differences in foreign currency borrowings that provide a hedge against a net investment in a foreign entity. These are taken directly to equity until the disposal of the net investment, at which time they are recognised in the income statement. Tax charges and tax credits attributable to exchange differences on those borrowings are also recognised in equity. Non-monetary items that are measured in terms of historical cost in a foreign currency are translated using the exchange rate as at the date of the initial transaction. Non-monetary items that are measured at fair value in a foreign currency are translated using the exchange rates at the date when the fair value was determined. Where the functional currency of a subsidiary of Indo Mines is not Australian Dollars the assets and liabilities of the subsidiary at reporting date are translated into the presentation currency of Indo Mines at the rate of exchange ruling at the balance sheet date and the income statements are translated by applying the average exchange rate for the year. Any exchange differences arising on this retranslation are taken directly to a separate component of equity. On disposal of a foreign entity, the deferred cumulative amount recognised in equity and relating to that particular foreign operation is recognised in the Statement of Profit or Loss.
INDO MINES LIMITED ANNUAL REPORT 2017
NOTES TO AND FORMING PART OF THE FINANCIAL STATEMENTS
Page 28
1. STATEMENT OF SIGNIFICANT ACCOUNTING POLICIES (continued) (x) Impairment of financial assets (including receivables) A financial asset not carried at fair value through profit or loss is assessed at each reporting date to determine whether there is objective evidence that it is impaired. A financial asset is impaired if objective evidence indicates that a loss event has occurred after the initial recognition of the asset, and that the loss event had a negative effect on the estimated future cash flows of that asset that can be estimated reliably. Objective evidence that financial assets (including equity securities) are impaired can include default or delinquency by a debtor, restructuring of an amount due to the Group on terms that the Group would not consider otherwise, indications that a debtor or issuer will enter bankruptcy, the disappearance of an active market for a security. In addition, for an investment in an equity security, a significant or prolonged decline in its fair value below its cost is objective evidence of impairment. The Group considers evidence of impairment for receivables and held-to-maturity investment securities at both a specific asset and collective level. All individually significant receivables and held-to-maturity investment securities are assessed for specific impairment. All individually significant receivables and held-to-maturity investment securities found not to be specifically impaired are then collectively assessed for any impairment that has been incurred but not yet identified. Receivables and held-to-maturity investment securities that are not individually significant are collectively assessed for impairment by grouping together receivables and held-to-maturity investment securities with similar risk characteristics. In assessing collective impairment the Group uses historical trends of the probability of default, timing of recoveries and the amount of loss incurred, adjusted for management’s judgement as to whether current economic and credit conditions are such that the actual losses are likely to be greater or less than suggested by historical trends. An impairment loss in respect of a financial asset measured at amortised cost is calculated as the difference between its carrying amount and the present value of the estimated future cash flows discounted at the asset’s original effective interest rate. Losses are recognised in profit or loss and reflected in an allowance account against receivables. Interest on the impaired asset continues to be recognised through the unwinding of the discount. When a subsequent event causes the amount of impairment loss to decrease, the decrease in impairment loss is reversed through profit or loss. Impairment losses on available-for-sale investment securities are recognised by transferring the cumulative loss that has been recognised in other comprehensive income, and presented in the fair value reserve in equity, to profit or loss. The cumulative loss that is removed from other comprehensive income and recognised in profit or loss is the difference between the acquisition cost, net of any principal repayment and amortisation, and the current fair value, less any impairment loss previously recognised in profit or loss. Changes in impairment provisions attributable to time value are reflected as a component of interest income. If, in a subsequent period, the fair value of an impaired available-for-sale debt security increases and the increase can be related objectively to an event occurring after the impairment loss was recognised in profit or loss, then the impairment loss is reversed, with the amount of the reversal recognised in profit or loss. However, any subsequent recovery in the fair value of an impaired available-for-sale equity security is recognised in other comprehensive income. (y) Compound financial instruments Compound financial instruments issued by the Group comprise convertible notes that can be converted to share capital at the option of the holder, and the number of shares to be issued does not vary with changes in their fair value. The liability component of a compound financial instrument is recognised initially at the fair value of a similar liability that does not have an equity conversion option. The conversion component is recognised at fair value as a liability. Subsequent to initial recognition, the liability component of a compound financial instrument is measured at amortised cost using the effective interest method. The conversion component is measured at fair value through profit and loss. Interest, dividends, losses and gains relating to the financial liability are recognised in profit or loss. Distributions to the equity holders are recognised against equity, net of any tax benefit.

INDO MINES LIMITED ANNUAL REPORT 2017
NOTES TO AND FORMING PART OF THE FINANCIAL STATEMENTS
Page 29
1. STATEMENT OF SIGNIFICANT ACCOUNTING POLICIES (continued) (z) Research and development rebates Where a rebate is received relating to research and development costs that have been expensed, the rebate is recognised as other income when the rebate becomes receivable and the Company complies with all attached conditions. If the research and development costs have been capitalised, the rebate is deducted from the carrying value of the underlying asset, unless that asset has been fully impaired in a prior period. 2. CRITICAL ACCOUNTING ESTIMATES AND JUDGEMENTS
Estimates and judgments are continually evaluated and are based on historical experience and other factors, including expectations of future events that are believed to be reasonable under the circumstances.
a) Uses of estimates and judgements The preparation of the consolidated financial statements in conformity with AAS requires management to make judgements, estimates and assumptions that affect the application of accounting policies and the reported amounts of assets, liabilities, income and expenses. Actual results may differ from these estimates. Estimates and underlying assumptions are reviewed on an ongoing basis. Revisions to accounting estimates are recognised in the period in which the estimates are revised and in any future periods affected. Information about critical judgements in applying accounting policies that have the most significant effect on the amounts recongised in the financial statements is included in the following notes: (i) Estimated impairment of deferred exploration, evaluation and development expenditure (refer Note 7) Determining the recoverability of exploration and evaluation expenditure capitalised in accordance with the group’s accounting policy (refer note 1(d)), requires estimates and assumptions as to future events and circumstances, in particular, whether successful development and commercial exploitation, or alternatively sale, of the respective areas of interest will be achieved. Critical to this assessment is estimates and assumptions as to reserves, timing of expected cash flows, exchange rates, commodity prices and future capital requirements. Changes in these estimates and assumptions as new information about the presence or recoverability of an ore reserve becomes available, may impact the assessment of the recoverable amount of exploration and evaluation assets. If, after having capitalised the expenditure under accounting policy 1(d), a judgement is made that recovery of the expenditure is unlikely, an impairment loss is recorded in the income statement. The carrying amounts of exploration and evaluation assets are set out in Note 7. (ii) Income tax benefit (refer Note 4) Judgement is required in assessing whether deferred tax assets and liabilities are recognised on the statement of financial position. Deferred tax assets, including those arising from temporary differences, are recognised only when it is considered more likely than not that they will be recovered, which is dependent on the generation of future assessable income of a nature and of an amount sufficient to enable the benefits to be utilised. (iii) Property, plant and equipment (refer Note 6) Management review the carrying value and the estimate of the useful lives of depreciable assets at each reporting date, based on the expected utility of the assets. Uncertainties in these estimates relate to expected future usage and utility of the assets. If a judgement is made that recovery of the carrying value of the assets is unlikely, an impairment loss is recorded in the income statement. (iv) Non-Current Assets (refer Note 7) Judgement is required in determining the appropriate level of project related costs that should be capitalised as deferred exploration and evaluation expenditure and what percentage of this expenditure should be expensed. Management has estimated the percentage of each departments activities can be directly related to project activities and capitalised the corresponding percentage of expenditure relating to that department.
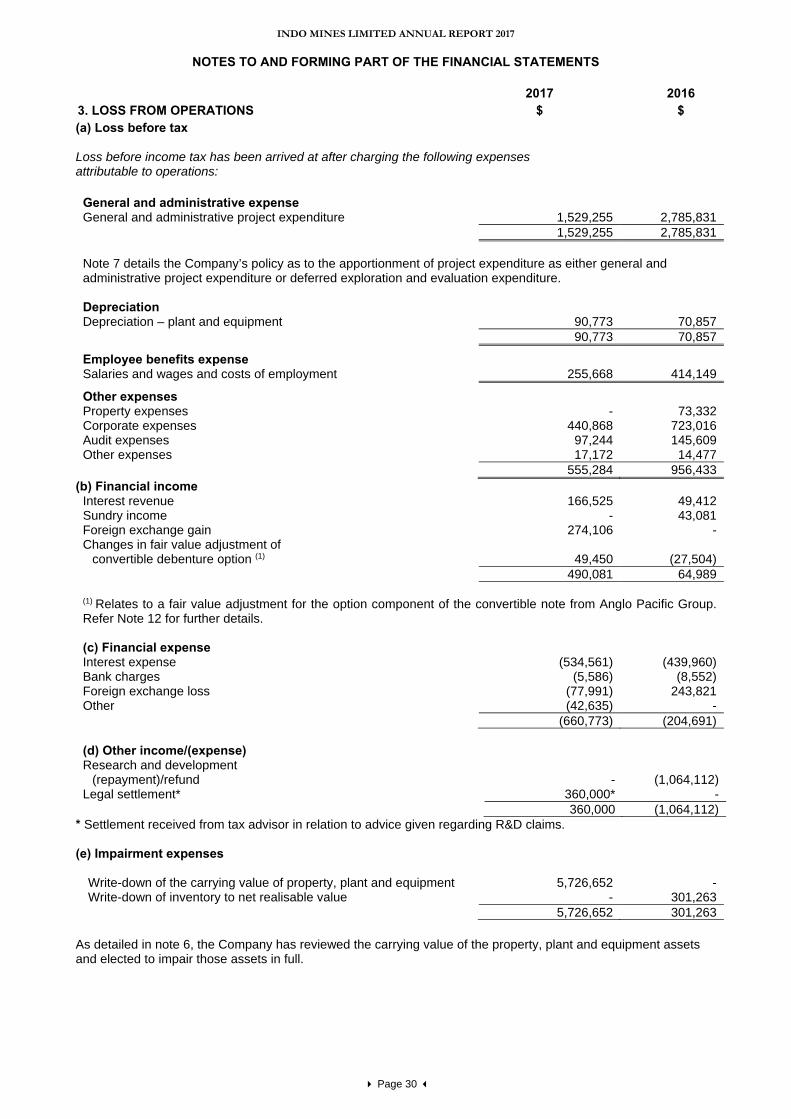
INDO MINES LIMITED ANNUAL REPORT 2017
NOTES TO AND FORMING PART OF THE FINANCIAL STATEMENTS
Page 30
2017 2016 3. LOSS FROM OPERATIONS $ $ (a) Loss before tax Loss before income tax has been arrived at after charging the following expenses attributable to operations:
General and administrative expense General and administrative project expenditure 1,529,255 2,785,831 1,529,255 2,785,831 Note 7 details the Company’s policy as to the apportionment of project expenditure as either general and administrative project expenditure or deferred exploration and evaluation expenditure. Depreciation Depreciation – plant and equipment 90,773 70,857 90,773 70,857
Employee benefits expense Salaries and wages and costs of employment 255,668 414,149
Other expenses Property expenses - 73,332 Corporate expenses 440,868 723,016 Audit expenses 97,244 145,609 Other expenses 17,172 14,477 555,284 956,433
(b) Financial income Interest revenue 166,525 49,412 Sundry income - 43,081 Foreign exchange gain 274,106 - Changes in fair value adjustment of
convertible debenture option (1) 49,450 (27,504) 490,081 64,989 (1) Relates to a fair value adjustment for the option component of the convertible note from Anglo Pacific Group. Refer Note 12 for further details. (c) Financial expense Interest expense (534,561) (439,960) Bank charges (5,586) (8,552) Foreign exchange loss (77,991) 243,821 Other (42,635) - (660,773) (204,691)
(d) Other income/(expense) Research and development
(repayment)/refund - (1,064,112)
Legal settlement* 360,000* - 360,000 (1,064,112)
* Settlement received from tax advisor in relation to advice given regarding R&D claims. (e) Impairment expenses
Write-down of the carrying value of property, plant and equipment 5,726,652 - Write-down of inventory to net realisable value - 301,263 5,726,652 301,263
As detailed in note 6, the Company has reviewed the carrying value of the property, plant and equipment assets and elected to impair those assets in full.
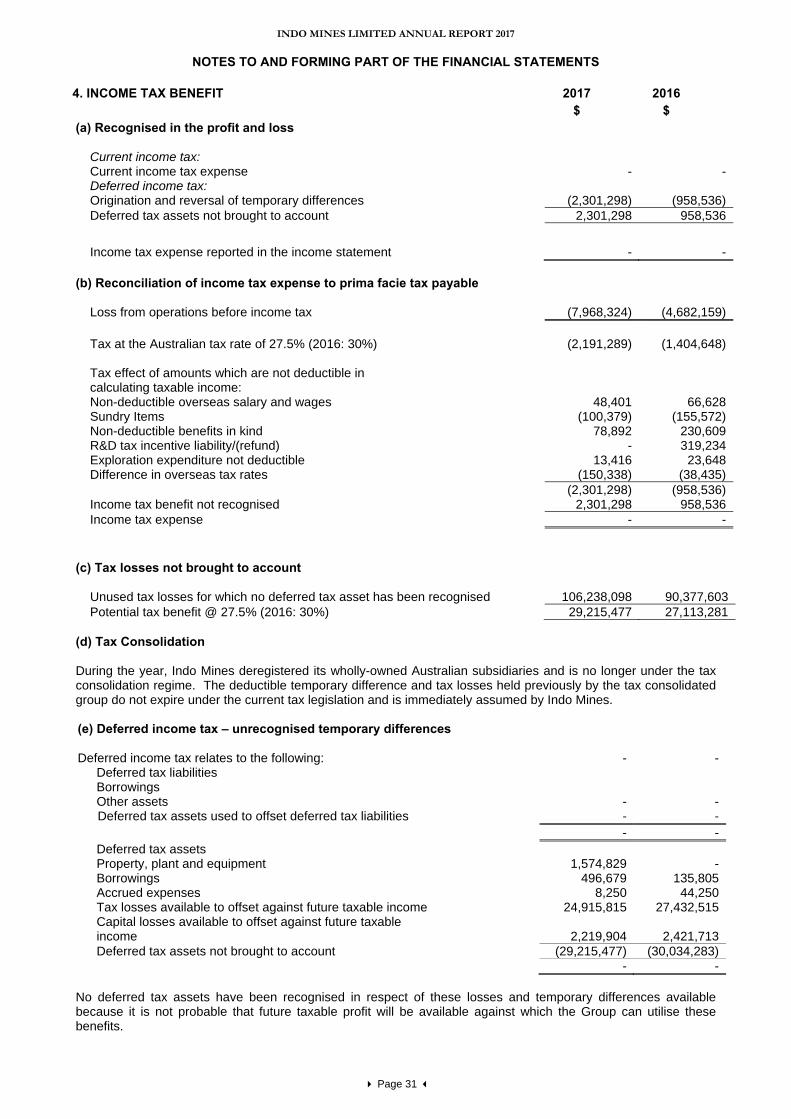
INDO MINES LIMITED ANNUAL REPORT 2017
NOTES TO AND FORMING PART OF THE FINANCIAL STATEMENTS
Page 31
4. INCOME TAX BENEFIT 2017 2016 $ $ (a) Recognised in the profit and loss
Current income tax: Current income tax expense
-
-
Deferred income tax: Origination and reversal of temporary differences (2,301,298) (958,536) Deferred tax assets not brought to account 2,301,298 958,536
Income tax expense reported in the income statement - - (b) Reconciliation of income tax expense to prima facie tax payable
Loss from operations before income tax (7,968,324) (4,682,159)
Tax at the Australian tax rate of 27.5% (2016: 30%) (2,191,289) (1,404,648) Tax effect of amounts which are not deductible in calculating taxable income: Non-deductible overseas salary and wages 48,401 66,628 Sundry Items (100,379) (155,572) Non-deductible benefits in kind 78,892 230,609 R&D tax incentive liability/(refund) - 319,234 Exploration expenditure not deductible 13,416 23,648 Difference in overseas tax rates (150,338) (38,435) (2,301,298) (958,536) Income tax benefit not recognised 2,301,298 958,536 Income tax expense - -
(c) Tax losses not brought to account
Unused tax losses for which no deferred tax asset has been recognised 106,238,098 90,377,603 Potential tax benefit @ 27.5% (2016: 30%) 29,215,477 27,113,281
(d) Tax Consolidation During the year, Indo Mines deregistered its wholly-owned Australian subsidiaries and is no longer under the tax consolidation regime. The deductible temporary difference and tax losses held previously by the tax consolidated group do not expire under the current tax legislation and is immediately assumed by Indo Mines. (e) Deferred income tax – unrecognised temporary differences
Deferred income tax relates to the following: Deferred tax liabilities Borrowings Other assets
- -
- - Deferred tax assets used to offset deferred tax liabilities - - - - Deferred tax assets Property, plant and equipment 1,574,829 - Borrowings 496,679 135,805 Accrued expenses 8,250 44,250 Tax losses available to offset against future taxable income 24,915,815 27,432,515 Capital losses available to offset against future taxable
income 2,219,904 2,421,713 Deferred tax assets not brought to account (29,215,477) (30,034,283) - - No deferred tax assets have been recognised in respect of these losses and temporary differences available because it is not probable that future taxable profit will be available against which the Group can utilise these benefits.
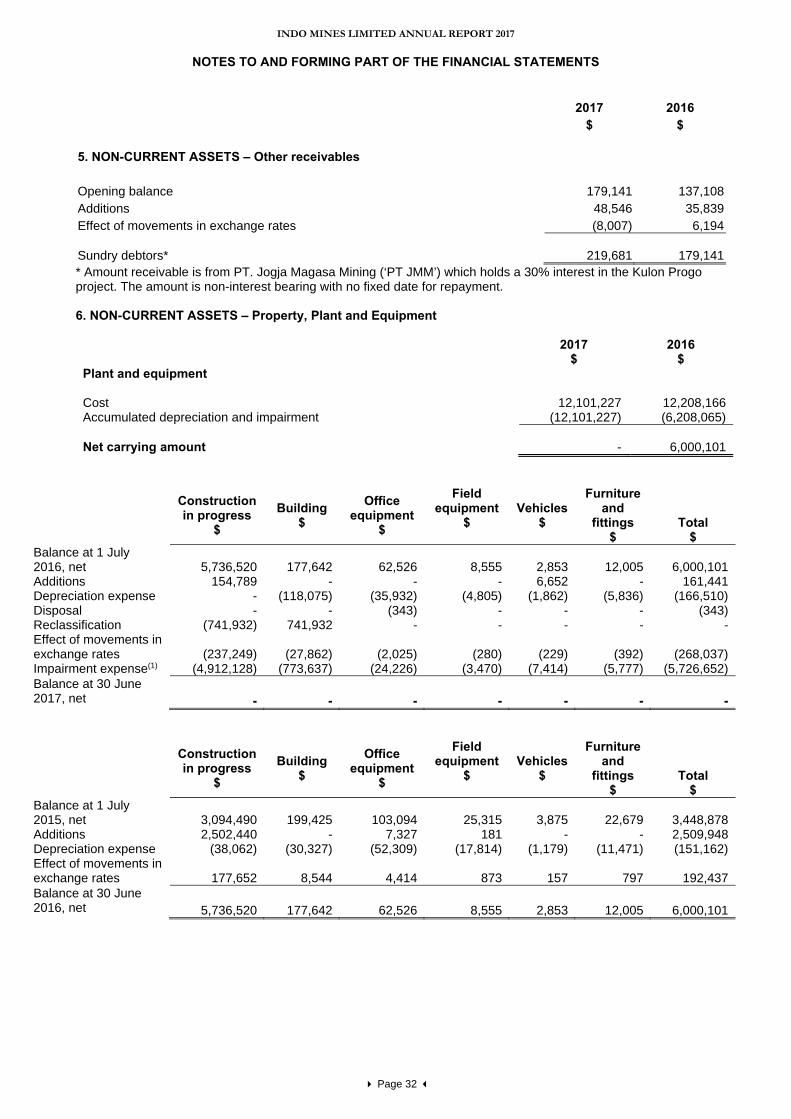
INDO MINES LIMITED ANNUAL REPORT 2017
NOTES TO AND FORMING PART OF THE FINANCIAL STATEMENTS
Page 32
2017 2016 $ $ 5. NON-CURRENT ASSETS – Other receivables
Opening balance 179,141 137,108Additions 48,546 35,839Effect of movements in exchange rates (8,007) 6,194
Sundry debtors*
219,681 179,141* Amount receivable is from PT. Jogja Magasa Mining (‘PT JMM’) which holds a 30% interest in the Kulon Progo project. The amount is non-interest bearing with no fixed date for repayment. 6. NON-CURRENT ASSETS – Property, Plant and Equipment
2017 2016 $ $ Plant and equipment Cost
12,101,227
12,208,166
Accumulated depreciation and impairment (12,101,227) (6,208,065) Net carrying amount
-
6,000,101
Construction in progress
$ Building
$ Office
equipment $
Field equipment
$
Vehicles
$
Furniture and
fittings $
Total $
Balance at 1 July 2016, net 5,736,520 177,642 62,526 8,555 2,853 12,005 6,000,101 Additions 154,789 - - - 6,652 - 161,441 Depreciation expense - (118,075) (35,932) (4,805) (1,862) (5,836) (166,510) Disposal - - (343) - - - (343) Reclassification (741,932) 741,932 - - - - - Effect of movements in exchange rates (237,249) (27,862) (2,025) (280) (229) (392) (268,037) Impairment expense(1) (4,912,128) (773,637) (24,226) (3,470) (7,414) (5,777) (5,726,652) Balance at 30 June 2017, net - - - - - - -
Construction in progress
$ Building
$ Office
equipment $
Field equipment
$
Vehicles
$
Furniture and
fittings $
Total $
Balance at 1 July 2015, net 3,094,490 199,425 103,094 25,315 3,875 22,679 3,448,878 Additions 2,502,440 - 7,327 181 - - 2,509,948 Depreciation expense (38,062) (30,327) (52,309) (17,814) (1,179) (11,471) (151,162) Effect of movements in exchange rates 177,652 8,544 4,414 873 157 797 192,437 Balance at 30 June 2016, net 5,736,520 177,642 62,526 8,555 2,853 12,005 6,000,101
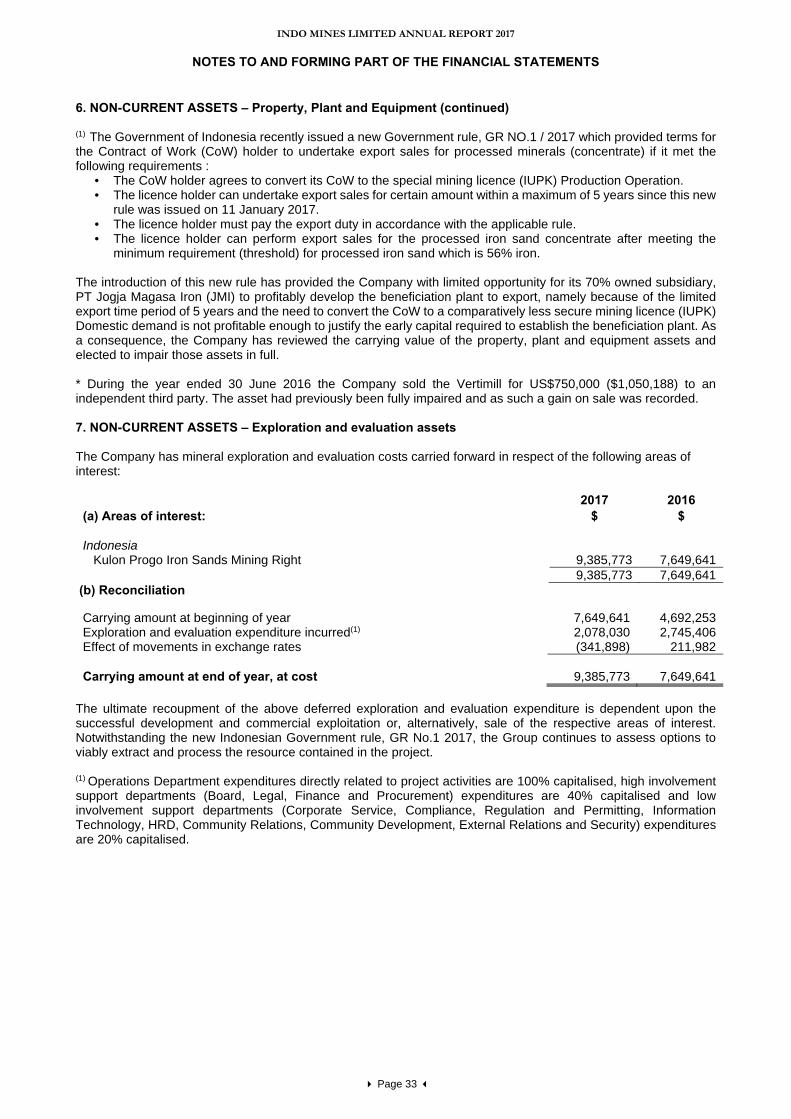
INDO MINES LIMITED ANNUAL REPORT 2017
NOTES TO AND FORMING PART OF THE FINANCIAL STATEMENTS
Page 33
6. NON-CURRENT ASSETS – Property, Plant and Equipment (continued)
(1) The Government of Indonesia recently issued a new Government rule, GR NO.1 / 2017 which provided terms for the Contract of Work (CoW) holder to undertake export sales for processed minerals (concentrate) if it met the following requirements :
• The CoW holder agrees to convert its CoW to the special mining licence (IUPK) Production Operation. • The licence holder can undertake export sales for certain amount within a maximum of 5 years since this new
rule was issued on 11 January 2017. • The licence holder must pay the export duty in accordance with the applicable rule. • The licence holder can perform export sales for the processed iron sand concentrate after meeting the
minimum requirement (threshold) for processed iron sand which is 56% iron. The introduction of this new rule has provided the Company with limited opportunity for its 70% owned subsidiary, PT Jogja Magasa Iron (JMI) to profitably develop the beneficiation plant to export, namely because of the limited export time period of 5 years and the need to convert the CoW to a comparatively less secure mining licence (IUPK) Domestic demand is not profitable enough to justify the early capital required to establish the beneficiation plant. As a consequence, the Company has reviewed the carrying value of the property, plant and equipment assets and elected to impair those assets in full. * During the year ended 30 June 2016 the Company sold the Vertimill for US$750,000 ($1,050,188) to an independent third party. The asset had previously been fully impaired and as such a gain on sale was recorded. 7. NON-CURRENT ASSETS – Exploration and evaluation assets The Company has mineral exploration and evaluation costs carried forward in respect of the following areas of interest:
2017 2016 (a) Areas of interest: $ $
Indonesia
Kulon Progo Iron Sands Mining Right 9,385,773 7,649,641 9,385,773 7,649,641
(b) Reconciliation
Carrying amount at beginning of year 7,649,641 4,692,253 Exploration and evaluation expenditure incurred(1) 2,078,030 2,745,406 Effect of movements in exchange rates (341,898) 211,982 Carrying amount at end of year, at cost
9,385,773
7,649,641
The ultimate recoupment of the above deferred exploration and evaluation expenditure is dependent upon the successful development and commercial exploitation or, alternatively, sale of the respective areas of interest. Notwithstanding the new Indonesian Government rule, GR No.1 2017, the Group continues to assess options to viably extract and process the resource contained in the project. (1) Operations Department expenditures directly related to project activities are 100% capitalised, high involvement support departments (Board, Legal, Finance and Procurement) expenditures are 40% capitalised and low involvement support departments (Corporate Service, Compliance, Regulation and Permitting, Information Technology, HRD, Community Relations, Community Development, External Relations and Security) expenditures are 20% capitalised.
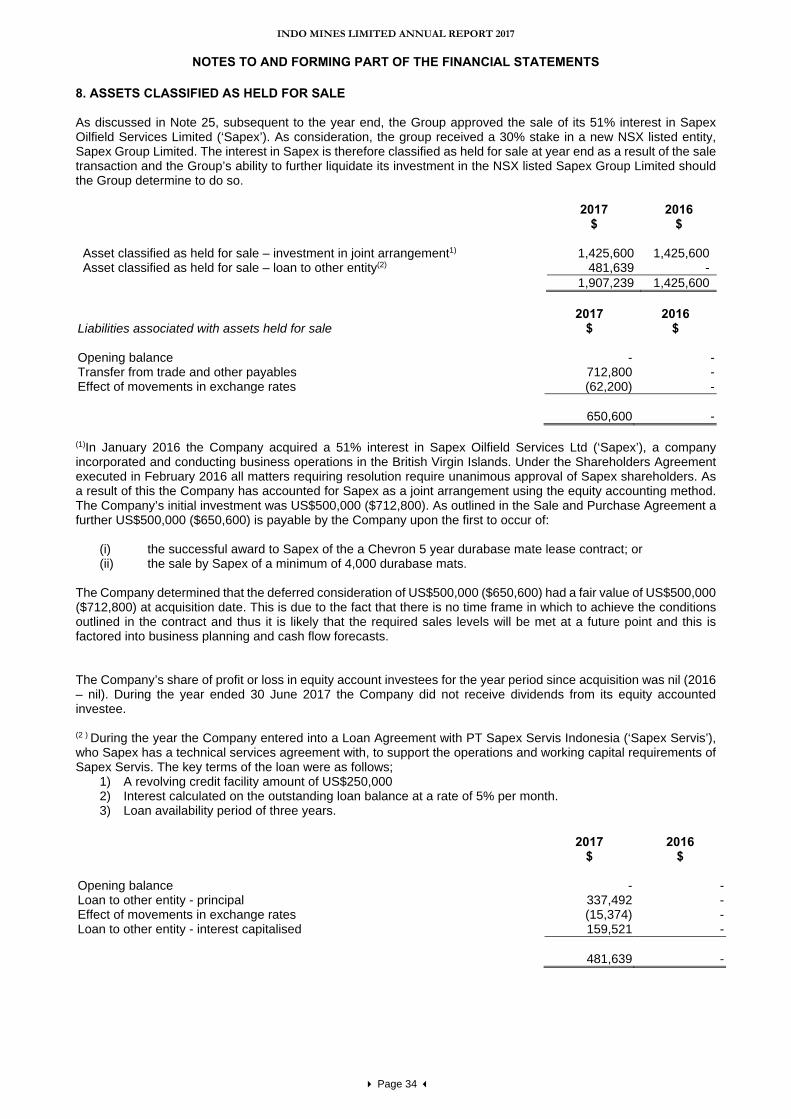
INDO MINES LIMITED ANNUAL REPORT 2017
NOTES TO AND FORMING PART OF THE FINANCIAL STATEMENTS
Page 34
8. ASSETS CLASSIFIED AS HELD FOR SALE As discussed in Note 25, subsequent to the year end, the Group approved the sale of its 51% interest in Sapex Oilfield Services Limited (‘Sapex’). As consideration, the group received a 30% stake in a new NSX listed entity, Sapex Group Limited. The interest in Sapex is therefore classified as held for sale at year end as a result of the sale transaction and the Group’s ability to further liquidate its investment in the NSX listed Sapex Group Limited should the Group determine to do so.
2017 2016 $ $
Asset classified as held for sale – investment in joint arrangement1) 1,425,600 1,425,600 Asset classified as held for sale – loan to other entity(2) 481,639 -
1,907,239 1,425,600 2017 2016 Liabilities associated with assets held for sale $ $ Opening balance - -Transfer from trade and other payables 712,800 -Effect of movements in exchange rates (62,200) -
650,600 - (1)In January 2016 the Company acquired a 51% interest in Sapex Oilfield Services Ltd (‘Sapex’), a company incorporated and conducting business operations in the British Virgin Islands. Under the Shareholders Agreement executed in February 2016 all matters requiring resolution require unanimous approval of Sapex shareholders. As a result of this the Company has accounted for Sapex as a joint arrangement using the equity accounting method. The Company’s initial investment was US$500,000 ($712,800). As outlined in the Sale and Purchase Agreement a further US$500,000 ($650,600) is payable by the Company upon the first to occur of:
(i) the successful award to Sapex of the a Chevron 5 year durabase mate lease contract; or (ii) the sale by Sapex of a minimum of 4,000 durabase mats.
The Company determined that the deferred consideration of US$500,000 ($650,600) had a fair value of US$500,000 ($712,800) at acquisition date. This is due to the fact that there is no time frame in which to achieve the conditions outlined in the contract and thus it is likely that the required sales levels will be met at a future point and this is factored into business planning and cash flow forecasts. The Company’s share of profit or loss in equity account investees for the year period since acquisition was nil (2016 – nil). During the year ended 30 June 2017 the Company did not receive dividends from its equity accounted investee. (2 ) During the year the Company entered into a Loan Agreement with PT Sapex Servis Indonesia (‘Sapex Servis’), who Sapex has a technical services agreement with, to support the operations and working capital requirements of Sapex Servis. The key terms of the loan were as follows;
1) A revolving credit facility amount of US$250,000 2) Interest calculated on the outstanding loan balance at a rate of 5% per month. 3) Loan availability period of three years.
2017 2016 $ $ Opening balance - -Loan to other entity - principal 337,492 -Effect of movements in exchange rates (15,374) -Loan to other entity - interest capitalised 159,521 -
481,639 -
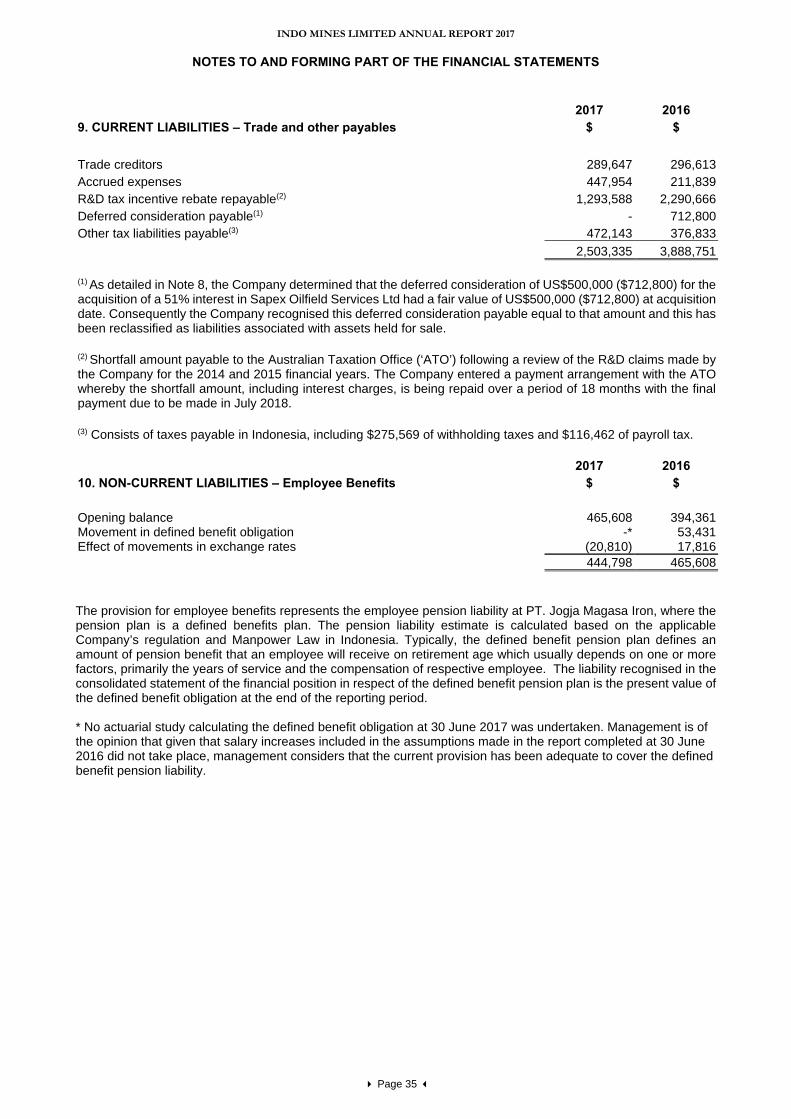
INDO MINES LIMITED ANNUAL REPORT 2017
NOTES TO AND FORMING PART OF THE FINANCIAL STATEMENTS
Page 35
2017 2016 9. CURRENT LIABILITIES – Trade and other payables $ $ Trade creditors 289,647 296,613Accrued expenses 447,954 211,839R&D tax incentive rebate repayable(2) 1,293,588 2,290,666Deferred consideration payable(1) - 712,800Other tax liabilities payable(3) 472,143 376,833 2,503,335 3,888,751 (1) As detailed in Note 8, the Company determined that the deferred consideration of US$500,000 ($712,800) for the acquisition of a 51% interest in Sapex Oilfield Services Ltd had a fair value of US$500,000 ($712,800) at acquisition date. Consequently the Company recognised this deferred consideration payable equal to that amount and this has been reclassified as liabilities associated with assets held for sale. (2) Shortfall amount payable to the Australian Taxation Office (‘ATO’) following a review of the R&D claims made by the Company for the 2014 and 2015 financial years. The Company entered a payment arrangement with the ATO whereby the shortfall amount, including interest charges, is being repaid over a period of 18 months with the final payment due to be made in July 2018. (3) Consists of taxes payable in Indonesia, including $275,569 of withholding taxes and $116,462 of payroll tax. 2017 2016 10. NON-CURRENT LIABILITIES – Employee Benefits $ $
Opening balance 465,608 394,361Movement in defined benefit obligation -* 53,431Effect of movements in exchange rates (20,810) 17,816 444,798 465,608 The provision for employee benefits represents the employee pension liability at PT. Jogja Magasa Iron, where the pension plan is a defined benefits plan. The pension liability estimate is calculated based on the applicable Company’s regulation and Manpower Law in Indonesia. Typically, the defined benefit pension plan defines an amount of pension benefit that an employee will receive on retirement age which usually depends on one or more factors, primarily the years of service and the compensation of respective employee. The liability recognised in the consolidated statement of the financial position in respect of the defined benefit pension plan is the present value of the defined benefit obligation at the end of the reporting period. * No actuarial study calculating the defined benefit obligation at 30 June 2017 was undertaken. Management is of the opinion that given that salary increases included in the assumptions made in the report completed at 30 June 2016 did not take place, management considers that the current provision has been adequate to cover the defined benefit pension liability.
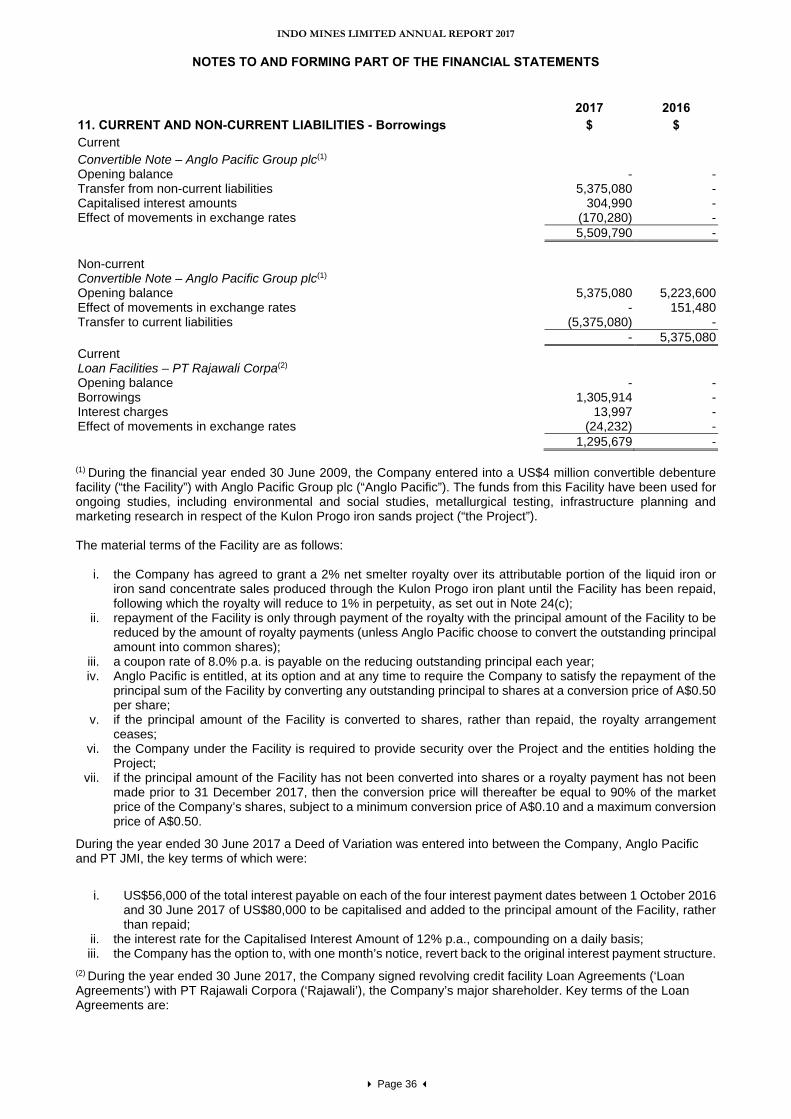
INDO MINES LIMITED ANNUAL REPORT 2017
NOTES TO AND FORMING PART OF THE FINANCIAL STATEMENTS
Page 36
2017 2016 11. CURRENT AND NON-CURRENT LIABILITIES - Borrowings $ $ Current Convertible Note – Anglo Pacific Group plc(1) Opening balance - -Transfer from non-current liabilities 5,375,080 -Capitalised interest amounts 304,990 -Effect of movements in exchange rates (170,280) - 5,509,790 - Non-current Convertible Note – Anglo Pacific Group plc(1) Opening balance 5,375,080 5,223,600Effect of movements in exchange rates - 151,480Transfer to current liabilities (5,375,080) - - 5,375,080Current Loan Facilities – PT Rajawali Corpa(2) Opening balance - -Borrowings 1,305,914 -Interest charges 13,997 -Effect of movements in exchange rates (24,232) - 1,295,679 - (1) During the financial year ended 30 June 2009, the Company entered into a US$4 million convertible debenture facility (“the Facility”) with Anglo Pacific Group plc (“Anglo Pacific”). The funds from this Facility have been used for ongoing studies, including environmental and social studies, metallurgical testing, infrastructure planning and marketing research in respect of the Kulon Progo iron sands project (“the Project”). The material terms of the Facility are as follows:
i. the Company has agreed to grant a 2% net smelter royalty over its attributable portion of the liquid iron or iron sand concentrate sales produced through the Kulon Progo iron plant until the Facility has been repaid, following which the royalty will reduce to 1% in perpetuity, as set out in Note 24(c);
ii. repayment of the Facility is only through payment of the royalty with the principal amount of the Facility to be reduced by the amount of royalty payments (unless Anglo Pacific choose to convert the outstanding principal amount into common shares);
iii. a coupon rate of 8.0% p.a. is payable on the reducing outstanding principal each year; iv. Anglo Pacific is entitled, at its option and at any time to require the Company to satisfy the repayment of the
principal sum of the Facility by converting any outstanding principal to shares at a conversion price of A$0.50 per share;
v. if the principal amount of the Facility is converted to shares, rather than repaid, the royalty arrangement ceases;
vi. the Company under the Facility is required to provide security over the Project and the entities holding the Project;
vii. if the principal amount of the Facility has not been converted into shares or a royalty payment has not been made prior to 31 December 2017, then the conversion price will thereafter be equal to 90% of the market price of the Company’s shares, subject to a minimum conversion price of A$0.10 and a maximum conversion price of A$0.50.
During the year ended 30 June 2017 a Deed of Variation was entered into between the Company, Anglo Pacific and PT JMI, the key terms of which were:
i. US$56,000 of the total interest payable on each of the four interest payment dates between 1 October 2016
and 30 June 2017 of US$80,000 to be capitalised and added to the principal amount of the Facility, rather than repaid;
ii. the interest rate for the Capitalised Interest Amount of 12% p.a., compounding on a daily basis; iii. the Company has the option to, with one month’s notice, revert back to the original interest payment structure.
(2) During the year ended 30 June 2017, the Company signed revolving credit facility Loan Agreements (‘Loan Agreements’) with PT Rajawali Corpora (‘Rajawali’), the Company’s major shareholder. Key terms of the Loan Agreements are:
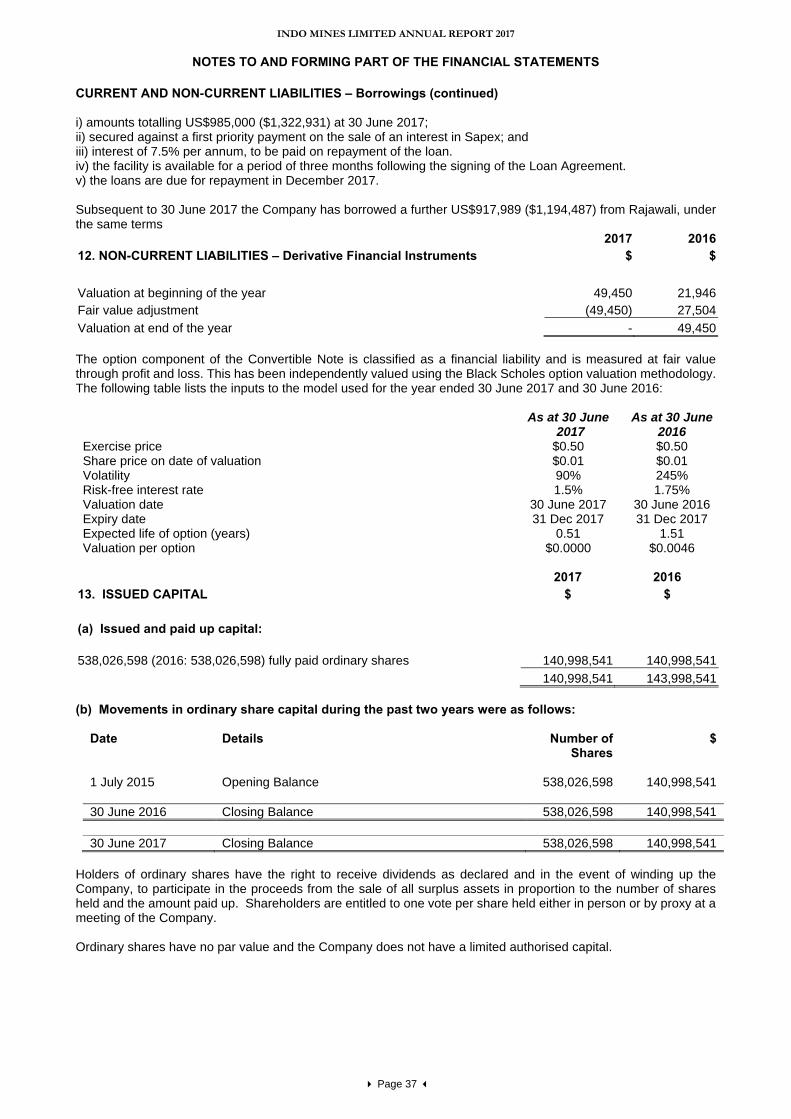
INDO MINES LIMITED ANNUAL REPORT 2017
NOTES TO AND FORMING PART OF THE FINANCIAL STATEMENTS
Page 37
CURRENT AND NON-CURRENT LIABILITIES – Borrowings (continued) i) amounts totalling US$985,000 ($1,322,931) at 30 June 2017; ii) secured against a first priority payment on the sale of an interest in Sapex; and iii) interest of 7.5% per annum, to be paid on repayment of the loan. iv) the facility is available for a period of three months following the signing of the Loan Agreement. v) the loans are due for repayment in December 2017. Subsequent to 30 June 2017 the Company has borrowed a further US$917,989 ($1,194,487) from Rajawali, under the same terms 2017 201612. NON-CURRENT LIABILITIES – Derivative Financial Instruments $ $ Valuation at beginning of the year 49,450 21,946Fair value adjustment (49,450) 27,504Valuation at end of the year - 49,450 The option component of the Convertible Note is classified as a financial liability and is measured at fair value through profit and loss. This has been independently valued using the Black Scholes option valuation methodology. The following table lists the inputs to the model used for the year ended 30 June 2017 and 30 June 2016:
As at 30 June 2017
As at 30 June 2016
Exercise price $0.50 $0.50 Share price on date of valuation $0.01 $0.01 Volatility 90% 245% Risk-free interest rate 1.5% 1.75% Valuation date 30 June 2017 30 June 2016 Expiry date 31 Dec 2017 31 Dec 2017 Expected life of option (years) 0.51 1.51 Valuation per option $0.0000 $0.0046
2017 2016 13. ISSUED CAPITAL $ $
(a) Issued and paid up capital: 538,026,598 (2016: 538,026,598) fully paid ordinary shares
140,998,541 140,998,541
140,998,541 143,998,541 (b) Movements in ordinary share capital during the past two years were as follows:
Date Details Number of Shares
$
1 July 2015 Opening Balance 538,026,598 140,998,541 30 June 2016 Closing Balance 538,026,598 140,998,541 30 June 2017 Closing Balance 538,026,598 140,998,541
Holders of ordinary shares have the right to receive dividends as declared and in the event of winding up the Company, to participate in the proceeds from the sale of all surplus assets in proportion to the number of shares held and the amount paid up. Shareholders are entitled to one vote per share held either in person or by proxy at a meeting of the Company. Ordinary shares have no par value and the Company does not have a limited authorised capital.
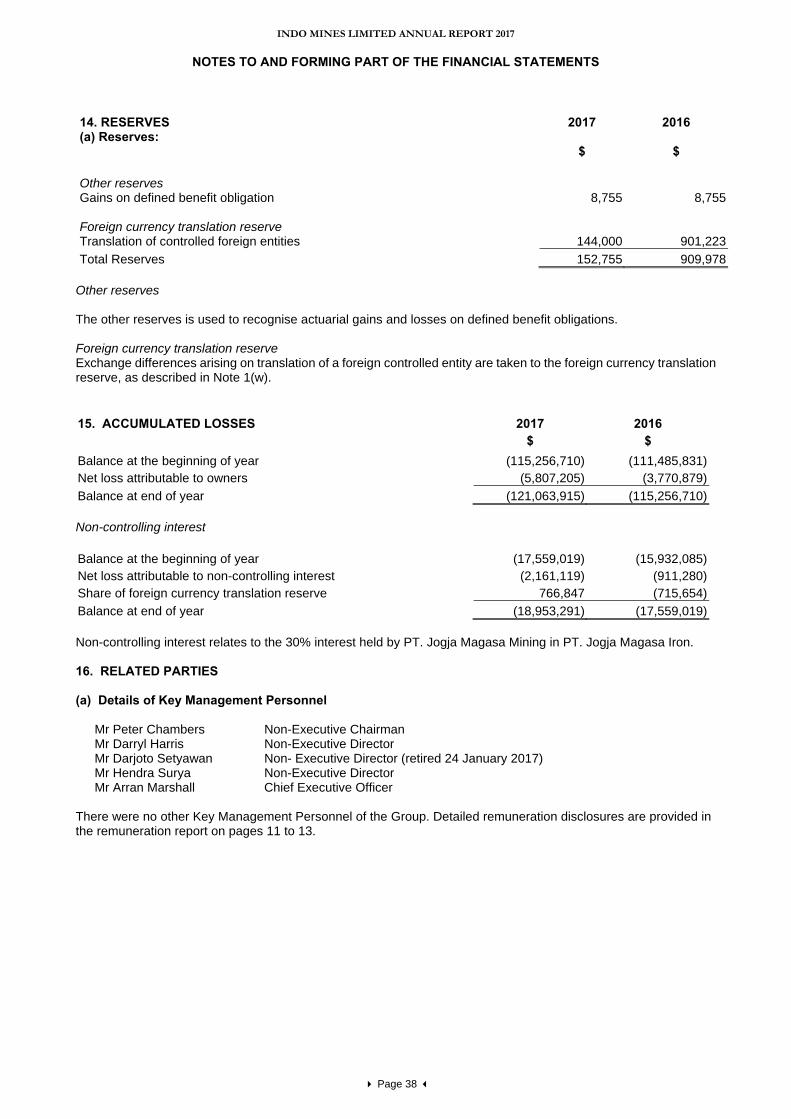
INDO MINES LIMITED ANNUAL REPORT 2017
NOTES TO AND FORMING PART OF THE FINANCIAL STATEMENTS
Page 38
14. RESERVES (a) Reserves:
2017 2016
$ $ Other reserves Gains on defined benefit obligation 8,755 8,755 Foreign currency translation reserve Translation of controlled foreign entities 144,000 901,223Total Reserves 152,755 909,978
Other reserves The other reserves is used to recognise actuarial gains and losses on defined benefit obligations. Foreign currency translation reserve Exchange differences arising on translation of a foreign controlled entity are taken to the foreign currency translation reserve, as described in Note 1(w). 15. ACCUMULATED LOSSES 2017 2016 $ $ Balance at the beginning of year (115,256,710) (111,485,831)Net loss attributable to owners (5,807,205) (3,770,879)Balance at end of year (121,063,915) (115,256,710) Non-controlling interest Balance at the beginning of year (17,559,019) (15,932,085)Net loss attributable to non-controlling interest (2,161,119) (911,280)Share of foreign currency translation reserve 766,847 (715,654)Balance at end of year (18,953,291) (17,559,019) Non-controlling interest relates to the 30% interest held by PT. Jogja Magasa Mining in PT. Jogja Magasa Iron. 16. RELATED PARTIES (a) Details of Key Management Personnel
Mr Peter Chambers Non-Executive Chairman Mr Darryl Harris Non-Executive Director Mr Darjoto Setyawan Non- Executive Director (retired 24 January 2017) Mr Hendra Surya Non-Executive Director Mr Arran Marshall Chief Executive Officer
There were no other Key Management Personnel of the Group. Detailed remuneration disclosures are provided in the remuneration report on pages 11 to 13.
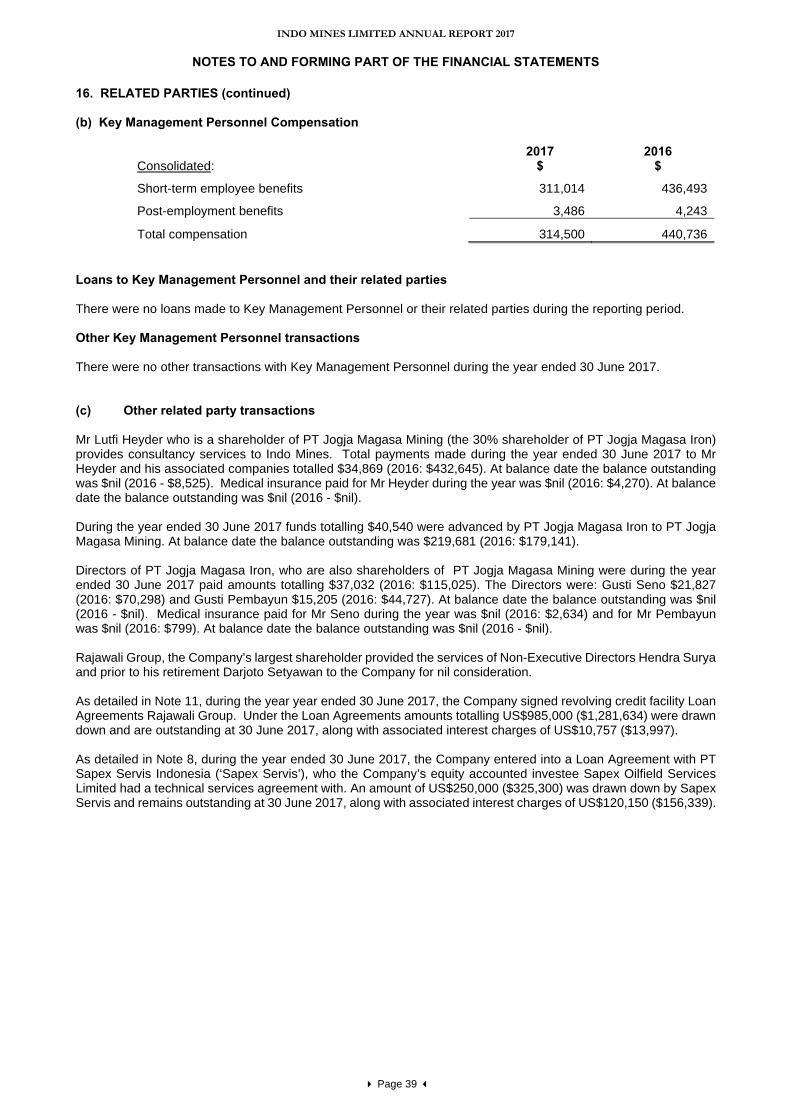
INDO MINES LIMITED ANNUAL REPORT 2017
NOTES TO AND FORMING PART OF THE FINANCIAL STATEMENTS
Page 39
16. RELATED PARTIES (continued) (b) Key Management Personnel Compensation
Consolidated: 2017
$ 2016
$
Short-term employee benefits 311,014 436,493
Post-employment benefits 3,486 4,243
Total compensation 314,500 440,736 Loans to Key Management Personnel and their related parties There were no loans made to Key Management Personnel or their related parties during the reporting period. Other Key Management Personnel transactions There were no other transactions with Key Management Personnel during the year ended 30 June 2017. (c) Other related party transactions
Mr Lutfi Heyder who is a shareholder of PT Jogja Magasa Mining (the 30% shareholder of PT Jogja Magasa Iron) provides consultancy services to Indo Mines. Total payments made during the year ended 30 June 2017 to Mr Heyder and his associated companies totalled $34,869 (2016: $432,645). At balance date the balance outstanding was $nil (2016 - $8,525). Medical insurance paid for Mr Heyder during the year was $nil (2016: $4,270). At balance date the balance outstanding was $nil (2016 - $nil). During the year ended 30 June 2017 funds totalling $40,540 were advanced by PT Jogja Magasa Iron to PT Jogja Magasa Mining. At balance date the balance outstanding was $219,681 (2016: $179,141). Directors of PT Jogja Magasa Iron, who are also shareholders of PT Jogja Magasa Mining were during the year ended 30 June 2017 paid amounts totalling $37,032 (2016: $115,025). The Directors were: Gusti Seno $21,827 (2016: $70,298) and Gusti Pembayun $15,205 (2016: $44,727). At balance date the balance outstanding was $nil (2016 - $nil). Medical insurance paid for Mr Seno during the year was $nil (2016: $2,634) and for Mr Pembayun was $nil (2016: $799). At balance date the balance outstanding was $nil (2016 - $nil). Rajawali Group, the Company’s largest shareholder provided the services of Non-Executive Directors Hendra Surya and prior to his retirement Darjoto Setyawan to the Company for nil consideration. As detailed in Note 11, during the year year ended 30 June 2017, the Company signed revolving credit facility Loan Agreements Rajawali Group. Under the Loan Agreements amounts totalling US$985,000 ($1,281,634) were drawn down and are outstanding at 30 June 2017, along with associated interest charges of US$10,757 ($13,997). As detailed in Note 8, during the year ended 30 June 2017, the Company entered into a Loan Agreement with PT Sapex Servis Indonesia (‘Sapex Servis’), who the Company’s equity accounted investee Sapex Oilfield Services Limited had a technical services agreement with. An amount of US$250,000 ($325,300) was drawn down by Sapex Servis and remains outstanding at 30 June 2017, along with associated interest charges of US$120,150 ($156,339).
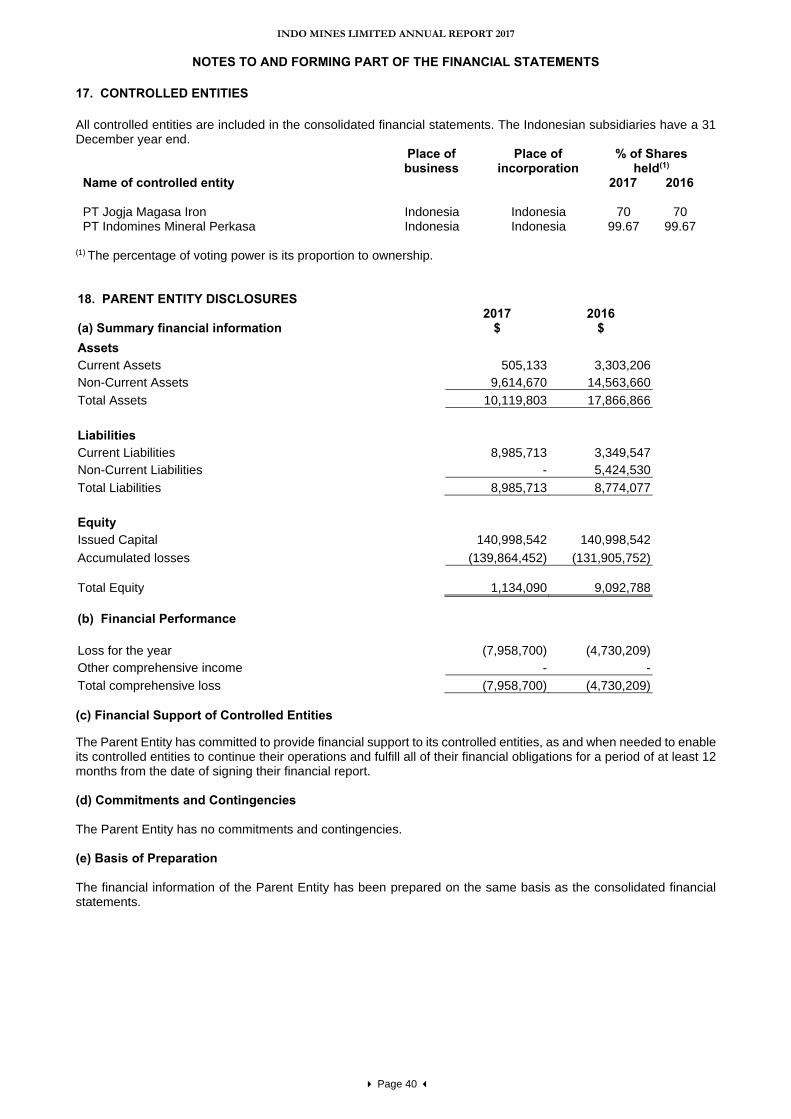
INDO MINES LIMITED ANNUAL REPORT 2017
NOTES TO AND FORMING PART OF THE FINANCIAL STATEMENTS
Page 40
17. CONTROLLED ENTITIES All controlled entities are included in the consolidated financial statements. The Indonesian subsidiaries have a 31 December year end.
Place of business
Place of incorporation
% of Shares held(1)
Name of controlled entity 2017 2016 PT Jogja Magasa Iron Indonesia Indonesia 70 70 PT Indomines Mineral Perkasa Indonesia Indonesia 99.67 99.67
(1) The percentage of voting power is its proportion to ownership.
18. PARENT ENTITY DISCLOSURES
2017
2016 (a) Summary financial information $ $ Assets Current Assets 505,133 3,303,206 Non-Current Assets 9,614,670 14,563,660 Total Assets 10,119,803 17,866,866 Liabilities Current Liabilities 8,985,713 3,349,547 Non-Current Liabilities - 5,424,530 Total Liabilities 8,985,713 8,774,077 Equity Issued Capital 140,998,542 140,998,542 Accumulated losses (139,864,452) (131,905,752) Total Equity 1,134,090 9,092,788 (b) Financial Performance Loss for the year (7,958,700) (4,730,209) Other comprehensive income - - Total comprehensive loss (7,958,700) (4,730,209) (c) Financial Support of Controlled Entities
The Parent Entity has committed to provide financial support to its controlled entities, as and when needed to enable its controlled entities to continue their operations and fulfill all of their financial obligations for a period of at least 12 months from the date of signing their financial report. (d) Commitments and Contingencies The Parent Entity has no commitments and contingencies. (e) Basis of Preparation The financial information of the Parent Entity has been prepared on the same basis as the consolidated financial statements.
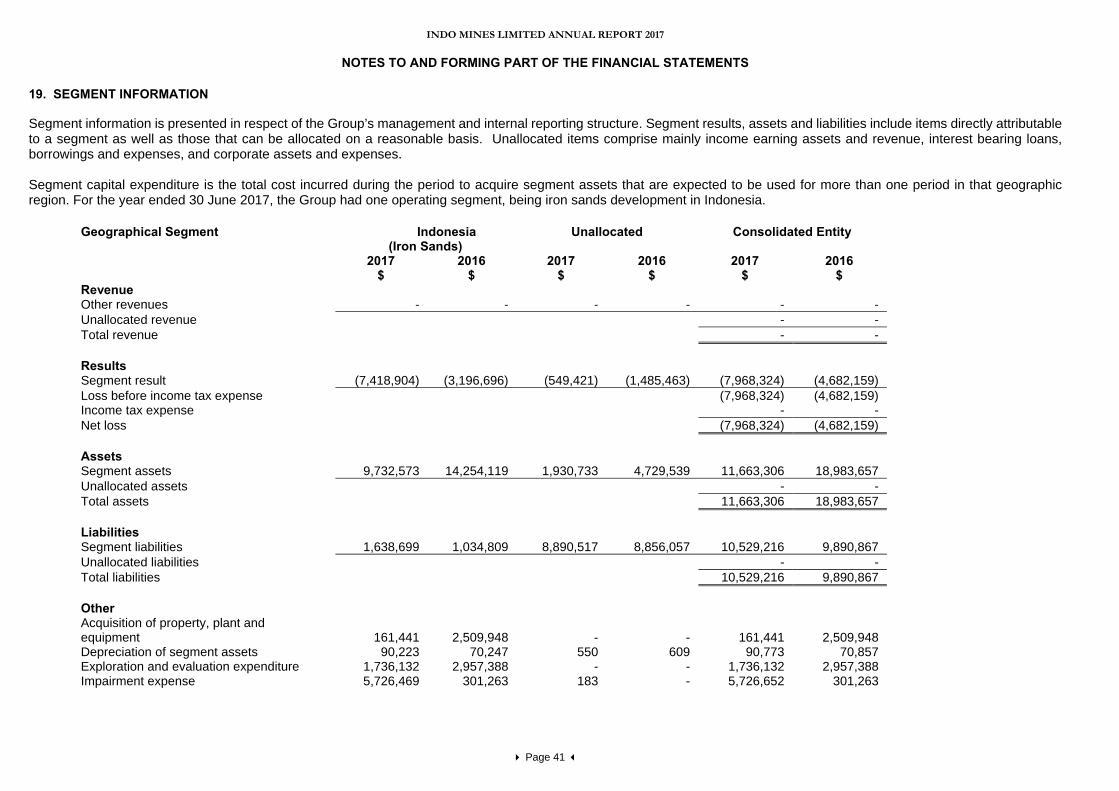
INDO MINES LIMITED ANNUAL REPORT 2017
NOTES TO AND FORMING PART OF THE FINANCIAL STATEMENTS
Page 41
19. SEGMENT INFORMATION Segment information is presented in respect of the Group’s management and internal reporting structure. Segment results, assets and liabilities include items directly attributable to a segment as well as those that can be allocated on a reasonable basis. Unallocated items comprise mainly income earning assets and revenue, interest bearing loans, borrowings and expenses, and corporate assets and expenses. Segment capital expenditure is the total cost incurred during the period to acquire segment assets that are expected to be used for more than one period in that geographic region. For the year ended 30 June 2017, the Group had one operating segment, being iron sands development in Indonesia.
Geographical Segment Indonesia (Iron Sands)
Unallocated Consolidated Entity
2017 2016 2017 2016 2017 2016 $ $ $ $ $ $ Revenue Other revenues - - - - - - Unallocated revenue - - Total revenue - - Results Segment result (7,418,904) (3,196,696) (549,421) (1,485,463) (7,968,324) (4,682,159) Loss before income tax expense (7,968,324) (4,682,159) Income tax expense - - Net loss (7,968,324) (4,682,159) Assets Segment assets 9,732,573 14,254,119 1,930,733 4,729,539 11,663,306 18,983,657 Unallocated assets - - Total assets 11,663,306 18,983,657 Liabilities Segment liabilities 1,638,699 1,034,809 8,890,517 8,856,057 10,529,216 9,890,867 Unallocated liabilities - - Total liabilities 10,529,216 9,890,867 Other Acquisition of property, plant and equipment 161,441 2,509,948 - - 161,441 2,509,948 Depreciation of segment assets 90,223 70,247 550 609 90,773 70,857 Exploration and evaluation expenditure 1,736,132 2,957,388 - - 1,736,132 2,957,388 Impairment expense 5,726,469 301,263 183 - 5,726,652 301,263
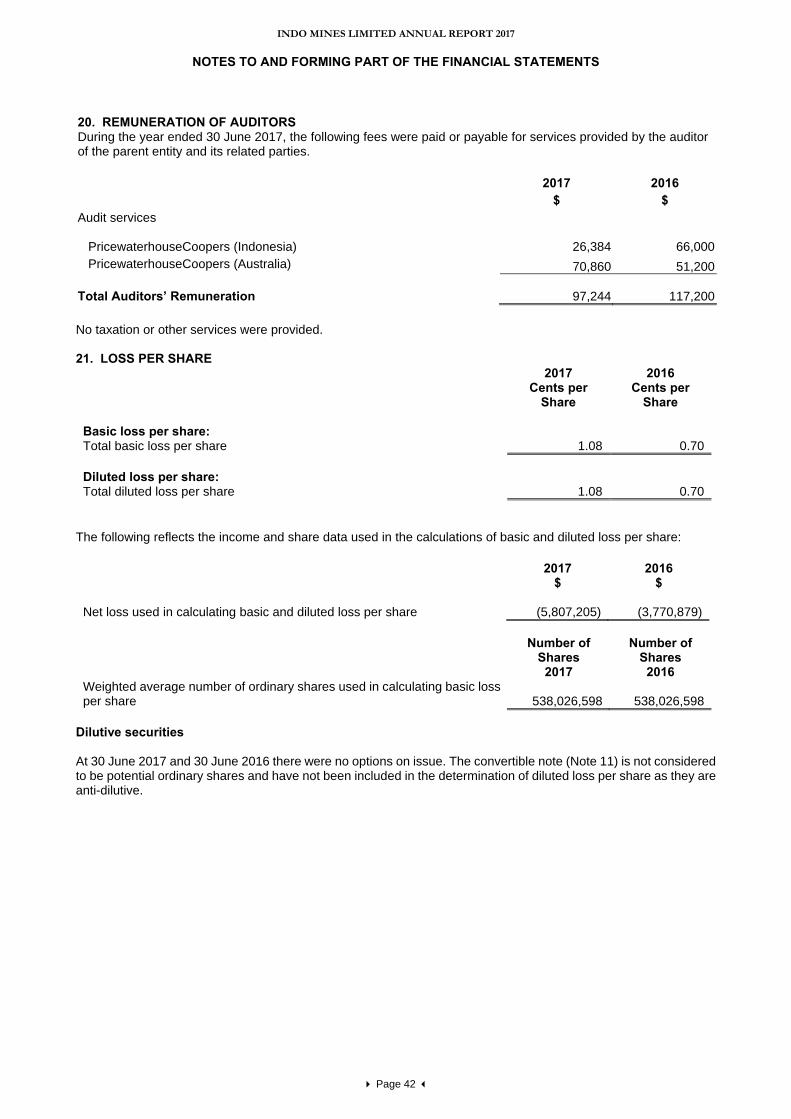
INDO MINES LIMITED ANNUAL REPORT 2017
NOTES TO AND FORMING PART OF THE FINANCIAL STATEMENTS
Page 42
20. REMUNERATION OF AUDITORS
During the year ended 30 June 2017, the following fees were paid or payable for services provided by the auditor of the parent entity and its related parties.
2017 2016
$ $ Audit services
PricewaterhouseCoopers (Indonesia) 26,384 66,000 PricewaterhouseCoopers (Australia) 70,860 51,200 Total Auditors’ Remuneration 97,244 117,200 No taxation or other services were provided. 21. LOSS PER SHARE
2017 Cents per
Share
2016 Cents per
Share Basic loss per share: Total basic loss per share 1.08 0.70 Diluted loss per share: Total diluted loss per share 1.08 0.70
The following reflects the income and share data used in the calculations of basic and diluted loss per share:
2017 2016 $ $ Net loss used in calculating basic and diluted loss per share
(5,807,205)
(3,770,879)
Number of Number of Shares Shares 2017 2016
Weighted average number of ordinary shares used in calculating basic loss per share
538,026,598
538,026,598
Dilutive securities At 30 June 2017 and 30 June 2016 there were no options on issue. The convertible note (Note 11) is not considered to be potential ordinary shares and have not been included in the determination of diluted loss per share as they are anti-dilutive.
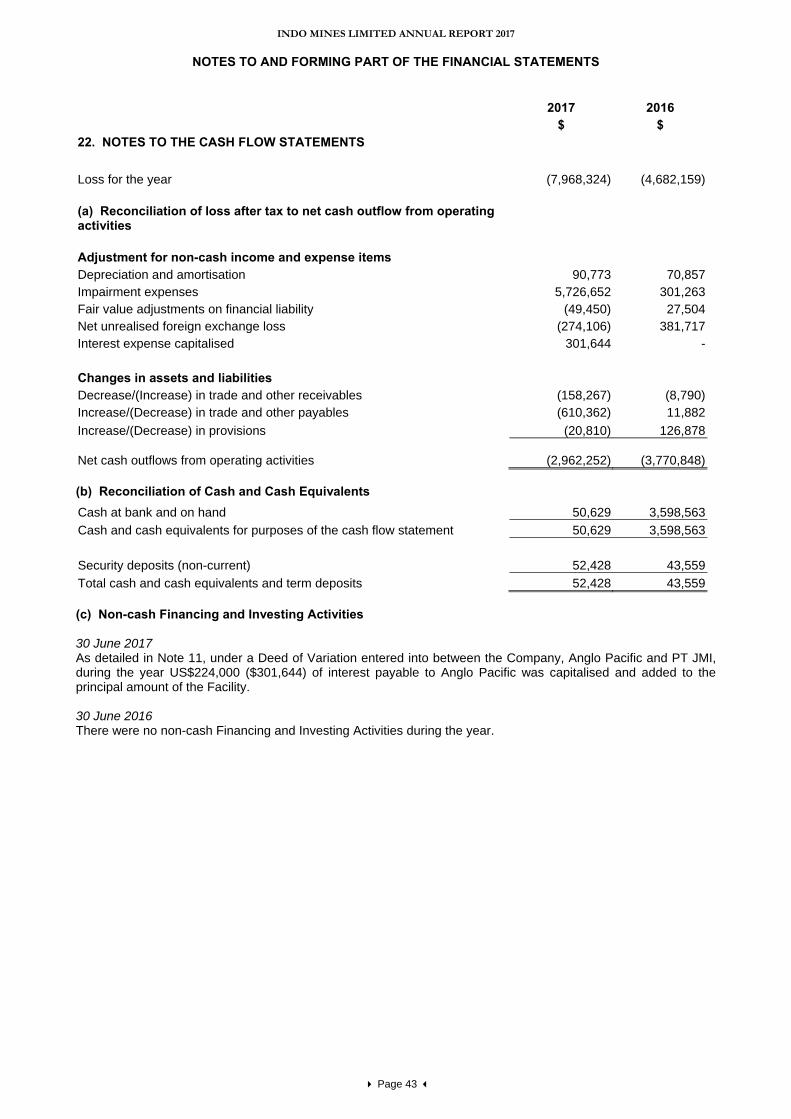
INDO MINES LIMITED ANNUAL REPORT 2017
NOTES TO AND FORMING PART OF THE FINANCIAL STATEMENTS
Page 43
2017 2016
$ $ 22. NOTES TO THE CASH FLOW STATEMENTS
Loss for the year (7,968,324) (4,682,159) (a) Reconciliation of loss after tax to net cash outflow from operating activities Adjustment for non-cash income and expense items Depreciation and amortisation 90,773 70,857Impairment expenses 5,726,652 301,263Fair value adjustments on financial liability (49,450) 27,504Net unrealised foreign exchange loss (274,106) 381,717Interest expense capitalised 301,644 - Changes in assets and liabilities Decrease/(Increase) in trade and other receivables (158,267) (8,790)Increase/(Decrease) in trade and other payables (610,362) 11,882Increase/(Decrease) in provisions (20,810) 126,878 Net cash outflows from operating activities (2,962,252) (3,770,848) (b) Reconciliation of Cash and Cash Equivalents Cash at bank and on hand 50,629 3,598,563Cash and cash equivalents for purposes of the cash flow statement 50,629 3,598,563 Security deposits (non-current) 52,428 43,559Total cash and cash equivalents and term deposits 52,428 43,559 (c) Non-cash Financing and Investing Activities 30 June 2017 As detailed in Note 11, under a Deed of Variation entered into between the Company, Anglo Pacific and PT JMI, during the year US$224,000 ($301,644) of interest payable to Anglo Pacific was capitalised and added to the principal amount of the Facility. 30 June 2016 There were no non-cash Financing and Investing Activities during the year.
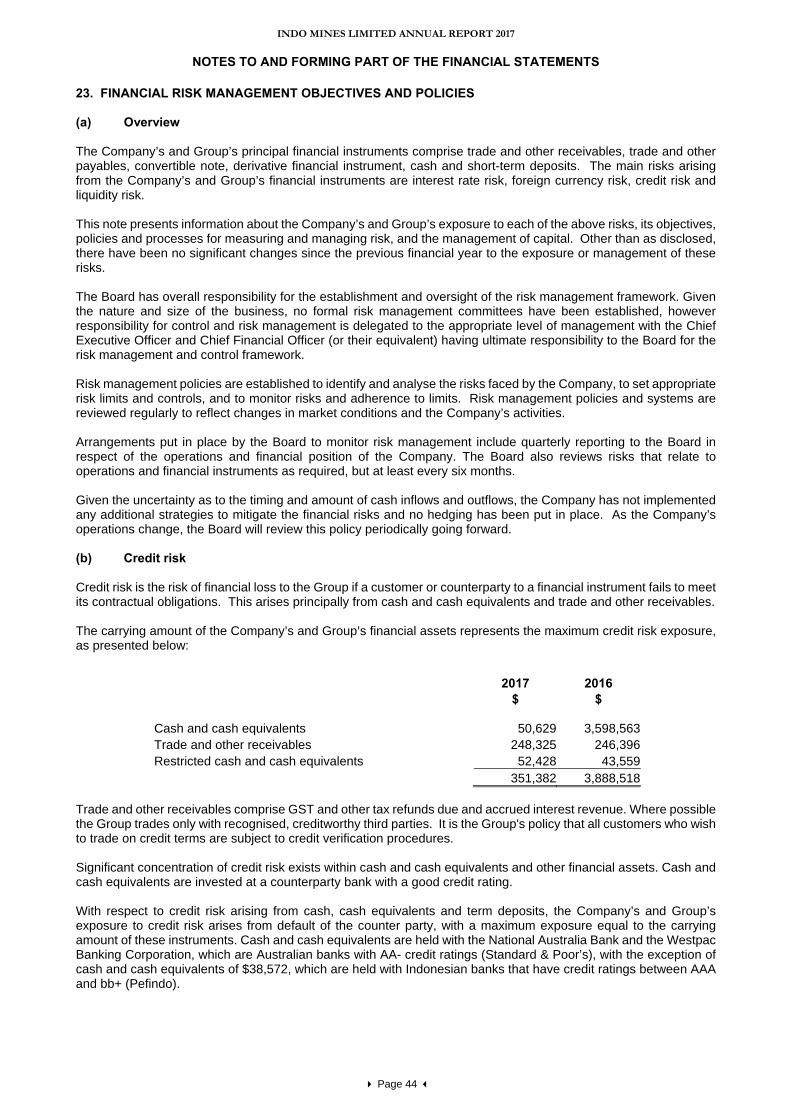
INDO MINES LIMITED ANNUAL REPORT 2017
NOTES TO AND FORMING PART OF THE FINANCIAL STATEMENTS
Page 44
23. FINANCIAL RISK MANAGEMENT OBJECTIVES AND POLICIES (a) Overview The Company’s and Group’s principal financial instruments comprise trade and other receivables, trade and other payables, convertible note, derivative financial instrument, cash and short-term deposits. The main risks arising from the Company’s and Group’s financial instruments are interest rate risk, foreign currency risk, credit risk and liquidity risk. This note presents information about the Company’s and Group’s exposure to each of the above risks, its objectives, policies and processes for measuring and managing risk, and the management of capital. Other than as disclosed, there have been no significant changes since the previous financial year to the exposure or management of these risks. The Board has overall responsibility for the establishment and oversight of the risk management framework. Given the nature and size of the business, no formal risk management committees have been established, however responsibility for control and risk management is delegated to the appropriate level of management with the Chief Executive Officer and Chief Financial Officer (or their equivalent) having ultimate responsibility to the Board for the risk management and control framework. Risk management policies are established to identify and analyse the risks faced by the Company, to set appropriate risk limits and controls, and to monitor risks and adherence to limits. Risk management policies and systems are reviewed regularly to reflect changes in market conditions and the Company’s activities. Arrangements put in place by the Board to monitor risk management include quarterly reporting to the Board in respect of the operations and financial position of the Company. The Board also reviews risks that relate to operations and financial instruments as required, but at least every six months. Given the uncertainty as to the timing and amount of cash inflows and outflows, the Company has not implemented any additional strategies to mitigate the financial risks and no hedging has been put in place. As the Company’s operations change, the Board will review this policy periodically going forward. (b) Credit risk Credit risk is the risk of financial loss to the Group if a customer or counterparty to a financial instrument fails to meet its contractual obligations. This arises principally from cash and cash equivalents and trade and other receivables. The carrying amount of the Company’s and Group’s financial assets represents the maximum credit risk exposure, as presented below:
2017 2016 $ $ Cash and cash equivalents 50,629 3,598,563 Trade and other receivables 248,325 246,396 Restricted cash and cash equivalents 52,428 43,559 351,382 3,888,518
Trade and other receivables comprise GST and other tax refunds due and accrued interest revenue. Where possible the Group trades only with recognised, creditworthy third parties. It is the Group's policy that all customers who wish to trade on credit terms are subject to credit verification procedures. Significant concentration of credit risk exists within cash and cash equivalents and other financial assets. Cash and cash equivalents are invested at a counterparty bank with a good credit rating. With respect to credit risk arising from cash, cash equivalents and term deposits, the Company’s and Group’s exposure to credit risk arises from default of the counter party, with a maximum exposure equal to the carrying amount of these instruments. Cash and cash equivalents are held with the National Australia Bank and the Westpac Banking Corporation, which are Australian banks with AA- credit ratings (Standard & Poor’s), with the exception of cash and cash equivalents of $38,572, which are held with Indonesian banks that have credit ratings between AAA and bb+ (Pefindo).
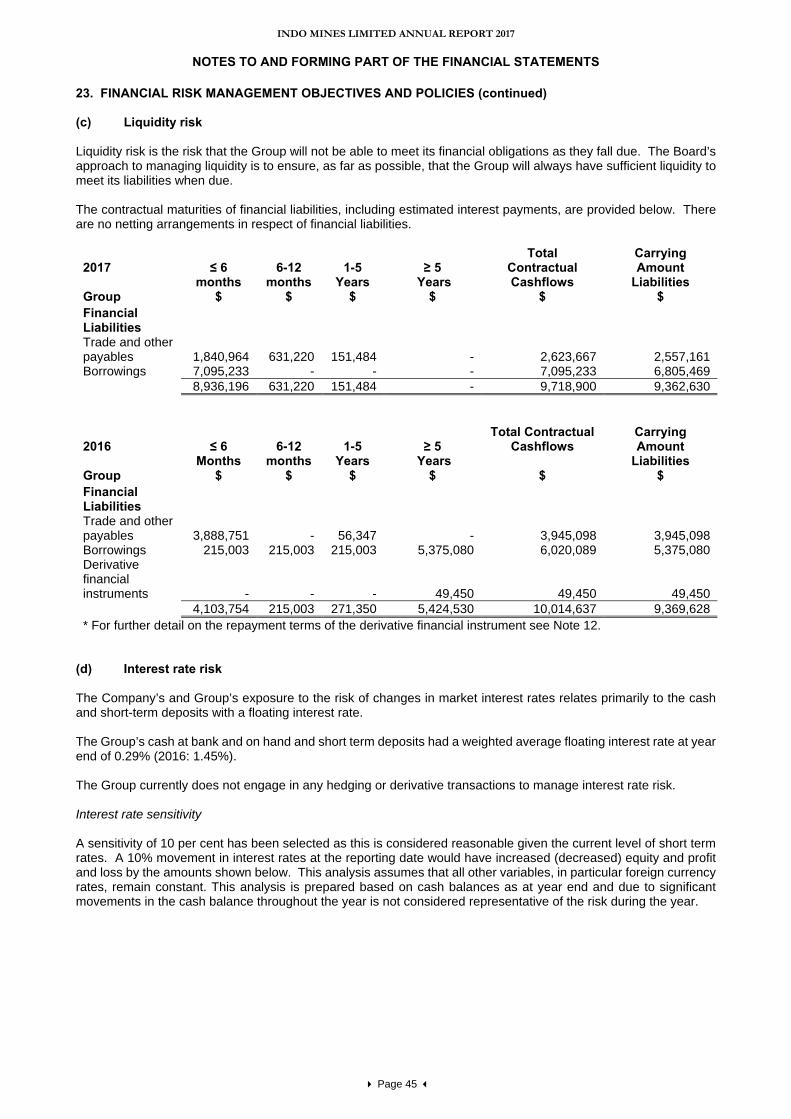
INDO MINES LIMITED ANNUAL REPORT 2017
NOTES TO AND FORMING PART OF THE FINANCIAL STATEMENTS
Page 45
23. FINANCIAL RISK MANAGEMENT OBJECTIVES AND POLICIES (continued) (c) Liquidity risk Liquidity risk is the risk that the Group will not be able to meet its financial obligations as they fall due. The Board’s approach to managing liquidity is to ensure, as far as possible, that the Group will always have sufficient liquidity to meet its liabilities when due. The contractual maturities of financial liabilities, including estimated interest payments, are provided below. There are no netting arrangements in respect of financial liabilities.
2017
≤ 6
months
6-12
months
1-5
Years
≥ 5
Years
Total Contractual Cashflows
Carrying Amount
Liabilities Group $ $ $ $ $ $ Financial Liabilities Trade and other payables 1,840,964 631,220 151,484 - 2,623,667 2,557,161 Borrowings 7,095,233 - - - 7,095,233 6,805,469 8,936,196 631,220 151,484 - 9,718,900 9,362,630 2016
≤ 6 Months
6-12 months
1-5 Years
≥ 5 Years
Total Contractual
Cashflows
Carrying Amount
Liabilities Group $ $ $ $ $ $ Financial Liabilities Trade and other payables 3,888,751 - 56,347 - 3,945,098 3,945,098 Borrowings 215,003 215,003 215,003 5,375,080 6,020,089 5,375,080 Derivative financial instruments - - - 49,450 49,450 49,450 4,103,754 215,003 271,350 5,424,530 10,014,637 9,369,628 * For further detail on the repayment terms of the derivative financial instrument see Note 12.
(d) Interest rate risk The Company’s and Group’s exposure to the risk of changes in market interest rates relates primarily to the cash and short-term deposits with a floating interest rate. The Group’s cash at bank and on hand and short term deposits had a weighted average floating interest rate at year end of 0.29% (2016: 1.45%). The Group currently does not engage in any hedging or derivative transactions to manage interest rate risk. Interest rate sensitivity A sensitivity of 10 per cent has been selected as this is considered reasonable given the current level of short term rates. A 10% movement in interest rates at the reporting date would have increased (decreased) equity and profit and loss by the amounts shown below. This analysis assumes that all other variables, in particular foreign currency rates, remain constant. This analysis is prepared based on cash balances as at year end and due to significant movements in the cash balance throughout the year is not considered representative of the risk during the year.
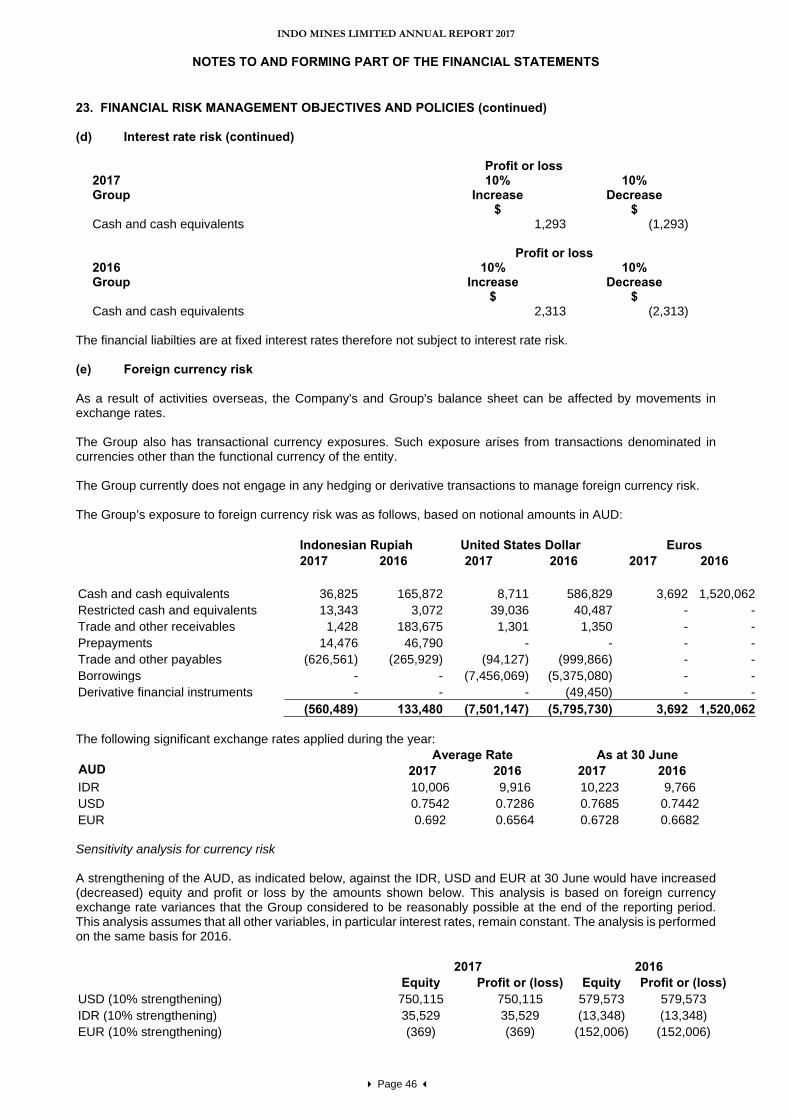
INDO MINES LIMITED ANNUAL REPORT 2017
NOTES TO AND FORMING PART OF THE FINANCIAL STATEMENTS
Page 46
23. FINANCIAL RISK MANAGEMENT OBJECTIVES AND POLICIES (continued) (d) Interest rate risk (continued)
Profit or loss 2017 Group
10% Increase
$
10% Decrease
$ Cash and cash equivalents 1,293 (1,293)
Profit or loss
2016 Group
10% Increase
$
10% Decrease
$ Cash and cash equivalents 2,313 (2,313)
The financial liabilties are at fixed interest rates therefore not subject to interest rate risk. (e) Foreign currency risk As a result of activities overseas, the Company's and Group's balance sheet can be affected by movements in exchange rates. The Group also has transactional currency exposures. Such exposure arises from transactions denominated in currencies other than the functional currency of the entity. The Group currently does not engage in any hedging or derivative transactions to manage foreign currency risk. The Group’s exposure to foreign currency risk was as follows, based on notional amounts in AUD: Indonesian Rupiah United States Dollar Euros 2017 2016 2017 2016 2017 2016 Cash and cash equivalents 36,825 165,872 8,711 586,829 3,692 1,520,062Restricted cash and equivalents 13,343 3,072 39,036 40,487 - -Trade and other receivables 1,428 183,675 1,301 1,350 - -Prepayments 14,476 46,790 - - - -Trade and other payables (626,561) (265,929) (94,127) (999,866) - -Borrowings - - (7,456,069) (5,375,080) - -Derivative financial instruments - - - (49,450) - - (560,489) 133,480 (7,501,147) (5,795,730) 3,692 1,520,062 The following significant exchange rates applied during the year: Average Rate As at 30 June AUD 2017 2016 2017 2016 IDR 10,006 9,916 10,223 9,766 USD 0.7542 0.7286 0.7685 0.7442 EUR 0.692 0.6564 0.6728 0.6682 Sensitivity analysis for currency risk A strengthening of the AUD, as indicated below, against the IDR, USD and EUR at 30 June would have increased (decreased) equity and profit or loss by the amounts shown below. This analysis is based on foreign currency exchange rate variances that the Group considered to be reasonably possible at the end of the reporting period. This analysis assumes that all other variables, in particular interest rates, remain constant. The analysis is performed on the same basis for 2016. 2017 2016 Equity Profit or (loss) Equity Profit or (loss)USD (10% strengthening) 750,115 750,115 579,573 579,573 IDR (10% strengthening) 35,529 35,529 (13,348) (13,348) EUR (10% strengthening) (369) (369) (152,006) (152,006)
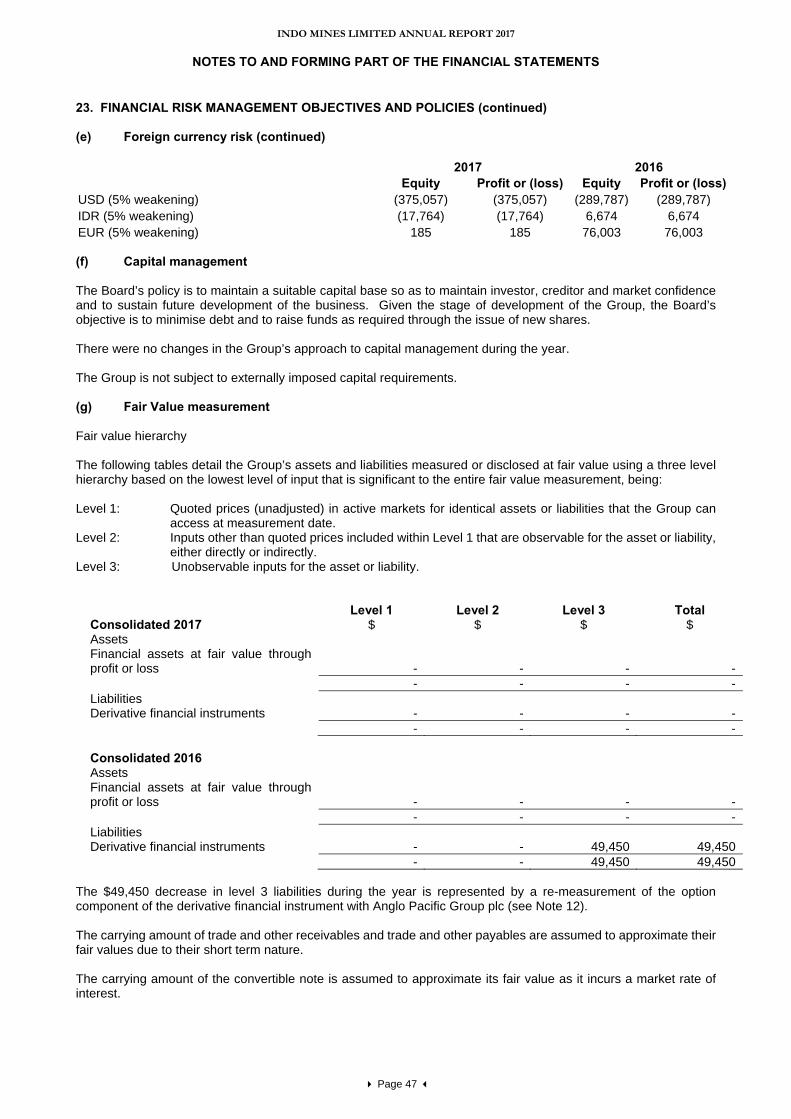
INDO MINES LIMITED ANNUAL REPORT 2017
NOTES TO AND FORMING PART OF THE FINANCIAL STATEMENTS
Page 47
23. FINANCIAL RISK MANAGEMENT OBJECTIVES AND POLICIES (continued) (e) Foreign currency risk (continued) 2017 2016 Equity Profit or (loss) Equity Profit or (loss)USD (5% weakening) (375,057) (375,057) (289,787) (289,787) IDR (5% weakening) (17,764) (17,764) 6,674 6,674 EUR (5% weakening) 185 185 76,003 76,003 (f) Capital management The Board’s policy is to maintain a suitable capital base so as to maintain investor, creditor and market confidence and to sustain future development of the business. Given the stage of development of the Group, the Board’s objective is to minimise debt and to raise funds as required through the issue of new shares. There were no changes in the Group’s approach to capital management during the year. The Group is not subject to externally imposed capital requirements. (g) Fair Value measurement Fair value hierarchy The following tables detail the Group’s assets and liabilities measured or disclosed at fair value using a three level hierarchy based on the lowest level of input that is significant to the entire fair value measurement, being: Level 1: Quoted prices (unadjusted) in active markets for identical assets or liabilities that the Group can
access at measurement date. Level 2: Inputs other than quoted prices included within Level 1 that are observable for the asset or liability,
either directly or indirectly. Level 3: Unobservable inputs for the asset or liability.
Level 1 Level 2 Level 3 Total Consolidated 2017 $ $ $ $ Assets Financial assets at fair value through profit or loss
-
-
-
-
- - - - Liabilities Derivative financial instruments - - - - - - - -
Consolidated 2016 Assets Financial assets at fair value through profit or loss
-
-
-
-
- - - - Liabilities Derivative financial instruments - - 49,450 49,450 - - 49,450 49,450
The $49,450 decrease in level 3 liabilities during the year is represented by a re-measurement of the option component of the derivative financial instrument with Anglo Pacific Group plc (see Note 12). The carrying amount of trade and other receivables and trade and other payables are assumed to approximate their fair values due to their short term nature. The carrying amount of the convertible note is assumed to approximate its fair value as it incurs a market rate of interest.
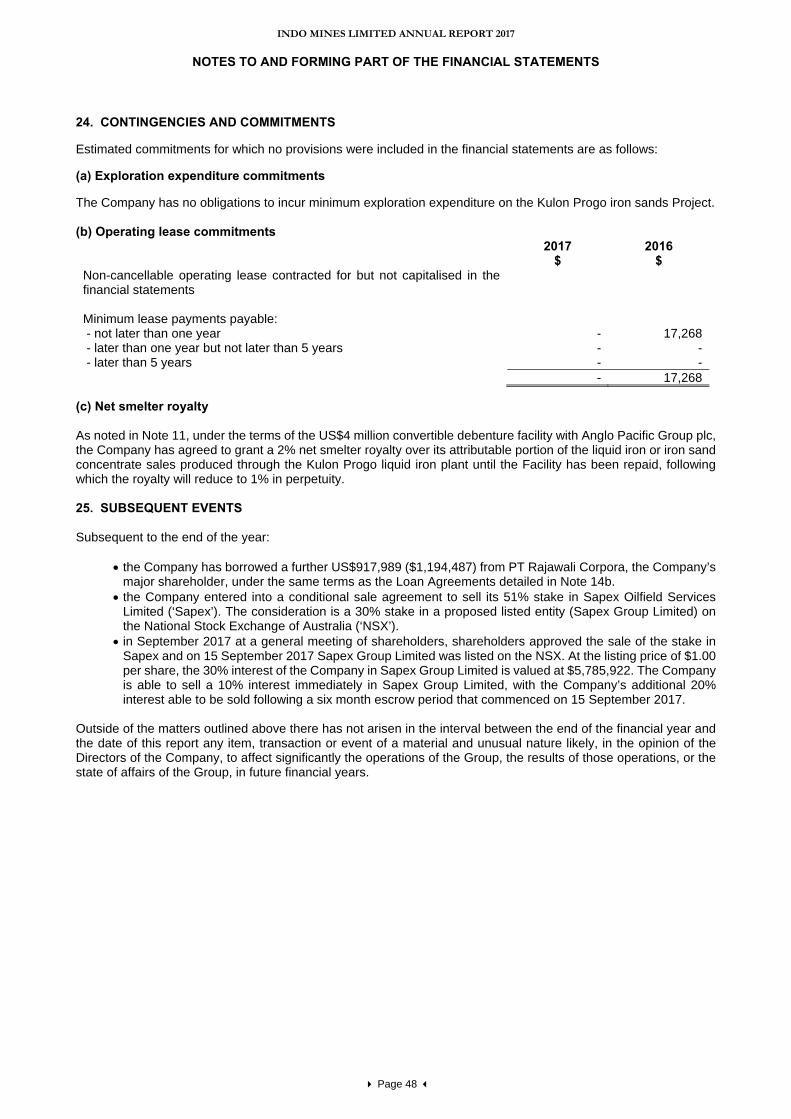
INDO MINES LIMITED ANNUAL REPORT 2017
NOTES TO AND FORMING PART OF THE FINANCIAL STATEMENTS
Page 48
24. CONTINGENCIES AND COMMITMENTS Estimated commitments for which no provisions were included in the financial statements are as follows:
(a) Exploration expenditure commitments
The Company has no obligations to incur minimum exploration expenditure on the Kulon Progo iron sands Project. (b) Operating lease commitments
2017 2016 $ $ Non-cancellable operating lease contracted for but not capitalised in the financial statements
Minimum lease payments payable: - not later than one year - 17,268 - later than one year but not later than 5 years - - - later than 5 years - - - 17,268
(c) Net smelter royalty As noted in Note 11, under the terms of the US$4 million convertible debenture facility with Anglo Pacific Group plc, the Company has agreed to grant a 2% net smelter royalty over its attributable portion of the liquid iron or iron sand concentrate sales produced through the Kulon Progo liquid iron plant until the Facility has been repaid, following which the royalty will reduce to 1% in perpetuity. 25. SUBSEQUENT EVENTS Subsequent to the end of the year:
• the Company has borrowed a further US$917,989 ($1,194,487) from PT Rajawali Corpora, the Company’s major shareholder, under the same terms as the Loan Agreements detailed in Note 14b.
• the Company entered into a conditional sale agreement to sell its 51% stake in Sapex Oilfield Services Limited (‘Sapex’). The consideration is a 30% stake in a proposed listed entity (Sapex Group Limited) on the National Stock Exchange of Australia (‘NSX’).
• in September 2017 at a general meeting of shareholders, shareholders approved the sale of the stake in Sapex and on 15 September 2017 Sapex Group Limited was listed on the NSX. At the listing price of $1.00 per share, the 30% interest of the Company in Sapex Group Limited is valued at $5,785,922. The Company is able to sell a 10% interest immediately in Sapex Group Limited, with the Company’s additional 20% interest able to be sold following a six month escrow period that commenced on 15 September 2017.
Outside of the matters outlined above there has not arisen in the interval between the end of the financial year and the date of this report any item, transaction or event of a material and unusual nature likely, in the opinion of the Directors of the Company, to affect significantly the operations of the Group, the results of those operations, or the state of affairs of the Group, in future financial years.
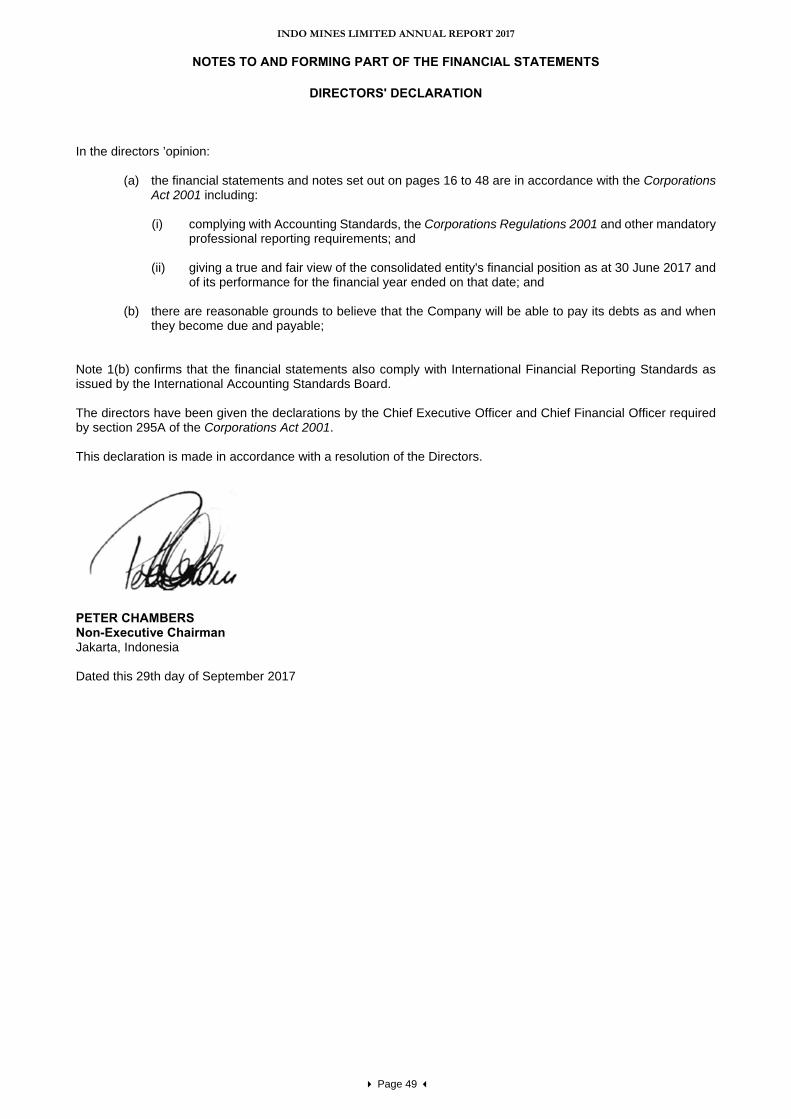
INDO MINES LIMITED ANNUAL REPORT 2017
NOTES TO AND FORMING PART OF THE FINANCIAL STATEMENTS
Page 49
DIRECTORS' DECLARATION In the directors ’opinion:
(a) the financial statements and notes set out on pages 16 to 48 are in accordance with the Corporations Act 2001 including:
(i) complying with Accounting Standards, the Corporations Regulations 2001 and other mandatory
professional reporting requirements; and (ii) giving a true and fair view of the consolidated entity's financial position as at 30 June 2017 and
of its performance for the financial year ended on that date; and
(b) there are reasonable grounds to believe that the Company will be able to pay its debts as and when they become due and payable;
Note 1(b) confirms that the financial statements also comply with International Financial Reporting Standards as issued by the International Accounting Standards Board. The directors have been given the declarations by the Chief Executive Officer and Chief Financial Officer required by section 295A of the Corporations Act 2001. This declaration is made in accordance with a resolution of the Directors.
PETER CHAMBERS Non-Executive Chairman Jakarta, Indonesia Dated this 29th day of September 2017
Independent auditor’s report To the members of Indo Mines Limited
Report on the audit of the financial report
Our opinion In our opinion:
The accompanying financial report of Indo Mines Limited (the Company) and its controlled entities (together the Group) is in accordance with the Corporations Act 2001, including:
(a) giving a true and fair view of the Group's financial position as at 30 June 2017 and of its financial performance for the year then ended
(b) complying with Australian Accounting Standards and the Corporations Regulations 2001.
What we have audited The Group financial report comprises:
• the consolidated statement of financial position as at 30 June 2017
• the consolidated statement of profit or loss and other comprehensive income for the year then ended
• the consolidated statement of changes in equity for the year then ended
• the consolidated statement of cash flows for the year then ended
• the notes to and forming part of the financial statements, which include a summary of significant accounting policies
• the directors’ declaration.
Basis for opinion We conducted our audit in accordance with Australian Auditing Standards. Our responsibilities under those standards are further described in the Auditor’s responsibilities for the audit of the financial report section of our report.
We believe that the audit evidence we have obtained is sufficient and appropriate to provide a basis for our opinion.
Independence We are independent of the Group in accordance with the auditor independence requirements of the Corporations Act 2001 and the ethical requirements of the Accounting Professional and Ethical Standards Board’s APES 110 Code of Ethics for Professional Accountants (the Code) that are relevant to our audit of the financial report in Australia. We have also fulfilled our other ethical responsibilities in accordance with the Code.
PricewaterhouseCoopers, ABN 52 780 433 757 Brookfield Place, 125 St Georges Terrace, PERTH WA 6000, GPO Box D198, PERTH WA 6840 T: +61 8 9238 3000, F: +61 8 9238 3999, www.pwc.com.au Liability limited by a scheme approved under Professional Standards Legislation.
Material uncertainty related to going concern We draw attention to note 1(a) in the financial report which indicates that the Group incurred a loss for the year of $7,968,324 and had total liabilities of $10,529,216, including short term liabilities of $10,030,589 as at 30 June 2017. The Group has received financial support from its major shareholder for a minimum period of the next 12 months. To establish its long term viability, the Group needs to find a strategic partner to support the development of the Kulon Progo iron sands project, or it will need to raise additional capital. These conditions, along with the other matters set forth in Note 1(a), indicate that a material uncertainty exists that may cast significant doubt on the Group’s ability to continue as a going concern. Our opinion is not modified in respect of this matter.
Our audit approach An audit is designed to provide reasonable assurance about whether the financial report is free from material misstatement. Misstatements may arise due to fraud or error. They are considered material if individually or in aggregate, they could reasonably be expected to influence the economic decisions of users taken on the basis of the financial report.
We tailored the scope of our audit to ensure that we performed enough work to be able to give an opinion on the financial report as a whole, taking into account the geographic and management structure of the Group, its accounting processes and controls and the industry in which it operates.
The Group is a mineral resources organisation whose operations include mineral exploration and development activities in Indonesia.
Materiality
• For the purpose of our audit we used overall Group materiality of $166,000, which represents approximately 1% of the Group’s total assets.
• We applied this threshold, together with qualitative considerations, to determine the scope of our audit and the nature, timing and extent of our audit procedures and to evaluate the effect of misstatements on the financial report as a whole.
• We chose total assets as the benchmark because, in our view, it is the benchmark against which the performance of the Group is most commonly measured whilst in the exploration phase.
• We utilised a 1% threshold based on our professional judgement, noting it is within the range of commonly acceptable asset-related thresholds.
Audit Scope
• Our audit focused on where the Group made subjective judgements; for example, significant accounting estimates involving assumptions and inherently uncertain future events.
• Component auditors, operating under our instruction, performed audit procedures over the financial information of the Group’s Indonesian operations. For these procedures, we decided on the level of involvement required by us to be able to conclude whether sufficient appropriate audit evidence had been obtained. We had active dialogue throughout the year with the component auditors, through discussions, written instructions from us and reporting received from the component auditors.
Key audit matters Key audit matters are those matters that, in our professional judgement, were of most significance in our audit of the financial report for the current period. The key audit matters were addressed in the context of our audit of the financial report as a whole, and in forming our opinion thereon, and we do not provide a separate opinion on these matters. Further, any commentary on the outcomes of a particular audit procedure is made in that context. In addition to the matter described in the Material uncertainty related to going concern section, we have determined the matters described below to be the key audit matters to be communicated to the Board of Directors.
Key audit matter How our audit addressed the key audit matter
Carrying value of exploration and evaluation assets (Refer to note 2(a)(i) and note 7 to the financial report) $9.4 million
As at 30 June 2017, the exploration and evaluation assets recognised by the Group related to the Kulon Progo Iron Sands project in Indonesia.
Exploration and evaluation assets are accounted for in accordance with the policies in note 1(d) to the financial report.
Judgement is required by the Group to assess whether there were indicators of impairment of the exploration and evaluation assets, due to the need to make estimates about future events and circumstances, such as whether the mineral resources may be economically viable to mine in the future.
We performed the following procedures, amongst others:
• Evaluated the Group’s assessment that there had been no indicators of impairment by considering other available information, such as press releases and other information in the annual report regarding developments in relation to the Kulon Progo Iron Sands project.
• Enquired of management as to whether the licence over the Kulon Progo Iron Sands project had been relinquished.
• Tested whether the Group retained right of tenure for its licence area by obtaining the licence status records from the relevant Indonesian government department.
• For a sample of additions to exploration and evaluation assets during the year, obtained relevant supporting documentation, such as invoices, and compared the amounts to accounting records.
Key audit matter How our audit addressed the key audit matter
This was a key audit matter due to the size of the Group’s exploration and evaluation assets and the risk of impairment of exploration and evaluation assets should the result of exploration activities not be positive or the Group relinquish its license as it continues to assess future viability.
• Obtained the planned expenditure for the Kulon Progo Iron Sands project as included in cash flow forecasts of the Group and compared it to the minimum expenditure requirements to maintain the licence in good standing
• Inquired of management and directors as to the future planned expenditure on capitalised exploration and evaluation assets.
• Obtained written representations from management regarding their plans for future action and their assessment of the feasibility of these plans.
Classification of investment in Sapex as held for sale (Refer to note 8 to the financial report)
The Group entered into a conditional sale agreement to sell its 51% stake in Sapex Oilfield Services Limited (‘Sapex’) in consideration for a 30% stake in a proposed new entity (‘Sapex Group Limited’) to be listed on the National Stock Exchange of Australia (‘NSX’). As part of this transaction, a loan and associated interest totalling US$370,150 from the Group to PT Sapex Servis Indonesia (‘Sapex Servis’) will be forgiven and the deferred consideration liability totalling US$500,000 will no longer be payable.
The listing of Sapex Group Limited on the NSX occurred on 15 September 2017.
As a result of this transaction, the Group classified its investment in Sapex, together with the loan to Sapex Servis and the deferred consideration payable as a ‘disposal group’, being held for sale as at 30 June 2017.
We performed the following procedures, amongst others:
• Obtained the Group’s conditional sale agreement for the sale of Sapex
• Evaluated whether the Sapex assets were available for immediate sale in their present condition by considering the Group’s ability to vend them into Sapex Group Limited.
• Inquired of management as to their plan to sell these assets and the basis of their conclusion that the transaction was highly probable of completing within the next twelve months.
• Compared the Group’s assessment of assets and liabilities identified and classified as held for sale to the underlying accounting records.
• Tested that the assets classified by the Group as held for sale were held at the lower of their carrying amount and fair value less costs to sell by obtaining evidence supporting the fair value less costs to sell, such as valuations implied by the share price of Sapex Group Limited on the date of its admission to the NSX.

Key audit matter How our audit addressed the key audit matter
This was a key audit matter due to the significance of the proposed transaction for the Group and the judgements made by the Group about the status of the transaction when assessing whether the requirements of Australian Accounting Standards to classify assets as held for sale had been satisfied as at 30 June 2017.
• Evaluated whether, in view of the requirements of Australian Accounting Standards, the financial report provided adequate disclosure about the proposed transaction.
Other information The directors are responsible for the other information. The other information comprises the Corporate Directory, CEO's Report, Directors' Report, Corporate Governance Statement and ASX additional information included in the Group’s annual report for the year ended 30 June 2017 but does not include the financial report and our auditor’s report thereon.
Our opinion on the financial report does not cover the other information and accordingly we do not express any form of assurance conclusion thereon.
In connection with our audit of the financial report, our responsibility is to read the other information identified above and, in doing so, consider whether the other information is materially inconsistent with the financial report or our knowledge obtained in the audit, or otherwise appears to be materially misstated.
If, based on the work we have performed, we conclude that there is a material misstatement of this other information, we are required to report that fact. We have nothing to report in this regard.
Responsibilities of the directors for the financial report The directors of the Company are responsible for the preparation of the financial report that gives a true and fair view in accordance with Australian Accounting Standards and Corporations Act 2001 and for such internal control as the directors determine is necessary to enable the preparation of the financial report that gives a true and fair view and is free from material misstatement, whether due to fraud or error.
In preparing the financial report, the directors are responsible for assessing the ability of the Group to continue as a going concern, disclosing, as applicable, matters related to going concern and using the going concern basis of accounting unless the directors either intend to liquidate the Group or to cease operations, or have no realistic alternative but to do so.
Auditor’s responsibilities for the audit of the financial report Our objectives are to obtain reasonable assurance about whether the financial report as a whole is free from material misstatement, whether due to fraud or error, and to issue an auditor’s report that includes our opinion. Reasonable assurance is a high level of assurance, but is not a guarantee that an audit conducted in accordance with the Australian Auditing Standards will always detect a material misstatement when it exists. Misstatements can arise from fraud or error and are considered material if, individually or in the aggregate, they could reasonably be expected to influence the economic decisions of users taken on the basis of the financial report.
A further description of our responsibilities for the audit of the financial report is located at the Auditing and Assurance Standards Board website at: http://www.auasb.gov.au/auditors_responsibilities/ar1.pdf. This description forms part of our auditor's report.
Report on the remuneration report
Our opinion on the remuneration report We have audited the remuneration report included in pages 11 to 13 of the directors’ report for the year ended 30 June 2017.
In our opinion, the remuneration report of Indo Mines Limited for the year ended 30 June 2017 complies with section 300A of the Corporations Act 2001.
Responsibilities The directors of the Company are responsible for the preparation and presentation of the remuneration report in accordance with section 300A of the Corporations Act 2001. Our responsibility is to express an opinion on the remuneration report, based on our audit conducted in accordance with Australian Auditing Standards.
PricewaterhouseCoopers
Ben Gargett Perth Partner 29 September 2017

Page 56
ASX ADDITIONAL INFORMATION The shareholder information set out below was applicable as at 31 August 2017.
1. TWENTY LARGEST HOLDERS OF LISTED SECURITIES
The names of the twenty largest holders of each class of listed securities are listed below: Ordinary Shares
Name
No of Ordinary
Shares Held
Percentage of Issued Shares
Yogya Metals and Mining Limited 150,000,000 27.88%
Java Metals and Mining Limited 100,000,000 18.59%
Rajawali Group International Limited 57,317,294 10.65%
JP Morgan Nominees Australia Limited 36,318,993 6.75%
Rockcheck Trading Limited 36,000,000 6.69%
Pershing Australia Nominees Pty Ltd <Argonaut Account> 34,186,326 6.35%
BNP Paribas Noms Pty Ltd <IB AU Noms Retali Client DRP> 18,468,488 3.43%
Pershing Australia Nominees Pty Ltd <Phillip Securities (HK) A/C> 12,011,209 2.23%
Citicorp Nominees Pty Limited 11,663,611 2.17%
Mr Keith Charles Brooks 7,000,000 1.30%
Arredo Pty Ltd 6,000,000 1.12%
HSBC Custody Nominees (Australia) Limited 5,377,525 1.00%
BNP Paribas Noms Pty Ltd <DRP> 5,296,541 0.98%
BNP Paribas Noms Pty Ltd <UOB Kay Hian Priv Ltd DRP> 5,231,162 0.97%
Broadscope Pty Ltd <Catlow Family A/c> 4,950,000 0.92%
Mitra-Indo Resources Pte Ltd 4,433,339 0.82%
Trillium Investments Pty Ltd 4,375,043 0.81%
HSBC Custody Nominees (Australia) Limited – A/C 3 1,818,182 0.34%
Regans Ford Estate Pty Ltd 1,666,530 0.31%
CS Fourth Nominees Pty Limited <HSBC Cust Nom Au Ltd 11 A/C> 1,658,741 0.31%
Total Top 20 503,772,984 93.63%
Others 34,253,614 6.37%
Total Ordinary Shares on Issue 538,026,598 100.00%
2. DISTRIBUTION OF EQUITY SECURITIES
Analysis of numbers of shareholders by size of holding:
Ordinary Shares
Distribution
Number of Shareholders
Number of Shares
1 – 1,000 475 265,203 1,001 – 5,000 421 1,087,633 5,001 – 10,000 105 856,840
10,001 – 100,000 211 7,863,010 More than 100,000 84 527,953,912 Totals 1,296 538,026,598
There were 1,157 holders of less than a marketable parcel of ordinary shares.
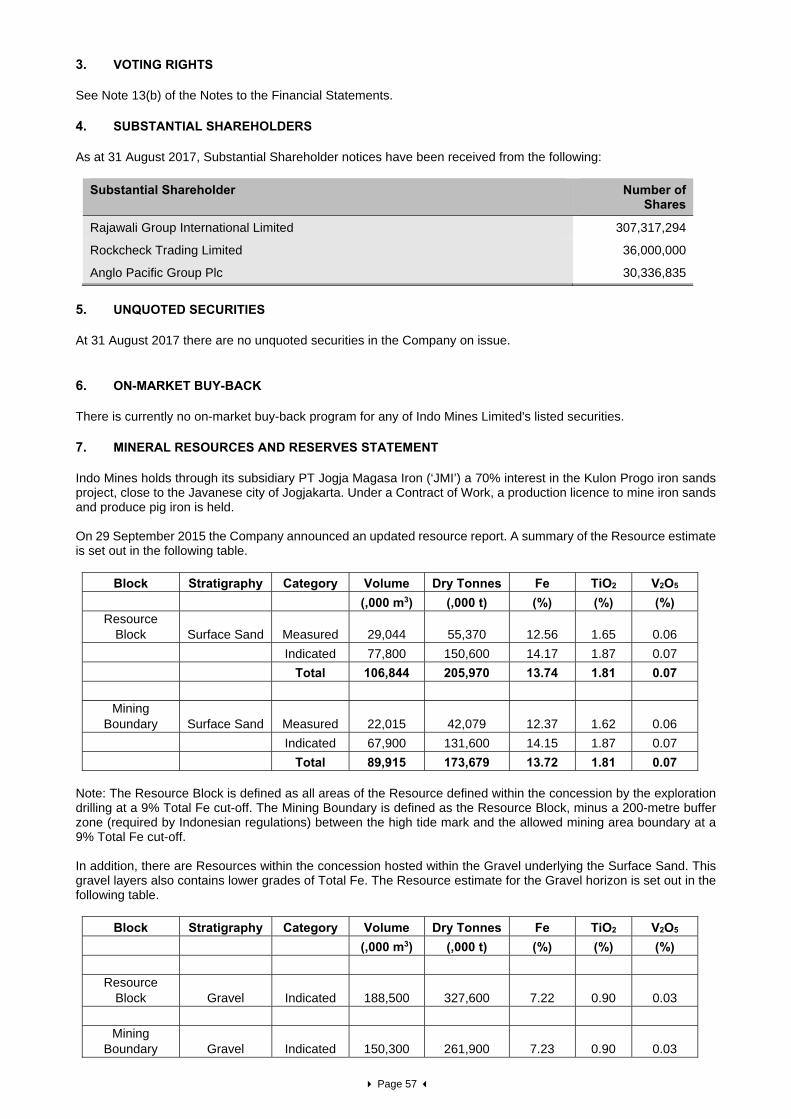
Page 57
3. VOTING RIGHTS
See Note 13(b) of the Notes to the Financial Statements.
4. SUBSTANTIAL SHAREHOLDERS
As at 31 August 2017, Substantial Shareholder notices have been received from the following:
Substantial Shareholder Number of Shares
Rajawali Group International Limited 307,317,294
Rockcheck Trading Limited 36,000,000
Anglo Pacific Group Plc 30,336,835
5. UNQUOTED SECURITIES
At 31 August 2017 there are no unquoted securities in the Company on issue.
6. ON-MARKET BUY-BACK
There is currently no on-market buy-back program for any of Indo Mines Limited's listed securities.
7. MINERAL RESOURCES AND RESERVES STATEMENT
Indo Mines holds through its subsidiary PT Jogja Magasa Iron (‘JMI’) a 70% interest in the Kulon Progo iron sands project, close to the Javanese city of Jogjakarta. Under a Contract of Work, a production licence to mine iron sands and produce pig iron is held. On 29 September 2015 the Company announced an updated resource report. A summary of the Resource estimate is set out in the following table.
Block Stratigraphy Category Volume Dry Tonnes Fe TiO2 V2O5
(,000 m3) (,000 t) (%) (%) (%) Resource
Block Surface Sand Measured 29,044 55,370 12.56 1.65 0.06
Indicated 77,800 150,600 14.17 1.87 0.07
Total 106,844 205,970 13.74 1.81 0.07
Mining
Boundary Surface Sand Measured 22,015 42,079 12.37 1.62 0.06
Indicated 67,900 131,600 14.15 1.87 0.07
Total 89,915 173,679 13.72 1.81 0.07
Note: The Resource Block is defined as all areas of the Resource defined within the concession by the exploration drilling at a 9% Total Fe cut-off. The Mining Boundary is defined as the Resource Block, minus a 200-metre buffer zone (required by Indonesian regulations) between the high tide mark and the allowed mining area boundary at a 9% Total Fe cut-off. In addition, there are Resources within the concession hosted within the Gravel underlying the Surface Sand. This gravel layers also contains lower grades of Total Fe. The Resource estimate for the Gravel horizon is set out in the following table.
Block Stratigraphy Category Volume Dry Tonnes Fe TiO2 V2O5
(,000 m3) (,000 t) (%) (%) (%)
Resource
Block Gravel Indicated 188,500 327,600 7.22 0.90 0.03
Mining
Boundary Gravel Indicated 150,300 261,900 7.23 0.90 0.03
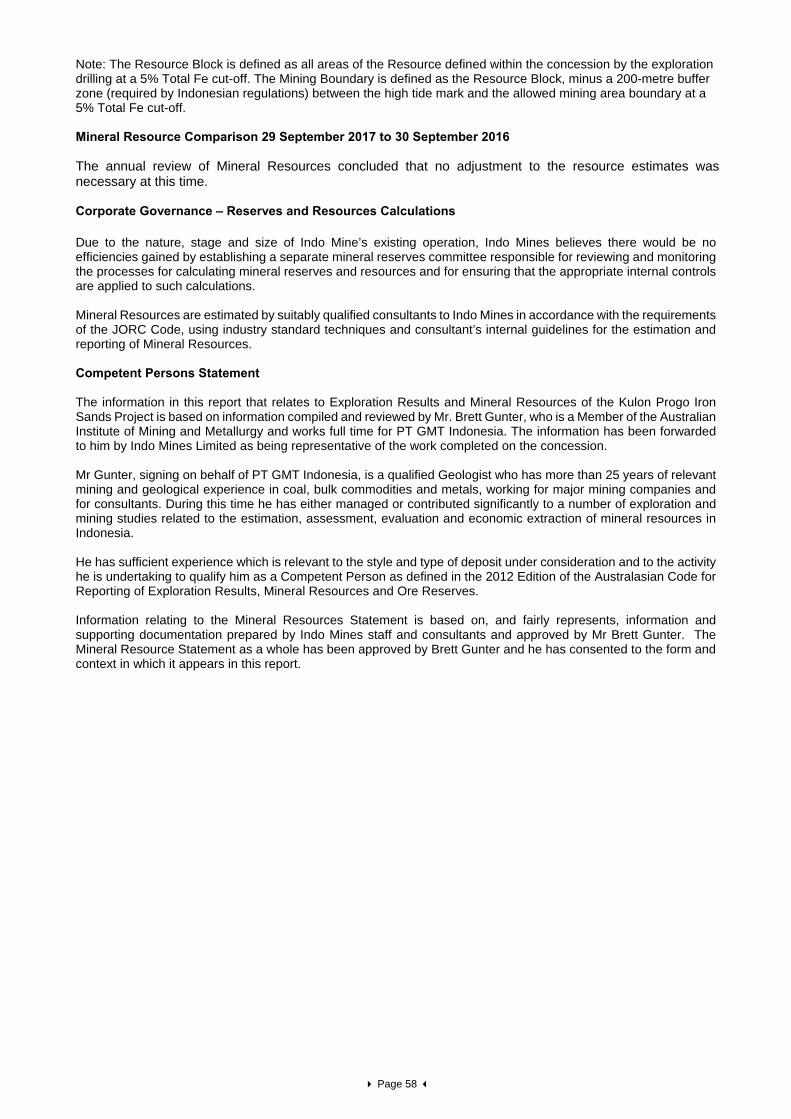
Page 58
Note: The Resource Block is defined as all areas of the Resource defined within the concession by the exploration drilling at a 5% Total Fe cut-off. The Mining Boundary is defined as the Resource Block, minus a 200-metre buffer zone (required by Indonesian regulations) between the high tide mark and the allowed mining area boundary at a 5% Total Fe cut-off. Mineral Resource Comparison 29 September 2017 to 30 September 2016 The annual review of Mineral Resources concluded that no adjustment to the resource estimates was necessary at this time. Corporate Governance – Reserves and Resources Calculations Due to the nature, stage and size of Indo Mine’s existing operation, Indo Mines believes there would be no efficiencies gained by establishing a separate mineral reserves committee responsible for reviewing and monitoring the processes for calculating mineral reserves and resources and for ensuring that the appropriate internal controls are applied to such calculations. Mineral Resources are estimated by suitably qualified consultants to Indo Mines in accordance with the requirements of the JORC Code, using industry standard techniques and consultant’s internal guidelines for the estimation and reporting of Mineral Resources. Competent Persons Statement The information in this report that relates to Exploration Results and Mineral Resources of the Kulon Progo Iron Sands Project is based on information compiled and reviewed by Mr. Brett Gunter, who is a Member of the Australian Institute of Mining and Metallurgy and works full time for PT GMT Indonesia. The information has been forwarded to him by Indo Mines Limited as being representative of the work completed on the concession. Mr Gunter, signing on behalf of PT GMT Indonesia, is a qualified Geologist who has more than 25 years of relevant mining and geological experience in coal, bulk commodities and metals, working for major mining companies and for consultants. During this time he has either managed or contributed significantly to a number of exploration and mining studies related to the estimation, assessment, evaluation and economic extraction of mineral resources in Indonesia. He has sufficient experience which is relevant to the style and type of deposit under consideration and to the activity he is undertaking to qualify him as a Competent Person as defined in the 2012 Edition of the Australasian Code for Reporting of Exploration Results, Mineral Resources and Ore Reserves. Information relating to the Mineral Resources Statement is based on, and fairly represents, information and supporting documentation prepared by Indo Mines staff and consultants and approved by Mr Brett Gunter. The Mineral Resource Statement as a whole has been approved by Brett Gunter and he has consented to the form and context in which it appears in this report.