indonesia: 2013 article iv consultation; imf country …©2013 international monetary fund imf...
TRANSCRIPT
©2013 International Monetary Fund
IMF Country Report No. 13/362
INDONESIA STAFF REPORT FOR THE 2013 ARTICLE IV CONSULTATION
Under Article IV of the IMF’s Articles of Agreement, the IMF holds bilateral discussions with members, usually every year. In the context of the 2013 Article IV consultation with Indonesia, the following documents have been released and are included in this package: The Staff Report prepared by a staff team of the IMF for the Executive Board’s
consideration on November 15, 2013, following discussions that ended on August 30, 2013, with the officials of Indonesia on economic developments and policies. Based on information available at the time of these discussions, the staff report was completed on November 1, 2013.
An Informational Annex prepared by the IMF.
A Staff Statement of November 15, 2013 updating information on recent developments.
A Press Release summarizing the views of the Executive Board as expressed during its November 15, 2013 consideration of the staff report that concluded the Article IV consultation with Indonesia.
A Statement by the Executive Director for Indonesia.
The publication policy for staff reports and other documents allows for the deletion of market−sensitive information.
Copies of this report are available to the public from
International Monetary Fund Publication Services P.O. Box 92780 Washington, D.C. 20090
Telephone: (202) 623-7430 Telefax: (202) 623-7201 E-mail: [email protected] Internet: http://www.imf.org
International Monetary Fund
Washington, D.C.
December 2013
INDONESIA STAFF REPORT FOR THE 2013 ARTICLE IV CONSULTATION
KEY ISSUES Context: A slowdown in growth in major emerging market economies (EMEs) and decline in commodity prices, and more recently, a reversal in push factors tied to a prospective exit from extraordinarily easy global monetary conditions, has put pressure on Indonesia’s balance of payments and heightened its vulnerability to shocks. Domestic policy accommodation and rising energy subsidies have also given rise to increased external and fiscal imbalances. Recent policy tightening, fuel price hikes, and exchange rate flexibility have been firmly aimed at reducing these pressures. Against this backdrop, discussions centered on actions needed to further buttress policy buffers in the face of heightened market volatility and to reduce structural impediments in support of broad-based growth.
Outlook and risks: Growth is projected to slow to 5−5½ percent in 2013 and 2014. Inflation will likely peak at just below 10 percent at end2013, due mainly to the one-off effect of June fuel price increases and recent rupiah depreciation. The current account deficit is expected to exceed 3 percent of GDP in 2013 and 2014 on weak commodity exports. Reserves have also come under pressure, partly due to Bank Indonesia’s heavy intervention in the foreign exchange market in mid-2013 in order to stem the rupiah’s depreciation. In the near term, downside risks relate externally to a further adverse shift in funding conditions in EMEs and/or weaker-than-anticipated growth in these economies, notably spillovers from China and India, and domestically to a further weakening in investor sentiment, prompted by adverse external conditions and/or policy uncertainty.
Key policy recommendations: Recent market volatility and reserve losses highlight the need to deal decisively with macroeconomic imbalances and contain financial stability risks. The current delay in tapering of unconventional monetary policies provides an opportunity to strengthen policy and financial buffers and improve market perceptions. Monetary policy should remain focused on anchoring inflation expectations and reducing balance of payments pressures; fiscal policy should support monetary policy in this effort, led by tax and subsidy reforms; and the exchange rate and bond yields should continue to reflect market conditions in order to facilitate an orderly adjustment to a shifting global environment. Careful monitoring of banks as financial conditions tighten and a firm closing of the gaps in the crisis management framework are needed to keep financial stability risks in check. Structural reforms should focus on a more predictable business climate and greater labor market flexibility.
November 1, 2013

INDONESIA
2 INTERNATIONAL MONETARY FUND
Approved By Hoe Ee Khor and Vivek Arora
Mission dates: August 19−30, 2013 Staff team: David Cowen (Head), Geoffrey Heenan, Jaebin Ahn (all APD); Dora Benedek (FAD); Phakawa Jeasakul (MCM); Lawrence Dwight (SPR); and Benedict Bingham (Senior Resident Representative). The mission met with the Minister of Finance M. Chatib Basri, Bank Indonesia Governor Agus Martowardojo, Financial Services Authority Chairman Muliaman Hadad, members of the National Economic Council, and other senior officials. Mr. Santoso (Executive Director) and Ms. Akbar (Advisor) joined the discussions. Janice Lee and Nong Jotikasthira (APD) assisted in the preparation of this report.
CONTENTS GLOSSARY _________________________________________________________________________________________4 BACKGROUND AND CONTEXT ___________________________________________________________________5 RECENT DEVELOPMENTS, OUTLOOK, AND RISKS ______________________________________________7 A. Recent Developments and the Near-Term Outlook ____________________________________________7 B. Risks and Prospects ____________________________________________________________________________8 C. External Position and Debt Sustainability ______________________________________________________9 POLICY ISSUES __________________________________________________________________________________ 12 A. Monetary and Exchange Rate Policies _______________________________________________________ 13 B. Fiscal Policy __________________________________________________________________________________ 16 C. Financial and Corporate Sector Issues _______________________________________________________ 18 D. Medium-Term Policy Priorities _______________________________________________________________ 23 STAFF APPRAISAL ______________________________________________________________________________ 25 BOXES 1. Recent Policy Measures (Through September 2013) ___________________________________________6 2. External Assessment _________________________________________________________________________ 10 3. Trends in Foreign Exchange Market Development and Functioning _________________________ 14 4. Corporate External Financing ________________________________________________________________ 20 5. Financial Market Deepening _________________________________________________________________ 21 6. Structural Transformation and Labor Market Issues __________________________________________ 24 FIGURES 1. Overview _____________________________________________________________________________________ 27 2. Recent Market Developments ________________________________________________________________ 28 3. Emerging Markets: Recent Developments ___________________________________________________ 29 4. Real Sector Developments ___________________________________________________________________ 30
INDONESIA
INTERNATIONAL MONETARY FUND 3
5. External Sector Developments _______________________________________________________________ 31 6. Monetary and Interest Rate Developments __________________________________________________ 32 7. Fiscal Developments _________________________________________________________________________ 33 8. Financial and Corporate Sector Soundness Indicators _______________________________________ 34 TABLES 1. Selected Economic Indicators, 2008–14 ______________________________________________________ 35 2. Balance of Payments, 2008–14 _______________________________________________________________ 36 3. Selected Vulnerability Indicators, 2008–13 ___________________________________________________ 37 4. Medium-Term Macroeconomic Framework, 2010–18 ________________________________________ 38 5. Monetary Survey, 2009-August 2013 ________________________________________________________ 39 6. Summary of Central Government Operations, 2009–14 ______________________________________ 40 7. Summary of General Government Operations, 2005–12 _____________________________________ 41 8. Financial Soundness Indicators, 2008-June 2013 _____________________________________________ 42 APPENDICES 1. Risk Assessment Matrix ______________________________________________________________________ 43 2. External Vulnerabilities in Perspective ________________________________________________________ 44 3. Debt Sustainability ___________________________________________________________________________ 50 4. Ensuring a Sustainable Medium-Term Fiscal Framework _____________________________________ 56 5. Banking Sector Stability ______________________________________________________________________ 62 6. Labor Market Policies and Economic Growth ________________________________________________ 69

INDONESIA
4 INTERNATIONAL MONETARY FUND
Glossary
AML Anti-Money Laundering ASEAN Association of Southeast Asian Nations BI Bank Indonesia BOP Balance of Payments BSA Bilateral Swap Arrangement CFT Combating the Financing of Terrorism CMIM Chiang Mai Initiative Multilateralization DPL Development Policy Loan EBA External Balance Assessment EMEs Emerging Market Economies FATF Financial Action Task Force FDI Foreign Direct Investment FKSSK Financial System Stability Forum FSAP Financial Sector Assessment Program FSIs Financial Soundness Indicators FSSN Financial System Safety Net FX Foreign Exchange GDP Gross Domestic Product LDF Loan-to-Deposit Ratio LPS Lembaga Penjamin Simpanan LTV Loan-to-Valuation MoF Ministry of Finance MOU Memorandum of Understanding NEER Nominal Effective Exchange Rate OJK Otoritas Jasa Keuangan OMO Open Market Operations RAM Risk Assessment Matrix REER Real Effective Exchange Rate SBIs Sertifikat Bank Indonesia SIFIs Systematically Important Financial Institutions SOEs State-Owned Enterprises TA Technical Assistance UMPs Unconventional Monetary Policies
INDONESIA
INTERNATIONAL MONETARY FUND 5
BACKGROUND AND CONTEXT 1. The 2013 Article IV consultation took place against the backdrop of slowing growth and widening macro-imbalances in Indonesia. Following the global financial crisis, rapid growth in other emerging market economies (EMEs), among them several of Indonesia’s major trading partners, and buoyant commodity prices, coupled with extraordinarily easy global monetary conditions, helped bolster exports, drive capital inflows, and boost domestic demand in support of strong growth. However, tailwinds that propelled EME growth and commodity price increases dissipated in the past two years, affecting Indonesia’s main exports, but accommodative monetary and fiscal policies continued to buoy private investment and import demand, adding to pressures on the current account. Rising energy subsidy costs also drove oil and gas imports and fiscal deficits higher. As a result, Indonesia slipped into a current account deficit for the first time in more than a decade in 2012. Growth is projected to slow due to external and domestic factors, and external and fiscal imbalances are expected to widen in 2013, notwithstanding recent policy measures, with both structural and cyclical forces at play.
2. A recent reversal in capital flows has added to balance of payments (BOP) pressures and raised funding costs in Indonesia. Prospects of a tapering in unconventional monetary policies (UMPs) in the United States prompted a marked shift in funding conditions and sharp reversal in capital inflows for a number of EMEs in May 2013, especially in those countries with large external and/or fiscal imbalances. Among major EMEs, Indonesia has been one of the most seriously affected by recent market volatility (Figures 2 and 3). Since May 22, net bond and equity outflows have totaled US$2.7 billion (to end-October), notwithstanding sizable bond inflows recently in response to policy tightening and a delay in UMP tapering. Yields on rupiah and U.S. dollar debt rose to their highest levels in more than two years in August, while the main Jakarta stock index declined sharply, although it is well off its August low (see text table). The rupiah has depreciated by 17 percent against the U.S. dollar so far in 2013, with most of this occurring since July. In the months preceding this, Bank Indonesia (BI) had intervened heavily in foreign exchange (FX) market and used moral suasion to prevent a rupiah depreciation, which led to sizable reserve losses and reduced FX market liquidity. As a result, the wedge between onshore and offshore rates reached as much as 5 percent in mid2013, but has since diminished with greater exchange rate flexibility.
3. In response, the authorities have taken significant steps lately to reduce macroeconomic imbalances and manage inward spillovers, which has helped reduce volatility (Box 1). To address external and fiscal imbalances, the government raised subsidized fuel prices in June 2013 by 33 percent on average—the first change in prices since 2009, when gasoline price increases in 2008 were reversed. Bank Indonesia also began raising policy rates in June to contain BOP and inflation pressures, including anticipated second-round effects of fuel price increases. In support, both the exchange rate and bond yields are now being allowed to adjust more freely in line with market conditions. Finally, the government policy package was announced in August 2013 aimed at reining in the current account deficit, containing wage and food price inflation, and boosting investment and employment, mainly through limited tax and investment incentives.
INDONESIA
6 INTERNATIONAL MONETARY FUND
Box 1. Indonesia—Recent Policy Measures (Through September 2013)
Since May 2013, the government and Bank Indonesia have announced or implemented a series of measures (summarized below) aimed at reducing macroeconomic imbalances, neutralizing inflation pressures, and maintaining financial stability, as well as containing employment losses. Monetary Policy and Liquidity Management Bank Indonesia (BI): Raised both the policy rate and the overnight deposit facility rate (bottom of interest rate corridor) starting in
June 2013 by a total 150 bps to 7.25 percent and 5.5 percent, respectively. Introduced tradable central bank rupiah deposits at one- and six-month tenors in September to facilitate interbank
money market development, and allowed these instruments to be treated as required reserves. Shortened the minimum holding period for central bank bills (SBIs) from six months to one month from mid
September to increase their liquidity. Exchange Rate Policy and Foreign Exchange Market Operations Commenced biweekly auctions of foreign exchange (FX) swaps with resident banks in July 2013; allowed derivative
positions held by banks with their customers to be passed on to BI through the swap auctions starting August 2013. Broadened the maturities of U.S. dollar term deposits placed by banks with BI from August. Relaxed the rules in August on FX purchases by exporters that have converted their export proceeds. Relaxed regulations in August on banks' short-term foreign borrowing (currently capped at 30 percent of their capital)
mainly by exempting demand deposits of nonresidents used for investment activities in Indonesia and demand deposits of nonresidents that contain divestment funds.
Macroprudential Controls Tightened loan-to-valuation (LTV) limits on mortgages for second and third residential properties in September 2013.
Additionally, raised LTV limits for motor vehicles. Raised the secondary reserve requirement (RR) in September (fulfilled by banks’ holding of treasury and BI securities)
from 2.5 percent to 4 percent, to be phased in by December 2013; also tightened the loan-to-deposit ratio (LDR) linked RR by lowering its applicability to banks with an LDR in excess of 92 percent (from 100 percent) and with a capital adequacy ratio of less than 14 percent.
Fiscal Policy Increased subsidized petrol price by 44 percent and subsidized diesel price by 22 percent in midJune 2013, and
approved in the revised 2013 budget a temporary cash compensation scheme for vulnerable groups. Announced in August the allowance of temporary deductions and deferred payments of income tax for the rest of
2013 for certain labor-intensive and export-oriented industries. Eliminated luxury taxes on more common use goods previously classified as luxury items (certain televisions and
appliances) in August. Increased the quantity of biodiesel usage to 10 percent in diesel fuel to reduce oil imports in August. Relaxed regulations in August on bonded zones through simplification of licensing procedures and increasing
the allocation of certain goods for local sale. Other Measures Changed the mechanism for importing beef and horticultural products in September 2013, moving away from strict
quotas to a system that will halt imports when the domestic price falls below the reference price and allow imports to resume if the domestic price exceeds the reference price.
Expanded the share of sales that industries in bonded zones can derive domestically in August to 50 percent from 25 percent, reversing a 2011 decision to restrict these sales.
Announced plans in August to issue a presidential decree guiding regional minimum wage setting in 2014.
INDONESIA
INTERNATIONAL MONETARY FUND 7
4. In this context, policy discussions focused on ensuring an orderly transition to and mitigating risks associated with a more challenging global and domestic environment. Despite the growth slowdown, staff emphasized the need to focus immediate policy actions on containing external and fiscal imbalances and managing financial market pressures through the clear pursuit of appropriate macro-policy tightening, supported by further adjustments in exchange and interest rates. Enhanced readiness of the government’s crisis management framework and close monitoring of bank and corporate vulnerabilities would help mitigate spillover risks to the financial system. The possible peak in a commodity price super-cycle, deterioration in the current account balance, and expected slowdown in growth in Indonesia over the near to medium term highlight the need for structural reforms aimed at broadening the manufacturing and export base, creating more formal sector employment, and improving long-run growth prospects.
RECENT DEVELOPMENTS, OUTLOOK, AND RISKS
A. Recent Developments and the Near-Term Outlook
5. Recent macroeconomic developments have been less favorable than envisaged at the time of the last Article IV consultation, with near-term projections showing slower growth, higher inflation, and more intense BOP pressures.
Real GDP growth is expected to slow to 5‒5½ percent in 2013 and 2014 from 6¼ percent in 2012 due to a combination of external and domestic factors, in particular sluggish investment (including FDI), weaker external demand, and tighter funding conditions (Table 1). In the first half of 2013, growth was slightly under 6 percent (y/y), with both
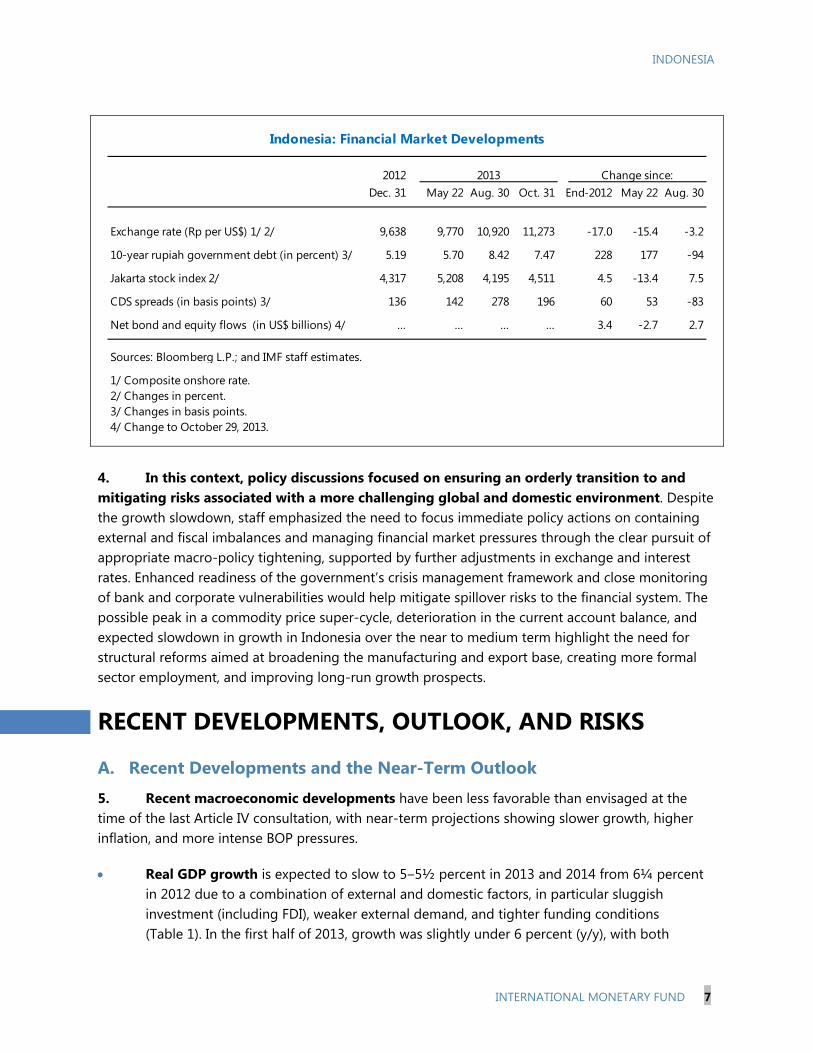
2012 2013 Change since:Dec. 31 May 22 Aug. 30 Oct. 31 End‐2012 May 22 Aug. 30
Exchange rate (Rp per US$) 1/ 2/ 9,638 9,770 10,920 11,273 -17.0 -15.4 -3.2
10-year rupiah government debt (in percent) 3/ 5.19 5.70 8.42 7.47 228 177 -94
Jakarta stock index 2/ 4,317 5,208 4,195 4,511 4.5 -13.4 7.5
CDS spreads (in basis points) 3/ 136 142 278 196 60 53 -83
Net bond and equity flows (in US$ billions) 4/ … … … … 3.4 -2.7 2.7
Sources: Bloomberg L.P.; and IMF staff estimates.
1/ Composite onshore rate.2/ Changes in percent.3/ Changes in basis points.4/ Change to October 29, 2013.
Indonesia: Financial Market Developments
INDONESIA
8 INTERNATIONAL MONETARY FUND
investment and consumption slowing, resulting in a falloff in import demand (Figure 4). However, the decline in export growth, in U.S. dollar terms, was even sharper, although mainly due to price effects.
Headline inflation is expected to peak at 9.5 percent (y/y) at end2013 before moderating, reflecting the June subsidized fuel price increases and some secondround effects, as well as exchange rate pass-through and demand pull factors. It was 8.4 percent in September 2013, up from 4.3 percent at end2012. The core rate (less food and fuel), which bottomed out at 4.0 percent in May, increased to 4.7 percent in September—its highest level in two years.
The current account deficit is projected to widen to 3½ percent of GDP in 2013 (Table 2 and Figure 5). Although non-oil import growth has fallen, it will likely be more than offset by declining commodity exports. Some improvement is expected in 2014 given the exchange rate depreciation and policy adjustments, but the deficit is still likely to remain above 3 percent of GDP only on a modest global recovery and still-soft commodity prices.
The overall BOP is projected to show a sizable deficit in 2013, as net FDI and portfolio inflows ease off on greater uncertainty and EME asset repricing. As a result, reserves, which were US$96 billion at end-September, are expected to fall to around US$89 billion at end2013 (4.9 months of imports or 155 percent of short-term debt), compared to US$113 billion at end-2012 (6.4 months of imports or 206 percent of short-term debt).1
B. Risks and Prospects
6. Risks are to the downside, as detailed in the Risk Assessment Matrix (RAM) (Appendix 1). At present, inward spillovers come mainly through the trade channel (via export demand and commodity prices) and net inflows in the financial account. In the near term, key external risks are protracted economic and financial volatility, especially in EMEs, and a fiscal policy shock in the United States, while in the medium term, they entail a sharper-than-envisaged slowdown of growth in China, as well as in other large EMEs. The biggest impact would be on growth and on external and fiscal sustainability, which could be undermined by weaker external demand, lower commodity prices, and greater global risk aversion. Currently, vulnerability indicators (Table 3) already point to some elevated risks in these areas. Domestic risks center on a weakening in investor sentiment, prompted by adverse external conditions and policy uncertainty in Indonesia, which could exacerbate external and fiscal imbalances and feed back into confidence, while over the near to medium term, they concentrate on bank distress induced by a sharper-than-envisaged squeeze on liquidity and/or slowdown in economic activity and on prolonged inaction on key structural reforms needed to boost productivity and competitiveness. 1 Gross reserves include predetermined drains identified in the IMF’s standard reserves template. These drains mainly comprise principal and interest payments on BI and central government foreign currency debt falling due within the next 12 months, short-term foreign currency deposits of resident institutions, and net forward and swap positions of less than 12 months of remaining maturity. They increased to US$21.7 billion at end-August from US$17.7 billion at end‐May, with about US$3 billion of this rise due to net forward and swap positions set to expire by end‐2013.

INDONESIA
INTERNATIONAL MONETARY FUND 9
7. Medium-term prospects. Assuming Indonesia can manage these risks, restore a stable macroeconomic environment, and step up structural reforms, growth over the medium term is expected to average 6 percent, in line with trend (Table 4), but lower than the 6½−7 percent projected during the last consultation, owing mainly to tighter financial conditions, weaker global prospects, and persistent supply bottlenecks. Domestic demand would continue to be the main growth driver, but this pace requires firm resolve to reduce structural impediments. The baseline assumes that energy subsidies are phased out by 2018, with some interim savings redirected to larger development spending. Reforms would also need to focus on increasing labor market flexibility, rationalizing the trade and investment regime, and deepening financial markets. Under this baseline, the current account deficit would narrow to 2½ percent of GDP in the medium term, with structural forces linked to Indonesia’s dependence on commodity exports, stagnant oil and gas production, and other competitiveness challenges partially offsetting more favorable cyclical forces tied to improved global prospects. Gross FDI would stay at around 2 percent of GDP, thereby reducing the dependence on portfolio inflows. Reserves would stabilize at around 3½ months of imports and 100−120 percent of short-term debt.
8. Authorities’ views. The authorities are more optimistic about near-term prospects than staff, expecting growth to slow less in 2013 on more favorable domestic conditions and to recover more in 2014 on a more favorable global outlook and election year spending, with parliamentary and presidential elections slated for mid2014. On inflation, views are broadly aligned for 2013, but the authorities believe recent policy tightening and more benign exchange rate pass-through will bring inflation back within BI’s target band (4.5±1 percent) in 2014. The authorities also expect the current account deficit to widen only slightly in 2013 to around 3 percent of GDP on improved export performance and fuel import reduction in the second half of the year. They anticipate it will narrow more than envisaged by staff in 2014 and over the medium term due to regional and global factors and domestic reforms.
C. External Position and Debt Sustainability
9. The external position appears moderately weaker than implied by mediumterm fundamentals and desirable policies (Box 2). An analysis of factors that led to its deterioration in recent years suggests a combination of cyclical and structural forces were at play (Appendix 2). In the 2013 Pilot External Sector Report—Individual Economy Assessments, the external balance assessment (EBA) approach estimated Indonesia’s cyclically-adjusted current account balance was 0−2 percent of GDP weaker than suggested by fundamentals and desired policies. For 2013, despite the slowdown in growth, the larger fiscal deficit implies that Indonesia’s cyclically-adjusted current account balance is about 1−3 percent of GDP weaker than the norm. On the capital and financial account, the ongoing reliance on portfolio flows poses added risks. Capital flow management measures introduced in 2010 were partially reversed in August 2013, highlighted by a reduction in the holding period for BI securities. Indonesia’s projected reserves at end-2013 are adequate based on standard debt and import metrics but relatively low when assessed in relation to the IMF’s composite

INDONESIA
10 INTERNATIONAL MONETARY FUND
Box 2. Indonesia—External Assessment 1/ Overall assessment. Indonesia’s external position remains moderately weakerthan implied by medium-term fundamentals and desirable policies. Compared with trading partners, Indonesia’s young labor force, low relative income, and more rapid growth tend to improve its current account balance (CAB), while low social spending and capital controls tend to weaken it. Based on the IMF’s external balances assessment (EBA) methodology, Indonesia’s current account norm was −½ to −2½ percent of GDP in 2012 while its cyclically adjusted CAB was −2.2 percent of GDP, 0−2 percentage points of GDP weaker than the norm. The EBA external sustainability approach estimates that a CAB of -2.7 percent of GDP would stabilize Indonesia’s net foreign asset (NFA) position at -38 percent of GDP.
Policy responses. Macroeconomic policies and structural reforms should be implemented to reduce the current account deficit and raise foreign reserves over the medium term. Policies should aim at cutting the fiscal deficit moderately (mainly by eliminating energy subsidies), tightening monetary policy, as appropriate, and allowing the exchange rate to adjust flexibly. Reforms are also needed to increase labor market flexibility, improve the trade and investment regimes, and reduce policy uncertainties.
Current account. In 2012, weak commodity prices, falling oil and gas exports, and strong imports caused the CAB to weaken by 3 percentage points to −2.8 percent of GDP. The widening of the fiscal deficit had relatively limited impact (less than 0.3 percentage points of GDP). With slowing economic growth and a larger fiscal imbalance expected in 2013, staff estimate that Indonesia’s cyclically adjusted CAB will weaken by a further 0.6 percentage points to −3.3 percent of GDP, about 1−3 percentage points of GDP weaker than implied by medium-term fundamentals and desired policies.
Real exchange rate. The EBA REER model suggests the 2012 REER was in line with fundamentals and desirable policies. By September 2013, the REER had fallen a further 8½ percent, suggesting possible undervaluation. However, based on the worsening CAB and large residual in the REER approach, staff believe the macrobalance approach gives a more accurate assessment of Indonesia’s external position. Using standard elasticities, the depreciation so far in 2013 (if maintained) would improve the CAB by about 1¼ percentage points of GDP over the medium term.
Capital account. Staff estimate that foreign direct investment (FDI) will remain about 2 percent of GDP over the medium term. Investors rate Indonesia highest on market size and the macroeconomic environment, but suggest a need to improve labor markets, business startup procedures, contract enforcement, and infrastructure. Portfolio flows have been volatile, but so far in 2013 equity outflows (net) have been small (0.1 percent of GDP), while bond inflows (net) have held up well (1 percent of GDP), notwithstanding mid-year pressures. Still, Indonesia remains vulnerable to a slowdown or reversal in capital inflows due to increased global risk aversion, unwinding of global monetary accommodation, or weaker investor sentiment. Some easing in capital controls has occurred with the recent reduction in the holding period on Bank Indonesia (BI) securities.
Foreign reserves and intervention. In the first half of 2013, BI intervened to smooth volatility and support the rupiah. As a result, official reserves fell from US$113 billion at endDecember 2012 to US$93 billion at endJuly 2013, before stabilizing. Staff project reserves will decline to US$89 billion at end2013 (at the low end of the recommended range of 100−150 percent on the IMF’s composite reserve adequacy metric).
External assets and liabilities. Indonesia’s net foreign asset position at end-2012 stood at -41 percent of GDP, comprising reserves (+13 percent of GDP), net FDI and equities (-34 percent of GDP), and net debt and other liabilities (-20 percent of GDP). External asset and liability ratios are expected to stay fairly constant over the medium term and do not appear as a significant vulnerability given the relatively low level of debt and other liabilities. _________________________________ 1/ This box updates the external assessment in the IMF’s 2013 Pilot External Sector Report—Individual Economy Assessments, published in July 2013.
Cyclically adjusted CA -2.2CA norm -0.5 to -2.5Estimated CA gap 0 to -2
Of which:Partners' fiscal deficits 1.0Domestic capital controls 0.6Partner policies, other -0.2Domestic policies, other -0.2
Residual -2.2
to Current Account Gap, 2012
(In percent of GDP)
Indonesia: Estimated Policy Contributions
REER, 2012 average 102REER norm 96 to 106Estimated REER gap …
Of which:Domestic captial controls -5.1Lower domestic interest rates -0.3Domestic policies, other 0.0Foreign policies, other 0.1
Residual 5.2
Indonesia: Estimated Policy Contributionsto the REER Gap, 2012
(In percent of GDP)

INDONESIA
INTERNATIONAL MONETARY FUND 11
Box 2. Indonesia—External Assessment (Concluded)
2014 Rank
2013 Rank
Change
Overall 120 116 -4Starting a business 175 171 -4Dealing with construction permits 88 77 -11Getting electricity 121 121 No changeRegistering property 101 97 -4Getting credit 86 82 -4Protecting investors 52 51 -1Paying taxes 137 132 -5Trading across borders 54 52 -2Enforcing contracts 147 146 -1Resolving insolvency 144 142
-2
Indonesia: Doing Business Indicators
Source: World Bank, Doing Business .

INDONESIA
12 INTERNATIONAL MONETARY FUND
metric. Going forward, the recent depreciation of the real effective exchange rate (REER) would be expected to narrow Indonesia’s current account deficit by about one percentage point of GDP. Additional policy reforms would be needed to close the gap fully over the medium term. A further modest reduction in reserves may be appropriate to smooth exchange rate volatility and cushion against temporary external shocks, but rebuilding them over the medium term is essential to guard against future risks. Both external and public debt are projected to rise slightly over the near term (as a share of GDP), but remain at relatively low levels. The Debt Sustainability Analysis (Appendix 3) indicates that the debt profile is resilient to standard shocks.
10. Contingent financing and swaps. In the face of more volatile external financing conditions, efforts are being made to shore up defenses. In the event of a significant disruption to local or international bond markets, contingent financing could become available to Indonesia to support critical public expenditures under the World Bank’s Program for Economic Resilience, Investment and Social Assistance in Indonesia Development Policy Loan (DPL) with Deferred Drawdown Option (approved in May 2012). It provides US$2 billion in contingent budget support through end-June 2014, to be accessed in the event of a fiscal financing crisis, under circumstances set out in a government decree.2 Additional partner/parallel financing could come from the Asian Development Bank, Japan, and Australia totaling around US$3 billion (at current exchange rates). A bilateral swap arrangement (BSA) with Japan (US$12 billion) was extended in August 2013, while BSAs with China (Y 100 billion) and Korea (US$10 billion) were agreed in October 2013. Under the current Chiang Mai Initiative Multilateralization (CMIM) agreement, in place since March 2010, Indonesia is able to access up to US$11.4 billion.3
POLICY ISSUES 11. Policy discussions focused on restoring stability and reducing vulnerabilities, in light of the external and fiscal imbalances facing Indonesia and the likely permanent shift in global financing conditions. Staff noted that while the current policy stance is broadly appropriate, the authorities should take full advantage of the current delay in UMP tapering to rebuild policy and financial buffers and improve market perceptions in light of recent volatility. To this end, continued vigilance over macroeconomic imbalances, clear communication of the policy framework, and firm followthrough on stabilization measures are needed. Contingent financing and swap arrangements, which have been put in place, could also provide important fiscal and reserve buffers in the event of further adverse shocks. In line with recommendations made during the 2012 Article IV consultation, the authorities have been tightening monetary policy and allowed greater exchange rate flexibility,
2 Indonesia is already receiving budget support under three DPLs approved by the World Bank’s Executive Board in November 2012—one on institutional strengthening for social inclusion, one on connectivity, and one on the financial sector and investment climate reform and modernization. 3 Under this agreement, Indonesia can swap rupiah for U.S. dollars in the amount of its contribution multiplied by its current purchasing multiple (2.5), or up to US$11.4 billion. Indonesia has also given formal consent to the doubling of the CMIM agreement to US$240 billion.
INDONESIA
INTERNATIONAL MONETARY FUND 13
but with some lag.4 Subsidized fuel prices were raised, accompanied by temporary safety nets, but gaps in the financial stability architecture remain, while trade- and investment-creating opportunities have not fully materialized.
A. Monetary and Exchange Rate Policies
12. Financial conditions remained loose through the first half of 2013. Credit growth was 20 percent (y/y) in August 2013 (Table 5 and Figure 6), but down from 27 percent in mid2012. These conditions were supported by external inflows, abundant liquidity, and low policy rates. With credit growth outpacing deposit growth, the loan-to-deposit (LDR) ratio reached 89 percent in August 2013, compared to 84 percent a year earlier. Lately, financial conditions have tightened, with credit growth expected to slow to 15−20 percent by end2013 and further in 2014, reflecting available bank liquidity and higher lending rates. While larger banks are not facing funding pressures, interbank credit limits to smaller domestic banks have been reduced owing to increasing concerns about counterparty risks. Moreover, foreign banks’ offshore funding costs have increased on reduced FX market liquidity, while exchange rate expectations have resulted in wider currency swap spreads.
13. Exchange rate and money market developments. From early 2012 to mid-2013, the rupiah steadily weakened against the U.S. dollar, as Indonesia’s current account balance shifted into a deficit. However, BI used a combination of heavy intervention and moral suasion to temper large moves in the exchange rate. These actions tended to drive a wedge between onshore and offshore (nondeliverable) rates and adversely affected liquidity in the spot FX market (Box 3). When market pressures intensified in late May 2013, BI’s interventions picked up. Significant reserve losses ensued in the next two months. Bank Indonesia subsequently reduced interventions in the FX market and allowed the rupiah to move more freely. In response to selling pressures by foreign investors, BI also stepped up government bond purchases. Trading in the interbank money market remains thin and segmented, with negligible activity beyond one-month tenors.
14. Policy response. Since June 2013, BI’s policy and overnight deposit facility rates have been raised by 150 bps to 7.25 percent and 5.75 percent, respectively. The overnight lending rate has also been increased to the same level as the BI policy rate, with the latter now forming the upper bound of the central bank’s interest corridor. New short-term instruments were introduced in August 2013 to aid bank liquidity management and the holding period on BI bills (SBIs) was shortened to one month from six months in September 2013 to increase their liquidity and attract more foreign inflows. To help contain credit growth, BI introduced additional macroprudential measures on property lending, in the form of lower loantovaluation ratios for second and third property loans,
4 See IMF Country Report No. 12/277.

INDONESIA
14 INTERNATIONAL MONETARY FUND
Box 3. Indonesia—Trends in Foreign Exchange Market Development and Functioning
Despite the increasing importance of external flows in the Indonesian economy, the local foreign exchange (FX) market has remained small and illiquid relative to Indonesia’s emerging market (EM) peers. Over the past decade, the growth in the value of FX transactions involving the rupiah has risen more slowly than most other major EM currencies (Figure 1). The weaker growth in rupiah transactions is due primarily to relatively tight restrictions on forward market activity, smaller domestic financial markets, and the high proportion of commodity exports in the balance of payments. Regarding this last factor, FX receipts tend to be used to finance capital imports or are repatriated offshore as profits, and therefore are less likely to be converted into rupiah. Data suggest that liquidity in Indonesia’s FX market has fallen in recent years. Recent evidence of this is the widening in bidask spreads to more than Rp 50 lately compared to an average of Rp 7 in 2010 (Figure 2). Episodes of onshore market illiquidity (notably in September 2011, May 2012, and May 2013) were associated with sharp increases in NDF spreads, as foreign investors were forced to hedge rupiah exposures in offshore markets. 1/ Intraday volatility, measured by the spread between the high bid and low ask rates, has also risen markedly, reflecting not only the rise in global FX volatility, but also the increasingly thin nature of Indonesia’s FX market. Periods of market illiquidity have also tended to coincide with more intensive use of moral suasion by Bank Indonesia (BI). Since August 2013, market functionality has shown signs of improving, with moral suasion easing up, banks able to quote more freely and transact in onshore markets, and overall FX market liquidity gradually increasing. Earlier on, banks’ ability to attract FX from customers (mainly exporters) was restricted by less favorable conditions. Some FX sales by BI also appeared to be directed toward fulfilling the large and lumpy FX needs of state-owned enterprises, including Pertamina (oil and gas) and Perusahann Listrik Negara (electricity), rather than spreading intervention more broadly throughout the interbank market. 2/ These two factors reduced the ability of banks to act as market makers in the interbank market, depressed spot interbank market activity, and inhibited price discovery. Spot interbank volumes fell from a daily average of over US$1 billion in 2010 to less than US$300 million in August 2013 (Figure 3). Since then, interbank FX volumes have picked up modestly, as BI has communicated clearly its intent to refrain from use of moral suasion. A deeper FX market could have a positive impact on foreign investor sentiment and decrease the risk premia for rupiahdenominated assets. Given the likely tapering of unconventional monetary policies and increased uncertainty regarding EM assets, portfolio managers may have to cope with volatile investment flows for some time. Under these conditions, spreads on rupiah-denominated assets could rise further to reflect increasing liquidity premia, unless interbank trading and market making is deepened to improve liquidity. _____________________________
1/ The sharp increase in the volatility of NDF-onshore spreads since mid-2013 appears partly due to a sharp contraction in NDF trading resulting from tighter regulation of these markets in Singapore and changes to the fixing methodology.
2/ In the first half of 2013, Pertamina’s main FX outflows comprised the import of oil products (around US$13 billion) and production- and exploration-related expenses. During the same period, its main inflows came from the export of oil and gas and receipts from global bonds (totaling approximately US$4 billion)

INDONESIA
INTERNATIONAL MONETARY FUND 15
in July 2013. The new measures followed the introduction of tighter regulations on motor vehicle and residential property lending last year. Phased increases in secondary and LDR-linked reserve requirements also began coming into effect in September 2013. In addition, BI made it clear that traders could freely quote exchange rates in the spot market and took other steps to increase hedging opportunities to deepen market activity. The wedge between onshore and offshore rates has contracted and spot liquidity has improved moderately, with BI limiting its interventions to smoothing volatility.
15. Staff’s position. Bank Indonesia should continue to ensure the monetary policy framework has a clear nominal anchor that focuses on bringing headline inflation back within the target band under the central bank’s inflation targeting framework. Policy rate hikes and other liquidity management measures have been a positive step in this direction, also helping to strengthen market perceptions. However, monetary transmission remains weak and has substantial lags. Shortterm money market rates are still at the low end of BI’s interest rate corridor. Thus, the effective policy rate remains negative in real terms. Continued exchange rate flexibility will be necessary to facilitate BOP adjustment and absorb external shocks, while government bonds should remain market determined in order to attract external inflows and to meet official financing needs. To consolidate on recent moves, staff’s main policy recommendations are to:
Further tighten monetary policy if projected inflation remains outside the target band. Building on earlier actions, some additional tightening measures by BI could reinforce investor confidence and stabilize capital flows, as well as firm up the monetary anchor. Foreign exchange swap auctions with resident banks, which started in July 2013, and open market operations (OMO) should be undertaken consistent with policy tightening.
Ensure BI’s inflation targeting framework is supported by a strengthened monetary transmission mechanism and deeper money markets. Bank Indonesia’s practice of allowing money market rates to converge with the deposit facility rate did little to promote market development. Thus, staff would urge BI to improve the transmission mechanism by narrowing the interest corridor and using OMO more aggressively to guide short-term rates back to the middle of the corridor. The introduction of tradable OMO instruments and ongoing IMF technical assistance (TA) to develop secured lending among banks are expected to deepen market activity and make the banking system more resilient to liquidity shocks.
Continue to limit FX market intervention to smoothing volatility. Coupled with clear communication to traders, these actions should stimulate greater price discovery in the interbank FX market, increase trading volumes, and reduce perceived liquidity risks. Bank Indonesia should also continue to scale back FX sales to state-owned enterprises (SOEs) in order to safeguard reserves. At the same time, the authorities should press ahead with plans to improve financial risk management practices at all SOEs, in part aimed at prudent hedging of their FX exposures to mitigate the effects of market volatility, with new regulations issued in October 2013 expected to aid this effort.

INDONESIA
16 INTERNATIONAL MONETARY FUND
16. Authorities’ views. The authorities broadly agreed with staff’s assessment of recent developments and the near-term outlook for financial conditions. They recognized the value of clearly communicating their policy intentions to anchor market expectations, mitigate inward spillovers, and ensure orderly adjustment of the exchange rate and bond yields. While BI officials believed that further monetary policy tightening might be necessary, they indicated that future decisions would remain data dependent, taking account of both domestic and external conditions. They also noted that market expectations of UMP tapering in the United States had posed challenges for their policy response. On inflation targeting, BI officials reaffirmed their commitment to the framework and indicated that they would continue to take a flexible approach, factoring in the slowdown in economic activity and the need to strengthen the monetary transmission mechanism. In this regard, BI viewed staff recommendations as too narrowly focused on policy rates and noted that indirect instruments would also be used to achieve their monetary targets. The authorities welcomed planned IMF TA on deepening money and FX markets.
B. Fiscal Policy
17. Recent developments. The fiscal position has come under increased pressure in recent years owing to rising energy subsidies and lagging revenue growth. Between 2009 and 2012, energy subsidies rose by 2 percentage points of GDP due to rapidly expanding fuel consumption and rising global crude oil prices (Tables 6 and 7 and Figure 7). During the same period, tax revenues grew by only ¾ percentage points of GDP despite rapid increases in household and corporate income and healthy consumption growth. Under these circumstances, fiscal space needed for higher development spending became more constrained. At the same time, public debt levels remained relatively low, anchored by a fiscal rule limiting the general government deficit to no more than 3 percent of GDP a year.
18. Budget performance. In the first half of 2013, fiscal performance continued to be affected by excess subsidy costs and weak revenue growth. In the face of widening fiscal and external imbalances and possible funding pressures, the government increased subsidized fuel prices by an average of 33 percent on June 22. At the same time, the fiscal deficit was revised upward to 2.4 percent of GDP in 2013 from an original target of 1.6 percent of GDP (and against a 2012 outturn of 1.9 percent of GDP) to accommodate fiscal slippages in the first half of year. To garner political support for the fuel price increase, the larger deficit also accommodated temporary cash transfers and other needed assistance (equivalent to 0.2 percent of GDP) to 15 million households most vulnerable to fuel price increases.
19. Staff’s position. Staff noted the need for fiscal policy to support monetary policy in reducing macroeconomic imbalances in order to ensure a stable macro-environment and help lower external pressures. Under staff’s current baseline, the deficit is expected to stay around 2½ percent of GDP in both 2013 and 2014. While this stance is moderately countercyclical, it would put added pressure on the current account and lead to higher borrowing costs, especially if capital inflows are not supportive. Thus, staff recommended the following:
INDONESIA
INTERNATIONAL MONETARY FUND 17
Keep the overall deficit capped at 2 percent of GDP in 2013, to bolster credibility and reduce vulnerability to funding pressures. Staff welcomed the firm action taken by the government in June to contain fuel subsidies and potentially create space for more productive outlays, but noted that the rupiah’s depreciation, high world oil prices, and rising natural gas subsidies were likely to keep the total energy subsidy costs at around 3¾ percent of GDP in 2013—the same level as last year. To contain the deficit, staff urged the authorities to focus on managing spending and further limit energy subsidy costs, including for natural gas, noting that weak export-related revenues and higher interest costs were expected to add to fiscal pressures in the second half of 2013. On their part, the authorities are considering various means of limiting access to subsidized fuel.
Pursue moderate fiscal consolidation in 2014 and over the medium term, limiting the deficit to 1½ percent of GDP next year to help contain external pressures and funding needs, in line with the target set forth in the initial draft of the 2014 budget submitted to Parliament in mid-August 2013. In keeping with this, a final draft of the 2014 budget targeting a deficit of 1.7 percent of GDP was approved by Parliament in late October 2013. However, the target is based on increases in tax revenues and decreases in fuel subsidy costs that are more optimistic than those envisaged by staff, mainly due to the government’s macroeconomic outlook and its lower projected usage of subsidized fuels in 2014.5 Staff noted that to achieve necessary deficit reduction in 2014, firm policy measures would be needed to bolster tax collections and reduce energy subsidies, accompanied by appropriate safety nets.6 Over the near to medium term, space would also be needed for new social protections coming on stream in 2014 (health care) and 2015 (pensions) and greater infrastructure investment to support more inclusive growth.
Anchor medium-term consolidation by rationalizing the energy subsidy regime and mobilizing tax revenues, in order to bring the primary deficit into balance, keep debt levels manageable, and ensure adequate resources for development spending (Appendix 4). On subsidy reform, staff urged replacing broad energy subsidies with targeted cash transfers in line with IMF TA recommendations in this area, building on the current system of transfers already in place. As a step in this direction, staff welcomed the Ministry of Finance (MoF) proposal to move from a fixed subsidized price for fuel to a fixed subsidy, which could deliver substantial savings, urging firm measures be put in place by 2014, also in keeping with G-20 leaders’ commitment to phase out fossil fuel energy subsidies by mid-decade. On revenue growth, more nonoil tax revenue needs to be mobilized through strong administration, enforcement, and compliance, reaping the benefit of the rapid rise in registered taxpayers over the past decade. As noted in last year’s consultation, more could still be done to capture rents and
5 For 2014, the government’s final budget estimates are based on (i) real GDP growth of 6 percent, (ii) an inflation rate of 5.5 percent (y/y), and (iii) an average exchange rate of Rp 10,500 per U.S. dollar, as well as higher gas and oil production and lower subsidized fuel consumption than envisaged by staff. 6 To reduce fuel subsidies by 1 percent of GDP in 2014, subsidized fuel prices would need to be raised by an average of 33 percent or the per liter fuel subsidy would need to restricted to no more than Rp 2,000.
INDONESIA
18 INTERNATIONAL MONETARY FUND
minimize disincentives for investment and production in the resource sector, including oil and gas, with the aim of increasing predictability of revenue streams and reducing the scope for corruption. The export tax of 20 percent, imposed on raw minerals in 2013, has likely led to efficiency losses, given Indonesia’s relative small share of global mining production.
Strengthen cash and debt management, with closer collaboration between the MoF and BI to manage official liquidity and borrowing costs. Under tighter financing conditions observed recently, shortening the maturity profile of primary auctions has helped maintain demand, as investors sought shorter duration. Line ministry accounts in commercial banks should also be consolidated. More liquid debt could also improve monetary policy effectiveness. Along these lines, the MoF and BI should agree on modalities for replacing nonmarketable government securities on the central bank’s balance sheet.7
20. Authorities’ views. The authorities stated their commitment to maintain a prudent fiscal stance and secure access to contingency funds in the event financing conditions were to worsen sharply. Based on recent revisions to their macroeconomic outlook, the government’s deficit target would be less than 2 percent of GDP in 2014 when the proposed 2014 budget is approved by Parliament in late 2013. The authorities broadly agreed on the main focus of structural fiscal reforms. However, in light of the slowdown in growth and political constraints, they expect measured changes in 2014 to improve tax administration, limit access to subsidized fuel, and optimize financing from domestic sources through more transparent debt management. The authorities noted that raising subsidized fuel prices would be politically challenging going into an election year, but remained committed to a gradual phasing-out of energy subsidies. They recognized the important buffer provided by contingent budget support, but did not foresee the need to use it based on their current fiscal outlook.
C. Financial and Corporate Sector Issues
21. Banking system. The banking system appears sound as a whole, with systemic risk remaining low, but some divergence exists across institutions, which warrants close watch in light of rapid credit expansion, recent market turbulence, and incomplete policy buffers. Shadow banking activity is limited, mainly through finance companies, which control less than 10 percent of financial system assets. Financial soundness indicators (FSIs) generally improved in 2012 (Table 8) and compared favorably to major EME and ASEAN peers (Appendix 5). However, some smaller banks are facing liquidity pressures owing to reduced access to interbank or wholesale funding, narrowness of their deposit base, and increased funding costs. Sector weaknesses and a slowing economy could affect asset prices and loan quality. Property prices have accelerated in the past few years (Figure 7), but the overall risk to the banking system remains limited, with property lending accounting for less than 15 percent of banks’ total loans. Concerns remain over the composition of banks’ Tier1 capital and robustness of loan classification and provisioning standards (as raised in the 2010 FSAP). All
7 As of August 2013, these securities totaled Rp 234 trillion (2.6 percent of GDP).
INDONESIA
INTERNATIONAL MONETARY FUND 19
three pillars of Basel II have been implemented, although risk-based supervision is still at a nascent stage. Implementation of Basel III capital standards is slated to begin in 2015, with regulations governing these standards expected to be issued by end‐2013.
22. Corporate sector. Debt levels, including external borrowing, have risen sharply in the past few years, but overall leverage ratios are still relatively low and profitability remains high, with the main exception being the mining sector (Figure 8). Much of the newly contracted external debt is either FDI-related or done by large SOEs—the latter with government guarantees (Box 4). Some corporate borrowing appears to have unhedged FX exposure. Other potential risks mainly stem from a sustained fall in commodity prices or a sharp rise in oil prices.
23. Financial sector oversight. The transfer of banking supervision from BI to Otoritas Jasa Keuangan (OJK), the financial services agency, is on schedule to be completed by the beginning of 2014. The two institutions are formalizing agreements on organizational and human resource issues, data collection and information sharing, and bank regulation, licensing, and supervision. As part of its mandate, OJK continues to develop a new framework for the consolidated supervision of financial conglomerates, which it expects to introduce in 2014 (regulation and oversight of capital markets and the insurance sector came under OJK’s purview in 2012). Bank Indonesia and OJK are also finalizing a memorandum of understanding (MOU) on macro- and microprudential surveillance and policy to ensure a clear delineation of authority and proper channels of communication.
24. Crisis management framework. Currently, the Financial System Stability Forum (FKSSK) plays the central role in guiding crisis management responses. The FKSSK, established by the OJK law, is operating in accordance with protocols embodied in MoUs signed in 2012, which stipulate the basis for coordination by the MoF, BI, OJK and Lembaga Penjamin Simpanan (LPS), the deposit insurance agency. However, crisis management protocols (CMPs), particularly those governing emergency liquidity provisions and interventions in systemically important financial institutions (SIFIs), are lacking. A draft Financial System Safety Net (FSSN) law has been submitted to Parliament addressing these gaps, but its passage is not expected before the 2014 elections.
25. Financial deepening. By deepening financial markets and offering a greater range of products, more domestic savings could be mobilized and capital flows could be better absorbed. Resource allocation as a whole would be expected to improve to support growth, including to fund infrastructure development and other long-term commitments. Bank Indonesia, with IMF TA support, has embarked on a comprehensive strategy for financial market development (Box 5). An immediate priority is to facilitate the development of money markets. This could provide better benchmarks for long-term financing and promote market-making activities. Another key goal is to expand the supply of long-term savings through the growth of the pension and mutual funds industry, which is expected to be guided by the design of the expanded social insurance schemes.

INDONESIA
20 INTERNATIONAL MONETARY FUND
Box 4. Indonesia—Corporate External Financing
Total corporate external debt has risen rapidly in the past five years, but most of this was FDIrelated or by state-owned enterprises (SOEs). Total corporate external debt rose to US$104 billion at endJuly 2013 (latest available data) from US$53 billion at end-2008. However, about 30 percent of this increase was FDIrelated, i.e., financed by parent or affiliated companies. The increase in FDIrelated debt was concentrated in the mining, transportation and communications, and manufacturing sectors, broadly in line with the pattern of total FDI inflows. Another one-third of the increase was incurred by SOEs, mostly Pertamina (oil and natural gas) and Perusahaan Listrik Negara (PLN) (electricity). Private sector nonFDI related debt accounted for the rest of the increase.
Factors explaining the rise in corporate external debt suggest its recent rapid growth poses limited risks going forward. While disbursements of new FDIrelated debt should slow in line with the expected slowdown in overall FDI inflows, existing FDIrelated debt would likely be rolled over by parent and affiliated companies. The rise in SOE external borrowing is more a matter of public debt sustainability, as both Pertamina and PLN benefit from sovereign guarantees. PLN also receives foreign currency loans from the government, onlent from official project financing. While most of the increase in corporate external debt is related to sectors with foreign currency cash flows, some companies are likely exposed to rupiah depreciation. Mining companies could also face additional pressure if commodity prices were to fall further. Excluding FDIrelated external debt, the resource and utilities sectors accounted for 63 percent of total corporate nonfinancial external debt, while some of the remainder has been used to finance tourismrelated and manufactured export activities. Given its relatively short maturity structure, the rollover of corporate external debt could prove challenging if financial conditions were to deteriorate sharply. Most of the principal payments due by end2014 on this type of debt are related to trade credits and revolving loans. However, the bulk of these loans is likely FDIrelated, given that FDIrelated debt accounted for about 64 percent of gross external debt disbursed to nonfinancial corporates for the year ending July 2013. While this should reduce problems with shortterm debt rollover, the recent increase in external yields will quickly be reflected in higher interest costs for corporate borrowers.

INDONESIA
INTERNATIONAL MONETARY FUND 21
Box 5. Indonesia—Financial Market Deepening Financial markets in Indonesia are generally less developed than emerging market peers. As of end-2012, stock market capitalization was equivalent to 49 percent of GDP, with free floating stocks accounting for only 37 percent of the total. Outstanding debt securities issued domestically amounted to 15 percent of GDP, with government securities accounting for 85 percent of the total. Furthermore, the money market is relatively thin and volatile, with trading primarily comprising outright transactions at short horizons up to one month. Similarly, spot transactions dominate trading in the foreign exchange market, with limited use of derivatives such as swaps and options. Daily foreign exchange turnovers only amounted to 0.6 percent of GDP in April 2013, compared to an average of 2.4 percent of GDP among peers.
Deepening financial markets in Indonesia is vital for mobilizing savings to fund investment and providing a wider range of financial products to meet the social needs. In addition, more liquid money and foreign exchange markets would enable the economy to better withstand shocks and enhance policy transmission mechanisms. Similarly, more diversified and deeper capital markets would help intermediate capital inflows without large swings in asset prices, therefore supporting financial stability. The availability of derivative instruments would also allow businesses and households to manage their financial risks more effectively. Finally, a broader and more diversified domestic investor base would bolster the resilience of Indonesia’s financial markets, currently dominated by foreign investors, to global financial shocks, which could cause market turmoil as witnessed in recent months. Indonesia is taking steps to address this issue, with staff recommending an action plan be implemented over the next three years comprising three modules, which individually would address deficiencies in money, foreign exchange, and capital markets. Key actions to be taken are envisaged as follows: Money Market Increase availability and liquidity of short-tenor treasury bills; promote lending at longer horizons; and expand types of
instruments traded, with the development of the Global Master Repurchase Agreement a key. Revise Bank Indonesia (BI)’s monetary operations to improve incentives for money market participation, including
reducing the frequency of open market operations and destigmatizing the use of BI’s lending facility. Strengthen institutional arrangements, including establishing a self-regulatory body and a code of conduct for market
participants.
Foreign Exchange Market Reduce BI’s presence in the foreign exchange market, including relying more on market-based interventions, and
decreasing existing market segmentation arising from BI’s greater interactions with public banks (see Box 3). Employ more flexible reserve requirements to deal with volatility in the foreign exchange market. Review the regulations on derivatives trading to allow for rollover and netting of derivatives; facilitate the development
of new instruments; and enhance the monitoring system to better disseminate market information.
Capital Markets Ease regulatory frictions, such as restrictions on foreign exchange forward contracts and on pension funds’ collateralized
borrowing, which have unintended negative consequences on capital market development. Develop a broader and more diversified domestic investor base by promoting financial inclusion, strengthening the
governance and institutional framework, and facilitating the mobilization of funds from contractual savings to finance investment, especially in infrastructure.
INDONESIA
22 INTERNATIONAL MONETARY FUND
26. Anti-Money Laundering/Combating the Financing of Terrorism (AML/CFT). In February 2013, a new CFT law was enacted that focused on the criminalization of terrorist financing. However, Indonesia is still included on the Financial Action Task Force’s (FATF) list of jurisdictions that have not made sufficient progress in addressing strategic shortcomings in their AML/CFT framework, as the law does not fully address identified deficiencies, particularly with regard to the framework for identifying and freezing terrorist assets. These concerns should be addressed as quickly as possible in order to protect Indonesia’s financial sector from heightened scrutiny from foreign financial institutions, avoid possible countermeasures, and facilitate an exit from the FATF monitoring process.
27. Staff’s position. The banking and corporate sectors are likely to face a more challenging environment than in the recent past, stemming from a slowing economy, rupiah depreciation, and tightening financial conditions. To strengthen buffers, macroprudential oversight and crisis management arrangements need to be augmented, building on BI’s systemic risk framework put in place in recent years. Further progress is also needed on addressing FSAP recommendations, while plans should be in train for completing an FSAP update by 2015. To buttress stability, the main policy recommendations are to:
Closely monitor banks’ and corporates’ financial soundness and risk management practices, while continuing to manage carefully the transfer of banking supervision to OJK, with a focus on ensuring the continuity of supervisory activities. Current macroprudential measures appear adequate, but banks with large restructured loans or heavy exposure to export-related and property sectors need heightened monitoring. In view of tighter financial conditions and the rupiah’s depreciation, corporate leverage ratios and external borrowing should also be systematically monitored.
Fill gaps in existing CMPs, in the absence of passage of the FSSN law, and revise the BI, OJK, LPS, and banking laws to ensure legal consistency. Staff argued that interim protocols (likely by presidential decree) governing the provision of emergency liquidity assistance and interventions in SIFIs should be an immediate priority. While current liquidity pressures reside mainly in smaller banks, clear CMPs coupled with early corrective actions could avoid an amplification of risks. The FKSSK secretariat should focus on serving as a coordinating body by integrating each member’s CMPs into a mutually supportive framework, but refrain from developing its own surveillance capacity.
Establish a well-functioning macroprudential framework. Going forward, BI should take a lead role in systemic risk monitoring and assessment in conducting macroprudential policy and also within the FKSSK, while OJK should drive the implementation of all prudential tools. A clear accountability framework for making policy decisions and exercising these responsibilities needs to be put in place.
28. Authorities’ views. The authorities were in general agreement with staff’s assessments and recommendations. Bank Indonesia noted that banks continue to manage potential risks well. The authorities indicated their desire to see passage of the FSSN law and readiness to amend related
INDONESIA
INTERNATIONAL MONETARY FUND 23
financial sector legislation to ensure a comprehensive and coordinated approach to crisis management.
D. Medium-Term Policy Priorities
29. Overview. It has long been recognized that deep-seated reforms are needed to reduce supply bottlenecks in order to broaden the export base, bolster employment growth, and improve medium-term growth prospects, with a view to reducing poverty and inequality in Indonesia. The need for reform has been given added momentum by the weak outlook for commodity prices and the need to diversify the economy away from the primary resources. While major actions may be more difficult ahead of the elections in mid2014, interim measures could improve the supply response and bolster investor sentiment toward Indonesia.
30. Priorities. The authorities have taken some steps recently to liberalize the investment regime, but a less piecemeal approach is needed to bolster competitiveness. Further efforts are needed to improve the business climate, focused on rationalizing the trade and investment regime and boosting labor productivity, as well as improving financial sector access and efficiency.
Trade and investment. The main priority is to improve the transparency, predictability, and stability of the trade and investment regime and reorient it toward promoting competition and competitiveness. The imposition of quotas on beef and horticultural imports earlier in 2013 led to severe market disruptions and food price hikes, with staff welcoming a move to put in place less restrictive measures aimed at improving supply conditions. The scheduled ban on raw (unprocessed) mineral ore exports in 2014 has also raised uncertainty, with a clear transition plan needed to avoid adding pressures on the current account and to bolster investor confidence in developing onshore mineral processing facilities. More generally speaking, a less restrictive and more investor-friendly negative list for foreign investment, coupled with improvements in transportation, power supply, and logistics, could bolster regional integration and strengthen growth prospects.
Labor markets. Removing impediments to employment generation in the formal sector is critical to raising productivity and output growth and providing opportunities for lowwage workers (Box 6 and Appendix 6). Indonesia’s labor market remains dominated by the informal sector. Currently, only one-third of the labor force has formal sector employment (defined as employees plus the self-employed assisted by permanent workers); the rest of the labor force comprises the informal sector, which is concentrated generally in low-paying work in the agricultural and services sectors. Less than 40 percent of formal and informal sector workers in Indonesia have full-time employment (i.e., work more than 35 hours per week), with this level of underemployment and concentration in informal sectors higher than most of its EME peers. Reducing the rigidity of Indonesia’s labor regulations, particularly with respect to severance pay, would improve Indonesia’s competitiveness and generate jobs to absorb a large pool of underemployed workers (notably in the agricultural sector), supported by higher social spending. Aligning wage increases with productivity growth and redefining the minimum wage as a safety net instrument rather than a tool for collective bargaining would help on this front as well.

INDONESIA
24 INTERNATIONAL MONETARY FUND
Box 6. Indonesia—Structural Transformation and Labor Market Issues Structural transformation of Indonesia’s economy and its labor force has been slow in recent years. In particular, agriculture employment remains exceptionally high, while the productivity differential between the agricultural and manufacturing sectors has been widening. So why has a large share of labor remained in the relatively low-productivity agricultural sector With near to medium-term growth prospects clouded by uncertain external factors and softer commodity prices, reallocating labor to higher productivity areas may be a key to sustaining growth and avoiding a middle-income trap, but rigid labor market regulations are one factor hindering this transformation.
Despite its low productivity relative to other sectors, the agricultural sector continues to employ over one-third of the labor force in Indonesia. Although the employment share in agriculture has declined by 20 percentage points over the last two decades, most of this labor has been absorbed by the services sector instead of the more productive manufacturing sector. In fact, the manufacturing sector’s share of the economy has declined significantly over the past decade, contributing to only 24 percent of GDP in 2011 and providing less than 15 percent of the workforce—both among the lowest contributors to output and employment in the region.
This factor highlights Indonesia’s inefficient allocation of labor across sectors, which puts it at risk of being ensnared in a middleincome trap. Among 46 emerging and developing countries for which data in 2007 are available in the World Development Indicators database, Indonesia stands out with one of the highest employment shares in agriculture (7th), but also with one of the lowest levels of agricultural productivity relative to manufacturing productivity (6th). A hypothetical labor reallocation from the current shares to the average of sample countries (24 percent in agriculture, 23 percent in manufacturing, and 53 percent in services), keeping the labor productivity in each sector unchanged, would raise Indonesia’s aggregate labor productivity and income per capita by as much as 13 percent.1/
Rigid labor market regulations have undermined the manufacturing sector’s capacity to transform output growth into employment opportunities, especially for large and exporting firms. The growth in labor costs in manufacturing has outpaced productivity gains, leading to rising unit labor costs and a move away from labor-intensive manufacturing sectors. Factors behind the increase in unit labor costs have been high minimum wage levels relative to average wages, frequent adjustments to minimum wages themselves, and indexation of most wage contracts to minimum wage increases. Strict labor regulations governing severance payments, limits on the use of fixed-term contracts, and outsourcing restrictions have also significantly added to labor costs, especially in the manufacturing sector, where they tend to be the most binding.
Reducing these rigidities, as well as aligning minimum wage increases with productivity growth, would help improve competitiveness in Indonesia’s manufacturing sector, and provide greater opportunities to low-wage, informal sector workers. These actions would in turn help generate the jobs needed to absorb a larger pool of labor in the agriculture sector, raise per capita income, and potentially position Indonesia to expand its export base. With women more likely to be informal workers and the majority of informal workers poor,2 structural transformations accompanying formal employment creation should help promote gender equality and enhance macro-social stability.
________________________________
1/ Aggregate labor productivity is the employment-weighted average of sector-level labor productivity. A conceptual background for this box is provided in Appendix 6.
2/ See Indonesia Jobs Report: Towards Better Jobs and Security for All, World Bank (2010).

INDONESIA
INTERNATIONAL MONETARY FUND 25
STAFF APPRAISAL 31. Indonesia faces a more challenging macroeconomic environment, stemming initially from slowing growth in major EMEs and falling commodity prices, and more recently, from capital outflows and tighter funding conditions tied to a prospective exit from extraordinarily easy global monetary conditions. This reversal in tailwinds, coupled with an accommodative policy stance, has put pressure on Indonesia’s BOP. Recent market volatility and reserve losses highlight the need in Indonesia for upfront policy tightening to ease external and fiscal pressures and firm actions over the medium term to reduce supply bottlenecks.
32. Downside risks have become more pronounced over the past year. Indonesia is vulnerable to protracted volatility in EMEs, exacerbated by a disorderly unwinding of UMPs in advanced economies and/or a more pronounced growth slowdown among major trade partners, including China and India, in combination with a further softening in commodity prices. A deterioration in investor sentiment, prompted by external conditions and policy uncertainty in Indonesia, could intensify macroeconomic pressures and feed back into confidence. At the same time, EBA’s REER estimates show the exchange rate to be broadly in line with fundamentals, while debt levels remain relatively low and resilient to standard shocks.
33. The near-term outlook reflects emerging challenges. Growth is projected to slow in 2013 and 2014 on weaker investment and external demand. Inflation will likely peak by end2013 before moderating, with second-round effects of earlier fuel price increases and exchange rate passthrough driving near-term momentum. The current account deficit is expected to widen further in 2013 and narrow only slightly in 2014, despite recent exchange rate adjustment, with the outlook reflecting soft export demand and commodity prices and a continued rise in net oil and gas imports. The projected slowdown in FDI and volatility of portfolio flows will make Indonesia more vulnerable to external shocks in the near term. Reserve losses, which have been sizable in the past year, are expected to slow going forward, with capital inflows foreseen to pick up gradually and the flexible exchange rate facilitating adjustment of the current account.
34. Recent policy measures show signs of easing pressures and reducing vulnerabilities. The authorities have taken significant steps in recent months to contain external and fiscal imbalances, reduce inflation pressures, and manage market volatility. Staff welcome moves to roll back energy subsidies, tighten monetary policy, and allow exchange rates and bond yields to adjust, as well as measures aimed at improving business sentiment. Clear coordination and communication of the policy framework will improve its overall effectiveness. Contingent financing arrangements put in place should help cushion the impact of any new shocks or prolonged market disruptions.
35. Nonetheless, the current environment warrants continued vigilance, in order to consolidate recent stabilization efforts. The current delay in the tapering of UMPs should be seen as an opportunity to strengthen policy and financial buffers and improve market perceptions. Foremost, the current account deficit needs to be reduced to a sustainable level and inflation placed firmly within the target band. Further policy rate hikes by BI may be necessary if BOP or inflation
INDONESIA
26 INTERNATIONAL MONETARY FUND
pressures do not subside. Fiscal policy should support monetary policy in order to contain external pressures, while needing to provide adequate space for new social protections and higher capital spending. In keeping with this, fiscal consolidation, targeted at bringing the primary deficit back into balance, will require bolstering tax collections and eliminating energy subsidies over the medium term, supported by efforts aimed at better prioritizing expenditures. To manage volatility and encourage capital inflows, the exchange and interest rates should remain flexible, which will also assist in boosting reserve buffers.
36. Maintaining a stable financial system requires that Indonesia have in place a framework and contingencies for managing systemic risks. With bank supervision in transition between regulators, special attention will be needed to avoid oversight gaps. Responsibilities for macro and microprudential surveillance should be clearly delineated, supported by actions to strengthen the financial stability architecture. Banks’ asset quality and capital positions are generally sound, but financial indicators bear close watch given rapid credit expansion in recent years, the rise in LDRs, and the recent slowdown in economic activity. Further efforts should be made to strengthen the AML/CFT regime in line with the FATF’s recommendations.
37. Broader reforms are needed to raise productivity, create new export opportunities, and support higher, more inclusive growth. The government should focus on accelerating infrastructure investment, addressing labor market rigidities, deepening financial markets, and creating a more open trade and investment regime. The government announced several measures in mid2013 aimed at addressing these shortcomings, but more comprehensive and cohesive actions are needed to bolster investor confidence and achieve potential growth.
38. It is recommended that the next Article IV consultation take place on the standard 12month cycle.
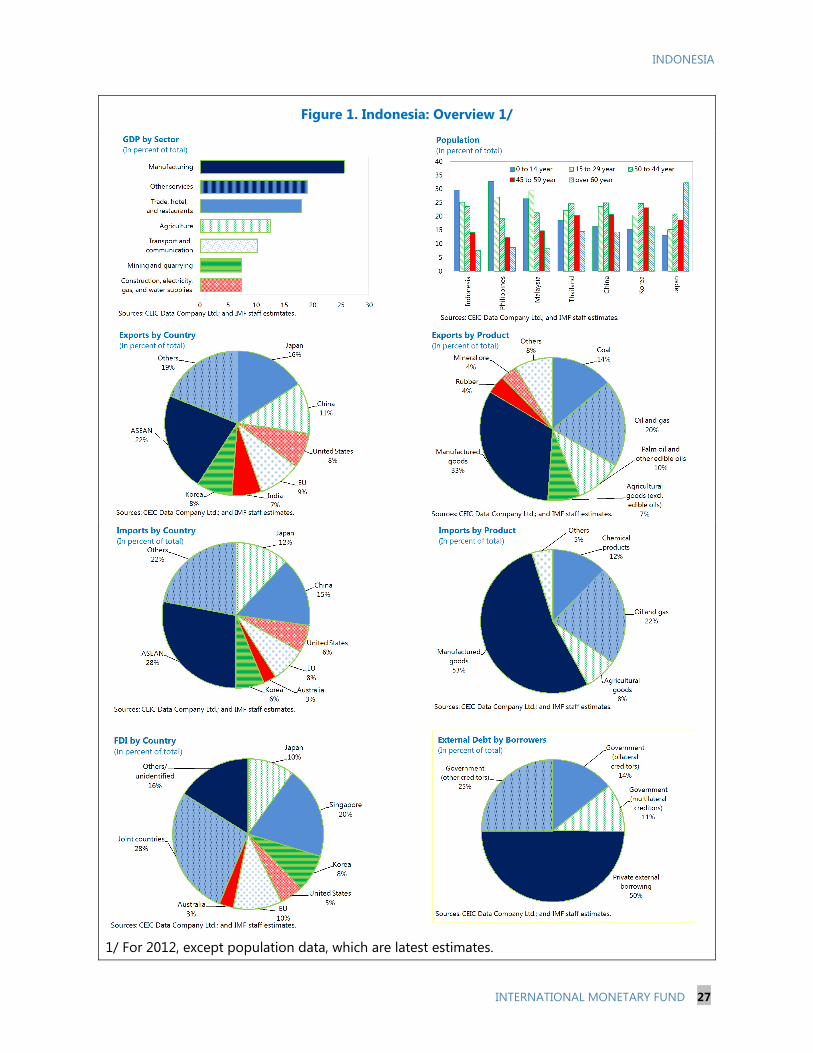
INDONESIA
INTERNATIONAL MONETARY FUND 27
Figure 1. Indonesia: Overview 1/
1/ For 2012, except population data, which are latest estimates.
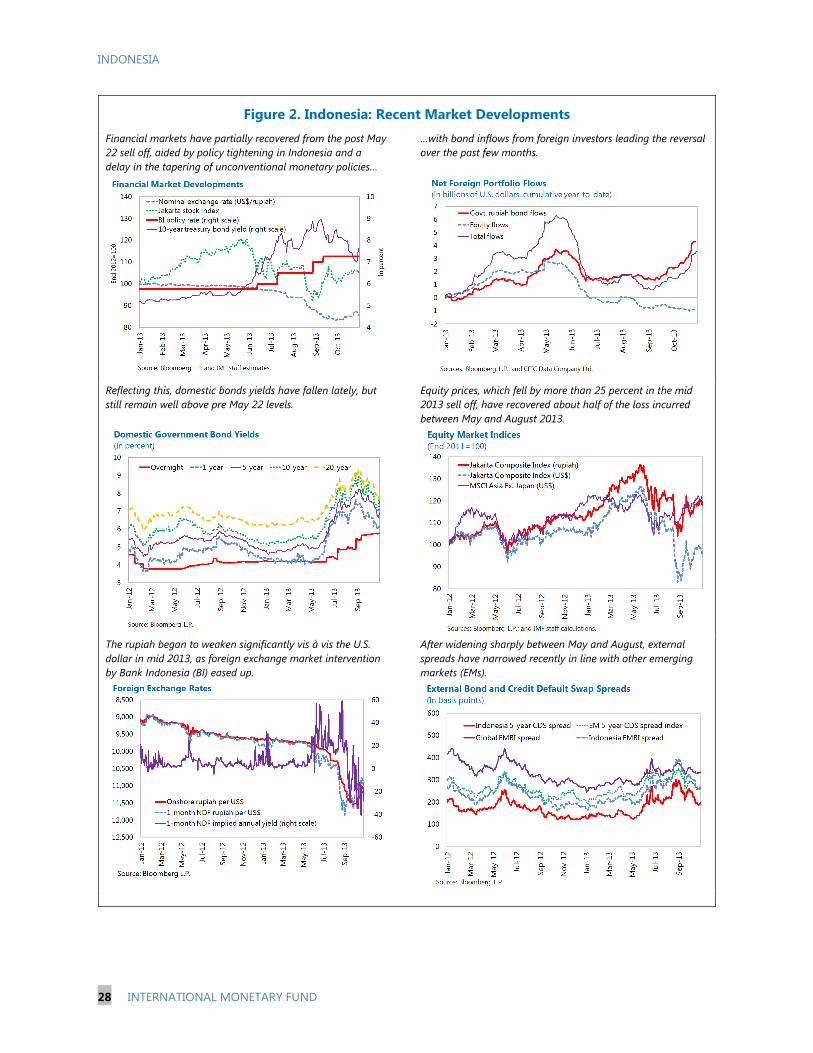
INDONESIA
28 INTERNATIONAL MONETARY FUND
Figure 2. Indonesia: Recent Market Developments
Financial markets have partially recovered from the post May 22 sell off, aided by policy tightening in Indonesia and a delay in the tapering of unconventional monetary policies…
…with bond inflows from foreign investors leading the reversal over the past few months.
Reflecting this, domestic bonds yields have fallen lately, but still remain well above pre May 22 levels.
Equity prices, which fell by more than 25 percent in the mid 2013 sell off, have recovered about half of the loss incurred between May and August 2013.
The rupiah began to weaken significantly vis à vis the U.S. dollar in mid 2013, as foreign exchange market intervention by Bank Indonesia (BI) eased up.
After widening sharply between May and August, external spreads have narrowed recently in line with other emerging markets (EMs).
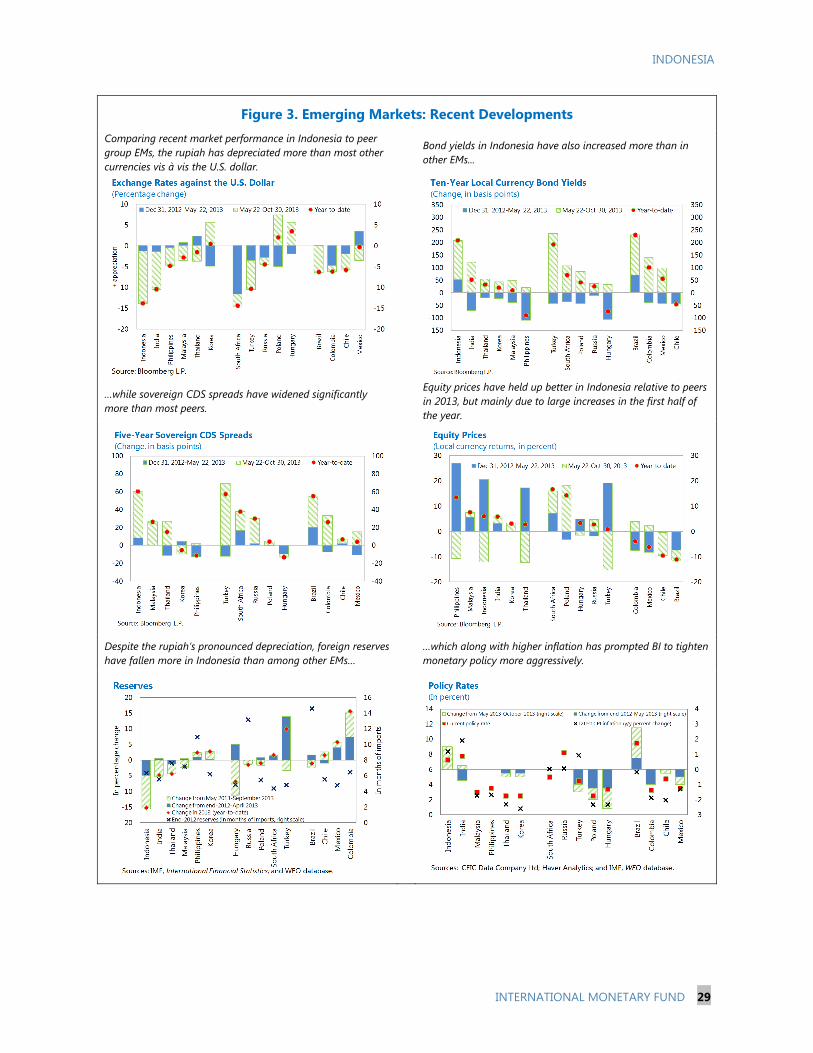
INDONESIA
INTERNATIONAL MONETARY FUND 29
Figure 3. Emerging Markets: Recent Developments
Comparing recent market performance in Indonesia to peer group EMs, the rupiah has depreciated more than most other currencies vis à vis the U.S. dollar.
Bond yields in Indonesia have also increased more than in other EMs...
…while sovereign CDS spreads have widened significantly more than most peers.
Equity prices have held up better in Indonesia relative to peers in 2013, but mainly due to large increases in the first half of the year.
Despite the rupiah’s pronounced depreciation, foreign reserves have fallen more in Indonesia than among other EMs…
…which along with higher inflation has prompted BI to tighten monetary policy more aggressively.
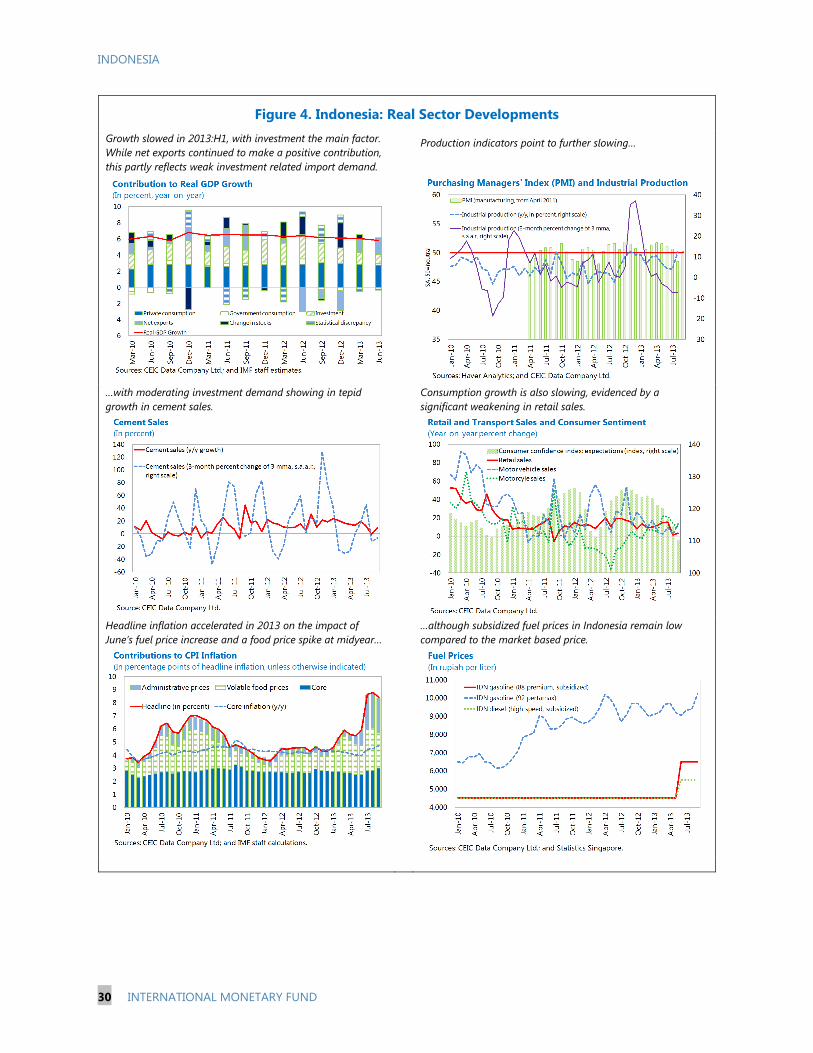
INDONESIA
30 INTERNATIONAL MONETARY FUND
Figure 4. Indonesia: Real Sector Developments
Growth slowed in 2013:H1, with investment the main factor. While net exports continued to make a positive contribution, this partly reflects weak investment related import demand.
Production indicators point to further slowing…
…with moderating investment demand showing in tepid growth in cement sales.
Consumption growth is also slowing, evidenced by a significant weakening in retail sales.
Headline inflation accelerated in 2013 on the impact of June’s fuel price increase and a food price spike at midyear…
…although subsidized fuel prices in Indonesia remain low compared to the market based price.

INDONESIA
INTERNATIONAL MONETARY FUND 31
Figure 5. Indonesia: External Sector Developments
The current account balance shifted into a deficit at end2011 due to deterioration in both the oil and nonoil trade balances, with reserves also coming under pressure.
Exports have slowed more sharply than imports…
…reflecting weaker commodity prices... …with key commodity export prices unlikely to pick up going into 2014.
Still, export volumes have shown some signs of recovery… …while import growth remains depressed due mainly to raw materials and capital goods.

INDONESIA
32 INTERNATIONAL MONETARY FUND
Figure 6. Indonesia: Monetary and Interest Rate Developments
Monetary policy has been tightened, with the BI rate and deposit facility rate increased by 150 bps since June 2013.
However, overnight money market rates are still close to the bottom of the interest rate corridor, as liquidity conditions have yet to firm significantly…
…with real short term rates remaining low by most measures…
...and broad money and credit growth only moderating slowly.
Funding pressures may be rising as loan to deposit ratios continue to increase…
…but this is only beginning to be reflected in retail lending and deposit rates, suggesting lags in the monetary transmission mechanism.
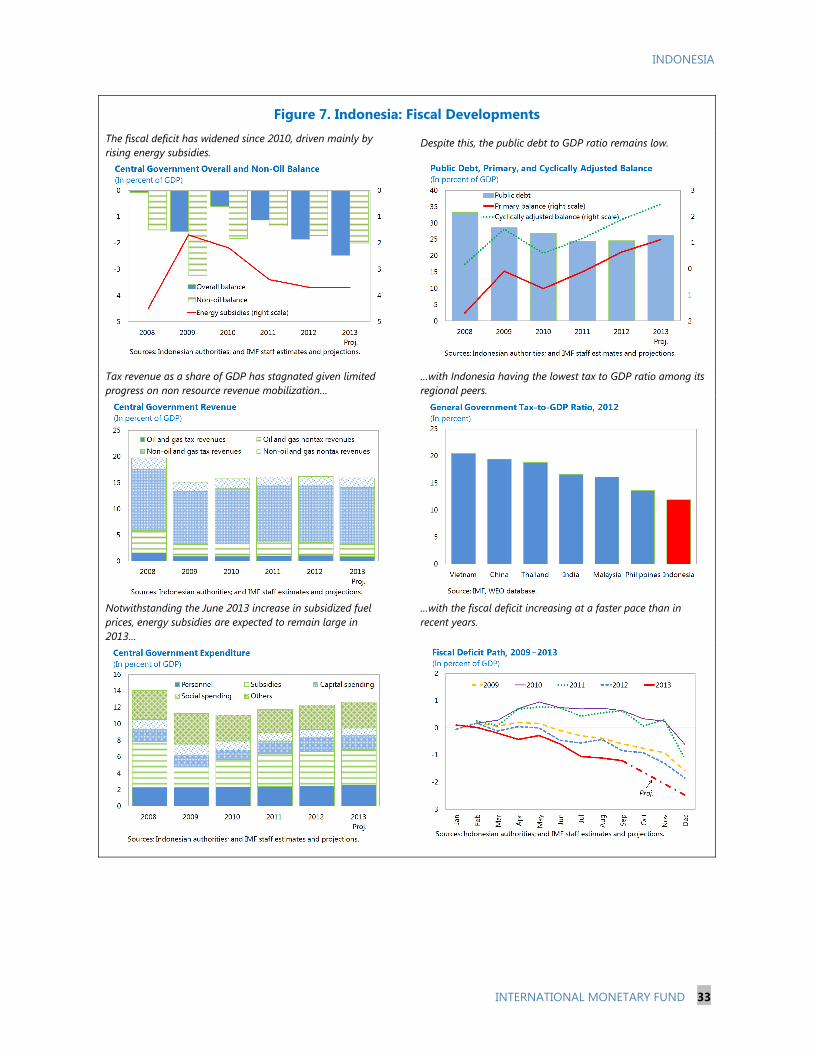
INDONESIA
INTERNATIONAL MONETARY FUND 33
Figure 7. Indonesia: Fiscal Developments The fiscal deficit has widened since 2010, driven mainly by rising energy subsidies.
Despite this, the public debt to GDP ratio remains low.
Tax revenue as a share of GDP has stagnated given limited progress on non resource revenue mobilization…
…with Indonesia having the lowest tax to GDP ratio among its regional peers.
Notwithstanding the June 2013 increase in subsidized fuel prices, energy subsidies are expected to remain large in 2013…
…with the fiscal deficit increasing at a faster pace than in recent years.

INDONESIA
34 INTERNATIONAL MONETARY FUND
Figure 8. Indonesia: Financial and Corporate Sector Soundness Indicators Banks generally remain well capitalized… …although there are early signs that asset quality may be
deteriorating.
Corporates have remained profitable, but liquidity measures have weakened slightly.
Leverage ratios have shown signs of rising, reflecting a surge in foreign currency debt issues.
Equity valuations have come down lately with the mid 2013 sell off.
Property prices have risen rapidly in recent years, especially in the Jakarta area.
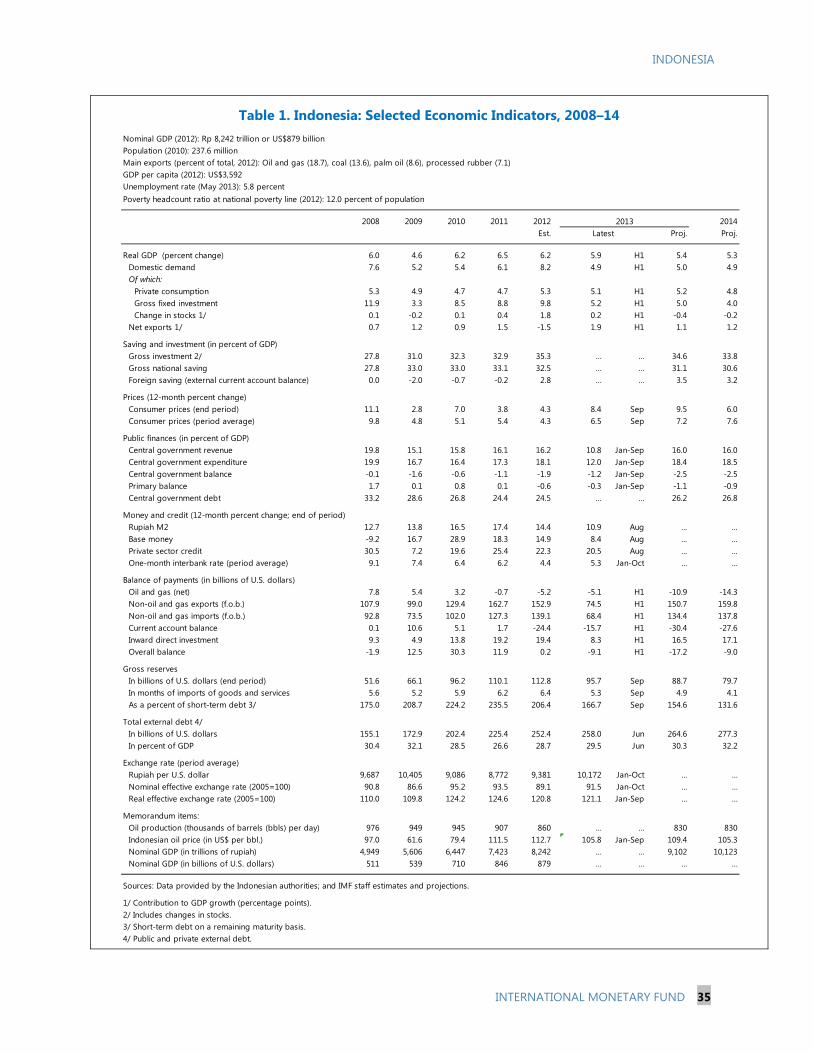
INDONESIA
INTERNATIONAL MONETARY FUND 35
Table 1. Indonesia: Selected Economic Indicators, 2008–14
Nominal GDP (2012): Rp 8,242 trillion or US$879 billionPopulation (2010): 237.6 millionMain exports (percent of total, 2012): Oil and gas (18.7), coal (13.6), palm oil (8.6), processed rubber (7.1)GDP per capita (2012): US$3,592Unemployment rate (May 2013): 5.8 percentPoverty headcount ratio at national poverty line (2012): 12.0 percent of population
2008 2009 2010 2011 2012 2014Est. Proj. Proj.
Real GDP (percent change) 6.0 4.6 6.2 6.5 6.2 5.9 H1 5.4 5.3Domestic demand 7.6 5.2 5.4 6.1 8.2 4.9 H1 5.0 4.9Of which:
Private consumption 5.3 4.9 4.7 4.7 5.3 5.1 H1 5.2 4.8Gross fixed investment 11.9 3.3 8.5 8.8 9.8 5.2 H1 5.0 4.0Change in stocks 1/ 0.1 -0.2 0.1 0.4 1.8 0.2 H1 -0.4 -0.2
Net exports 1/ 0.7 1.2 0.9 1.5 -1.5 1.9 H1 1.1 1.2
Saving and investment (in percent of GDP)Gross investment 2/ 27.8 31.0 32.3 32.9 35.3 … … 34.6 33.8Gross national saving 27.8 33.0 33.0 33.1 32.5 … … 31.1 30.6Foreign saving (external current account balance) 0.0 -2.0 -0.7 -0.2 2.8 … … 3.5 3.2
Prices (12-month percent change)Consumer prices (end period) 11.1 2.8 7.0 3.8 4.3 8.4 Sep 9.5 6.0Consumer prices (period average) 9.8 4.8 5.1 5.4 4.3 6.5 Sep 7.2 7.6
Public finances (in percent of GDP) Central government revenue 19.8 15.1 15.8 16.1 16.2 10.8 Jan-Sep 16.0 16.0Central government expenditure 19.9 16.7 16.4 17.3 18.1 12.0 Jan-Sep 18.4 18.5Central government balance -0.1 -1.6 -0.6 -1.1 -1.9 -1.2 Jan-Sep -2.5 -2.5Primary balance 1.7 0.1 0.8 0.1 -0.6 -0.3 Jan-Sep -1.1 -0.9Central government debt 33.2 28.6 26.8 24.4 24.5 … … 26.2 26.8
Money and credit (12-month percent change; end of period)Rupiah M2 12.7 13.8 16.5 17.4 14.4 10.9 Aug ... ...Base money -9.2 16.7 28.9 18.3 14.9 8.4 Aug ... ...Private sector credit 30.5 7.2 19.6 25.4 22.3 20.5 Aug ... ...One-month interbank rate (period average) 9.1 7.4 6.4 6.2 4.4 5.3 Jan-Oct … …
Balance of payments (in billions of U.S. dollars)Oil and gas (net) 7.8 5.4 3.2 -0.7 -5.2 -5.1 H1 -10.9 -14.3Non-oil and gas exports (f.o.b.) 107.9 99.0 129.4 162.7 152.9 74.5 H1 150.7 159.8Non-oil and gas imports (f.o.b.) 92.8 73.5 102.0 127.3 139.1 68.4 H1 134.4 137.8Current account balance 0.1 10.6 5.1 1.7 -24.4 -15.7 H1 -30.4 -27.6Inward direct investment 9.3 4.9 13.8 19.2 19.4 8.3 H1 16.5 17.1Overall balance -1.9 12.5 30.3 11.9 0.2 -9.1 H1 -17.2 -9.0
Gross reservesIn billions of U.S. dollars (end period) 51.6 66.1 96.2 110.1 112.8 95.7 Sep 88.7 79.7In months of imports of goods and services 5.6 5.2 5.9 6.2 6.4 5.3 Sep 4.9 4.1As a percent of short-term debt 3/ 175.0 208.7 224.2 235.5 206.4 166.7 Sep 154.6 131.6
Total external debt 4/In billions of U.S. dollars 155.1 172.9 202.4 225.4 252.4 258.0 Jun 264.6 277.3In percent of GDP 30.4 32.1 28.5 26.6 28.7 29.5 Jun 30.3 32.2
Exchange rate (period average)Rupiah per U.S. dollar 9,687 10,405 9,086 8,772 9,381 10,172 Jan-Oct … …Nominal effective exchange rate (2005=100) 90.8 86.6 95.2 93.5 89.1 91.5 Jan-Oct … …Real effective exchange rate (2005=100) 110.0 109.8 124.2 124.6 120.8 121.1 Jan-Sep … …
Memorandum items:Oil production (thousands of barrels (bbls) per day) 976 949 945 907 860 … … 830 830Indonesian oil price (in US$ per bbl.) 97.0 61.6 79.4 111.5 112.7 105.8 Jan-Sep 109.4 105.3Nominal GDP (in trillions of rupiah) 4,949 5,606 6,447 7,423 8,242 … … 9,102 10,123Nominal GDP (in billions of U.S. dollars) 511 539 710 846 879 … … … …
Sources: Data provided by the Indonesian authorities; and IMF staff estimates and projections.
1/ Contribution to GDP growth (percentage points). 2/ Includes changes in stocks. 3/ Short-term debt on a remaining maturity basis.4/ Public and private external debt.
2013Latest
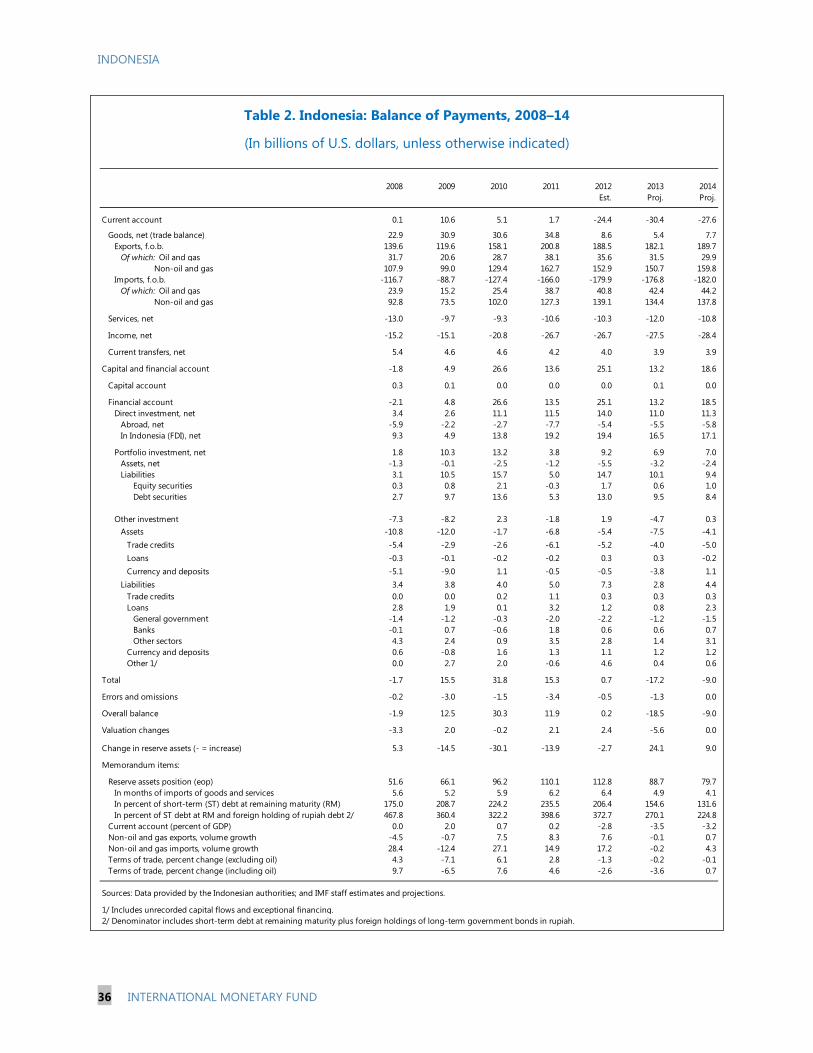
INDONESIA
36 INTERNATIONAL MONETARY FUND
Table 2. Indonesia: Balance of Payments, 2008–14
(In billions of U.S. dollars, unless otherwise indicated)
2008 2009 2010 2011 2012 2013 2014Est. Proj. Proj.
Current account 0.1 10.6 5.1 1.7 -24.4 -30.4 -27.6
Goods, net (trade balance) 22.9 30.9 30.6 34.8 8.6 5.4 7.7Exports, f.o.b. 139.6 119.6 158.1 200.8 188.5 182.1 189.7
Of which: Oil and gas 31.7 20.6 28.7 38.1 35.6 31.5 29.9 Non-oil and gas 107.9 99.0 129.4 162.7 152.9 150.7 159.8
Imports, f.o.b. -116.7 -88.7 -127.4 -166.0 -179.9 -176.8 -182.0Of which: Oil and gas 23.9 15.2 25.4 38.7 40.8 42.4 44.2 Non-oil and gas 92.8 73.5 102.0 127.3 139.1 134.4 137.8
Services, net -13.0 -9.7 -9.3 -10.6 -10.3 -12.0 -10.8
Income, net -15.2 -15.1 -20.8 -26.7 -26.7 -27.5 -28.4
Current transfers, net 5.4 4.6 4.6 4.2 4.0 3.9 3.9
Capital and financial account -1.8 4.9 26.6 13.6 25.1 13.2 18.6
Capital account 0.3 0.1 0.0 0.0 0.0 0.1 0.0
Financial account -2.1 4.8 26.6 13.5 25.1 13.2 18.5Direct investment, net 3.4 2.6 11.1 11.5 14.0 11.0 11.3
Abroad, net -5.9 -2.2 -2.7 -7.7 -5.4 -5.5 -5.8In Indonesia (FDI), net 9.3 4.9 13.8 19.2 19.4 16.5 17.1
Portfolio investment, net 1.8 10.3 13.2 3.8 9.2 6.9 7.0Assets, net -1.3 -0.1 -2.5 -1.2 -5.5 -3.2 -2.4Liabilities 3.1 10.5 15.7 5.0 14.7 10.1 9.4
Equity securities 0.3 0.8 2.1 -0.3 1.7 0.6 1.0Debt securities 2.7 9.7 13.6 5.3 13.0 9.5 8.4
Other investment -7.3 -8.2 2.3 -1.8 1.9 -4.7 0.3Assets -10.8 -12.0 -1.7 -6.8 -5.4 -7.5 -4.1
Trade credits -5.4 -2.9 -2.6 -6.1 -5.2 -4.0 -5.0Loans -0.3 -0.1 -0.2 -0.2 0.3 0.3 -0.2Currency and deposits -5.1 -9.0 1.1 -0.5 -0.5 -3.8 1.1
Liabilities 3.4 3.8 4.0 5.0 7.3 2.8 4.4Trade credits 0.0 0.0 0.2 1.1 0.3 0.3 0.3Loans 2.8 1.9 0.1 3.2 1.2 0.8 2.3
General government -1.4 -1.2 -0.3 -2.0 -2.2 -1.2 -1.5Banks -0.1 0.7 -0.6 1.8 0.6 0.6 0.7Other sectors 4.3 2.4 0.9 3.5 2.8 1.4 3.1
Currency and deposits 0.6 -0.8 1.6 1.3 1.1 1.2 1.2Other 1/ 0.0 2.7 2.0 -0.6 4.6 0.4 0.6
Total -1.7 15.5 31.8 15.3 0.7 -17.2 -9.0
Errors and omissions -0.2 -3.0 -1.5 -3.4 -0.5 -1.3 0.0
Overall balance -1.9 12.5 30.3 11.9 0.2 -18.5 -9.0
Valuation changes -3.3 2.0 -0.2 2.1 2.4 -5.6 0.0
Change in reserve assets (- = increase) 5.3 -14.5 -30.1 -13.9 -2.7 24.1 9.0
Memorandum items:
Reserve assets position (eop) 51.6 66.1 96.2 110.1 112.8 88.7 79.7In months of imports of goods and services 5.6 5.2 5.9 6.2 6.4 4.9 4.1In percent of short-term (ST) debt at remaining maturity (RM) 175.0 208.7 224.2 235.5 206.4 154.6 131.6In percent of ST debt at RM and foreign holding of rupiah debt 2/ 467.8 360.4 322.2 398.6 372.7 270.1 224.8
Current account (percent of GDP) 0.0 2.0 0.7 0.2 -2.8 -3.5 -3.2Non-oil and gas exports, volume growth -4.5 -0.7 7.5 8.3 7.6 -0.1 0.7Non-oil and gas imports, volume growth 28.4 -12.4 27.1 14.9 17.2 -0.2 4.3Terms of trade, percent change (excluding oil) 4.3 -7.1 6.1 2.8 -1.3 -0.2 -0.1Terms of trade, percent change (including oil) 9.7 -6.5 7.6 4.6 -2.6 -3.6 0.7
Sources: Data provided by the Indonesian authorities; and IMF staff estimates and projections.
2/ Denominator includes short-term debt at remaining maturity plus foreign holdings of long-term government bonds in rupiah.1/ Includes unrecorded capital flows and exceptional financing.
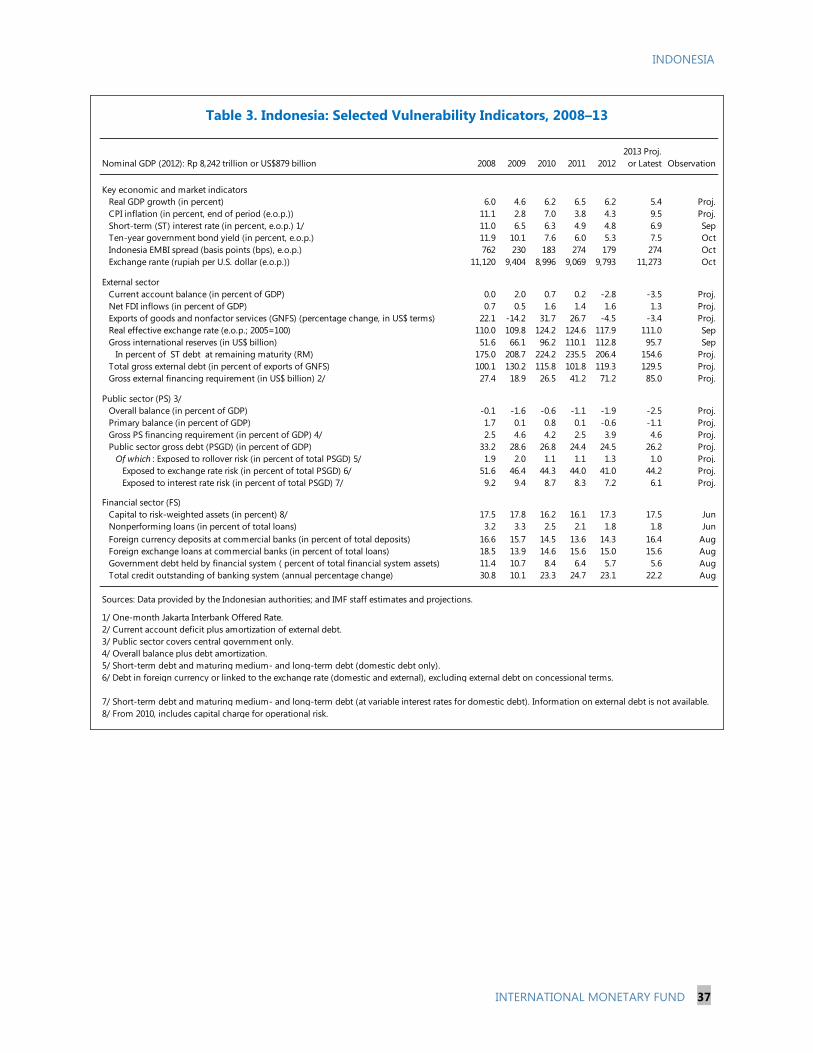
INDONESIA
INTERNATIONAL MONETARY FUND 37
Table 3. Indonesia: Selected Vulnerability Indicators, 2008–13
2013 Proj.Nominal GDP (2012): Rp 8,242 trillion or US$879 billion 2008 2009 2010 2011 2012 or Latest Observation
Key economic and market indicatorsReal GDP growth (in percent) 6.0 4.6 6.2 6.5 6.2 5.4 Proj.CPI inflation (in percent, end of period (e.o.p.)) 11.1 2.8 7.0 3.8 4.3 9.5 Proj.Short-term (ST) interest rate (in percent, e.o.p.) 1/ 11.0 6.5 6.3 4.9 4.8 6.9 SepTen-year government bond yield (in percent, e.o.p.) 11.9 10.1 7.6 6.0 5.3 7.5 OctIndonesia EMBI spread (basis points (bps), e.o.p.) 762 230 183 274 179 274 OctExchange rante (rupiah per U.S. dollar (e.o.p.)) 11,120 9,404 8,996 9,069 9,793 11,273 Oct
External sectorCurrent account balance (in percent of GDP) 0.0 2.0 0.7 0.2 -2.8 -3.5 Proj.Net FDI inflows (in percent of GDP) 0.7 0.5 1.6 1.4 1.6 1.3 Proj.Exports of goods and nonfactor services (GNFS) (percentage change, in US$ terms) 22.1 -14.2 31.7 26.7 -4.5 -3.4 Proj.Real effective exchange rate (e.o.p.; 2005=100) 110.0 109.8 124.2 124.6 117.9 111.0 SepGross international reserves (in US$ billion) 51.6 66.1 96.2 110.1 112.8 95.7 Sep
In percent of ST debt at remaining maturity (RM) 175.0 208.7 224.2 235.5 206.4 154.6 Proj.Total gross external debt (in percent of exports of GNFS) 100.1 130.2 115.8 101.8 119.3 129.5 Proj.Gross external financing requirement (in US$ billion) 2/ 27.4 18.9 26.5 41.2 71.2 85.0 Proj.
Public sector (PS) 3/Overall balance (in percent of GDP) -0.1 -1.6 -0.6 -1.1 -1.9 -2.5 Proj.Primary balance (in percent of GDP) 1.7 0.1 0.8 0.1 -0.6 -1.1 Proj.Gross PS financing requirement (in percent of GDP) 4/ 2.5 4.6 4.2 2.5 3.9 4.6 Proj.Public sector gross debt (PSGD) (in percent of GDP) 33.2 28.6 26.8 24.4 24.5 26.2 Proj.
Of which : Exposed to rollover risk (in percent of total PSGD) 5/ 1.9 2.0 1.1 1.1 1.3 1.0 Proj.Exposed to exchange rate risk (in percent of total PSGD) 6/ 51.6 46.4 44.3 44.0 41.0 44.2 Proj.Exposed to interest rate risk (in percent of total PSGD) 7/ 9.2 9.4 8.7 8.3 7.2 6.1 Proj.
Financial sector (FS) Capital to risk-weighted assets (in percent) 8/ 17.5 17.8 16.2 16.1 17.3 17.5 JunNonperforming loans (in percent of total loans) 3.2 3.3 2.5 2.1 1.8 1.8 JunForeign currency deposits at commercial banks (in percent of total deposits) 16.6 15.7 14.5 13.6 14.3 16.4 AugForeign exchange loans at commercial banks (in percent of total loans) 18.5 13.9 14.6 15.6 15.0 15.6 AugGovernment debt held by financial system ( percent of total financial system assets) 11.4 10.7 8.4 6.4 5.7 5.6 AugTotal credit outstanding of banking system (annual percentage change) 30.8 10.1 23.3 24.7 23.1 22.2 Aug
Sources: Data provided by the Indonesian authorities; and IMF staff estimates and projections.
3/ Public sector covers central government only.
1/ One-month Jakarta Interbank Offered Rate.2/ Current account deficit plus amortization of external debt.
4/ Overall balance plus debt amortization.5/ Short-term debt and maturing medium- and long-term debt (domestic debt only).6/ Debt in foreign currency or linked to the exchange rate (domestic and external), excluding external debt on concessional terms.
8/ From 2010, includes capital charge for operational risk.7/ Short-term debt and maturing medium- and long-term debt (at variable interest rates for domestic debt). Information on external debt is not available.
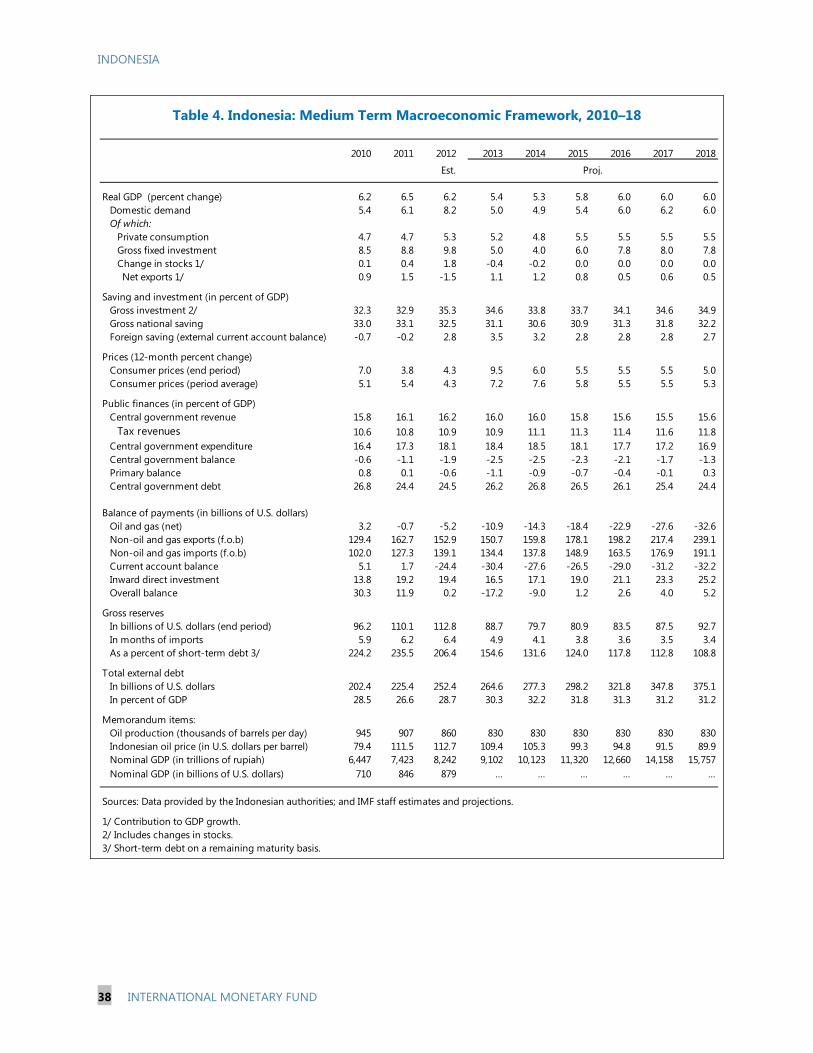
INDONESIA
38 INTERNATIONAL MONETARY FUND
Table 4. Indonesia: Medium Term Macroeconomic Framework, 2010–18
2010 2011 2012 2013 2014 2015 2016 2017 2018
Est.
Real GDP (percent change) 6.2 6.5 6.2 5.4 5.3 5.8 6.0 6.0 6.0Domestic demand 5.4 6.1 8.2 5.0 4.9 5.4 6.0 6.2 6.0Of which:
Private consumption 4.7 4.7 5.3 5.2 4.8 5.5 5.5 5.5 5.5Gross fixed investment 8.5 8.8 9.8 5.0 4.0 6.0 7.8 8.0 7.8Change in stocks 1/ 0.1 0.4 1.8 -0.4 -0.2 0.0 0.0 0.0 0.0
Net exports 1/ 0.9 1.5 -1.5 1.1 1.2 0.8 0.5 0.6 0.5
Saving and investment (in percent of GDP)Gross investment 2/ 32.3 32.9 35.3 34.6 33.8 33.7 34.1 34.6 34.9Gross national saving 33.0 33.1 32.5 31.1 30.6 30.9 31.3 31.8 32.2Foreign saving (external current account balance) -0.7 -0.2 2.8 3.5 3.2 2.8 2.8 2.8 2.7
Prices (12-month percent change)Consumer prices (end period) 7.0 3.8 4.3 9.5 6.0 5.5 5.5 5.5 5.0Consumer prices (period average) 5.1 5.4 4.3 7.2 7.6 5.8 5.5 5.5 5.3
Public finances (in percent of GDP) Central government revenue 15.8 16.1 16.2 16.0 16.0 15.8 15.6 15.5 15.6
Tax revenues 10.6 10.8 10.9 10.9 11.1 11.3 11.4 11.6 11.8Central government expenditure 16.4 17.3 18.1 18.4 18.5 18.1 17.7 17.2 16.9Central government balance -0.6 -1.1 -1.9 -2.5 -2.5 -2.3 -2.1 -1.7 -1.3Primary balance 0.8 0.1 -0.6 -1.1 -0.9 -0.7 -0.4 -0.1 0.3Central government debt 26.8 24.4 24.5 26.2 26.8 26.5 26.1 25.4 24.4
Balance of payments (in billions of U.S. dollars)Oil and gas (net) 3.2 -0.7 -5.2 -10.9 -14.3 -18.4 -22.9 -27.6 -32.6Non-oil and gas exports (f.o.b) 129.4 162.7 152.9 150.7 159.8 178.1 198.2 217.4 239.1Non-oil and gas imports (f.o.b) 102.0 127.3 139.1 134.4 137.8 148.9 163.5 176.9 191.1Current account balance 5.1 1.7 -24.4 -30.4 -27.6 -26.5 -29.0 -31.2 -32.2Inward direct investment 13.8 19.2 19.4 16.5 17.1 19.0 21.1 23.3 25.2Overall balance 30.3 11.9 0.2 -17.2 -9.0 1.2 2.6 4.0 5.2
Gross reservesIn billions of U.S. dollars (end period) 96.2 110.1 112.8 88.7 79.7 80.9 83.5 87.5 92.7In months of imports 5.9 6.2 6.4 4.9 4.1 3.8 3.6 3.5 3.4As a percent of short-term debt 3/ 224.2 235.5 206.4 154.6 131.6 124.0 117.8 112.8 108.8
Total external debtIn billions of U.S. dollars 202.4 225.4 252.4 264.6 277.3 298.2 321.8 347.8 375.1In percent of GDP 28.5 26.6 28.7 30.3 32.2 31.8 31.3 31.2 31.2
Memorandum items:Oil production (thousands of barrels per day) 945 907 860 830 830 830 830 830 830Indonesian oil price (in U.S. dollars per barrel) 79.4 111.5 112.7 109.4 105.3 99.3 94.8 91.5 89.9Nominal GDP (in trillions of rupiah) 6,447 7,423 8,242 9,102 10,123 11,320 12,660 14,158 15,757Nominal GDP (in billions of U.S. dollars) 710 846 879 … … … … … …
Sources: Data provided by the Indonesian authorities; and IMF staff estimates and projections.
1/ Contribution to GDP growth.2/ Includes changes in stocks. 3/ Short-term debt on a remaining maturity basis.
Proj.

INDONESIA
INTERNATIONAL MONETARY FUND 39
Table 5. Indonesia: Monetary Survey, 2009 August 2013
(In trillions of rupiah, unless otherwise indicated, end of period)
2009 2010 2011 2012 Mar. Jun. Aug.
Bank IndonesiaNet foreign assets 542 774 958 1,056 985 939 977Net domestic assets -140 -256 -345 -351 -320 -247 -264
Net claims on central government 200 187 240 300 248 262 244Liquidity operations, net 1/ -119 -139 -78 -52 -50 30 73Claims on other sectors 2/ 20 18 16 10 10 12 11Other items, net -241 -322 -523 -609 -527 -551 -592
Monetary base 402 518 613 705 665 692 713
Monetary surveyNet foreign assets 636 810 904 965 947 832 878Net domestic assets 1,506 1,661 1,973 2,343 2,376 2,581 2,623
Net claims on central government 428 375 403 471 450 418 422Claims on other nonfinancial public sector 68 101 104 161 170 185 188Private sector credit 1,409 1,684 2,111 2,581 2,620 2,798 2,894Other items, net -480 -634 -823 -1,058 -1,060 -1,031 -1,097
Broad money 3/ 2,141 2,471 2,877 3,308 3,323 3,413 3,501Rupiah M2 1,837 2,140 2,513 2,874 2,867 2,926 2,965
Currency in circulation 226 260 308 362 331 347 359Deposits 1,611 1,880 2,205 2,512 2,536 2,579 2,606
Foreign currency deposits 301 322 350 423 443 476 515
Memorandum items:Gross international reserves (US$ billions) 66.1 96.2 110.1 112.8 104.8 98.1 93.0Predetermined short-term net drains on reserves (in US$ billions) 4/ 9.6 8.4 10.5 13.5 16.8 21.1 22.7Money multiplier (rupiah M2) 4.6 4.1 4.1 4.1 4.3 4.2 4.2Base money velocity 5/ 13.9 12.4 12.1 13.9 12.9 12.8 13.3Rupiah M2 velocity 5/ 3.1 3.0 3.0 2.9 3.0 3.0 3.2Annual percentage change:
Broad money 13.0 15.4 16.4 15.0 14.0 11.8 13.3Rupiah M2 13.8 16.5 17.4 14.4 13.2 11.0 10.9Monetary base 16.7 28.9 18.3 14.9 13.5 10.3 8.4Private sector credit 7.2 19.6 25.4 22.3 19.9 18.7 20.5
Sources: Bank Indonesia; and IMF, International Financial Statistics and staff estimates.
2/ Includes claims on banks not related to monetary operations.3/ Includes securities classified as broad money.
5/ Calculated using end-period quarterly GDP, annualized.
4/ Includes net forward and swap positions, foreign currency term deposits of resident banks with Bank Indonesia of less than 12 months remaining maturity, and principal and interest payments on foreign-currency denominated debt of the central government and Bank Indonesia due within 12 months.
1/ Net outstanding monetary instruments, including overnight deposits, term deposits, repurchase and reverse repurchase agreements, and central bank securities (excluding those held by banks for reserves).
2013

INDONESIA
40 INTERNATIONAL MONETARY FUND
Table 6. Indonesia: Summary of Central Government Operations, 2009–14
2009 2010 2011 2012 2013Est. Budget Revised Staff Budget 1/ Staff
Budget proj. proj.
Revenues and grants 849 1,017 1,198 1,338 1,530 1,502 1,452 1,667 1,623Of which : Tax revenues 620 745 874 981 1,193 1,148 1,070 1,280 1,209
Oil and gas revenues 176 212 267 289 246 255 290 273 316Tax revenues 50 59 73 83 71 74 74 76 83Nontax revenues 126 153 193 206 175 181 215 197 234
Non-oil and gas revenues 671 803 928 1,043 1,279 1,243 1,157 1,393 1,306Tax revenues 570 686 801 897 1,122 1,074 996 1,204 1,126Nontax revenues 2/ 101 117 128 146 157 169 161 189 179
Grants 2 3 3 6 5 4 5 1 2 Expenditure and net lending 937 1,056 1,282 1,491 1,683 1,726 1,677 1,842 1,875
Current expenditure 479 566 686 790 896 922 906 988 1,055Personnel 128 148 178 198 242 233 233 264 277Subsidies 138 214 295 346 317 348 384 334 425
Of which : Energy subsidies 95 140 256 306 275 300 340 282 379Interest 94 88 93 101 113 113 123 121 156Other 120 116 120 145 224 228 165 269 197
Development expenditure 3/ 150 145 185 221 258 275 244 262 288Capital spending 76 77 114 145 184 193 160 206 183Social spending 79 68 71 76 74 82 85 56 106
Transfers to regions 309 345 411 481 529 529 526 593 532
Overall balance -88 -39 -84 -153 -153 -224 -225 -175 -251
Financing 89 39 84 153 153 224 225 154 251Domestic 69 19 77 161 173 241 174 173 231External 19 21 7 -8 -20 -17 51 -19 21
Revenues and grants 15.1 15.8 16.1 16.2 16.5 15.9 16.0 16.1 16.0Of which : Tax revenues 11.1 11.6 11.8 11.9 12.8 12.2 11.8 12.3 11.9
Oil and gas revenues 3.1 3.3 3.6 3.5 2.6 2.7 3.2 2.6 3.1Tax revenues 0.9 0.9 1.0 1.0 0.8 0.8 0.8 0.7 0.8Nontax revenues 2.2 2.4 2.6 2.5 1.9 1.9 2.4 1.9 2.3
Non-oil and gas revenues 12.0 12.4 12.5 12.7 13.8 13.2 12.7 13.4 12.9Tax revenues 10.2 10.6 10.8 10.9 12.1 11.4 10.9 11.6 11.1Nontax revenues 2/ 1.8 1.8 1.7 1.8 1.7 1.8 1.8 1.8 1.8
Grants 0.0 0.0 0.0 0.1 0.0 0.0 0.1 0.0 0.0
Expenditure and net lending 16.7 16.4 17.3 18.1 18.1 18.3 18.4 17.8 18.5Current expenditure 8.5 8.8 9.2 9.6 9.6 9.8 10.0 9.5 10.4
Personnel 2.3 2.3 2.4 2.4 2.6 2.5 2.6 2.5 2.7Subsidies 2.5 3.3 4.0 4.2 3.4 3.7 4.2 3.2 4.2
Of which : Energy subsidies 1.7 2.2 3.4 3.7 3.0 3.2 3.7 2.7 3.7Interest 1.7 1.4 1.3 1.2 1.2 1.2 1.4 1.2 1.5Other 2.1 1.8 1.6 1.8 2.4 2.4 1.8 2.6 1.9
Development expenditure 3/ 2.7 2.3 2.5 2.7 2.8 2.9 2.7 2.5 2.8Capital spending 1.4 1.2 1.5 1.8 2.0 2.0 1.8 2.0 1.8Social spending 1.4 1.1 1.0 0.9 0.8 0.9 0.9 0.5 1.0
Transfers to regions 5.5 5.3 5.5 5.8 5.7 5.6 5.8 5.7 5.3
Overall balance -1.6 -0.6 -1.1 -1.9 -1.6 -2.4 -2.5 -1.7 -2.5Financing 1.6 0.6 1.1 1.9 1.6 2.4 2.5 1.5 2.5
Domestic 1.2 0.3 1.0 2.0 1.9 2.6 1.9 1.7 2.3External 0.3 0.3 0.1 -0.1 -0.2 -0.2 0.6 -0.2 0.2
Memorandum items:Primary balance 0.1 0.8 0.1 -0.6 -0.4 -1.2 -1.1 -0.5 -0.9Cyclically adjusted primary balance 0.2 0.8 0.1 -0.7 … … -1.1 … -0.9Non-oil overall balance 4/ -3.2 -1.8 -1.4 -1.7 … … -2.0 … -2.0Central government debt 28.6 26.8 24.4 24.5 ... ... 26.2 ... 26.8GDP (in trillions of rupiah) 5,606 6,447 7,423 8,242 9,293 9,424 9,102 10,376 10,123
Sources: Data provided by the Indonesian authorities; and IMF staff estimates and projections.
1/ Approved by Parliament in October 2013.2/ Deposit insurance premia are treated as nontax revenues.3/ Comprises capital spending and social assistance spending. 4/ Non-oil balance calculated as overall balance excluding oil and gas revenue and expenditure, in percent of non-oil GDP.
(In percent of GDP)
(In trillions of rupiah)
2014

INDONESIA
INTERNATIONAL MONETARY FUND 41
Table 7. Indonesia: Summary of General Government Operations, 2005–12
(In trillions of rupiah)
2007 2008 2009 2010 2011 2012
Revenue 762 1,053 925 1,096 1,323 1,486Taxes 491 659 620 745 874 981 Taxes on income, profits, and capital gains 239 327 318 357 431 465 Taxes on goods and services 200 261 250 319 355 433
VAT and luxury taxes 155 210 193 252 278 338Excise 45 51 57 67 77 95
Taxes on international trade and transactions 21 36 19 29 54 50 Taxes not elsewhere classified 32 34 34 41 34 33Grants 2 2 2 3 3 6Other revenue 269 392 303 348 447 500
Total expenditure 803 1,053 1,023 1,176 1,370 1,623Expense 582 801 749 922 1,054 1,255
Of which : Compensation of employees 211 261 296 346 406 465 Purchases/use of goods and services 51 56 81 96 113 141 Interest 80 88 94 88 93 101
Fuel subsidies 117 223 95 140 256 306
Net acquisition of nonfinancial assets 221 252 275 253 316 368
Net lending/borrowing -41 0 -99 -80 -47 -137
Net acquisition of financial assets -8 71 -9 -16 8 -19Of which : policy lending 0 0 6 0 3 4
Net incurrence of liabilities 33 71 90 64 55 118
Sources: Data provided by the Indonesian authorities; and IMF staff estimates.

INDONESIA
42 INTERNATIONAL MONETARY FUND
Table 8. Indonesia: Financial Soundness Indicators, 2008 June 2013
(In percent; unless otherwise indicated)
2008 2009 2010 2011 2012 2013June
Depository institutionsCapital adequacy
Regulatory capital to risk-weighted assets 17.5 17.8 16.2 16.1 17.3 17.5Regulatory Tier-1 capital to risk-weighted assets 15.4 16.0 15.1 14.7 15.7 16.1Capital to assets 9.1 10.1 10.7 11.0 12.2 12.4Nonperforming loans net of provisions to capital 8.3 7.1 6.1 4.7 4.7 5.1Large exposures to capital 2.0 3.1 1.3 0.5 0.5 0.5Net open position in foreign exchange to capital 9.2 3.3 2.9 3.1 3.2 2.3Gross asset position in financial derivatives to capital 13.2 3.4 2.2 1.8 1.6 1.7Gross liability position in financial derivatives to capital 13.2 2.5 1.4 1.7 1.5 1.8
Asset qualityNonperforming loans to total gross loans 3.2 3.3 2.5 2.1 1.8 1.8(Specific) provisions to nonperforming loans 58.8 62.3 57.1 60.7 52.0 50.1Sectoral distribution of total loans (percent of total)
Central bank … … … … 3.4 2.6Depository institutions 1.2 1.5 1.4 1.2 1.1 1.2Other financial institutions 2.9 3.0 4.4 4.8 4.7 5.1General government 0.8 0.8 0.7 0.7 0.3 0.4Nonfinancial corporations 50.6 46.9 43.5 42.3 43.7 44.6Other domestic entities 44.1 47.4 49.6 50.6 46.4 45.9Nonresidents 0.5 0.4 0.4 0.4 0.4 0.4
Earning and profitabilityReturn on assets 2.4 2.6 2.7 2.3 2.6 2.5Return on equity 25.3 26.8 25.9 20.3 21.0 19.9Interest margin to gross income 63.6 62.5 60.5 59.8 65.0 66.3Trading income gross income 3.7 4.2 4.6 3.5 3.2 2.1Noninterest expenses to gross income 48.7 47.1 49.2 49.0 48.8 47.2Personnel expenses to noninterest expenses 41.4 40.9 37.3 36.0 40.5 43.0
LiquidityLiquid assets to total assets 25.9 28.7 27.2 26.2 25.7 24.0Liquid assets to short-term liabilities 30.8 33.9 32.1 31.2 36.4 34.0(Non-interbank) loans to customer deposits 79.3 77.5 80.4 84.4 93.2 96.4
Sensitivity to market riskForeign currency denominated loans to total loans 19.5 14.9 15.6 16.6 15.2 15.1Foreign currency denominated liabilities to total liabilities 20.0 17.8 16.5 16.3 18.6 19.9
Nonfinancial corporations 1/Leverage
Total debt to total assets 25.1 22.4 21.5 20.9 20.3 …Total liabilities to total assets 48.0 46.7 44.1 45.3 45.1 …
ProfitabilityReturn on assets 13.6 16.2 16.3 17.8 18.3 …Return on equity 24.3 30.4 28.1 32.2 33.5 …
LiquidityCurrent assets to current liabilities 206.0 190.2 215.7 225.0 203.6 …Quick assets to quick liabilities 134.4 132.8 155.9 160.0 131.2 …
Real estate marketsResidential real estate prices (year-on-year) 2.6 2.3 2.9 5.0 6.8 12.1Residential real estate loans to total loans ... ... 7.7 8.2 7.8 8.4Commercial real estate loans to total loans ... ... 6.1 6.0 6.0 6.4
Sources: IMF, Corporate Vulnerability Utility based on WorldScope database and Financial Soundness Indicators database; and IMF staff calculations.1/ Based on capitalization-weighted average of listed companies.

INDONESIA
INTERNATIONAL MONETARY FUND 43
Appendix 1. Indonesia—Risk Assessment Matrix 1/ Source/
Nature of Risk Likelihood
(high, medium, or low) Expected Impact
(high, medium, or low) Recommended Policy
Responses
Global/short to medium term Protracted economic and financial volatility, especially in emerging market economies (EMEs) (triggered by prospective exit from UMP)
High: Prospects of higher interest rates in advanced economies could trigger a sustained reversal of capital flows.
High: Portfolio and FDI inflows could be curtailed by weaker investor appetite, brought on by a further re weighting of EM assets, with tighter funding conditions adding to pressure on the balance of payments (BOP), on government finances, and in the financial sector.
Allow exchange rate flexibility to facilitate BOP adjustment; and tighten monetary policy to help reduce the trade deficit and boost investor confidence. Pursue fiscal consolidation possibly through tax and subsidy reforms; with government also using contingent financing if market access is restricted. Accelerate structural reforms to boost productivity and employment in nonresource sectors.
Global/short term Financial stress in the euro area reemerges
Medium: Bank sovereign real economy links could intensify on a stalled or incomplete delivery of policy commitments at the national or euro area level or adverse developments in the periphery.
Medium: Direct trade and financial impact is limited. However, portfolio net inflows could weaken on rising global risk aversion. Weaker global growth would reduce exports and FDI, leading to BOP pressures and reserve losses.
Exchange rate flexibility and monetary policy tightening, as discussed above.
Global/short term Fiscal policy shock in the United States
Low Medium/High: A sharp increase in global risk aversion associated with a large negative shock could spur capital outflows, drive up local yields, and put downward pressure on the rupiah. The global outlook would also weaken, driving down commodity prices and resulting in BOP pressures.
Exchange rate flexibility and monetary policy tightening, as discussed above
Global/short term Global oil shock triggered by geopolitical events (driving oil prices to US$150 per barrel)
Low
High: Both fiscal and current account balances would deteriorate immediately. A second round impact could come through weaker global growth and market sentiment.
Increase subsidized fuel prices to help reduce imbalances, with temporary fiscal support to protect those more vulnerable. Allow exchange rate flexibility to absorb pressure and tighten monetary policy to limit secondround effects on inflation.
Global/ medium term Lower than anticipated emerging market growth potential
Medium: A deeper than expected slowdown in EMEs due to earlier maturing of the cycle and incomplete structural reforms with spillovers to low income and advanced economies.
High: Lower demand or prices for commodity exports could widen the current account deficit, adding to BOP pressures and resulting in reserve losses. The fiscal balance would deteriorate on weaker resource revenues and knock on effects to domestic demand, while the financial sector could be exposed to this broader slowdown.
Exchange rate flexibility and monetary policy tightening, as discussed above. Fiscal measures to contain the budget deficit might be necessary if slowdown in EMEs was accompanied by protracted financial market volatility.
Global/medium term Sharp slowdown in growth in China (buildup of excess capacity eventually resulting in large financial and fiscal losses)
Medium: China is one of Indonesia’s largest export markets and sources of FDI, having a major impact on prices of Indonesia’s commodity exports and demand conditions for some of its major trade partners.
Medium/High: Lower demand or prices for commodity exports could lead to deterioration in the current account. FDI inflows into Indonesia’s resource sector could be curtailed, resulting in increased external vulnerability and possible reserve losses. The fiscal balance would deteriorate.
Exchange rate flexibility and some fiscal consolidation, along with accelerated structural reforms to boost productivity and employment in nonresource sectors.
Domestic/short term Government funding shortfalls
Medium: Domestic funding requirements remain large into 2014 and could become problematic if EMEs remain volatile and/or liquidity pressures on domestic banks intensify.
Medium/High: Limited scope to meet financing shortfall from government deposits. Market confidence could deteriorate rapidly if the policy response is inadequate and domestic yields could spike.
Tighten fiscal policy, while maintaining exchange rate and bond yield flexibility to avoid a market disruption, with government also using external contingent financing if market access is restricted.
Domestic/short to medium term Prolonged inaction on key structural reforms undermines business confidence
Medium: Steps in the past few years to restrict foreign mining operations, impose a raw mineral ores ban, and curtail beef and horticultural imports have raised concerns.
Medium: Negative investor sentiment toward Indonesia could add to undermine competitiveness, impede FDI, and exacerbate BOP pressures, with welfare losses.
Reverse trend toward ad hoc trade and investment restrictions; take firm measures to reduce structural bottlenecks, notably on infrastructure development and labor market flexibility, and improve governance.
Domestic/short to medium term Banking system distress by a severe funding squeeze
Low/Medium: Stress could arise from liquidity pressures prompted by sizable capital outflows and/or a sharp economic slowdown. Uncertainty regarding the crisis management framework could complicate the policy response and amplify risks.
Medium: Severe financial stresses on banks that have higher loan to deposit ratios and lower capital buffers, with a sharp rise in deposit and lending rates, deterioration in asset quality, and reduced profitability.
Ensure proper risk controls at banks, with clear lender of last resort/emergency liquidity protocols in place and close coordination between financial regulators, backed by swift approval by Parliament of the Financial Safety Net Law or stop gap measures.
1/ The Risk Assessment Matrix (RAM) shows events that could materially alter the baseline path (the scenario most likely to materialize in the view of IMF staff). The relative likelihood of risks listed is the staff’s subjective assessment of the risks surrounding the baseline (“low” is meant to indicate a probability below 10 percent, “medium” a probability between 10 percent and 30 percent, and “high” a probability of 30 percent or more). The RAM reflects staff views on the source of risks and overall level of concern as of the time of discussions with the authorities.

INDONESIA
44 INTERNATIONAL MONETARY FUND
Appendix 2. Indonesia—External Vulnerabilities in Perspective1 Overview
1. This appendix looks at developments in Indonesia’s external position and benchmarks its vulnerability indicators over time and across countries. The main findings are: (i) the deterioration in the current account from 2011 to 2012 was caused primarily by rising imports, due to strong GDP and investment growth, and falling commodity prices; (ii) Indonesia’s current account position in 2012 was worse than at the onset of the global financial crisis, but most other indicators were as good or better than in 2007; and (iii) looking across countries, Indonesia’s indicators in 2012−13 are in the middle of its peers and generally better than standard thresholds. Going forward, the recent REER depreciation coupled with higher interest rates should slow import growth and help improve Indonesia’s external position over the medium term. This adjustment should be supported by appropriate macroeconomic policies.
What Caused the Current Account Deficit to Widen in 2012?
2. Indonesia’s current account balance deteriorated by 3 percentage points of GDP in 2012. In the process, it went from a surplus of 0.2 percent of GDP in 2011 to a deficit of 2.8 percent of GDP in 2012—the largest swing in the current account balance in more than a decade. This change was even larger than the 1½ percentage points of GDP reduction in the current account surplus from 2007 to 2008 and followed 14 consecutive years of surpluses.
3. The data show that the deterioration in 2012 was due entirely to the trade balance, spread evenly across exports and imports, concentrated in the nonoil and gas trade (Table 2.1). Examining the distribution across exports and imports, about US$12 billion of the US$26 billion deterioration in the trade balance was due to a decline in exports and US$14 billion due to a rise in imports. Exports were especially affected by a decline in commodity prices for rubber, coal, and palm oil and a fall in the export volumes of oil and gas. The latter occurred owing to a slowdown and diversion in production from exports toward domestic uses. Imports rose primarily due to increased demand for raw materials (up US$7.2 billion) used in domestic manufacturing and for capital goods (up US$4.4 billion), including those imports associated with foreign direct investment (FDI) (up 17 percent).
How Do Current Indicators Compare to 2008−09?
4. A comparison of vulnerability indicators in (i) the run up to the global financial crisis and (ii) recent period of market turbulence suggests that vulnerabilities are lower with the exception of a large shift in the current account balance.
On the domestic front, real, fiscal, and financial indicators were broadly stronger in 2012 compared to 2007. Growth was more than 6 percent in both 2007 and 2012, but inflation was considerably lower in 2012 (Figure 2.1). On the fiscal side, the central government’s budget deficit was less than 2 percent in both years, while public sector debt fell by almost a third from 35 percent to 24 percent of GDP between 2007 and 2012.
1 Prepared by Lawrence Dwight (SPR).
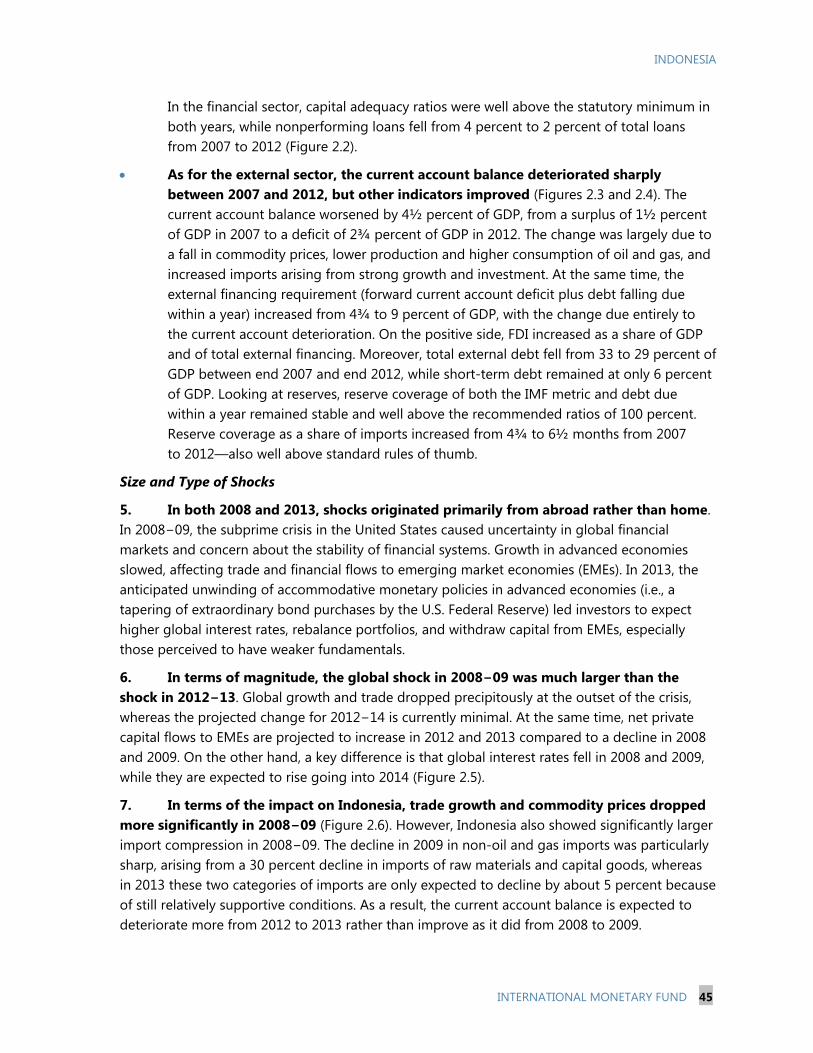
INDONESIA
INTERNATIONAL MONETARY FUND 45
In the financial sector, capital adequacy ratios were well above the statutory minimum in both years, while nonperforming loans fell from 4 percent to 2 percent of total loans from 2007 to 2012 (Figure 2.2).
As for the external sector, the current account balance deteriorated sharply between 2007 and 2012, but other indicators improved (Figures 2.3 and 2.4). The current account balance worsened by 4½ percent of GDP, from a surplus of 1½ percent of GDP in 2007 to a deficit of 2¾ percent of GDP in 2012. The change was largely due to a fall in commodity prices, lower production and higher consumption of oil and gas, and increased imports arising from strong growth and investment. At the same time, the external financing requirement (forward current account deficit plus debt falling due within a year) increased from 4¾ to 9 percent of GDP, with the change due entirely to the current account deterioration. On the positive side, FDI increased as a share of GDP and of total external financing. Moreover, total external debt fell from 33 to 29 percent of GDP between end 2007 and end 2012, while shortterm debt remained at only 6 percent of GDP. Looking at reserves, reserve coverage of both the IMF metric and debt due within a year remained stable and well above the recommended ratios of 100 percent. Reserve coverage as a share of imports increased from 4¾ to 6½ months from 2007 to 2012—also well above standard rules of thumb.
Size and Type of Shocks
5. In both 2008 and 2013, shocks originated primarily from abroad rather than home. In 2008−09, the subprime crisis in the United States caused uncertainty in global financial markets and concern about the stability of financial systems. Growth in advanced economies slowed, affecting trade and financial flows to emerging market economies (EMEs). In 2013, the anticipated unwinding of accommodative monetary policies in advanced economies (i.e., a tapering of extraordinary bond purchases by the U.S. Federal Reserve) led investors to expect higher global interest rates, rebalance portfolios, and withdraw capital from EMEs, especially those perceived to have weaker fundamentals.
6. In terms of magnitude, the global shock in 2008−09 was much larger than the shock in 2012−13. Global growth and trade dropped precipitously at the outset of the crisis, whereas the projected change for 2012−14 is currently minimal. At the same time, net private capital flows to EMEs are projected to increase in 2012 and 2013 compared to a decline in 2008 and 2009. On the other hand, a key difference is that global interest rates fell in 2008 and 2009, while they are expected to rise going into 2014 (Figure 2.5).
7. In terms of the impact on Indonesia, trade growth and commodity prices dropped more significantly in 2008−09 (Figure 2.6). However, Indonesia also showed significantly larger import compression in 2008−09. The decline in 2009 in nonoil and gas imports was particularly sharp, arising from a 30 percent decline in imports of raw materials and capital goods, whereas in 2013 these two categories of imports are only expected to decline by about 5 percent because of still relatively supportive conditions. As a result, the current account balance is expected to deteriorate more from 2012 to 2013 rather than improve as it did from 2008 to 2009.
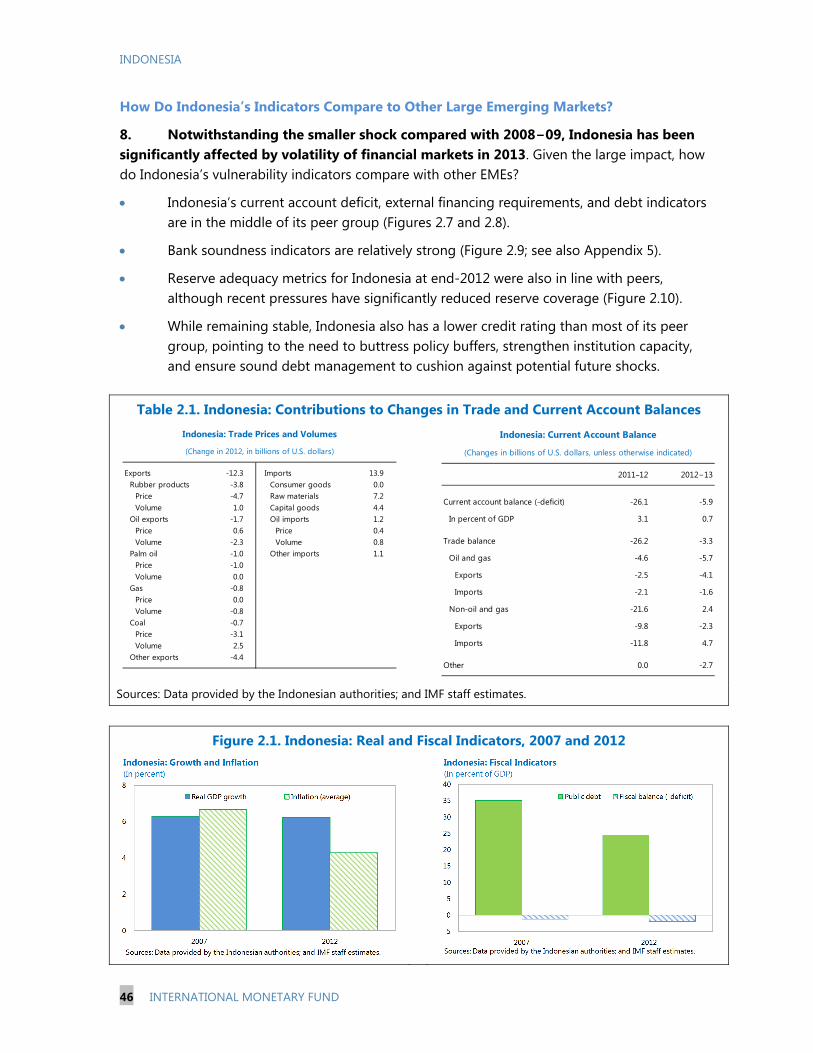
INDONESIA
46 INTERNATIONAL MONETARY FUND
How Do Indonesia’s Indicators Compare to Other Large Emerging Markets?
8. Notwithstanding the smaller shock compared with 2008−09, Indonesia has been significantly affected by volatility of financial markets in 2013. Given the large impact, how do Indonesia’s vulnerability indicators compare with other EMEs?
Indonesia’s current account deficit, external financing requirements, and debt indicators are in the middle of its peer group (Figures 2.7 and 2.8).
Bank soundness indicators are relatively strong (Figure 2.9; see also Appendix 5).
Reserve adequacy metrics for Indonesia at end2012 were also in line with peers, although recent pressures have significantly reduced reserve coverage (Figure 2.10).
While remaining stable, Indonesia also has a lower credit rating than most of its peer group, pointing to the need to buttress policy buffers, strengthen institution capacity, and ensure sound debt management to cushion against potential future shocks.
Table 2.1. Indonesia: Contributions to Changes in Trade and Current Account Balances
Sources: Data provided by the Indonesian authorities; and IMF staff estimates.
Figure 2.1. Indonesia: Real and Fiscal Indicators, 2007 and 2012
Exports -12.3 Imports 13.9Rubber products -3.8 Consumer goods 0.0
Price -4.7 Raw materials 7.2Volume 1.0 Capital goods 4.4
Oil exports -1.7 Oil imports 1.2Price 0.6 Price 0.4Volume -2.3 Volume 0.8
Palm oil -1.0 Other imports 1.1Price -1.0Volume 0.0
Gas -0.8Price 0.0Volume -0.8
Coal -0.7Price -3.1Volume 2.5
Other exports -4.4
(Change in 2012, in billions of U.S. dollars)
Indonesia: Trade Prices and Volumes
2011−12 2012−13
Current account balance (-deficit) -26.1 -5.9
In percent of GDP 3.1 0.7
Trade balance -26.2 -3.3
Oil and gas -4.6 -5.7
Exports -2.5 -4.1
Imports -2.1 -1.6
Non-oil and gas -21.6 2.4
Exports -9.8 -2.3
Imports -11.8 4.7
Other 0.0 -2.7
Indonesia: Current Account Balance
(Changes in billions of U.S. dollars, unless otherwise indicated)
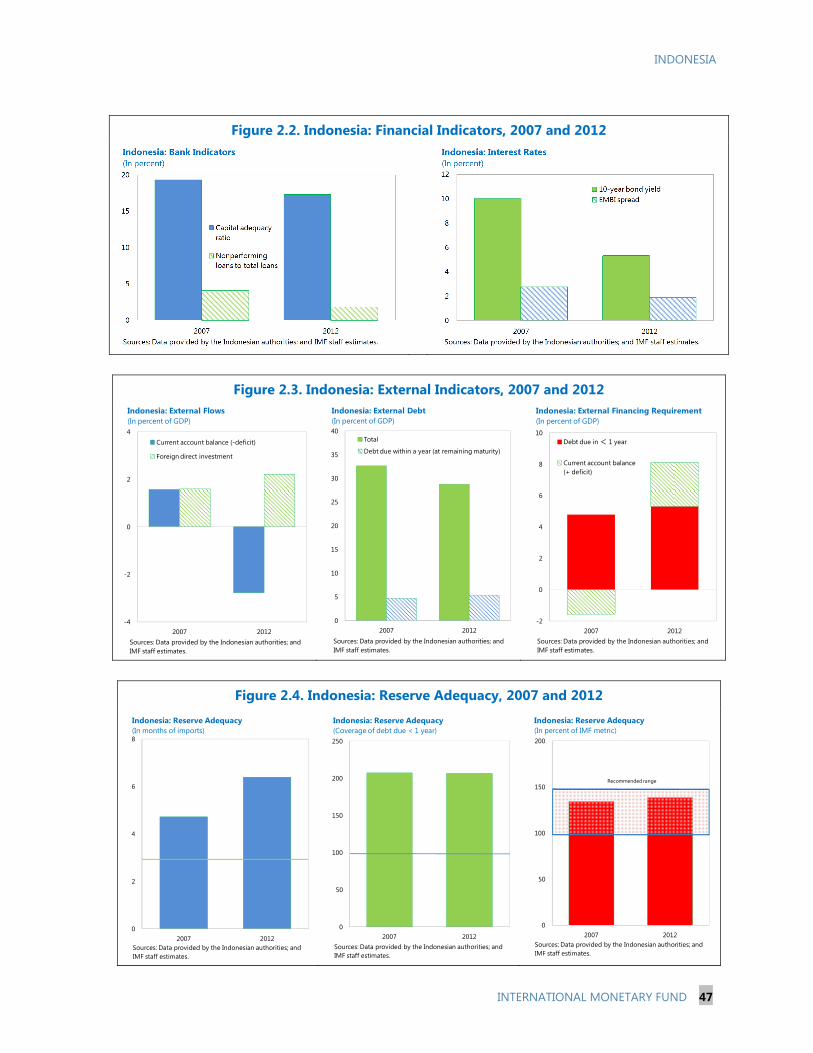
INDONESIA
INTERNATIONAL MONETARY FUND 47
Figure 2.2. Indonesia: Financial Indicators, 2007 and 2012
Figure 2.3. Indonesia: External Indicators, 2007 and 2012
Figure 2.4. Indonesia: Reserve Adequacy, 2007 and 2012
-4
-2
0
2
4
2007 2012
Current account balance (-deficit)
Foreign direct investment
Indonesia: External Flows(In percent of GDP)
Sources: Data provided by the Indonesian authorities; and IMF staff estimates.
0
5
10
15
20
25
30
35
40
2007 2012
Total
Debt due within a year (at remaining maturity)
Indonesia: External Debt(In percent of GDP)
Sources: Data provided by the Indonesian authorities; and IMF staff estimates.
-2
0
2
4
6
8
10
2007 2012
Debt due in < 1 year
Current account balance (+ deficit)
Indonesia: External Financing Requirement(In percent of GDP)
Sources: Data provided by the Indonesian authorities; and IMF staff estimates.
0
2
4
6
8
2007 2012
Indonesia: Reserve Adequacy(In months of imports)
Sources: Data provided by the Indonesian authorities; and IMF staff estimates.
0
50
100
150
200
250
2007 2012
Indonesia: Reserve Adequacy(Coverage of debt due < 1 year)
Sources: Data provided by the Indonesian authorities; and IMF staff estimates.
0
50
100
150
200
2007 2012
Indonesia: Reserve Adequacy(In percent of IMF metric)
Sources: Data provided by the Indonesian authorities; and IMF staff estimates.
Recommended range
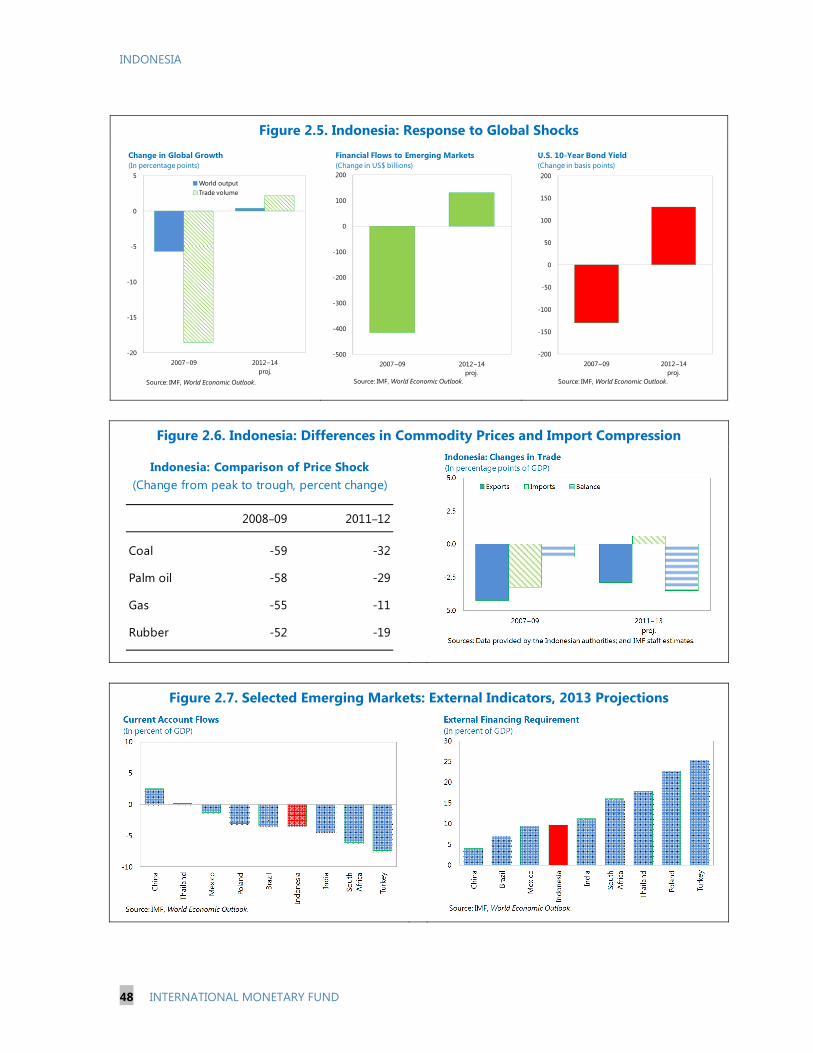
INDONESIA
48 INTERNATIONAL MONETARY FUND
Figure 2.5. Indonesia: Response to Global Shocks
Figure 2.6. Indonesia: Differences in Commodity Prices and Import Compression
Figure 2.7. Selected Emerging Markets: External Indicators, 2013 Projections
-20
-15
-10
-5
0
5
2007−09 2012−14proj.
World outputTrade volume
Change in Global Growth(In percentage points)
Source: IMF, World Economic Outlook.
-500
-400
-300
-200
-100
0
100
200
2007−09 2012−14proj.
Financial Flows to Emerging Markets(Change in US$ billions)
Source: IMF, World Economic Outlook.
-200
-150
-100
-50
0
50
100
150
200
2007−09 2012−14 proj.
U.S. 10-Year Bond Yield(Change in basis points)
Source: IMF, World Economic Outlook.
2008−09 2011−12
Coal -59 -32
Palm oil -58 -29
Gas -55 -11
Rubber -52 -19
Indonesia: Comparison of Price Shock(Change from peak to trough, percent change)

INDONESIA
INTERNATIONAL MONETARY FUND 49
Figure 2.8. Selected Emerging Markets: Debt Indicators, End 2012
Figure 2.9. Selected Emerging Markets: Bank Indicators, End 2012
Figure 2.10. Selected Emerging Markets: Reserve Adequacy and Credit Ratings
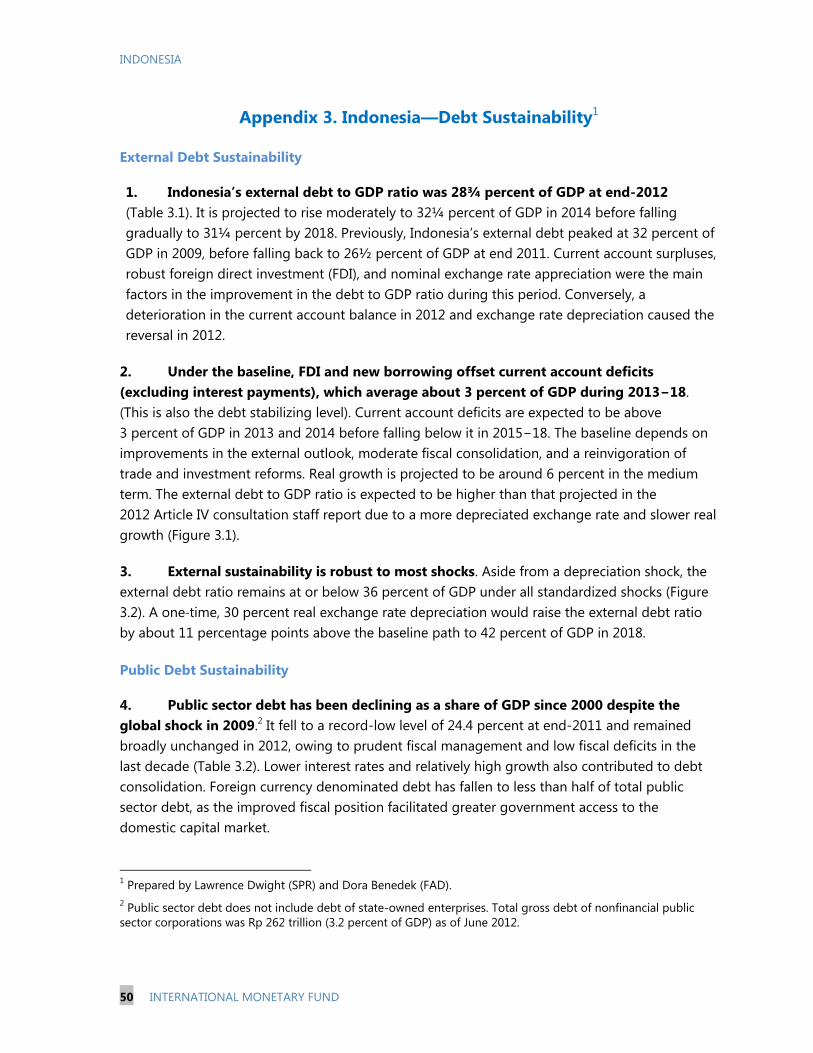
INDONESIA
50 INTERNATIONAL MONETARY FUND
Appendix 3. Indonesia—Debt Sustainability1
External Debt Sustainability
1. Indonesia’s external debt to GDP ratio was 28¾ percent of GDP at end2012 (Table 3.1). It is projected to rise moderately to 32¼ percent of GDP in 2014 before falling gradually to 31¼ percent by 2018. Previously, Indonesia’s external debt peaked at 32 percent of GDP in 2009, before falling back to 26½ percent of GDP at end 2011. Current account surpluses, robust foreign direct investment (FDI), and nominal exchange rate appreciation were the main factors in the improvement in the debt to GDP ratio during this period. Conversely, a deterioration in the current account balance in 2012 and exchange rate depreciation caused the reversal in 2012.
2. Under the baseline, FDI and new borrowing offset current account deficits (excluding interest payments), which average about 3 percent of GDP during 2013−18. (This is also the debt stabilizing level). Current account deficits are expected to be above 3 percent of GDP in 2013 and 2014 before falling below it in 2015−18. The baseline depends on improvements in the external outlook, moderate fiscal consolidation, and a reinvigoration of trade and investment reforms. Real growth is projected to be around 6 percent in the medium term. The external debt to GDP ratio is expected to be higher than that projected in the 2012 Article IV consultation staff report due to a more depreciated exchange rate and slower real growth (Figure 3.1).
3. External sustainability is robust to most shocks. Aside from a depreciation shock, the external debt ratio remains at or below 36 percent of GDP under all standardized shocks (Figure 3.2). A one˗time, 30 percent real exchange rate depreciation would raise the external debt ratio by about 11 percentage points above the baseline path to 42 percent of GDP in 2018.
Public Debt Sustainability
4. Public sector debt has been declining as a share of GDP since 2000 despite the global shock in 2009.2 It fell to a recordlow level of 24.4 percent at end2011 and remained broadly unchanged in 2012, owing to prudent fiscal management and low fiscal deficits in the last decade (Table 3.2). Lower interest rates and relatively high growth also contributed to debt consolidation. Foreign currency denominated debt has fallen to less than half of total public sector debt, as the improved fiscal position facilitated greater government access to the domestic capital market.
1 Prepared by Lawrence Dwight (SPR) and Dora Benedek (FAD). 2 Public sector debt does not include debt of state-owned enterprises. Total gross debt of nonfinancial public sector corporations was Rp 262 trillion (3.2 percent of GDP) as of June 2012.

INDONESIA
INTERNATIONAL MONETARY FUND 51
Under the baseline scenario, public sector debt is expected to rise to around 26.8 percent of GDP in 2014 due to larger fiscal deficits and financing needs. Over the medium term, public debt is expected to decline as a share of GDP—to around 24.4 percent by 2018. Public debt is sustainable and robust to macroeconomic and oil price shocks (Figure 3.3). All the standard stress tests suggest that the debt ratio is likely to remain modest even under shocks from contingent liabilities, sharp exchange rate movements, and higher interest rates.
Figure 3.1. Indonesia: External Debt Indicators
0
10
20
30
40
2008 2009 2010 2011 2012 2013 Proj.
2014Proj.
2015Proj.
2016Proj.
2017Proj.
2018Proj.
Debt service (2012 Article IV) Debt service (current)External debt (2012 Article IV) External debt (current)
Indonesia: External Debt Projections, 2008−18(In percent of GDP)
Source: IMF staff estimates and projections.
50
75
100
125
150
175
200
2008 2009 2010 2011 2012 2013 Proj.
2014Proj.
2015Proj.
2016Proj.
2017Proj.
2018Proj.
2013 Article IV 2012 Article IV
Indonesia: Debt Service Flows, 2008−18(In percent of the gross external financing requirement)
Source: IMF staff estimates and projections.
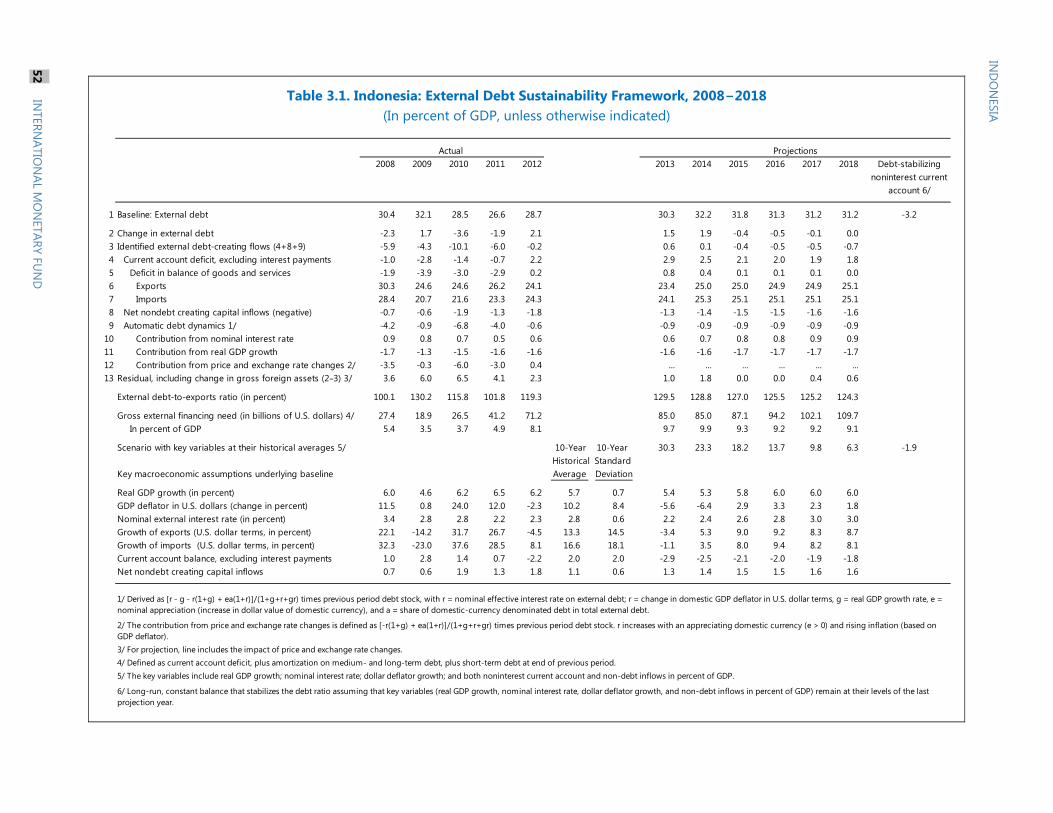
IND
ON
ESIA
Table 3.1. Indonesia: External Debt Sustainability Framework, 2008−2018 (In percent of GDP, unless otherwise indicated)
2008 2009 2010 2011 2012 2013 2014 2015 2016 2017 2018 Debt-stabilizing noninterest current
account 6/
1 Baseline: External debt 30.4 32.1 28.5 26.6 28.7 30.3 32.2 31.8 31.3 31.2 31.2 -3.2
2 Change in external debt -2.3 1.7 -3.6 -1.9 2.1 1.5 1.9 -0.4 -0.5 -0.1 0.03 Identified external debt-creating flows (4+8+9) -5.9 -4.3 -10.1 -6.0 -0.2 0.6 0.1 -0.4 -0.5 -0.5 -0.74 Current account deficit, excluding interest payments -1.0 -2.8 -1.4 -0.7 2.2 2.9 2.5 2.1 2.0 1.9 1.85 Deficit in balance of goods and services -1.9 -3.9 -3.0 -2.9 0.2 0.8 0.4 0.1 0.1 0.1 0.06 Exports 30.3 24.6 24.6 26.2 24.1 23.4 25.0 25.0 24.9 24.9 25.17 Imports 28.4 20.7 21.6 23.3 24.3 24.1 25.3 25.1 25.1 25.1 25.18 Net nondebt creating capital inflows (negative) -0.7 -0.6 -1.9 -1.3 -1.8 -1.3 -1.4 -1.5 -1.5 -1.6 -1.69 Automatic debt dynamics 1/ -4.2 -0.9 -6.8 -4.0 -0.6 -0.9 -0.9 -0.9 -0.9 -0.9 -0.9
10 Contribution from nominal interest rate 0.9 0.8 0.7 0.5 0.6 0.6 0.7 0.8 0.8 0.9 0.911 Contribution from real GDP growth -1.7 -1.3 -1.5 -1.6 -1.6 -1.6 -1.6 -1.7 -1.7 -1.7 -1.712 Contribution from price and exchange rate changes 2/ -3.5 -0.3 -6.0 -3.0 0.4 ... ... ... ... ... ...13 Residual, including change in gross foreign assets (2−3) 3/ 3.6 6.0 6.5 4.1 2.3 1.0 1.8 0.0 0.0 0.4 0.6
External debt-to-exports ratio (in percent) 100.1 130.2 115.8 101.8 119.3 129.5 128.8 127.0 125.5 125.2 124.3
Gross external financing need (in billions of U.S. dollars) 4/ 27.4 18.9 26.5 41.2 71.2 85.0 85.0 87.1 94.2 102.1 109.7In percent of GDP 5.4 3.5 3.7 4.9 8.1 9.7 9.9 9.3 9.2 9.2 9.1
Scenario with key variables at their historical averages 5/ 10-Year 10-Year 30.3 23.3 18.2 13.7 9.8 6.3 -1.9 Historical Standard
Key macroeconomic assumptions underlying baseline Average Deviation
Real GDP growth (in percent) 6.0 4.6 6.2 6.5 6.2 5.7 0.7 5.4 5.3 5.8 6.0 6.0 6.0GDP deflator in U.S. dollars (change in percent) 11.5 0.8 24.0 12.0 -2.3 10.2 8.4 -5.6 -6.4 2.9 3.3 2.3 1.8Nominal external interest rate (in percent) 3.4 2.8 2.8 2.2 2.3 2.8 0.6 2.2 2.4 2.6 2.8 3.0 3.0Growth of exports (U.S. dollar terms, in percent) 22.1 -14.2 31.7 26.7 -4.5 13.3 14.5 -3.4 5.3 9.0 9.2 8.3 8.7Growth of imports (U.S. dollar terms, in percent) 32.3 -23.0 37.6 28.5 8.1 16.6 18.1 -1.1 3.5 8.0 9.4 8.2 8.1Current account balance, excluding interest payments 1.0 2.8 1.4 0.7 -2.2 2.0 2.0 -2.9 -2.5 -2.1 -2.0 -1.9 -1.8Net nondebt creating capital inflows 0.7 0.6 1.9 1.3 1.8 1.1 0.6 1.3 1.4 1.5 1.5 1.6 1.6
3/ For projection, line includes the impact of price and exchange rate changes.4/ Defined as current account deficit, plus amortization on medium- and long-term debt, plus short-term debt at end of previous period. 5/ The key variables include real GDP growth; nominal interest rate; dollar deflator growth; and both noninterest current account and non-debt inflows in percent of GDP.
6/ Long-run, constant balance that stabilizes the debt ratio assuming that key variables (real GDP growth, nominal interest rate, dollar deflator growth, and non-debt inflows in percent of GDP) remain at their levels of the last projection year.
Actual Projections
1/ Derived as [r - g - r(1+g) + ea(1+r)]/(1+g+r+gr) times previous period debt stock, with r = nominal effective interest rate on external debt; r = change in domestic GDP deflator in U.S. dollar terms, g = real GDP growth rate, e = nominal appreciation (increase in dollar value of domestic currency), and a = share of domestic-currency denominated debt in total external debt.
2/ The contribution from price and exchange rate changes is defined as [-r(1+g) + ea(1+r)]/(1+g+r+gr) times previous period debt stock. r increases with an appreciating domestic currency (e > 0) and rising inflation (based on GDP deflator).
52 IN
TERNATIO
NAL M
ON
ETARY FUN
D

Table 3.2. Indonesia: Public Sector Debt Sustainability Framework, 2008–2018 (In percent of GDP, unless otherwise indicated)
2008 2009 2010 2011 2012 2013 2014 2015 2016 2017 2018 Debt-stabilizingprimary balance 9/
Baseline: Public sector debt 1/ 33.2 28.6 26.8 24.4 24.5 26.2 26.8 26.5 26.1 25.4 24.4 -0.9Of which : foreign-currency denominated 17.1 13.3 11.9 10.7 10.5 10.4 9.8 10.0 9.0 9.0 7.9
Change in public sector debt -1.8 -4.6 -1.8 -2.4 0.1 1.7 0.6 -0.4 -0.4 -0.7 -1.0Identified debt-creating flows (4+7+12) -4.5 -4.6 -3.0 -2.8 0.0 -0.1 -0.2 -0.6 -0.7 -1.1 -1.3
Primary deficit -1.8 0.1 -0.1 -0.6 0.4 0.8 0.9 0.7 0.4 0.1 -0.3Revenue and grants 21.3 16.5 17.0 17.8 18.0 18.1 18.2 18.0 17.9 17.8 18.0Primary (noninterest) expenditure 19.5 16.6 16.9 17.2 18.5 18.9 19.1 18.7 18.3 17.9 17.7
Automatic debt dynamics 2/ -2.7 -4.6 -2.9 -2.2 -0.4 -1.0 -1.1 -1.2 -1.2 -1.1 -1.0Contribution from interest rate/growth differential 3/ -5.3 -2.2 -2.4 -2.3 -1.2 -1.0 -1.1 -1.2 -1.2 -1.1 -1.0
Of which : contribution from real interest rate -3.6 -0.9 -0.8 -0.8 0.2 0.2 0.1 0.1 0.2 0.3 0.4Of which : contribution from real GDP growth -1.7 -1.4 -1.5 -1.5 -1.4 -1.2 -1.2 -1.4 -1.4 -1.4 -1.4
Contribution from exchange rate depreciation 4/ 2.5 -2.4 -0.5 0.1 0.8 ... ... ... ... ... ...Other identified debt-creating flows 0.0 0.0 0.0 0.0 0.0 0.0 0.0 0.0 0.0 0.0 0.0
Privatization receipts (negative) 0.0 0.0 0.0 0.0 0.0 0.0 0.0 0.0 0.0 0.0 0.0Recognition of implicit or contingent liabilities 0.0 0.0 0.0 0.0 0.0 0.0 0.0 0.0 0.0 0.0 0.0
Residual, including asset changes (2–3) 5/ 2.7 0.0 1.2 0.4 0.1 1.8 0.8 0.2 0.4 0.4 0.3
Public sector debt-to-revenue ratio 1/ 156.2 173.6 157.9 136.9 136.1 145.1 147.4 147.1 146.1 142.6 136.1
Gross financing need 6/ 2.5 4.6 4.2 2.5 3.9 4.6 4.3 4.3 3.0 2.5 2.1In billions of U.S. dollars 12.8 24.8 29.8 21.5 34.4 39.8 36.7 40.4 31.3 27.5 25.5
Scenario with key variables at their historical averages 7/ 26.2 22.5 18.6 15.2 12.1 9.3 -1.2Scenario with no policy change (constant primary balance) in 2009–2014 26.2 26.3 25.7 25.4 25.1 24.9 -0.8
Key macroeconomic and fiscal assumptions underlying baseline
Real GDP growth (in percent) 6.0 4.6 6.2 6.5 6.2 5.4 5.3 5.8 6.0 6.0 6.0Average nominal interest rate on public debt (in percent) 8/ 6.4 5.7 5.5 5.4 5.5 6.1 6.5 6.6 6.9 7.0 7.0Average real interest rate (nominal rate minus change in GDP deflator, in percent) -11.8 -2.6 -2.8 -2.7 1.0 1.3 0.9 0.9 1.4 1.5 2.0Nominal appreciation (increase in U.S. dollar value of local currency, in percent) -15.5 18.2 4.5 -0.8 -7.4 ... ... ... ... ... ...Inflation rate (GDP deflator, in percent) 18.1 8.3 8.3 8.1 4.5 4.8 5.6 5.7 5.5 5.5 5.0Growth of real primary spending (deflated by GDP deflator, in percent) 12.9 -11.0 8.0 8.6 14.1 7.7 6.7 3.2 4.0 3.5 4.8Primary deficit -1.8 0.1 -0.1 -0.6 0.4 0.8 0.9 0.7 0.4 0.1 -0.3
1/ Coverage of public sector comprises central and local governments. However, data on gross debt are central government only.
3/ The real interest rate contribution is derived from the denominator in footnote 2/ as r - π (1+g) and the real growth contribution as -g.4/ The exchange rate contribution is derived from the numerator in footnote 2/ as ae(1+r). 5/ For projections, this line includes exchange rate changes.6/ Defined as public sector deficit, plus amortization of medium and long-term public sector debt, plus short-term debt at end of previous period. 7/ The key variables include real GDP growth; real interest rate; and primary balance in percent of GDP.8/ Derived as nominal interest expenditure divided by previous period debt stock.9/ Assumes that key variables (real GDP growth, real interest rate, and other identified debt-creating flows) remain at the level of the last projection year.
2/ Derived as [(r - p(1+g) - g + ae(1+r)]/(1+g+p+gp) times previous period debt ratio, with r = interest rate; p = growth rate of GDP deflator; g = real GDP growth rate; a = share of foreign-currency denominated debt; and e = nominal exchange rate depreciation (measured by increase in local currency value of U.S. dollar).
Actual Projections
IND
ON
ESIA
INTERN
ATION
AL MO
NETARY FU
ND
53
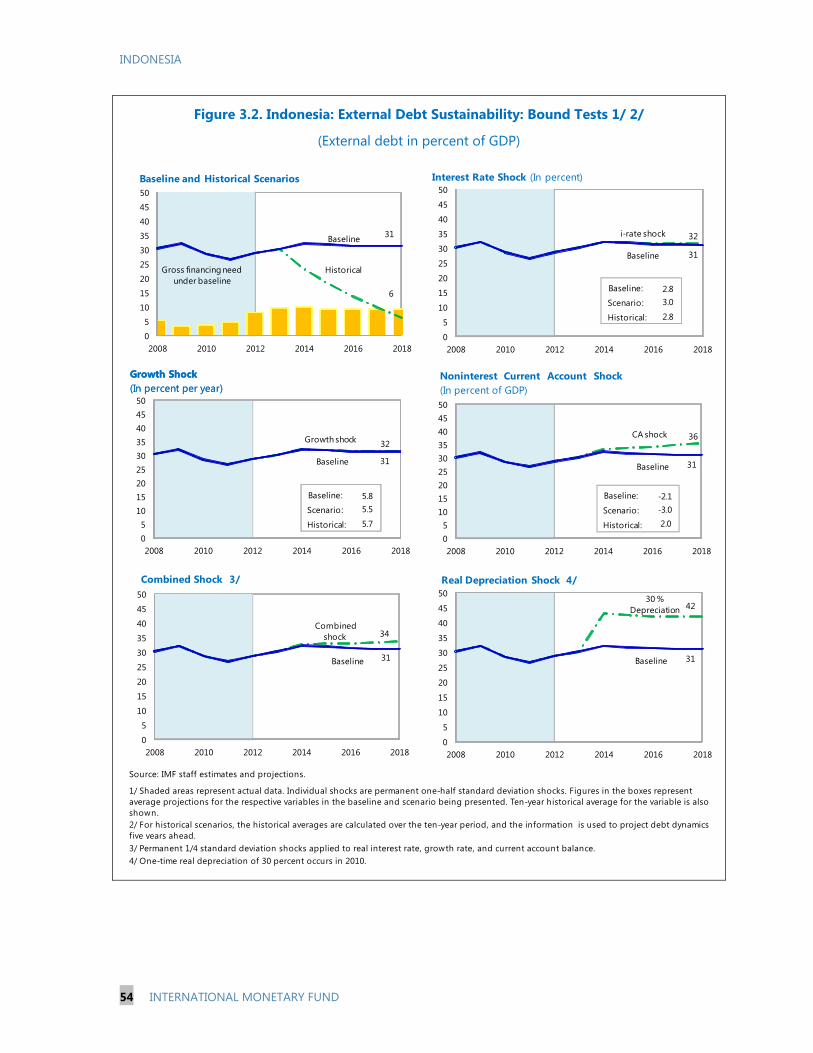
INDONESIA
54 INTERNATIONAL MONETARY FUND
Figure 3.2. Indonesia: External Debt Sustainability: Bound Tests 1/ 2/
(External debt in percent of GDP)
3/ Permanent 1/4 standard deviation shocks applied to real interest rate, growth rate, and current account balance.4/ One-time real depreciation of 30 percent occurs in 2010.
Source: IMF staff estimates and projections.
1/ Shaded areas represent actual data. Individual shocks are permanent one-half standard deviation shocks. Figures in the boxes represent average projections for the respective variables in the baseline and scenario being presented. Ten-year historical average for the variable is also shown. 2/ For historical scenarios, the historical averages are calculated over the ten-year period, and the information is used to project debt dynamics five years ahead.
Historical
6
Baseline 31
0
5
10
15
20
25
30
35
40
45
50
2008 2010 2012 2014 2016 2018
Baseline and Historical Scenarios
Gross financing need under baseline
i-rate shock 32
Baseline 31
0
5
10
15
20
25
30
35
40
45
50
2008 2010 2012 2014 2016 2018
Interest Rate Shock (In percent)
Baseline:
Scenario:
Historical:
2.83.0
2.8
Growth shock 32
Baseline 31
05
101520253035404550
2008 2010 2012 2014 2016 2018
Growth Shock (In percent per year)
Baseline:
Scenario:
Historical:
5.85.5
5.7
Growth Shock (In percent per year)
Baseline:
Scenario:
Historical:
5.85.5
5.7
CA shock 36
Baseline 31
05
101520253035404550
2008 2010 2012 2014 2016 2018
Baseline:
Scenario:
Historical:
-2.1-3.02.0
Noninterest Current Account Shock (In percent of GDP)
Combined shock 34
Baseline 31
0
5
10
15
20
25
30
35
40
45
50
2008 2010 2012 2014 2016 2018
Combined Shock 3/
30 % Depreciation 42
Baseline 31
0
5
10
15
20
25
30
35
40
45
50
2008 2010 2012 2014 2016 2018
Real Depreciation Shock 4/

INDONESIA
INTERNATIONAL MONETARY FUND 55
Figure 3.3. Indonesia: Public Debt Sustainability: Bound Tests 1/
(Public debt in percent of GDP)
Source: IMF staff estimates and projections.
2/ Permanent 1/4 standard deviation shocks applied to real interest rate, growth rate, and primary balance.
1/ Shaded areas represent actual data. Individual shocks are permanent one-half standard deviation shocks. Figures in the boxes represent average projections for the respective variables in the baseline and scenario being presented. Ten-year historical average for the variable is also shown.
3/ One-time real depreciation of 30 percent and 10 percent of GDP shock to contingent liabilities occur in 2009, with real depreciation defined as nominal depreciation (measured by percentage fall in dollar value of local currency) minus domestic inflation (based on GDP deflator).
Historical
Baseline
1
2
3
4
5
6
7
8
9
0
10
20
30
40
50
2009 2011 2013 2015 2017
Baseline and Historical Scenarios
Gross financing need under baseline
(right scale)
Baseline
0
10
20
30
40
50
2009 2011 2013 2015 2017
Interest Rate Shock (in percent)
Interest rateshock
Baseline: 1.4Scenario: 3.8Historical: -6.2
Baseline
0
10
20
30
40
50
2009 2011 2013 2015 2017
Growth Shock (in percent per year)
Growth shock
Baseline: 5.7Scenario: 5.4Historical: 5.4
Baseline
0
10
20
30
40
50
2009 2011 2013 2015 2017
PB shock
Primary Balance Shock (in percent of GDP) andNo Policy Change Scenario (constant primary balance)
Baseline: -0.6NPC scenario: -1.1Historical: 1.9
No policy change
Baseline
0
10
20
30
40
50
2009 2011 2013 2015 2017
Combined Shock 2/
Combined shock
Baseline
0
10
20
30
40
50
2009 2011 2013 2015 2017
Real Depreciation and Contingent Liabilities Shocks 3/
30% depreciation
Contingent liabilities shock
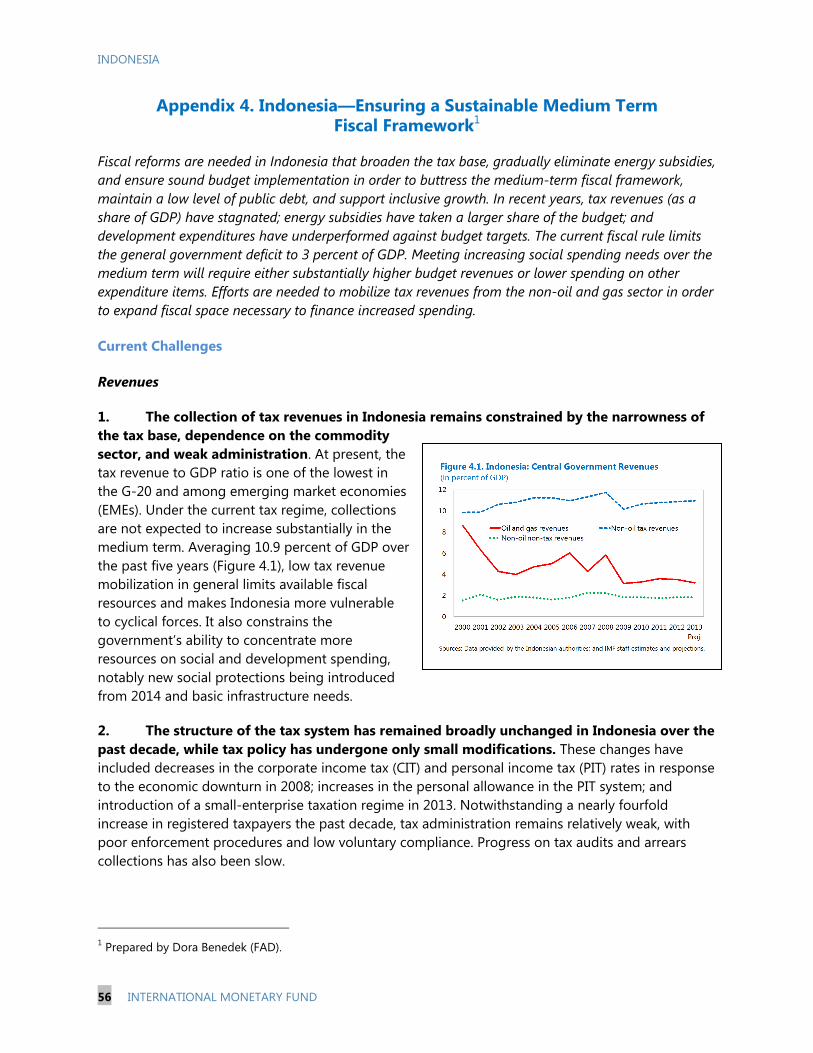
INDONESIA
56 INTERNATIONAL MONETARY FUND
Appendix 4. Indonesia—Ensuring a Sustainable Medium Term Fiscal Framework1
Fiscal reforms are needed in Indonesia that broaden the tax base, gradually eliminate energy subsidies, and ensure sound budget implementation in order to buttress the mediumterm fiscal framework, maintain a low level of public debt, and support inclusive growth. In recent years, tax revenues (as a share of GDP) have stagnated; energy subsidies have taken a larger share of the budget; and development expenditures have underperformed against budget targets. The current fiscal rule limits the general government deficit to 3 percent of GDP. Meeting increasing social spending needs over the medium term will require either substantially higher budget revenues or lower spending on other expenditure items. Efforts are needed to mobilize tax revenues from the nonoil and gas sector in order to expand fiscal space necessary to finance increased spending.
Current Challenges
Revenues
1. The collection of tax revenues in Indonesia remains constrained by the narrowness of the tax base, dependence on the commodity sector, and weak administration. At present, the tax revenue to GDP ratio is one of the lowest in the G20 and among emerging market economies (EMEs). Under the current tax regime, collections are not expected to increase substantially in the medium term. Averaging 10.9 percent of GDP over the past five years (Figure 4.1), low tax revenue mobilization in general limits available fiscal resources and makes Indonesia more vulnerable to cyclical forces. It also constrains the government’s ability to concentrate more resources on social and development spending, notably new social protections being introduced from 2014 and basic infrastructure needs.
2. The structure of the tax system has remained broadly unchanged in Indonesia over the past decade, while tax policy has undergone only small modifications. These changes have included decreases in the corporate income tax (CIT) and personal income tax (PIT) rates in response to the economic downturn in 2008; increases in the personal allowance in the PIT system; and introduction of a smallenterprise taxation regime in 2013. Notwithstanding a nearly fourfold increase in registered taxpayers the past decade, tax administration remains relatively weak, with poor enforcement procedures and low voluntary compliance. Progress on tax audits and arrears collections has also been slow.
1 Prepared by Dora Benedek (FAD).

INDONESIA
INTERNATIONAL MONETARY FUND 57
3. The declining contribution of oil and gas revenues to the budget over the past five years has made collection of tax revenues from other sources even more important. Weak oil and gas revenues are mainly due to a steady decline in oil production, which is likely to continue in the coming years. Oil and gas revenues also remain highly sensitive to movements of world prices and exchange rates. For example, a US$10 increase in the price of oil would raise projected revenues in 2013 by about 0.3 percentage points to 3.5 percent of GDP.
Expenditures
4. Government expenditures remain heavily skewed toward subsidies, leaving limited space for spending on investment and poverty alleviation. The total subsidy bill increased from 2.5 percent of GDP in 2009 to 4.2 percent of GDP in 2012, while development spending remained at 2.7 percent of GDP. Low development spending is due in part to problems with budget implementation. At the same time, development spending is the single largest item in the budget over which the government can exercise full discretion. Thus, the government has used it as a buffer for revenue shortfalls and subsidy overruns. This comes at the detriment of longer term strategic planning and social and infrastructure needs.
5. Despite the June 2013 fuel price increase, almost 90 percent of subsidies remain energy related (Table 4.1). As a result, the subsidy bill is sensitive to movements in world oil prices and the exchange rate (Figure 4.2). For example, if oil prices were to rise by 10 percent or the rupiah to weaken by 10 percent vis à vis the U.S. dollar, staff estimate that energy subsidies would increase by 0.6 percentage points to 4.3 percent of GDP in 2014. An elimination of fuel subsidies over the medium term would create more space for social and capital spending and reduce the exposure of the budget to external shocks.
6. Focusing on development expenditures, capital spending has risen in nominal terms, but continues to perform below budget, while social spending has been suppressed by subsidy costs. Over the past five years, annual disbursements of capital spending have been 70−90 percent of the amount budgeted. Compared with other AsiaPacific and EMEs, total capital spending by general government in Indonesia is in the midrange, suggesting scope for increased investment. Improved execution of budgeted expenditure at the subnational levels remains key here, where a sizable share of capital outlays is disbursed but where implementation capacity remains the weakest. While one off factors (e.g., temporary transfers to offset fuel subsidy
2008 2009 2010 2011 2012
Energy subsidies 223 95 140 256 306(In percent of GDP) 4.5 1.7 2.2 3.4 3.7Fuel subsidy 139 45 82 165 212
Gasoline 44 15 38 80 107Diesel 44 10 22 53 65Kerosene 48 11 8 9 7LPG 4 8 15 23 33
Electricity subsidy 84 50 58 90 95Nonpetroleum 52 43 74 39 40Total 275 138 214 295 346
(In percent of GDP) 5.6 2.5 3.3 4.0 4.2
Sources: Data provided by the Indonesian authorities; and IMF staff estimates.
Table 4.1. Indonesia: Breakdown of Subsidies, 2008−2012
(In trillions of rupiah, unless otherwise indicated)
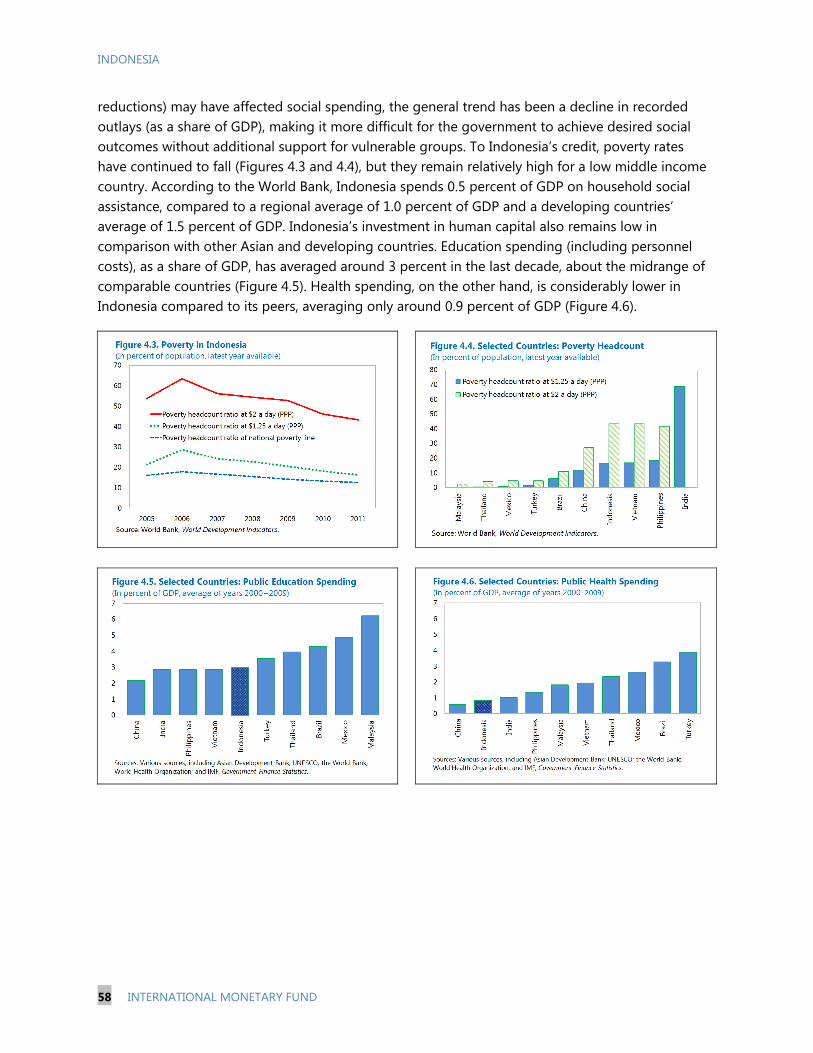
INDONESIA
58 INTERNATIONAL MONETARY FUND
reductions) may have affected social spending, the general trend has been a decline in recorded outlays (as a share of GDP), making it more difficult for the government to achieve desired social outcomes without additional support for vulnerable groups. To Indonesia’s credit, poverty rates have continued to fall (Figures 4.3 and 4.4), but they remain relatively high for a low middle income country. According to the World Bank, Indonesia spends 0.5 percent of GDP on household social assistance, compared to a regional average of 1.0 percent of GDP and a developing countries’ average of 1.5 percent of GDP. Indonesia’s investment in human capital also remains low in comparison with other Asian and developing countries. Education spending (including personnel costs), as a share of GDP, has averaged around 3 percent in the last decade, about the midrange of comparable countries (Figure 4.5). Health spending, on the other hand, is considerably lower in Indonesia compared to its peers, averaging only around 0.9 percent of GDP (Figure 4.6).
INDONESIA
INTERNATIONAL MONETARY FUND 59
Medium Term Fiscal Priorities
7. In the medium term, key structural fiscal reforms are needed to ensure fiscal sustainability and support economic growth. Reforms should focus on continuing efforts to mobilize revenues, eliminate the energy subsidies, and strengthen budget implementation, in order to create additional space for social and infrastructure spending, reduce Indonesia’s vulnerability to external shocks, and improve the effectiveness of fiscal policy.
Tax Revenue
8. Concerted efforts are needed to raise the tax revenue to GDP ratio by strengthening broad based taxes, reducing exemptions and incentives, and improving tax compliance.1 Estimations suggest that over the medium term, Indonesia could raise tax revenues by about 4−5 percentage points of GDP by strengthening both direct and indirect taxes, as well as revenues from the mining sector.
9. Indonesian tax law provides a comprehensive and generally well designed tax regime, but implementation remains a challenge and tax bases need to be broadened. On direct taxes, the base of the CIT has been eroded by use of extensive tax incentives. In addition, the base is not protected by rules against thin capitalization which make it easy to transfer the tax base to other jurisdictions. The government needs to fully analyze the prevalence and cost of tax expenditures as part of a base broadening strategy. On indirect taxes, revenue productivity is low due to extensive exemptions, leaving room for base broadening as well. Indonesia’s natural resource tax regime is in line with international practice and the income tax rates and royalty charges are broadly appropriate, but more could be done to capture rents and minimize disincentives for investment and production. Furthermore, the high level of export taxes on some minerals discourages production and investment.
10. Taxpayers comprise a relatively narrow segment of the population, but their share (both for individuals and corporations) has been steadily increasing over the last decade. The current challenge is to raise the number of tax returns filed by registered taxpayers, therefore increasing their compliance. At the same time, an increased number of tax returns entails greater administrative burden on the tax authority, which could be alleviated by improving capacity and simplifying administration.
Energy Subsidies
11. Further reforms to energy subsidies are needed to generate the fiscal space necessary to address near term pressures and allow more productive spending over the longer term. In the absence of subsidy reform, but with world oil prices expected to moderate over the projection horizon, energy subsidies are projected to gradually decrease to around 2.8 percent of GDP by 2018,
1 A 2011 selected issues paper on Indonesia (IMF Country Report No. 11/310) discusses revenue mobilization possibilities in Indonesia, and a 2012 selected issues paper on Indonesia (IMF Country Report No. 12/278) analyzes mining sector taxation in more detail.

INDONESIA
60 INTERNATIONAL MONETARY FUND
but still remain above the 2010 level as a share of GDP.1 Fuel subsidies constitute a substantial fiscal risk to the budget, especially with fuel consumption expected to grow faster than real GDP over the medium term. Electricity subsidies have also been on the rise, almost doubling since 2009 as a share of GDP, despite intermittent price adjustments.
12. Both fuel and electricity subsidies should be gradually eliminated over the medium term by raising prices to the cost recovery levels. Currently, most of the benefits of energy subsidies accrue to high income households. Cutting energy subsidies would open considerable fiscal space for social and development spending and also eliminate some of the risks to budget execution associated with the current fuel subsidy system. Some of the savings generated could compensate vulnerable groups through targeted social programs. The government should also consider tackling the rapid growth in LPG subsidies and move ahead with planned reforms of the electricity subsidy.
Social Security System
13. Current plans to increase spending on social protections are well placed, but will require careful execution to bring Indonesia in line with comparator countries. The 2004 Sistem Jaminan Sosial Nasional (SJSN) or National Social Security System Law contains provisions both for health and pension insurance. The law sets out the gradual introduction of a universal health care system that will cover the entire population, including both formal and informal workers. Formal sector workers will pay a fixed percent payroll tax (the current rate is set at 5 percent); while informal sector workers will be required to pay a fixed monthly contribution (the proposal was Rp 35,000 per month per person). Contribution of poor and near poor households will be paid by the central government. The proposed 2014 budget uses a monthly contribution of Rp 19,200 per person for Indonesia’s 86 million poor and near poor, with Rp 25 trillion (0.2 percent of GDP) allocated next year for this purpose.
14. The projected spending on these new protections remains uncertain, in part due to concerns about the capacity of the government to execute them. The government is not only responsible for paying contributions for the poor, but also for covering any gap between contributions and spending of the health fund. The 5 percent contribution rate may not be sufficient to cover the direct health care costs of formal sector workers and their dependents, posing an additional burden on the budget. However, about 75 million individuals that either work in the informal sector or are not covered by the budget are expected to pay the fixed monthly contribution. Collection of these contributions will be difficult, especially in the early years of the transition. A further risk for the budget is that public health spending is likely to grow faster than income and will require development of additional capacity financed by the central government. The SJSN Law also establishes a pension program for salaried workers to be implemented starting in 2015. The contribution rate has not yet been decided. Along with the pension program, the introduction of a minimum social pension could help reduce poverty among the elderly.
1 Staff’s baseline differs from this number since the medium-term projection incorporates a gradual elimination of fuel and electricity subsidies.
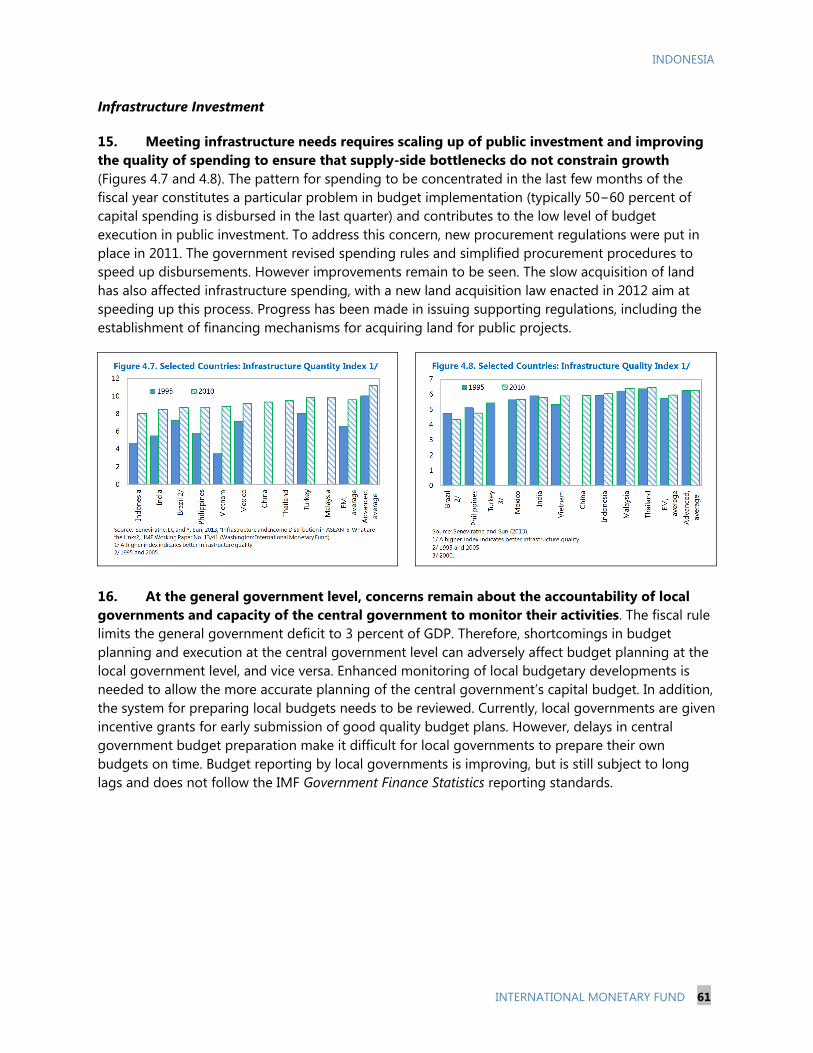
INDONESIA
INTERNATIONAL MONETARY FUND 61
Infrastructure Investment
15. Meeting infrastructure needs requires scaling up of public investment and improving the quality of spending to ensure that supplyside bottlenecks do not constrain growth (Figures 4.7 and 4.8). The pattern for spending to be concentrated in the last few months of the fiscal year constitutes a particular problem in budget implementation (typically 50−60 percent of capital spending is disbursed in the last quarter) and contributes to the low level of budget execution in public investment. To address this concern, new procurement regulations were put in place in 2011. The government revised spending rules and simplified procurement procedures to speed up disbursements. However improvements remain to be seen. The slow acquisition of land has also affected infrastructure spending, with a new land acquisition law enacted in 2012 aim at speeding up this process. Progress has been made in issuing supporting regulations, including the establishment of financing mechanisms for acquiring land for public projects.
16. At the general government level, concerns remain about the accountability of local governments and capacity of the central government to monitor their activities. The fiscal rule limits the general government deficit to 3 percent of GDP. Therefore, shortcomings in budget planning and execution at the central government level can adversely affect budget planning at the local government level, and vice versa. Enhanced monitoring of local budgetary developments is needed to allow the more accurate planning of the central government’s capital budget. In addition, the system for preparing local budgets needs to be reviewed. Currently, local governments are given incentive grants for early submission of good quality budget plans. However, delays in central government budget preparation make it difficult for local governments to prepare their own budgets on time. Budget reporting by local governments is improving, but is still subject to long lags and does not follow the IMF Government Finance Statistics reporting standards.
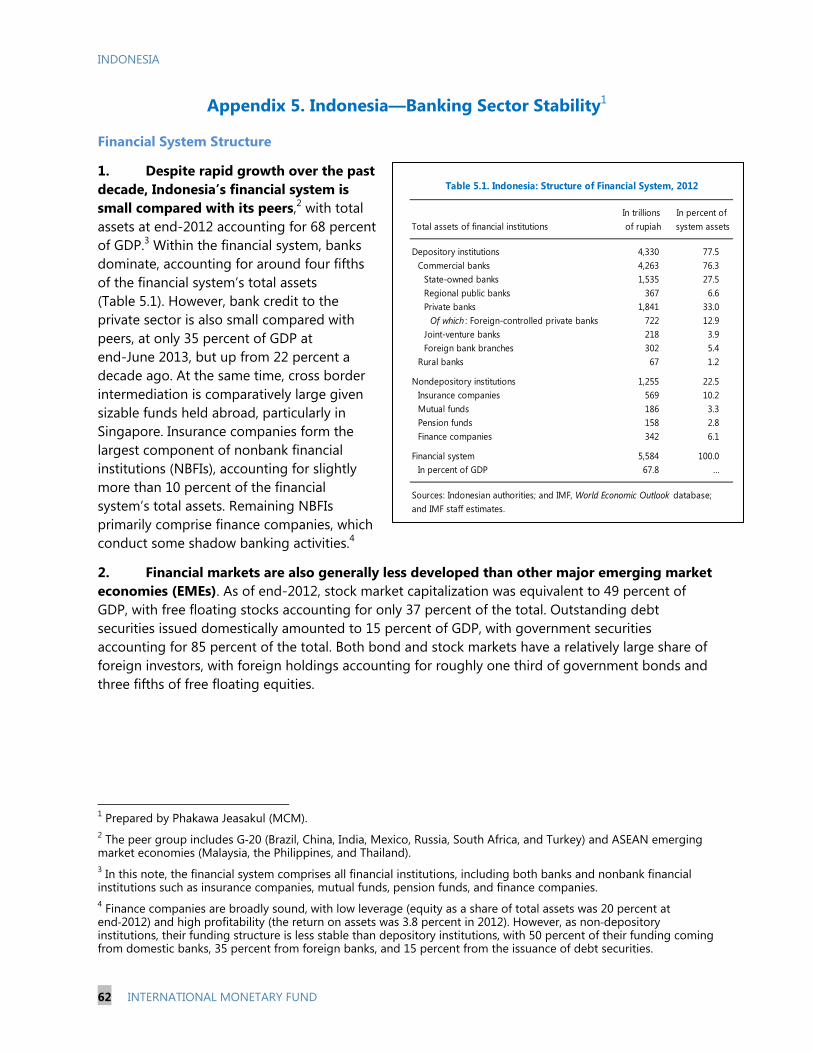
INDONESIA
62 INTERNATIONAL MONETARY FUND
Appendix 5. Indonesia—Banking Sector Stability1
Financial System Structure
1. Despite rapid growth over the past decade, Indonesia’s financial system is small compared with its peers,2 with total assets at end2012 accounting for 68 percent of GDP.3 Within the financial system, banks dominate, accounting for around four fifths of the financial system’s total assets (Table 5.1). However, bank credit to the private sector is also small compared with peers, at only 35 percent of GDP at endJune 2013, but up from 22 percent a decade ago. At the same time, cross border intermediation is comparatively large given sizable funds held abroad, particularly in Singapore. Insurance companies form the largest component of nonbank financial institutions (NBFIs), accounting for slightly more than 10 percent of the financial system’s total assets. Remaining NBFIs primarily comprise finance companies, which conduct some shadow banking activities.4
2. Financial markets are also generally less developed than other major emerging market economies (EMEs). As of end2012, stock market capitalization was equivalent to 49 percent of GDP, with free floating stocks accounting for only 37 percent of the total. Outstanding debt securities issued domestically amounted to 15 percent of GDP, with government securities accounting for 85 percent of the total. Both bond and stock markets have a relatively large share of foreign investors, with foreign holdings accounting for roughly one third of government bonds and three fifths of free floating equities.
1 Prepared by Phakawa Jeasakul (MCM). 2 The peer group includes G‐20 (Brazil, China, India, Mexico, Russia, South Africa, and Turkey) and ASEAN emerging market economies (Malaysia, the Philippines, and Thailand). 3 In this note, the financial system comprises all financial institutions, including both banks and nonbank financial institutions such as insurance companies, mutual funds, pension funds, and finance companies. 4 Finance companies are broadly sound, with low leverage (equity as a share of total assets was 20 percent at end‐2012) and high profitability (the return on assets was 3.8 percent in 2012). However, as non‐depository institutions, their funding structure is less stable than depository institutions, with 50 percent of their funding coming from domestic banks, 35 percent from foreign banks, and 15 percent from the issuance of debt securities.
In trillions In percent of Total assets of financial institutions of rupiah system assets
Depository institutions 4,330 77.5Commercial banks 4,263 76.3
State-owned banks 1,535 27.5Regional public banks 367 6.6Private banks 1,841 33.0
Of which : Foreign-controlled private banks 722 12.9Joint-venture banks 218 3.9Foreign bank branches 302 5.4
Rural banks 67 1.2
Nondepository institutions 1,255 22.5Insurance companies 569 10.2Mutual funds 186 3.3Pension funds 158 2.8Finance companies 342 6.1
Financial system 5,584 100.0In percent of GDP 67.8 …
and IMF staff estimates.
Table 5.1. Indonesia: Structure of Financial System, 2012
Sources: Indonesian authorities; and IMF, World Economic Outlook database;
INDONESIA
INTERNATIONAL MONETARY FUND 63
Recent Banking Sector Performance
3. The banking sector appears generally sound, although some divergence exists within the system. Financial soundness indicators of Indonesian banks broadly improved in 2012 (see Table 8 in main text of the staff report) and also compare favorably with peers (Figure 5.1). Key noteworthy aspects are:
Banks are well capitalized in absolute terms and against major EME and ASEAN peers, but the quality of capital remains an issue (see paragraph 13). The system wide capital adequacy ratio (CAR) was 17.5 percent at endJune 2013, unchanged from a year earlier. Large private domestic banks generally have lower capital levels (Table 5.3). Capital largely comprises Tier1 capital, with a system wide Tier 1 CAR at 16.1 percent.
Profitability is high, with earnings in recent years benefiting from strong economic growth and wide net interest margins. The return on assets of Indonesian banks amounted to 2.6 percent in 2012, comparatively high among major emerging market and ASEAN peers. Profitability tends to be lower at small private domestic banks, in part due to higher operating costs given more limited economies of scale.
Liquidity remains ample, although the system wide liquidity ratio was relatively low among peers. At end June 2013, the ratio of liquid assets to short term liabilities was 34 percent; however, it would be well above 100 percent if stable funding such as current and savings deposits were excluded from short term liabilities, suggesting that the banking system as a whole is not subject to significant liquidity risk. That said, bank liquidity is not evenly distributed across the system, with small private domestic banks holding less liquid assets relative to their balance sheets, which bears close watch.
Asset quality has been improving, with broadly adequate provisions for nonperforming loans (NPLs). NPLs at endJune 2013 were 1.8 percent of total loans, down from 3.3 percent at endDecember 2009. For most banks, NPLs are well provisioned, with the loss provisions for impaired loans at about 130 percent of NPLs for the banking system as a whole. However, provisions for NPLs may not be adequate at some regional public banks and small private domestic banks.
4. The banking sector has been relatively insulated from market turbulence arising in May 2013. The impact of the significant decline in both bond and equity prices on banks has been minimal, given their limited direct exposure to securities (only about 10 percent of total earning assets). The wealth effect on other domestic entities has also been small, as foreign investors hold a sizable share of government bonds and free floating stocks, mitigating spillovers through this macrofinancial channel and shielding banks from suffering consequential credit losses.
5. While credit growth has moderated since mid 2012, the recent expansion may pose elevated risks going forward. Main concerns are as follows:
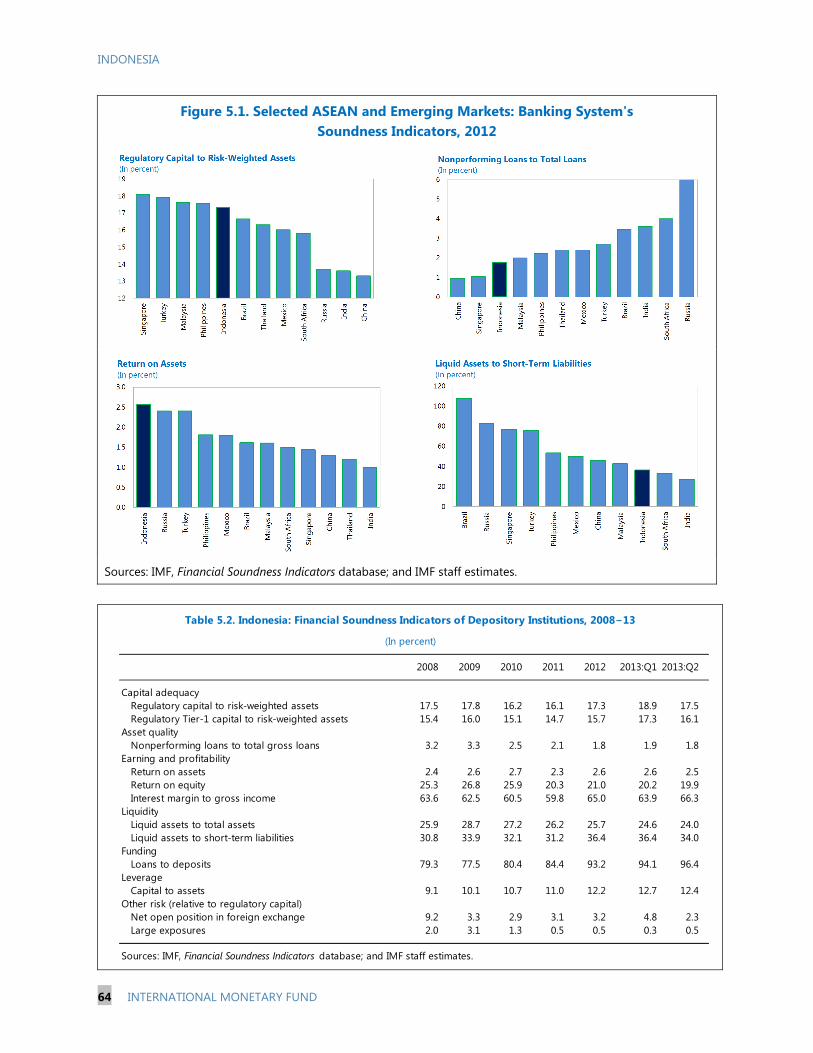
INDONESIA
64 INTERNATIONAL MONETARY FUND
Figure 5.1. Selected ASEAN and Emerging Markets: Banking System's Soundness Indicators, 2012
Sources: IMF, Financial Soundness Indicators database; and IMF staff estimates.
2008 2009 2010 2011 2012 2013:Q1 2013:Q2
Capital adequacyRegulatory capital to risk-weighted assets 17.5 17.8 16.2 16.1 17.3 18.9 17.5Regulatory Tier-1 capital to risk-weighted assets 15.4 16.0 15.1 14.7 15.7 17.3 16.1
Asset qualityNonperforming loans to total gross loans 3.2 3.3 2.5 2.1 1.8 1.9 1.8
Earning and profitabilityReturn on assets 2.4 2.6 2.7 2.3 2.6 2.6 2.5Return on equity 25.3 26.8 25.9 20.3 21.0 20.2 19.9Interest margin to gross income 63.6 62.5 60.5 59.8 65.0 63.9 66.3
LiquidityLiquid assets to total assets 25.9 28.7 27.2 26.2 25.7 24.6 24.0Liquid assets to short-term liabilities 30.8 33.9 32.1 31.2 36.4 36.4 34.0
FundingLoans to deposits 79.3 77.5 80.4 84.4 93.2 94.1 96.4
LeverageCapital to assets 9.1 10.1 10.7 11.0 12.2 12.7 12.4
Other risk (relative to regulatory capital)Net open position in foreign exchange 9.2 3.3 2.9 3.1 3.2 4.8 2.3Large exposures 2.0 3.1 1.3 0.5 0.5 0.3 0.5
Sources: IMF, Financial Soundness Indicators database; and IMF staff estimates.
Table 5.2. Indonesia: Financial Soundness Indicators of Depository Institutions, 2008−13
(In percent)

INDONESIA
INTERNATIONAL MONETARY FUND 65
Figure 5.2. Indonesia: Loans Extended by Commercial Banks, 2011−13
Sources: Bank Indonesia; and IMF staff estimates.
Macroprudential policy measures implemented in 2012 may not have been as effective
as expected in slowing credit growth and mitigating related risks. The deceleration in credit expansion since early 2012 has been largely due to a more moderate increase in loans to businesses, with the growth rate of loans to households roughly unchanged (Figure 5.2). Macroprudential measures setting caps on loantovaluation (LTV) ratios and minimum down payments for vehicle purchases have slowed recorded growth in housing and auto loans, but this change has been largely offset by accelerated growth in multipurpose loans, suggesting a potential diversion of credit in order to circumvent these measures.
Recent credit expansion has been accompanied by a significant increase in property prices. Residential property prices in major cities have been rising steadily over the past decade, with prices in the Jakarta area up 10 percent year on year in June 2013 (the increase appearing substantially larger for high end properties). Nonetheless, loans for housing purchases and loans to construction companies remain a small portion of banks’ balance sheets (about 12 percent of total loans). Therefore, the direct impact of property price reversals on the banking system would likely be limited, although the indirect impact through macrofinancial linkages such as the household wealth effect could be much greater.
Credit growth has outpaced deposit growth over the past few years, resulting in a significant rise in loan to deposit ratios (LDRs). As of end August 2013, the system wide LDR was 89 percent, compared to about 60 percent at end December 2006. Based on envisaged credit and deposit growth in 2013, the system wide LDR is projected to reach 92 percent by end2013, with around onethird of all banks expected to have LDRs in excess of 100 percent (Figure 5.3). Some signs have emerged recently of increasing competition for bank deposits, as small domestic banks face reduced access to local interbank funding due to concerns about counterparty risks, while foreign banks confront higher costs to obtain offshore funding on the back of reduced liquidity in the foreign exchange (FX) market. With the eventual normalization of U.S. monetary policy and tighter global financial conditions, Indonesian banks may have to rely even more on domestic funding to support credit expansion.

INDONESIA
66 INTERNATIONAL MONETARY FUND
Figure 5.3. Indonesia: Commercial Banks’ Vulnerability, 2012−13
Sources: Bank Indonesia; and IMF staff calculations. 1/ Assume the system wide 15 percent growth of loans and 10 percent growth of deposits. Growth rates of individual banks are adjusted based on the pattern observed across banks in 2012. 2/ Assume an outflow of demand, savings, and time deposits by 6.6, 4.8, and 3.7 percent, respectively (equivalent to 2 standard deviations of month to month fluctuations), as well as a complete drawdown of short term wholesale funding. 3/ After accounting for complete write downs associated with restructured and special mentioned loans. The estimation also assumes an expansion of balance sheets by 12.5 percent a year, a compression of net interest margins by 60 bps, and mark to market losses associated with an increase in government treasury yields by 500 bps.
Risk Factors
6. The current environment presents a number of challenges to banks in Indonesia, stemming from slowing economic growth, a less accommodative monetary stance, and higher funding costs. In the near term, banks will likely face heightened funding pressures, which could further raise funding costs and/or reduce their liquidity buffers, and also could adversely affect their profitability. Their balance sheets could also weaken as a result of deteriorating asset quality and losses stemming from market risk. However, most banks should have adequate capital buffers to withstand such shocks.
7. Liquidity risks. Systemic liquidity risk remains low since the bulk of banks’ short term liabilities come from relatively stable retail funding, namely current and savings deposits. Overall, most banks have sufficient high quality liquid assets such as cash, securities, and reserves held at BI to cover a sizable deposit outflow concurrently with a complete withdrawal of short term wholesale funding. Based on end December 2013 data, the total liquidity gap of banks facing liquidity strains was estimated at Rp 9 trillion (0.2 percent of total banking system assets). However, the banking system could face a FX liquidity gap of about US$ 7.5 billion in the event of a system wide shock to FX liabilities, including deposits, other commitments, and contingent liabilities (i.e. a 5 percent FX deposit outflow shock, which would represent the single largest monthly withdrawal in the past decade, simultaneously with an entire drawdown of other FX commitments and contingent liabilities).
8. Funding pressures. Rising funding pressures could also weigh on banks’ earnings. More intense competition by banks for deposits, as well as imperfect passthrough of higher funding costs
40
60
80
100
120
140
160
0 10 20 30 40 50 60 70 80 90 100Percentile of banks
2012 actual 2013 projection 1/
Banks' Funding: Distribution of Loan-to-Deposit Ratios(In percent)
0
50
100
150
200
250
300
0 10 20 30 40 50 60 70 80 90 100
Liqu
id a
sset
s to
ass
umed
fund
ing
outf
low
s (in
per
cent
)
Share of banks
In total
As a share of banking system assets
Banks' Liquidity Gap: Distribution of Ratios of Liquid Assets to Assumed Funding Outflows, 2013 2/
0
2
4
6
8
10
0 10 20 30 40 50 60 70 80 90 100
Add
ition
al n
onpe
rfor
min
g lo
ans
(in p
erce
nt o
f tot
al lo
ans)
Share of banks
In total
As a share of banking system assets
Banks' Ability to Absorb Credit Losses: Distribution of Additional Nonperforming Loans That Banks Could Absorb, 2013 3/

INDONESIA
INTERNATIONAL MONETARY FUND 67
to borrowers, will likely narrow net interest margins and reduce banks’ profitability. If net interest margins were to compress by 60 bps (i.e., by onetenth of the current system wide margin), banks’ return on assets would fall by an estimated 0.5 percentage point and their capital buffers would be lower by 0.8 percent of risk weighted assets. As small domestic banks appear to be facing more acute funding pressures, their net interest margins are likely to be more compressed going forward, potentially eroding their capital buffers more than other banks.
9. Credit risks. Changes in asset quality are also likely to affect banks’ balance sheets. The combination of lower economic growth, rising interest rates, and sectoral weaknesses could significantly worsen the quality of assets on banks’ balance sheets, especially those banks already carrying sizable restructured and special mention loans. In this regard, state owned banks may be more vulnerable given that their loan portfolios comprise a larger share of restructured loans (2.5 percent compared to 1.8 percent system wide) and special mention loans (5.1 percent compared to 3.7 percent system wide). While banks’ direct exposure to the property sector is limited, the combination of higher domestic interest rates and a sharp reversal in property prices could weaken property developers’ and mortgage holders’ ability to service debt, potentially adding to banks’ credit losses.
10. Market risks. Banks are also increasingly exposed to market risks in an environment of rising interest rates and volatile currency movements, but so far these risks remain manageable. For each 100 bps increase in government treasury yields, mark to market losses would reduce the system wide CAR by an estimated 0.15 percentage point.1 Even if the total increase were 500 bps, the banking system could absorb the loss, which would amount to about 20 percent of total net income on average. Furthermore, risks associated with exchange rate fluctuations should be monitored closely given that FX lending accounts for 15 percent of total loans, some of which may not be fully hedged by borrowers. That said, the direct impact of currency movements on banks’ balance sheets appears minimal given a small system wide net open FX position (4.5 percent of capital at end June 2013).
11. Capital buffers. Currently, most banks in Indonesia have adequate capital buffers to absorb sizable credit and market losses. If all current restructured and special mention loans were classified as NPLs, additional provisions would amount to about Rp 125 trillion (3 percent of total banking system assets). The system wide CAR as of end2013 would fall to 14.2 percent from 17.5 percent as of end2012, with around 5 percent of banks likely to breach the minimum capital requirement of 8 percent. Even after accounting for these complete write downs of restructured and special mention loans, the banking system as a whole would still be able to withstand a further increase in the NPL ratio of 6.8 percentage points to around 9 percent before breaching the minimum capital requirement (based on a very conservative assumption that all new NPLs would be fully provisioned).2 However, the capacity to meet additional credit losses varies across banks, with a number of small private domestic banks potentially exposed to capital shortfalls.
1 Bank Indonesia’s latest stress test, published in its March 2013 Financial Stability Review, suggests a broadly similar magnitude of mark‐to‐market losses for available-for-sale securities only, with the system-wide CAR falling by 0.31 percentage points following a five percent reduction in bond prices. 2 Bank Indonesia’s latest stress test suggests that losses associated with credit risk would be even smaller. Particularly, if the NPL ratio increases by 6.5 percentage points, the system-wide CAR would only fall by 1.8 percentage points.
INDONESIA
68 INTERNATIONAL MONETARY FUND
Banking Sector Oversight
12. The framework for banking sector oversight has been strengthened, with all three pillars of Basel II implemented in 2012. With the adoption of Basel II, all Indonesian banks are now using the standardized approach for credit risk under Pillar 1. The riskbased supervisory approach under Pillar 2 is still at the nascent stage, with BI recently introducing a risk based rating system covering a bank’s risk profile, profitability, capital adequacy, and corporate governance as a tool for assessing the soundness in its supervisory framework. Stress testing based on a full fledged scenario analysis has not been incorporated into individual banks’ Internal Capital Adequacy Assessment Process or into BI’s systemic risk assessment and supervisory process.
13. Progress has also been made in addressing gaps in the regulatory framework identified by the 2010 Financial Sector Assessment Program (FSAP). Bank Indonesia has enhanced the prompt corrective action framework by placing banks under intensive supervision and special surveillance now based on qualitative indicators in addition to simple quantitative indicators such as CARs. In addition, the criteria for initiating the resolution process for unviable banks have become more stringent. Furthermore, BI has revised its regulation on the treatment of restructured loans, allowing them to be reclassified by one notch but only after a borrower has fulfilled repayment obligations for at least three consecutive periods.
14. However, a number of regulatory weaknesses identified in the FSAP need to be addressed. Foremost, Tier1 capital still includes certain items that do not meet the test of certainty, permanence, and ability to meet losses on an ongoing basis.1 In addition, certain areas of asset classification and provisioning regulations remain an issue, although the rules governing restructured loans have been tightened. Specifically, exposures backed by certain collateral (such as guarantees) do not have to be classified as NPLs even if they are in default, and the uniform asset classification norm and the application of forward looking risk assessment in classifying assets are subject to numerous exemptions.
15. Finally, several regulations have been introduced in recent years that could undermine financial stability by distorting incentives in banks’ risk management. Most notably, the LDR‐linked reserve requirement (adopted in 2010), which imposes surcharges on banks with LDRs falling outside a stipulated range, could encourage banks below the floor on this reserve requirement to lend more aggressively to avoid higher surcharges on reserve requirements.2 In addition, the new regulation issued by BI in 2012 stipulates that banks must allocate 20 percent of their lending to micro , small , and medium size enterprises by 2018. While around half of all banks are already in compliance, others may need to substantially alter their business models and risk management practices in Indonesia to contain potential credit risks arising from a lack of expertise in lending to this sector.
1 The Tier‐1 CAR would be 2 percentage points lower if adjusted for specific reserves, which may not be usable for meeting losses, and for unaudited current year’s profits. The ratio would decline further by about 2 percentage points if net interoffice funds of foreign bank branches are excluded. 2 Currently, the reserve requirement would be 0.1 percentage points higher for each additional LDR (in percentage points) below 78 percent, and 0.2 percentage points higher for each additional LDR above 92 percent (originally, 100 percent). As of end-2012, about one quarter of banks (accounting for 42 percent of total banking system assets) had LDRs below 78 percent.

INDONESIA
INTERNATIONAL MONETARY FUND 69
Appendix 6. Indonesia—Labor Market Policies and Economic Growth1
This note provides additional analytical background and supporting empirical evidence on the impact of labor market policies in Indonesia on structural transformation and economic growth. Cross country data show that the allocation of labor across sectors affects aggregate labor productivity substantially, which, in turn, determines growth in income per capita. Moreover, the data identify labor market rigidity as a significant factor in hampering the efficient reallocation of labor. This finding points to an important policy lesson, not only for Indonesia but also for other low middle income countries, on necessary conditions to sustain economic growth and avoid a middle income trap.
Conceptual Background
1. Labor productivity is a key determinant of GDP per capita. The following identity breaks down GDP per capita into two parts: aggregate labor productivity and the employment share of total population in the economy, where:2
Accordingly, a country can become richer, in principle, either by improving labor productivity, increasing employment share, or both. Cross sectional data suggest that this occurs mostly via the labor productivity channel. Taking a sample of 46 economies and looking at their growth rates in per capita GDP and aggregate labor productivity during the period 1996−2007, it can be observed that for almost all economies changes in labor productivity growth dominated over changes in employment share in determining per capita GDP growth (Figure 6.1).3 Simple ordinary least squares (OLS) regressions confirm this (Table 6.1), showing that aggregate labor productivity growth explains about 92 percent of the variation in per capita GDP growth across countries.4 For this reason, it is crucial to understand what constitutes aggregate labor productivity.
2. Aggregate labor productivity may be further decomposed into two parts. The first part is a simple average of sector level labor productivity; the second part corresponds to total covariance between each sector’s employment share and labor productivity, which measures the degree of efficient allocation of labor across sectors.
1 Prepared by Jaebin Ahn (APD). 2 In this note, gross domestic product and gross value added are used interchangeably at both the aggregate and sector levels. Accordingly, no distinction is made between labor productivity and value added per worker. 3 Among 50 countries/territories for which data during 1996−2007 are available, the baseline sample excludes the top two and bottom two countries in terms of the measurement of covariance term to avoid outliers. Results are robust to both baseline and complete samples. The sample period is chosen to maximize the sample size. 4 Similar results hold when within-country growth in panel or per capita GDP level in the cross section is considered.

INDONESIA
70 INTERNATIONAL MONETARY FUND
If the covariance term is positive, this indicates that more labor is employed in more productive sectors. On the other hand, if the covariance term is negative, this implies that more labor is employed in less productive sectors, i.e., labor allocation is relatively inefficient.1
Empirical Evidence
3. The degree of efficient labor allocation varies significantly across economies. Using the same sample of 46 countries/territories as above, aggregate labor productivity in 2007 is broken into its two components (Table 6.2).2 All three variables (aggregate labor productivity, the average of sectorlevel productivity, and the covariance term) are then scaled by the aggregate labor productivity level in 1996. The labor productivity term (column 1) measures growth in aggregate labor productivity during 1996−2007. The average productivity term (column 2) represents the hypothetical aggregate labor productivity growth that would have been achieved with a neutral allocation of labor across sectors (i.e., each sector’s employment share is one third, yielding a zero covariance term) in 2007. Finally, the covariance term (column 3) is the
1 This methodology is developed in industry-level studies; see N. Pavcnik, 2002, “Trade Liberalization, Exit, and Productivity Improvements: Evidence from Chilean Plants,” The Review of Economic Studies, Vol. 69, Issue 1, pp. 245−76. 2 Results are derived from sector-level data (agriculture, industry, and services) from the World Bank’s World Development Indicators database.
Growth in GDP per capita 3/ 4/ 5/ 0.922 *** 0.078(0.078) (0.078)
Constant -0.051 * 0.051 *(0.027) (0.027)
R-squared 0.764 0.023
Observations 46 46
Sources: World Bank, World Development Indicators; and IMF staff estimates.
1/ Significance: * 10 percent; ** 5 percent; *** 1 percent.
3/ Growth is measured as the change in the log value between 1996 and 2007.
5/ From the property of accounting identity, the sum of coefficient estimates incolumns (1) and (2) is 1.
2/ Robust standard errors are provided in parentheses.
4/ GDP is measured in constant U.S. dollars at year 2000 prices.
Dependent Variable
Table 6.1. Economic Growth, Labor Productivity, and Employment Share 1/ 2/
labor productivity 3/ employment share 3/(1) (2)
Growth inGrowth in
CountryLabor
ProductivityAverage
ProductivityCovariance
Term CountryLabor
ProductivityAverage
ProductivityCovariance
Term
Albania 1.59 1.72 -0.13 Luxembourg 1.41 1.04 0.37Australia 1.17 1.05 0.12 Malaysia 1.24 1.25 -0.02Austria 1.20 0.97 0.23 Mauritius 1.39 1.16 0.23Belgium 1.12 0.93 0.19 Mexico 1.13 0.99 0.14Canada 1.14 1.15 -0.01 Moldova 1.78 1.58 0.20Chile 1.23 1.20 0.03 Morocco 1.22 1.31 -0.09China 2.48 2.75 -0.27 Norway 1.17 1.24 -0.07Colombia 0.97 1.01 -0.04 Pakistan 1.07 1.16 -0.08Croatia 1.54 1.27 0.27 Panama 1.27 1.03 0.24Czech Republic 1.45 1.28 0.17 Philippines 1.26 1.52 -0.26Denmark 1.17 1.00 0.17 Poland 1.57 1.31 0.26El Salvador 1.18 1.14 0.04 Portugal 1.14 0.87 0.27Estonia 2.06 1.81 0.25 Puerto Rico 1.19 1.41 -0.22Finland 1.31 1.26 0.05 Romania 1.54 1.47 0.08France 1.11 0.95 0.16 Russian Federation 1.59 1.42 0.16Germany 1.14 0.94 0.20 Slovak Republic 1.58 1.56 0.02Hungary 1.38 1.30 0.08 Spain 0.97 0.86 0.11Iceland 1.33 1.40 -0.06 Sweden 1.28 1.28 0.00Indonesia 1.16 1.47 -0.31 Thailand 1.16 1.39 -0.23Ireland 1.29 1.06 0.24 Trinidad and Tobago 1.50 1.32 0.18Italy 1.02 0.85 0.17 Turkey 1.50 1.35 0.15Korea, Republic of 1.45 1.32 0.13 United Kingdom 1.26 1.06 0.20Kyrgyz Republic 1.30 1.28 0.02 United States 1.23 1.18 0.06
Mean 1.33 1.26 0.07 Standard deviations 0.28 0.32 0.16
Sources: World Bank, World Development Indicators; and IMF staff estimates.
1/ Each variable is the value in 2007 scaled by initial aggregate labor productivity in 1996.
Table 6.2. Breakdown of Labor Productivity in Sample Countries/Territories 1/

INDONESIA
INTERNATIONAL MONETARY FUND 71
additional productivity growth contributed by the actual efficiency of labor allocation in 2007.1 For example, in the case of Indonesia, aggregate productivity grew by 16 percent over the sample period—a rate close to that in Mexico (13 percent). Taking a closer look at the components, however, striking differences are revealed between the two economies. If labor had been allocated neutrally across sectors in 2007, Mexico’s aggregate productivity would have been reduced by 1 percent, whereas Indonesia’s aggregate productivity would have increased significantly by as much as 47 percent. Mexico was able to avoid this loss owing to a relatively more efficient allocation of labor, whereas Indonesia was not able to realize gains due to its extremely inefficient allocation of labor.
4. Relatively less efficient labor allocation in lower income countries has prevented them from achieving higher growth. Studies on economic growth have found that lower income countries tend to grow faster than higher income countries, resulting in convergence (absolute or conditional).2 In line with previous findings, this observation is confirmed by the current dataset, i.e., aggregate labor productivity grew faster in those countries with a lower level of initial aggregate labor productivity in 1996 (Figure 6.2). More interestingly, however, this note provides a unique observation that such a convergence pattern would have been even stronger if every country had shared the same level of labor allocation; i.e., it had zero covariance term in 2007. In reality, the covariance term exerted divergent force; i.e., labor allocation in 2007 was more efficient in countries that had started at a higher level of aggregate labor productivity in 1996 (Figure 6.3). The actual convergence of aggregate labor productivity is estimated to be around 9 percent, which is 5 percentage points lower than the hypothetical rate of convergence (Table 6.3). In other words, an inefficient allocation of labor in lower income countries has dampened the speed of convergence in aggregate labor productivity.
1 Such normalization allows for cross-sectional comparison of the efficiency level of labor allocation, which is absent in an alternative representation of each component’s contribution-to-growth approach; e.g., McMillan, M., and D. Rodrik, 2011, “Globalization, Structural Change, and Productivity Growth,” in Making Globalization Socially Sustainable, eds. by M. Bacchetta and M. Jansen (Geneva: International Labor Organization and World Trade Organization). 2 Most recently, absolute convergence in labor productivity in the manufacturing sector is discussed in Rodrik, D., 2013, “Unconditional Convergence in Manufacturing,” The Quarterly Journal of Economics, Vol. 128, Issue 1, pp. 165−204.
Initial labor productivity -0.091 ** -0.141 *** 0.049 **(in log) (0.039) (0.044) (0.020)
Constant 2.202 *** 2.596 *** -0.394 *(0.395) (0.442) (0.200)
R-squared 0.188 0.332 0.153
Observations 46 46 46
Sources: World Bank, World Development Indicators; and IMF staff estimates.
1/ Significance: * 10 percent; ** 5 percent; *** 1 percent.
3/ From the accounting identity, sum of coefficient estimates in columns (2) and (3)is equal to the coefficient estimate in column (1).4/ Dependent variable in each column is the value in 2007 scaled by initial
(1) (2) (3)
Labor Average CovarianceDependent Variable 4/
Table 6.3. Convergence in Labor Productivity Growth 1/ 2/ 3/
productivity termproductivity
2/ Robust standard errors are provided in parentheses.
aggregate labor productivity in 1996
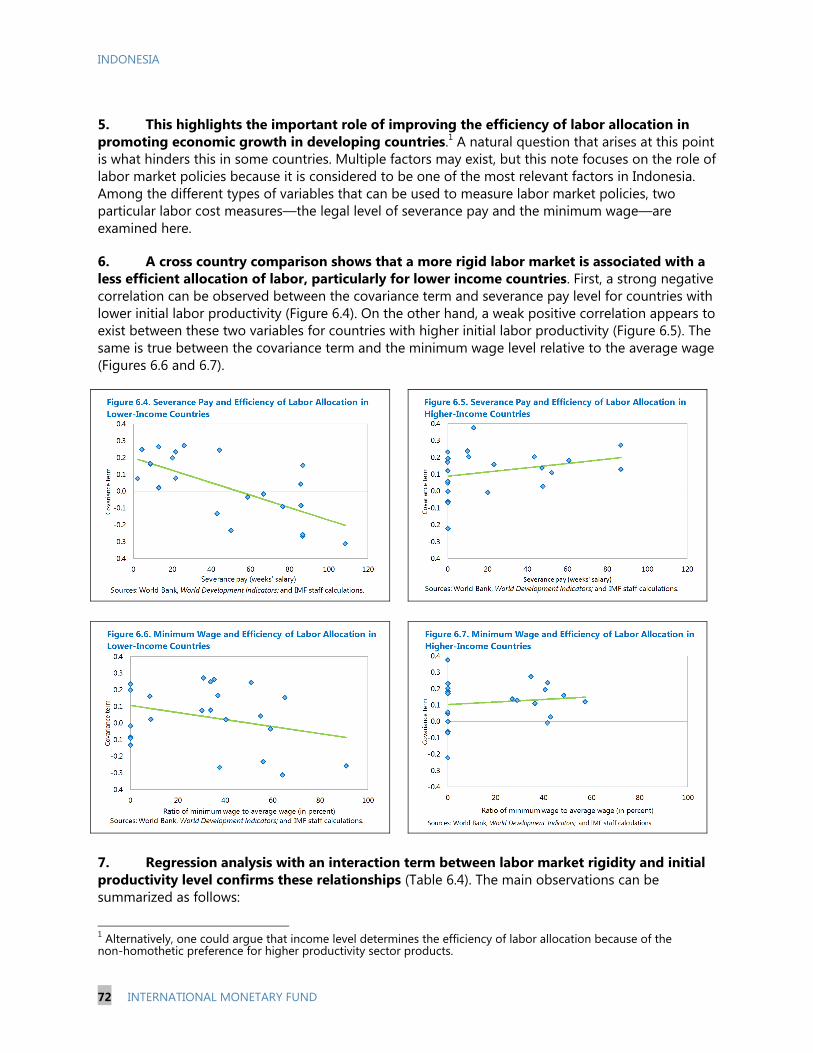
INDONESIA
72 INTERNATIONAL MONETARY FUND
5. This highlights the important role of improving the efficiency of labor allocation in promoting economic growth in developing countries.1 A natural question that arises at this point is what hinders this in some countries. Multiple factors may exist, but this note focuses on the role of labor market policies because it is considered to be one of the most relevant factors in Indonesia. Among the different types of variables that can be used to measure labor market policies, two particular labor cost measures—the legal level of severance pay and the minimum wage—are examined here.
6. A cross country comparison shows that a more rigid labor market is associated with a less efficient allocation of labor, particularly for lower income countries. First, a strong negative correlation can be observed between the covariance term and severance pay level for countries with lower initial labor productivity (Figure 6.4). On the other hand, a weak positive correlation appears to exist between these two variables for countries with higher initial labor productivity (Figure 6.5). The same is true between the covariance term and the minimum wage level relative to the average wage (Figures 6.6 and 6.7).
7. Regression analysis with an interaction term between labor market rigidity and initial productivity level confirms these relationships (Table 6.4). The main observations can be summarized as follows:
1 Alternatively, one could argue that income level determines the efficiency of labor allocation because of the nonhomothetic preference for higher productivity sector products.
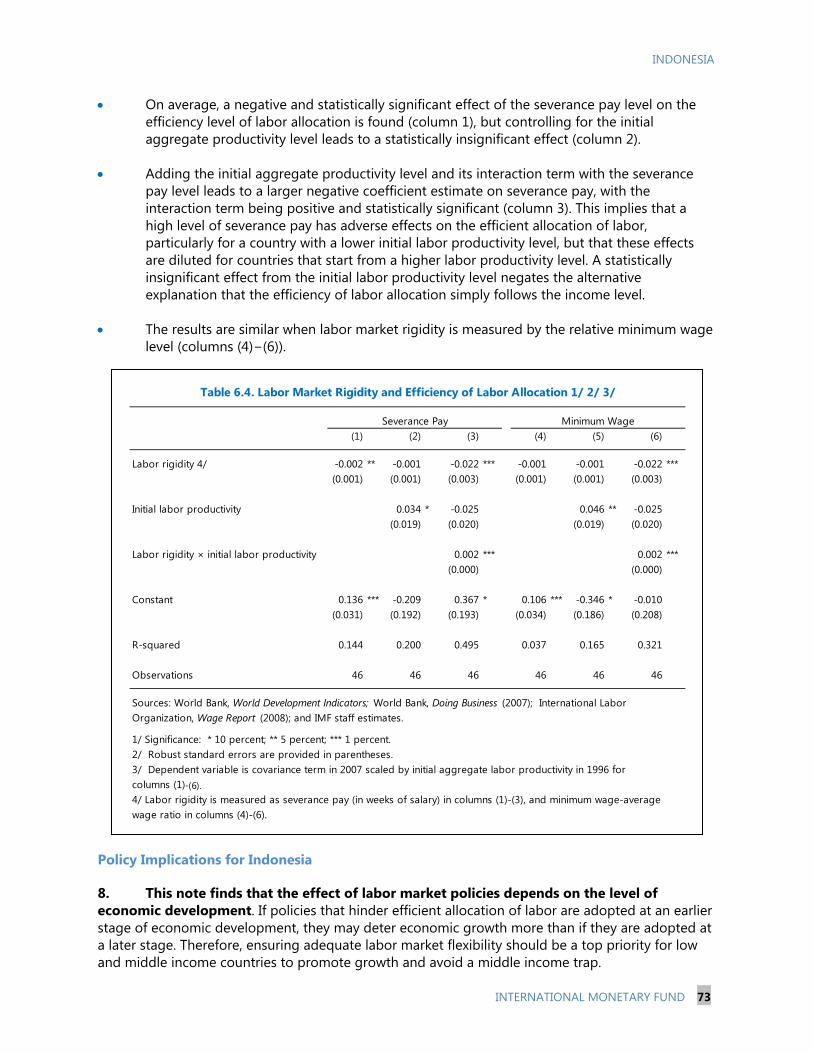
INDONESIA
INTERNATIONAL MONETARY FUND 73
On average, a negative and statistically significant effect of the severance pay level on the efficiency level of labor allocation is found (column 1), but controlling for the initial aggregate productivity level leads to a statistically insignificant effect (column 2).
Adding the initial aggregate productivity level and its interaction term with the severance pay level leads to a larger negative coefficient estimate on severance pay, with the interaction term being positive and statistically significant (column 3). This implies that a high level of severance pay has adverse effects on the efficient allocation of labor, particularly for a country with a lower initial labor productivity level, but that these effects are diluted for countries that start from a higher labor productivity level. A statistically insignificant effect from the initial labor productivity level negates the alternative explanation that the efficiency of labor allocation simply follows the income level.
The results are similar when labor market rigidity is measured by the relative minimum wage level (columns (4)−(6)).
Policy Implications for Indonesia
8. This note finds that the effect of labor market policies depends on the level of economic development. If policies that hinder efficient allocation of labor are adopted at an earlier stage of economic development, they may deter economic growth more than if they are adopted at a later stage. Therefore, ensuring adequate labor market flexibility should be a top priority for low and middle income countries to promote growth and avoid a middle income trap.
Labor rigidity 4/ -0.002 ** -0.001 -0.022 *** -0.001 -0.001 -0.022 *** (0.001) (0.001) (0.003) (0.001) (0.001) (0.003)
Initial labor productivity 0.034 * -0.025 0.046 ** -0.025(0.019) (0.020) (0.019) (0.020)
Labor rigidity × initial labor productivity 0.002 *** 0.002 ***(0.000) (0.000)
Constant 0.136 *** -0.209 0.367 * 0.106 *** -0.346 * -0.010(0.031) (0.192) (0.193) (0.034) (0.186) (0.208)
R-squared 0.144 0.200 0.495 0.037 0.165 0.321
Observations 46 46 46 46 46 46
1/ Significance: * 10 percent; ** 5 percent; *** 1 percent.
4/ Labor rigidity is measured as severance pay (in weeks of salary) in columns (1)-(3), and minimum wage-average wage ratio in columns (4)-(6).
(6)Severance Pay Minimum Wage
(1) (5)
3/ Dependent variable is covariance term in 2007 scaled by initial aggregate labor productivity in 1996 for columns (1)‐(6).
Table 6.4. Labor Market Rigidity and Efficiency of Labor Allocation 1/ 2/ 3/
2/ Robust standard errors are provided in parentheses.
(2) (3) (4)
Sources: World Bank, World Development Indicators; World Bank, Doing Business (2007); International Labor Organization, Wage Report (2008); and IMF staff estimates.
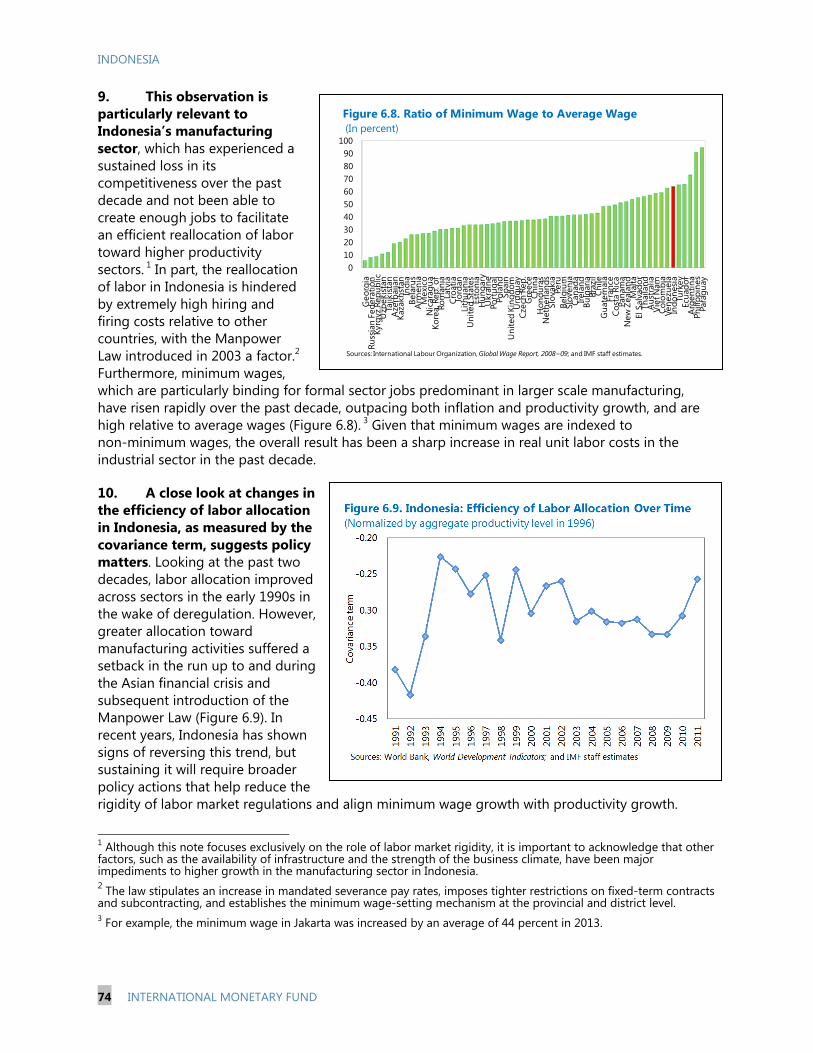
INDONESIA
74 INTERNATIONAL MONETARY FUND
9. This observation is particularly relevant to Indonesia’s manufacturing sector, which has experienced a sustained loss in its competitiveness over the past decade and not been able to create enough jobs to facilitate an efficient reallocation of labor toward higher productivity sectors. 1 In part, the reallocation of labor in Indonesia is hindered by extremely high hiring and firing costs relative to other countries, with the Manpower Law introduced in 2003 a factor.2 Furthermore, minimum wages, which are particularly binding for formal sector jobs predominant in larger scale manufacturing, have risen rapidly over the past decade, outpacing both inflation and productivity growth, and are high relative to average wages (Figure 6.8). 3 Given that minimum wages are indexed to nonminimum wages, the overall result has been a sharp increase in real unit labor costs in the industrial sector in the past decade.
10. A close look at changes in the efficiency of labor allocation in Indonesia, as measured by the covariance term, suggests policy matters. Looking at the past two decades, labor allocation improved across sectors in the early 1990s in the wake of deregulation. However, greater allocation toward manufacturing activities suffered a setback in the run up to and during the Asian financial crisis and subsequent introduction of the Manpower Law (Figure 6.9). In recent years, Indonesia has shown signs of reversing this trend, but sustaining it will require broader policy actions that help reduce the rigidity of labor market regulations and align minimum wage growth with productivity growth.
1 Although this note focuses exclusively on the role of labor market rigidity, it is important to acknowledge that other factors, such as the availability of infrastructure and the strength of the business climate, have been major impediments to higher growth in the manufacturing sector in Indonesia. 2 The law stipulates an increase in mandated severance pay rates, imposes tighter restrictions on fixed-term contracts and subcontracting, and establishes the minimum wage-setting mechanism at the provincial and district level. 3 For example, the minimum wage in Jakarta was increased by an average of 44 percent in 2013.
0102030405060708090
100
Geo
rgia
Ru
ssia
n Fe
dera
tion
Kyrg
yz R
epub
licU
zbek
ista
n Ta
jikis
tan
Aze
rbai
jan
Kaza
khst
an
Indi
a Be
laru
s A
rmen
ia
Mex
ico
Nic
arag
ua
Kore
a, R
ep. o
f Ro
man
ia
Latv
ia
Croa
tia
Jord
an
Lith
uani
a U
nite
d St
ates
Es
toni
a H
unga
ryU
krai
ne
Port
u gal
Po
land
Sp
ain
Uni
ted
King
dom
U
rugu
ay
Czec
h Re
p.
Gre
ece
Chin
a H
ondu
ras
Net
herla
nds
Slov
akia
Pe
ru
Belg
ium
Sl
oven
ia
Cana
da
Irela
nd
Bulg
aria
Br
azil
Chile
G
uate
mal
a Fr
ance
Co
sta
Rica
Pa
nam
a N
ew Z
eala
nd
Mal
ta
El S
alva
dor
Thai
land
A
ustr
alia
Vi
et N
am
Colo
mbi
a Ve
nezu
ela
Indo
nesi
a Tu
rkey
Ec
uado
r A
rgen
tina
Phili
ppin
es
Para
guay
Figure 6.8. Ratio of Minimum Wage to Average Wage(In percent)
Sources: International Labour Organization, Global Wage Report, 2008−09; and IMF staff estimates.
INDONESIA STAFF REPORT FOR THE 2013 ARTICLE IV CONSULTATION—INFORMATIONAL ANNEX Prepared By
Asia and Pacific Department
FUND RELATIONS ________________________________________________________________________ 2 WORLD BANK-IMF COLLABORATION ___________________________________________________ 4 RELATIONS WITH THE ASIAN DEVELOPMENT BANK __________________________________ 7 STATISTICAL ISSUES ______________________________________________________________________ 9
CONTENTS
November 1, 2013
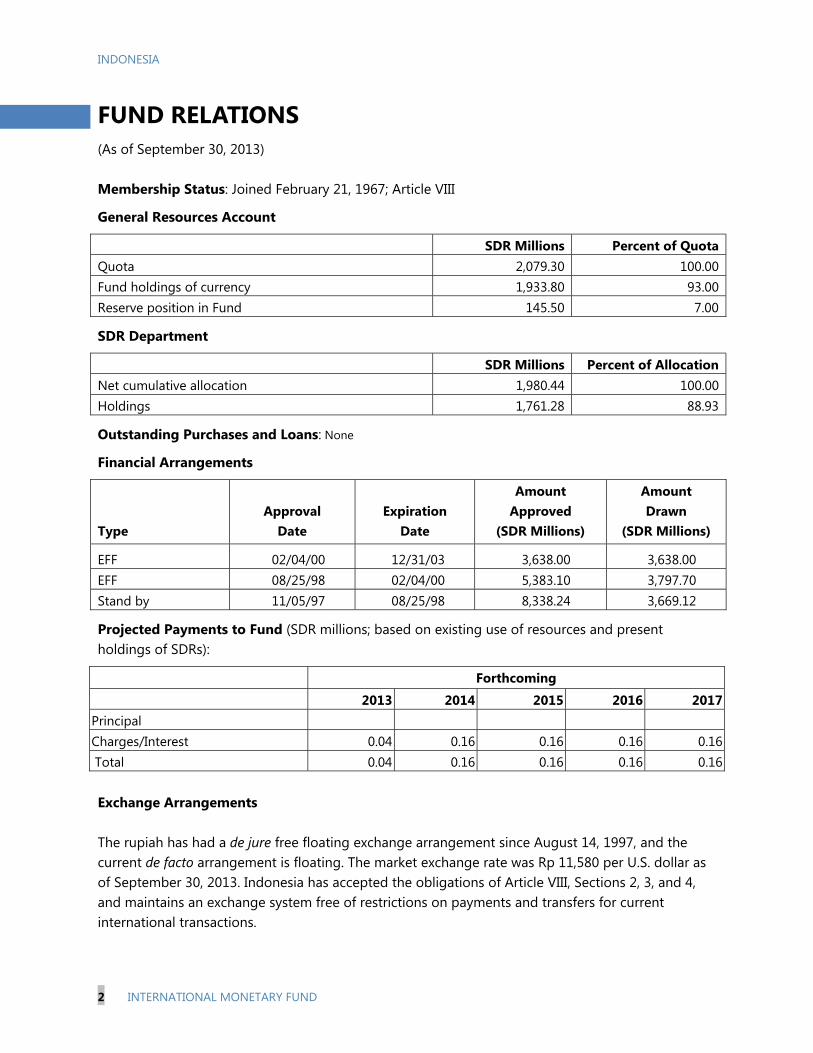
INDONESIA
2 INTERNATIONAL MONETARY FUND
FUND RELATIONS (As of September 30, 2013) Membership Status: Joined February 21, 1967; Article VIII
General Resources Account
SDR Millions Percent of QuotaQuota 2,079.30 100.00Fund holdings of currency 1,933.80 93.00Reserve position in Fund 145.50 7.00
SDR Department
SDR Millions Percent of AllocationNet cumulative allocation 1,980.44 100.00Holdings 1,761.28 88.93
Outstanding Purchases and Loans: None
Financial Arrangements
Type
Approval
Date
Expiration
Date
Amount Approved
(SDR Millions)
Amount Drawn
(SDR Millions)
EFF 02/04/00 12/31/03 3,638.00 3,638.00 EFF 08/25/98 02/04/00 5,383.10 3,797.70 Stand by 11/05/97 08/25/98 8,338.24 3,669.12
Projected Payments to Fund (SDR millions; based on existing use of resources and present holdings of SDRs):
Forthcoming
2013 2014 2015 2016 2017Principal Charges/Interest 0.04 0.16 0.16 0.16 0.16 Total 0.04 0.16 0.16 0.16 0.16 Exchange Arrangements The rupiah has had a de jure free floating exchange arrangement since August 14, 1997, and the current de facto arrangement is floating. The market exchange rate was Rp 11,580 per U.S. dollar as of September 30, 2013. Indonesia has accepted the obligations of Article VIII, Sections 2, 3, and 4, and maintains an exchange system free of restrictions on payments and transfers for current international transactions.

INDONESIA
INTERNATIONAL MONETARY FUND 3
Article IV Consultation The last Article IV consultation report (IMF Country Report No. 12/277) was discussed by the Executive Board on September 7, 2012. Resident Representative Mr. Benedict Bingham has been the Senior Resident Representative since September 2012.
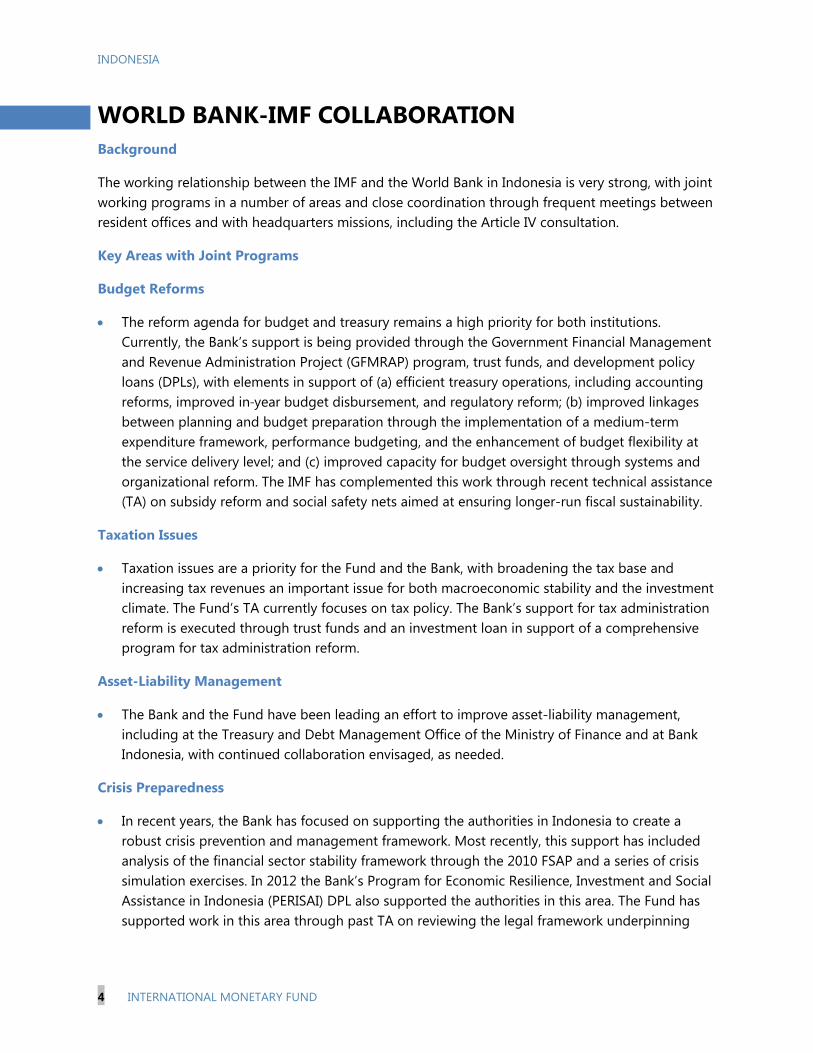
INDONESIA
4 INTERNATIONAL MONETARY FUND
WORLD BANK-IMF COLLABORATION Background
The working relationship between the IMF and the World Bank in Indonesia is very strong, with joint working programs in a number of areas and close coordination through frequent meetings between resident offices and with headquarters missions, including the Article IV consultation.
Key Areas with Joint Programs
Budget Reforms
The reform agenda for budget and treasury remains a high priority for both institutions. Currently, the Bank’s support is being provided through the Government Financial Management and Revenue Administration Project (GFMRAP) program, trust funds, and development policy loans (DPLs), with elements in support of (a) efficient treasury operations, including accounting reforms, improved in˗year budget disbursement, and regulatory reform; (b) improved linkages between planning and budget preparation through the implementation of a medium-term expenditure framework, performance budgeting, and the enhancement of budget flexibility at the service delivery level; and (c) improved capacity for budget oversight through systems and organizational reform. The IMF has complemented this work through recent technical assistance (TA) on subsidy reform and social safety nets aimed at ensuring longer-run fiscal sustainability.
Taxation Issues
Taxation issues are a priority for the Fund and the Bank, with broadening the tax base and increasing tax revenues an important issue for both macroeconomic stability and the investment climate. The Fund’s TA currently focuses on tax policy. The Bank’s support for tax administration reform is executed through trust funds and an investment loan in support of a comprehensive program for tax administration reform.
Asset-Liability Management
The Bank and the Fund have been leading an effort to improve asset-liability management, including at the Treasury and Debt Management Office of the Ministry of Finance and at Bank Indonesia, with continued collaboration envisaged, as needed.
Crisis Preparedness
In recent years, the Bank has focused on supporting the authorities in Indonesia to create a robust crisis prevention and management framework. Most recently, this support has included analysis of the financial sector stability framework through the 2010 FSAP and a series of crisis simulation exercises. In 2012 the Bank’s Program for Economic Resilience, Investment and Social Assistance in Indonesia (PERISAI) DPL also supported the authorities in this area. The Fund has supported work in this area through past TA on reviewing the legal framework underpinning

INDONESIA
INTERNATIONAL MONETARY FUND 5
Indonesia’s financial stability architecture and in its current surveillance dialogue with the authorities and exchange of views with the Bank.
Financial Sector
The Bank has focused on broad monitoring of the financial sector. Most recently, through its Financial Sector and Investment Climate Reform and Modernization DPL, the Bank is supporting the implementation of reforms aimed at maintaining stability, increasing diversification, and enhancing financial sector inclusion in Indonesia. The Fund has concentrated on the banking system, with emphasis on regulation and supervision. It has also embarked on TA in financial deepening, focused initially on money market development. A joint Bank-Fund FSAP was completed in 2010 and some recommendations have been followed through by the authorities. The Bank is to provide TA to implement select FSAP recommendations concerning the nonbank financial sector.
Statistics
The Bank has a major program of capacity building with the statistics agency that was launched in 2010. The program is being designed to focus on improvements in key statistical series that should improve the ability to understand the Indonesian economy, executed through an institution-wide approach, which includes significant IT and personnel/institutional reforms. The Fund has focused recent training and TA on government finance statistics.
Macroeconomics
The Fund continues to take the lead in macroeconomic areas, with the Article IV and other missions, focusing on fiscal, monetary, and exchange rate policies; macrofinancial linkages, financial sector reforms, and crisis management; and the external position and spillover effects. The Fund also updates the Debt Sustainability Analysis at the time of the Article IV consultation, with inputs from the Bank and other development partners. The Bank has also taken on a larger role, including on macroeconomic monitoring, public policy dialogue, and capacity building, with ongoing coordination with the Fund. The Bank team continues to assist the Ministry of Finance‘s Fiscal Policy Office to improve capacity for macroeconomic monitoring, forecasting, and evidence-based macroeconomic and fiscal policy analysis.
These threads of work are expected to be continued by both parties, with periodic meetings aimed at keeping each other informed about ongoing work and joint areas of interest. Issues being addressed include, for the Fund, the external vulnerabilities, exchange rate management, medium‐
term fiscal sustainability, financial stability risks, and labor market rigidities; and for the Bank, the link between macro/fiscal policy and real economic outcomes, including growth and poverty, resource-sector fiscal revenues, and longstanding problems in the implementation and effectiveness of government spending.

INDONESIA
6 INTERNATIONAL MONETARY FUND
Indonesia: Joint Managerial Action Plan, 2013−14
Title
Products
Provisional Timing of Missions
Expected Delivery Date
(Tentative)
A. Mutual Information on Relevant Work Programs
Bank work program for next 12 months
Indonesia Economic Quarterly
Launched in April 2012; the latest issue published in October 2013
Second Institutional, Tax Administration, Social and Investment (INSTANSI), and Connectivity DPLs
November 2013
World Bank follow-up work related to WB/IMF Financial System Assessment Program missions (October 2009 and February‒March 2010)
Ongoing
Development of a Financial Sector and Investment Climate Reform and Modernization (FIRM) DPL
Ongoing
IMF work program for next 12 months
Macroeconomic surveillance
2013 Article IV consultation
August 2013
Board discussion will take place in November 2014
2014 staff visit Early 2014
2014 Article IV consultation Mid-2014
Technical assistance
Financial market deepening 2013−14 Periodic visits
Fiscal risks Late 2013
B. Request for Work Program Inputs
Fund request to Bank
Assessment of economic developments and structural policies
Ongoing
Information sharing Ongoing
Bank request to Fund
Assessment of macroeconomic developments and policies
Ongoing
Information sharing Ongoing
C. Agreement on Joint Products and Missions
Joint work program
Coordination of a follow-up FSAP starting in 2014
Late 2014/early 2015
2015

INDONESIA
INTERNATIONAL MONETARY FUND 7
RELATIONS WITH THE ASIAN DEVELOPMENT BANK (As of December 31, 2012) Asian Development Bank (ADB) cumulative loans to Indonesia reached $28.305 billion as of end
December 2012. The ADB approved a total of $1,232.75 million in loans to Indonesia in 2012, or
11.62 percent of the total loans approved by the institution for the year. The sectors with the largest
shares in cumulative lending are public sector management (18.81 percent), finance (14.93 percent),
agriculture and natural resources (14.30 percent), and energy (13.53 percent).1
Between 1966 and 2012, the ADB provided 527 Technical Assistance (TA) grants to Indonesia
amounting to $366.75 million. The TA grants were financed from the ADB’s TA Special Fund, the
Japan Special Fund, and other sources. Measured by cumulative TA approvals, Indonesia is the
second largest recipient of TA support from the ADB.
The ADB approved a new Country Partnership Strategy 2012−2014 (CPS) with the Government of
Indonesia in May 2012 covering the period 2012−2014. The strategy is aligned with the
Government’s medium-term development plan for 2010−2014 as well as the Masterplan for the
Acceleration and Expansion of Indonesia Economic Development 2011−2025. The CPS is closely
attuned to the needs of Indonesia as a large middle-income country and guided by the
government’s commitment to “pro-poor, pro-job, pro-growth and pro-environment” development.
The two strategic CPS pillars are inclusive growth and environmental sustainability with climate
change, mitigation and adaptation. The ADB will support government efforts to achieve more
inclusive growth by helping to connect poor people and regions to markets by upgrading
infrastructure, improving logistics, and enhancing the skills base needed to boost investment,
productivity, and employment, and by strengthening local government’s capacity for public service
delivery.2
1 Asian Development Bank, 2012, Indonesia Fact Sheet 2012, Manila. 2 Asian Development Bank, 2012, Country Partnership Strategy 2012−2014, Manila.

INDONESIA
8 INTERNATIONAL MONETARY FUND
Table 1. Sovereign and Nonsovereign Loan Approvals and Disbursements to Indonesia (In millions of U.S. dollars)
2005 2006 2007 2008 2009 2010 2011 2012
Loan approvals 1,145.69 784.80 1,187.10 1,085.00 2,184.20 785.00 580.00 1,232.75 Loan disbursements 1,014.99 1,025.88 1,136.30 949.60 739.30 1,079.80 631.90 862.50
Source: Asian Development Bank, Annual Report (various editions).
Table 2. Cumulative Lending to Indonesia (As of December 31, 2012)
Loans Amount Sector (No.) (US$ millions) Percent 1/
Agriculture and natural resources 99 4,047.00 14.30
Education 33 2,297.35 8.12 Energy 32 3,831.05 13.53 Finance 23 4,226.10 14.93 Health and social protection 13 1,068.30 3.77 Industry and trade 12 645.70 2.28 Public sector management 21 5,324.97 18.81 Transport and information and communications technology 35 3,193.86 11.28 Water supply and other municipal 32 1,984.74 7.01 Infrastructure and services Multisector 17 1,686.22 5.96 Total 317 28,305.29 100.00
Source: Asian Development Bank, Indonesia Fact Sheet 2012.
1/ Total may not add up because of rounding.

INDONESIA
INTERNATIONAL MONETARY FUND 9
STATISTICAL ISSUES
Assessment of Data Adequacy for Surveillance
General: Indonesia’s macroeconomic statistics are broadly adequate to conduct effective surveillance.
National accounts: Annual and quarterly GDP data are published in a timely manner for both expenditure and production sides, with 2000 as the base year. The estimates are based on a limited set of indirect indicators of uncertain quality. Some sectors are influenced strongly by seasonality, and seasonally adjusted data are prepared but not published. In addition, no survey of nonfinancial services is prepared. The IMF has recommended: (i) development of a system to continuously update the census of businesses; (ii) introduction of comprehensive annual establishment surveys for nonfinancial services industries; (iii) publication of annual GDP estimates, including a time series of at least 20 years; (iv) development of a set of annual supply and use tables (SUTS) starting from 2000; and (v) enhancement of the convergence exercise on trade data between Bank Indonesia (BI) and the Ministry of Finance (MOF). The revision of the base year of national accounts to 2010 is in progress with technical assistance (TA) from STA, and GDP estimates based on improved data sources and methodology are expected by 2013. Price statistics: Price statistics are broadly adequate for surveillance. Badan Pusat Statistik (BPS), the statistical agency, is developing a producer price index (PPI) with TA from STA to eventually replace the wholesale price index (WPI). The new PPI is planned for publication in 2014, covering both the goods and services.
Government finance statistics: Available government finance data suffer from a number of weaknesses, in terms of classification, coverage, and timeliness. Data on the budget of the central government are available with a one-month lag, but subnational (provincial and local) government data are available only with a lag of two years, and the quality of these data varies widely. Problems in budget and accounting systems have been compounded by recent decentralization initiatives, which have shifted substantial resources to the subnational governments. Significant efforts are being made to overcome these problems, ranging from the planned adoption of advanced accounting and statistical standards to the introduction of best-practice budget management processes and the development of computerized financial management information systems.
Against this background, the MOF is committed to keeping the requirements of fiscal statistics at the forefront of ongoing fiscal reforms, with better statistical monitoring one of the goals of the current efforts. The coverage and timeliness of public debt statistics is generally adequate. The new expenditure classification introduced in the 2005 budget is generally consistent with the Government Finance Statistics Manual 2001 (GFSM 2001) on functional codes and classification, although the data are compiled on a cash basis.
The authorities have committed to adopting GFSM 2001 standards. To this end, IMF staff have recommended in the short term: (i) establishment of a register of all extrabudgetary units; and (ii) inclusion of the economic codes consistent with the GFSM 2001 in the chart of accounts to ensure that general government units report all transactions and balances over which they exert control. Over the medium term, priority should be given to (i) establishment of the underlying reporting arrangements necessary to obtain timely preliminary data for local government statistics; and (ii) development of a GFSM 2001 operating statement, statements of sources and uses of cash, and partial balance sheets, all of which should be published on the MOF’s website. Currently, a system has been set up to allow for an automatic conversion of budget files to GFSM 2001 data; however, these data are yet to be published on the MOF’s website.
The MOF’s continued efforts to compile GFS data for the general government sector, as part of ongoing public financial management reforms, are being assisted by STA.
INDONESIA
10 INTERNATIONAL MONETARY FUND
Monetary and financial statistics (MFS) and financial soundness indicators (FSIs): Good quality monetary statistics are compiled by BI on a timely basis. With STA assistance, BI has compiled and reported monetary data using the Standardized Report Forms (SRFs), from which an integrated database and alternative presentations of monetary statistics can be drawn to meet the needs of BI and the IMF. Bank Indonesia has also compiled monetary data for other financial corporations (OFCs), comprising only finance companies. To strengthen monetary statistics, STA missions have also recommended the expansion of the coverage of OFCs to include insurance companies and pension funds of other depository corporations (ODCs) to include mutual funds. Additional challenges include timely revisions of published banking sector data after supervisory verification.
With assistance from STA, BI has also compiled and reported FSIs to the IMF, which are published on the Fund’s FSI website. The FSIs were initially reported on a semiannual basis. However, starting with the Q4:2011 data, BI began reporting quarterly FSIs to the IMF on a quarterly basis. The FSIs for Indonesia comprise of 11 core FSIs, 12 encouraged FSIs for deposit takers, 2 encouraged FSIs for OFCs, and 3 encouraged FSIs for the real estate sector. A STA mission in 2011 recommended that BI coordinate with other relevant institutions to explore the possibility of compiling FSIs for nonfinancial corporations and households.
Balance of payments (BOP): Trade data have been improved in recent years. Starting in 2006, the import/export transactions of free trade zones are covered in goods data of BOP statistics.
For the capital and financial account, the methodological basis for the compilation of FDI data needs substantial improvement. Inflows are currently calculated based on loan disbursements to companies that have foreign equity using a fixed ratio to estimate equity inflows. Surveys conducted by BI to collect FDI data have a low response rate and the coverage of the directory of enterprises needs to be improved. Other areas that need improvement include the recording of trade credits and the asset data for portfolio investment and other investment transactions. The magnitude of the errors and omissions item in the BOP has been large at times and appears to be related to the under˗coverage of assets in the financial account. Financial transactions data are reconciled with changes in the International Investment Position (IIP), except data on direct investment.
An annual IIP is compiled, but the underlying data are weak in several areas, notably for FDI. External debt statistics have improved considerably with the introduction of an External Debt Information System (EDIS) in 2002 and the recent initiative to publish monthly indicators. Also, as a result of the ongoing reconciliation of data conducted by BI, the IIP and external debt data are fully consistent. However, improvements are still needed with respect to components of private corporate sector data, particularly in distinguishing between scheduled and actual debt service, in estimating the accumulation/reduction of private sector payments arrears, and in estimating reschedulings/debt reductions received by the private sector from external creditors.
Data Standards and Quality
Subscriber to the Special Data Dissemination Standard (SDDS) since September 1996, observing most of the SDDS requirements. Indonesia uses the SDDS flexibility options for the timeliness of the labor market categories (employment, unemployment, and wages/earnings) and general government operations. It is also availing itself of flexibility options for the periodicity of labor market categories (employment and unemployment).
Data Reports on the Observance of Standards and Codes (ROSC) completed in 2005.
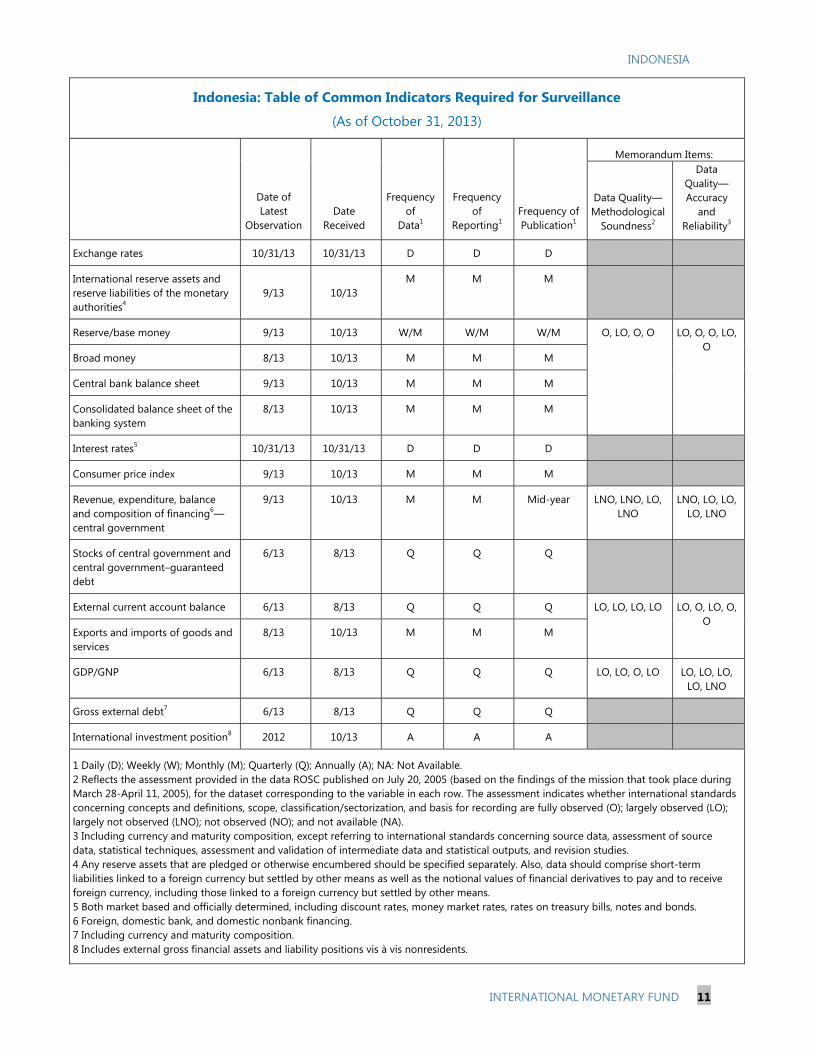
INDONESIA
INTERNATIONAL MONETARY FUND 11
Indonesia: Table of Common Indicators Required for Surveillance
(As of October 31, 2013)
Date of Latest
Observation
Date Received
Frequency of
Data1
Frequency of
Reporting1
Frequency of Publication1
Memorandum Items:
Data Quality—Methodological
Soundness2
Data Quality—Accuracy
and Reliability3
Exchange rates 10/31/13 10/31/13 D D D
International reserve assets and reserve liabilities of the monetary authorities4
9/13
10/13 M M M
Reserve/base money 9/13 10/13 W/M W/M W/M O, LO, O, O LO, O, O, LO, O
Broad money 8/13 10/13 M M M
Central bank balance sheet 9/13 10/13 M M M
Consolidated balance sheet of the banking system
8/13 10/13 M M M
Interest rates5 10/31/13 10/31/13 D D D
Consumer price index 9/13 10/13 M M M
Revenue, expenditure, balance and composition of financing6—central government
9/13 10/13 M M Mid-year LNO, LNO, LO, LNO
LNO, LO, LO, LO, LNO
Stocks of central government and central government–guaranteed debt
6/13 8/13 Q Q Q
External current account balance 6/13 8/13 Q Q Q LO, LO, LO, LO LO, O, LO, O, O
Exports and imports of goods and services
8/13 10/13 M M M
GDP/GNP 6/13 8/13 Q Q Q LO, LO, O, LO LO, LO, LO, LO, LNO
Gross external debt7 6/13 8/13 Q Q Q
International investment position8 2012 10/13 A A A
1 Daily (D); Weekly (W); Monthly (M); Quarterly (Q); Annually (A); NA: Not Available. 2 Reflects the assessment provided in the data ROSC published on July 20, 2005 (based on the findings of the mission that took place during March 28-April 11, 2005), for the dataset corresponding to the variable in each row. The assessment indicates whether international standards concerning concepts and definitions, scope, classification/sectorization, and basis for recording are fully observed (O); largely observed (LO); largely not observed (LNO); not observed (NO); and not available (NA). 3 Including currency and maturity composition, except referring to international standards concerning source data, assessment of source data, statistical techniques, assessment and validation of intermediate data and statistical outputs, and revision studies. 4 Any reserve assets that are pledged or otherwise encumbered should be specified separately. Also, data should comprise short-term liabilities linked to a foreign currency but settled by other means as well as the notional values of financial derivatives to pay and to receive foreign currency, including those linked to a foreign currency but settled by other means. 5 Both market based and officially determined, including discount rates, money market rates, rates on treasury bills, notes and bonds. 6 Foreign, domestic bank, and domestic nonbank financing. 7 Including currency and maturity composition. 8 Includes external gross financial assets and liability positions vis à vis nonresidents.
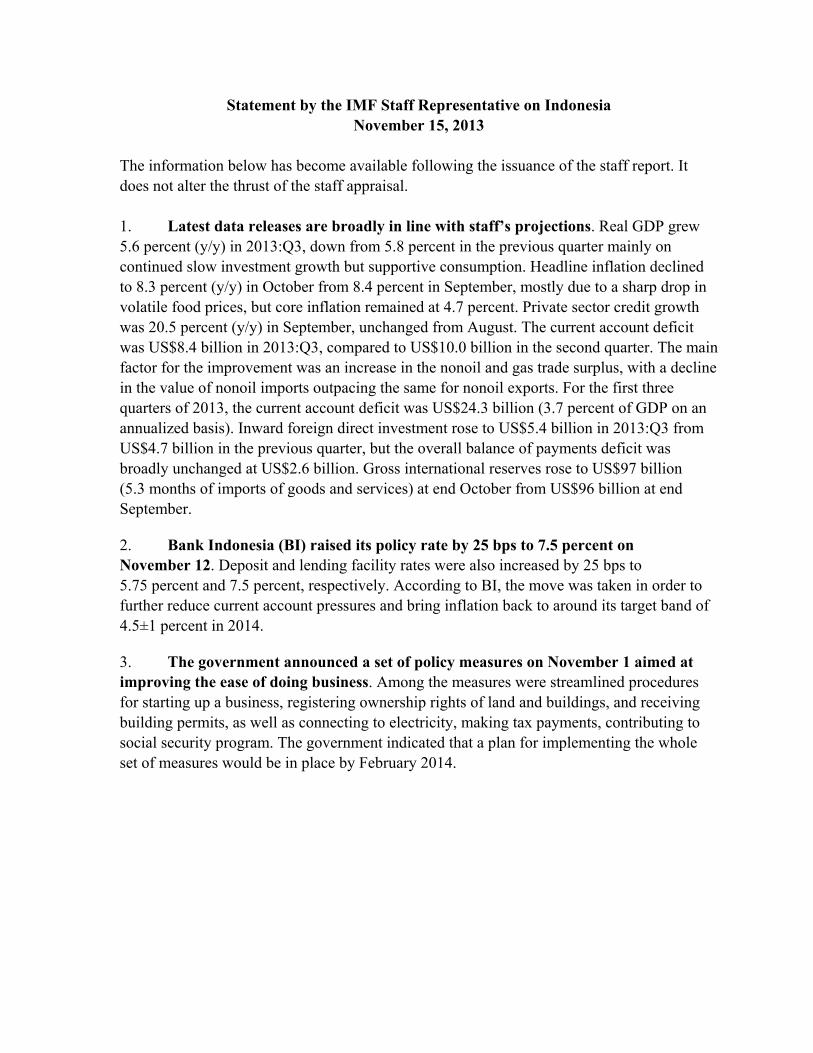
Statement by the IMF Staff Representative on Indonesia November 15, 2013
The information below has become available following the issuance of the staff report. It does not alter the thrust of the staff appraisal. 1. Latest data releases are broadly in line with staff’s projections. Real GDP grew 5.6 percent (y/y) in 2013:Q3, down from 5.8 percent in the previous quarter mainly on continued slow investment growth but supportive consumption. Headline inflation declined to 8.3 percent (y/y) in October from 8.4 percent in September, mostly due to a sharp drop in volatile food prices, but core inflation remained at 4.7 percent. Private sector credit growth was 20.5 percent (y/y) in September, unchanged from August. The current account deficit was US$8.4 billion in 2013:Q3, compared to US$10.0 billion in the second quarter. The main factor for the improvement was an increase in the nonoil and gas trade surplus, with a decline in the value of nonoil imports outpacing the same for nonoil exports. For the first three quarters of 2013, the current account deficit was US$24.3 billion (3.7 percent of GDP on an annualized basis). Inward foreign direct investment rose to US$5.4 billion in 2013:Q3 from US$4.7 billion in the previous quarter, but the overall balance of payments deficit was broadly unchanged at US$2.6 billion. Gross international reserves rose to US$97 billion (5.3 months of imports of goods and services) at end October from US$96 billion at end September.
2. Bank Indonesia (BI) raised its policy rate by 25 bps to 7.5 percent on November 12. Deposit and lending facility rates were also increased by 25 bps to 5.75 percent and 7.5 percent, respectively. According to BI, the move was taken in order to further reduce current account pressures and bring inflation back to around its target band of 4.5±1 percent in 2014.
3. The government announced a set of policy measures on November 1 aimed at improving the ease of doing business. Among the measures were streamlined procedures for starting up a business, registering ownership rights of land and buildings, and receiving building permits, as well as connecting to electricity, making tax payments, contributing to social security program. The government indicated that a plan for implementing the whole set of measures would be in place by February 2014.

Press Release No. 13/503 FOR IMMEDIATE RELEASE December 15, 2013
IMF Executive Board Concludes 2013 Article IV Consultation with Indonesia
On November 15, 2013, the Executive Board of the International Monetary Fund (IMF) concluded the Article IV consultation1 with Indonesia. Over the past decade, Indonesia has established a track record of strong economic performance and resiliency, underpinned by sound macroeconomic management and corporate and banking sector reforms. In recent years, its economy has benefitted from a supportive global economic environment, namely in the form of a rise in commodity prices and strong growth in emerging markets. However, these conditions have been less supportive lately, resulting in slowing export growth. Combined with rising net oil and gas imports, the current account shifted into a deficit in 2012. Nonetheless, real GDP growth in 2012 remained strong at 6¼ percent, aided by domestic conditions, while inflationary pressures stayed low. Going forward, the near-term outlook reflects the more challenging global environment that Indonesia faces. Growth is projected to slow to around 5−5½ percent in 2013 and 2014 on weaker investment and external demand. Inflation is expected to reach 9½ percent (year-on-year) in 2013, owing to fuel and food price increases and the recent rupiah depreciation, before easing back to around 6 percent in 2014. The current account deficit is projected to remain above 3 percent of GDP in 2013 and 2014, mainly on account of a weakening in the terms of trade and measured growth in external demand. Foreign direct investment and net portfolio inflows are expected to moderate but still be supportive, notwithstanding heightened market volatility since mid 2013 associated with prospects of an end to unconventional monetary policies in the United States. Despite a drawdown in the first half of 2013, reserves are expected to remain adequate. The authorities have taken significant steps since mid 2013 to address external and fiscal imbalances, ease inflation pressures, and reduce market volatility. Fiscal performance has been
1 Under Article IV of the IMF's Articles of Agreement, the IMF holds bilateral discussions with members, usually every year. A staff team visits the country, collects economic and financial information, and discusses with officials the country's economic developments and policies. On return to headquarters, the staff prepares a report, which forms the basis for discussion by the Executive Board.
International Monetary Fund 700 19th Street, NW Washington, D.C. 20431 USA
2
aided by a hike in subsidized fuel prices in June, to check the rise in energy subsidies, while monetary policy has been tightened through a substantial increase in policy rates. To ensure an orderly adjustment, exchange rates and bond yields have moved to reflect market conditions. Other measures have aimed at strengthening the supply side of the economy. Contingent financing arrangements have also been put in place to help cushion the impact of any new shocks or prolonged market disruptions. Banks remain well capitalized and highly profitable, having been supported in recent years by strong economic growth and wide interest margins. Asset quality has continued to be strong. Along with monetary policy actions, macro-prudential measures have been taken to slow credit growth, but loan-to-deposit ratios have continued to rise. The ongoing transition of bank supervision and regulation from Bank Indonesia to Otoritas Jasa Keuangan (the financial services agency) continues as planned. At the same time, gaps remain in the crisis management framework, which are expected to be filled by a financial sector safety net law when approved by parliament. Indonesia’s longer-term outlook hinges on the pace of structural reforms to raise productivity, create new export markets, and generate more inclusive growth. Key reforms include accelerated infrastructure investment, a more predictable trade and investment regime, greater labor market flexibility, and deeper financial markets. Executive Board Assessment2 Executive Directors noted the authorities’ strong track record of prudent macroeconomic policies and commended their efforts to contain external and fiscal imbalances, reduce inflation, and manage market volatility in the wake of recent external shocks. Looking ahead, Directors encouraged the authorities to strengthen the resilience of the Indonesian economy by rebuilding policy buffers, addressing emerging vulnerabilities, and stepping up structural reforms. Directors welcomed the actions taken by the authorities to tighten monetary policy. They agreed that additional monetary tightening might be necessary to facilitate balance-of-payments adjustment and better anchor inflation expectations. In this regard, Directors supported efforts to strengthen the monetary transmission mechanism and develop the money and foreign exchange markets to improve liquidity management. Directors also underscored the importance of continued exchange rate flexibility to dampen the impact of external shocks. Directors considered that fiscal policy should support the orientation of monetary policy, and generally agreed that a moderate consolidation would be appropriate for the period ahead. 2 At the conclusion of the discussion, the Managing Director, as Chairman of the Board, summarizes the views of Executive Directors, and this summary is transmitted to the country's authorities. An explanation of any qualifiers used in summings up can be found here: http://www.imf.org/external/np/sec/misc/qualifiers.htm.

3
Measures should include bolstering tax collection and sustaining energy subsidy reform in the context of well-targeted safety nets. Directors also highlighted the importance of opening up fiscal space for infrastructure investment to lift longer-term growth prospects. Directors commended steady advances in ensuring the soundness of the domestic financial system. Implementation of pending recommendations under the Fund’s Financial Sector Assessment Program (FSAP), notably as regards the quality of banks’ capital, would cement the progress thus far. More broadly, Directors stressed the importance of avoiding oversight gaps in the transition to a new supervisory architecture, and of putting in place an effective crisis management framework. Directors also encouraged the authorities to address remaining deficiencies in the regime for the prevention of money laundering and terrorism financing. Directors agreed that reforms to reduce supply bottlenecks, enhance the business climate, increase labor market flexibility, and open up trade and investment remain key to strengthening competitiveness and the external position, and to bolstering growth and employment. They took note of the staff’s assessment that Indonesia’s external position appears to be moderately weaker than implied by medium-term fundamentals.

4
Indonesia: Selected Economic Indicators, 2008–14
2008 2009 2010 2011 2012 2013 2014 Est. Proj. Proj.
Real GDP (percent change) 6.0 4.6 6.2 6.5 6.2 5.4 5.3Domestic demand 7.6 5.2 5.4 6.1 8.2 5.0 4.9Of which:
Private consumption 5.3 4.9 4.7 4.7 5.3 5.2 4.8Gross fixed investment 11.9 3.3 8.5 8.8 9.8 5.0 4.0Change in stocks 1/ 0.1 -0.2 0.1 0.4 1.8 -0.4 -2.0
Net exports 1/ 0.7 1.2 0.9 1.5 -1.5 1.1 1.2Saving and investment (in percent of GDP)
Gross investment 2/ 27.8 31.0 32.3 32.9 35.3 34.6 33.8Gross national saving 27.8 33.0 33.0 33.1 32.5 31.1 30.6Foreign saving (external current account
balance) 0.0 -2.0 -0.7 -0.2 2.8 3.5 3.2Prices (12-month percent change)
Consumer prices (end period) 11.1 2.8 7.0 3.8 4.3 9.5 6.0Consumer prices (period average) 9.8 4.8 5.1 5.4 4.3 7.2 7.6
Public finances (in percent of GDP) Central government revenue 19.8 15.1 15.8 16.1 16.2 16.0 16.0Central government expenditure 19.9 16.7 16.4 17.3 18.1 18.4 18.5Central government balance -0.1 -1.6 -0.6 -1.1 -1.9 -2.5 -2.5Primary balance 1.7 0.1 0.8 0.1 -0.6 -1.1 -0.9Central government debt 33.2 28.6 26.8 24.4 24.5 26.2 26.8
Money and credit (12-month percent change; end of period)
Rupiah M2 12.7 13.8 16.5 17.4 14.4 ... … Base money -9.2 16.7 28.9 18.3 14.9 ... … Private sector credit 30.5 7.2 19.6 25.4 22.3 ... … One-month interbank rate (period average) 9.1 7.4 6.4 6.2 4.4 … …
Balance of payments (in billions of U.S. dollars) Oil and gas (net) 7.8 5.4 3.2 -0.7 -5.2 -10.9 -14.3Non-oil and gas exports (f.o.b.) 107.9 99.0 129.4 162.7 152.9 150.7 159.8Non-oil and gas imports (f.o.b.) 92.8 73.5 102.0 127.3 139.1 134.4 137.8Current account balance 0.1 10.6 5.1 1.7 -24.4 -30.4 -27.6Inward direct investment 9.3 4.9 13.8 19.2 19.4 16.5 17.1Overall balance -1.9 12.5 30.3 11.9 0.2 -17.2 -9.0
Gross reserves In billions of U.S. dollars (end period) 51.6 66.1 96.2 110.1 112.8 88.7 79.7In months of imports of goods and services 5.6 5.2 5.9 6.2 6.4 4.9 4.1As a percent of short-term debt 3/ 175.0 208.7 224.2 235.5 206.4 154.6 131.6
Total external debt 4/ In billions of U.S. dollars 155.1 172.9 202.4 225.4 252.4 264.6 277.3In percent of GDP 30.4 32.1 28.5 26.6 28.7 30.3 32.2
Exchange rate (period average) Rupiah per U.S. dollar 9,687 10,405 9,086 8,772 9,381 … …

5
Nominal effective exchange rate (2005=100) 90.8 86.6 95.2 93.5 89.1 … …Real effective exchange rate (2005=100) 110.0 109.8 124.2 124.6 120.8 … …
Memorandum items: Oil production (thousands of barrels (bbls) per
day) 976 949 945 907 860 830 830Indonesian oil price (in US$ per bbl.) 97.0 61.6 79.4 111.5 112.7 109.4 105.3Nominal GDP (in trillions of rupiah) 4,949 5,606 6,447 7,423 8,242 9,10210,123Nominal GDP (in billions of U.S. dollars) 511 539 710 846 879 … …
Sources: Data provided by the Indonesian authorities; and IMF staff estimates and projections. 1/ Contribution to GDP growth (percentage points). 2/ Includes changes in stocks. 3/ Short-term debt on a remaining maturity basis. 4/ Public and private external debt.

Statement by Wimboh Santoso, Executive Director for Indonesia and Evie Akbar, Advisor to Executive Director
November 15, 2013 On behalf of the Indonesian authorities, we would like to thank the IMF mission team for the candid dialogue during the Article IV consultation. The mission took place at the period of heightened pressures on Indonesian economy, and accordingly the policy discussions focused on restoring stability and reducing vulnerabilities. While appreciating the coverage of discussions with staff, the authorities expressed their concern on the staff’s way of portraying the Indonesian economy, which covers only a snapshot of short period developments and less emphasis on the complete storyline of the economy’s dynamic. The authorities are of the view that the staff report should have covered much broader perspective on the Indonesian economy. It should encompass the domestic economy’s resilience throughout the recent years’ global economic turbulence relative to its peers, the authorities’ policy intention at the back of recent economic performance, and the latest encouraging developments in Indonesia’s economy. Overall, the report unfairly captures authorities’ intention to prioritize stability in order to safeguard growth sustainability. Accordingly, this Buff statement is critical to provide broader viewpoint on the dynamic of Indonesian economy.
Recent Economic Development and Outlook
1. Measures and structural reforms taken in the aftermath of the Asian Crisis in 1997/1998 combined with prudent macroeconomic management have brought Indonesian economy in a strong position. The economic performance in the last 5 years has been outstanding with stability intact and average GDP growth reaching 6%. Based on staff appraisal on the previous Article IV consultation, in terms of its fundamentals, Indonesia was in a strong position from which to navigate through global macroeconomic uncertainties. The Executive Directors, as reflected in the acting chair’s summing-up commended the authorities for their sound economic management, which has helped Indonesia maintain its strong economic performance despite a challenging global economic environment. This solid foundation has supported Indonesian economy to remain resilient in recent periods of external shocks. Nonetheless, growing with the speed of more than 6%, the Indonesian economy in nature would need sufficient support of imported capital goods and services. The allegedly sustainable CA deficit has emerged to become external imbalances as Indonesia’s export performance slowed down due to the weakening of global economy.
2. The condition has been worsened by the tapering off issue, especially in the form of volatile capital flows. By the end of Q2-13, the economy experienced amounting pressures on the Rupiah exchange rate as well as the external stability. The condition triggered the authorities to shift the macroeconomic strategy by putting forward the stability over the economic expansion, in order to preserve the sustainability of economic growth.
3. Noting that the global economy is undergoing a fundamental shift, the Indonesian authorities put greater effort to safeguard the smooth adjustment on the economic strategy to ensure a soft landing process into a new equilibrium. Series of policy packages have been launched to counterbalance the recent pressures since August 2013. The policy measures are focused on narrowing current account deficit, curbing inflation, preserving monetary and foreign exchange stability, as well as promoting investment and maintaining sustainable economic growth. Those policy measures would complement the existing structural reform policies which have been underway.
4. The authorities are well aware of the consequences of the soft-landing strategy, i.e. that the economic growth must be revised downward. Under this strategy, however, Indonesian economy remains growing at a modest pace of 5.62% (y-o-y) or 5.83% (y-t-d) in the Q3-2013. This figure is consistent with the authorities’ projection range, which is between the 5.5% – 5.9% level of growth for 2013 (much higher than the expected average growth of ASEAN-5 (5%)). The inflation rate is expected not to exceed 9% at the end of 2013 supported by the slowing down in domestic demand and policy coordination measures between Bank Indonesia (BI) and the government in containing inflation. As a matter of fact, inflation has returned to its normal pattern at -0.35% (m-t-m) or 8.4.0% (y-o-y) in September, and 0.09% (m-t-m) or 8.32% (y-o-y) in October, down from its peak of 3.28% (m-t-m) in July 2013. As the inflationary pressures subdue, the authorities foresee inflation rate in 2014 to continue in a downward trend to be in line with the 2014 target range of 4.5% + 1%.
5. The pressure on Balance of Payments is expected to ease as current, capital and financial account improve starting Q3-2013. The policy measures to enhance current account are pursued to bring the current account deficit at its sustainable level around 3% in 2013 and further below 3% in 2014.
6. Current market condition moves to the direction of stabilization. The level of Rupiah exchange rates have stabilized, accompanied by a gradually larger interbank volume. Onshore and offshore (Non Deliverable Forward/NDF) rates have converged and the NDF rate now moves to the level below the onshore spot rates, simultaneously with the surging of capital inflows to the government bond market. These reflect international confidence on the commitment of the authorities to maintain macroeconomic stability and the prospect of the economy.
7. Following the authorities’ policy responses, the international reserves also improved, reaching $97 billion in October 2013. The reserve is adequate to cover 5.3 month of imports and government’s external debt service payments and is still above the IMF’s regular metrics on the reserve adequacy level. In view of the delay in the tapering of the UMP and the authorities’ policy to allow exchange rate to adjust consistent with prevailing economic fundamental, the authorities expect the reserves to stay around the same level by the end of 2013, higher than staff’s projection of $88.7 billion. The
authorities also continue to strengthen its second line of defense to ensure BI’s capacity to absorb the market volatility, among others through entering bilateral swap arrangement with regional central banks.
8. Following the recent adjustment of energy subsidy and its compensating spending on the budget, the fiscal deficit is set to record at 2.38% of GDP in 2013. Nonetheless, the debt level is maintained prudently, which stood at 23.7% in June 2013, declining from 33% in 2008. The financial stability remains in check as indicated by the high level of capital adequacy ratio and low level of NPL.
9. Notwithstanding the current encouraging development, the authorities would continue to remain vigilant to weather the persisting global economic uncertainties.
Monetary Policy and Exchange Rate Policy
10. The authorities have responded to manage the current problems of increasing pressures on inflation and BOP. They also broadly support with thrust of the importance of strengthening monetary policy transmission mechanism to improve the effectiveness of monetary policy as staff rightly pointed it out in the report. Understanding the specific nature of the economic and financial system, BI reponses with a policy mix, ranging from monetary policy, macro-prudential policy, financial deepening and communication strategy to ensure the soft landing process of the economy. Burden to restore macroeconomic and financial stability cannot be put on policy rate solely.
11. Until the issuance of the staff report, the policy rate and the overnight deposit facility rate have been raised by 150 bps since June 2013 to 7.25% and 5.5% respectively to anchor inflation expectation. This policy had brought down the spike in inflation rate following the fuel prices hike to its normal path. While the inflation rate in 2014 is projected to lay within the target range of 4.5 + 1%, BI stands ready for further tightening to restrain increased inflationary pressures as well as reduce current account deficits under certain circumstances. In fact, the BI Board of Governors earlier this week has decided to further raise the policy rate by 25 bps in view of the remaining pressure on current account deficit amidst the high global uncertainties.
12. To restore the financial market stability, BI continues to adopt flexible exchange rate so as the rate moves along with its fundamental value. In addition, the authorities have introduced various market instruments to deepen financial market and increase market liquidity, including FX Swap transactions and tradable central bank rupiah deposit. The authorities has also introduced new regulation on hedging activities by the state-owned companies,

Fiscal Policy
13. The authorities have consistently adopted prudent fiscal policy by placing hard-cap on the deficit i.e. not more than 3% of GDP. Fiscal deficit was successfully maintained less than 2% of GDP for the last 10 years and the debt to GDP ratio continued to decrease. For 2013, the authorities have four strategies to keep fiscal position strong. These strategies are: optimizing the revenue, increasing the quality of spending, controlling budget deficit, and decreasing debt to GDP ratio.
14. On optimizing the revenue, the authorities carried out the tax reforms by enhancing tax payable administration, broadening the tax based and increasing tax compliance, and also improved SOEs performance to enhance non-tax revenue. Meanwhile, improving the quality of spending was executed through allocating higher budget for capital expenditure, social assistance spending and targeted subsidies. The authorities also have intention to strengthen the debt management by reducing the Debt to GDP ratio to 23% in 2013.
15. In response to recent shock, the government has revised its 2013 budget. The energy subsidy has been reduced through the hike in fuel prices by 22.3% for diesel and 44.4% for gasoline in June 2013. Additional budget for social protection; and infrastructure, as well as the improvement efficiencies in line ministries spending have been implemented. These are consistent to the effort to increase potential growth in the medium-term and protect people’s purchasing power. Along with the lower GDP growth, the adjustment has widened the fiscal deficit to 2.38% of GDP. Nonetheless, the authorities commit to maintain solid fiscal position and ensure that the budget deficit remain sound.
16. The authorities share the staff’s view on the need of fiscal policy to support monetary policy in addressing external pressures. Accordingly, the government issued policy packages to improve current account performance by issuing regulation to increase the portion biodiesel in diesel fuel to reduce oil import and provide tax relief to the export-oriented industries to encourage export. Furthermore, the government also released regulation to improve the trade system of some volatile foods that would contribute to manage volatile food prices, thus it would lessen inflationary pressure.
Financial Sector Policy
17. Indonesia has built a stronger financial system in the aftermath of 1997/1998 Asian crisis. Important steps have been taken toward restructuring financial sector since the post crisis to restore solvency of banking system and improve banking regulations and supervision, including the adoption of Basel Core Principles in Banking Supervision (BCBS). Capital adequacy regime has been in line with Basel II principles and moving forward to implement Basel III. As a result, Indonesia’s financial sector resilience has been tested in the turmoil of 2005 and Lehman’s crisis in 2008. To monitor the vulnerabilities of financial sectors, stress testing models have been routinely simulated to asses top down
and bottom up resiliency of the financial system as a basis for further policy mitigation by authorities. Results of the assessment have been published regularly in the financial stability report every six months.
18. The efforts are being reflected from various indicators, namely the Capital Adequacy Ratio (CAR) which is recorded at 18%, well above the minimum requirement of 8% and the ratio of NPL arriving at just 1.86% in September 2013. The credit growth starts to moderate, hovering around 20%, in line with decelerating domestic economy activities. Moreover, the result of stress testing indicated resilient banking industry to the variety of risks, including an economic downturn, interest rate hike, and exchange rate depreciation. Furthermore, the authorities have addressed a number regulatory weaknesses identified in the FSAP, including the remaining weakness identified in tier 1 capital framework.
19. The authorities have also deployed macro prudential policies to maintain the stability of the financial system and promote internal and external balance. Measures are varied from setting the LTV level for mortgages and down payments on motor vehicle loans, pursuing supervisory actions and enhancing the liquidity management of banks. The authorities predict that the policies would reduce the credit growth to the level of 19%-20% at the end of the year.
20. The authorities take note of staff’s concern regarding the transfer of banking supervision to the Financial Services Authority (OJK) and coordination of macro and micro-prudential surveillance. In this regard, BI and OJK have signed memorandum of understanding (MOU) to smooth-out the transfer process of banking supervision and strengthen the cooperation and coordination between two institutions. The MOU stipulates the cooperation and coordination in executing the roles and responsibilities of each agency, including the collaboration in formulating of policies/regulations for financial industry and executing macro and micro-prudential surveillance. It also specifies the agreement to exchange data and information so both institutions will have an access to data and information of banking system.
21. The authorities are mindful on the importance of the Financial Sector Safety Net (FSSN) Law to support the effective management of systemic crisis. While the authorities expect the law to be in place, stronger coordination among institutions under the Financial System Stability Forum (FKSSK) would complement current crisis management framework to deal with the systemic crisis. Furthermore, the authorities are in the process of amending the BI and banking laws that would strengthen the Crisis Management Protocol framework.
Structural Reforms
22. The authorities are fully aware that accelerating structural reforms is the key to achieve sustainable growth in medium term. To enhance supply capacity and potential economic growth, the authorities will continue to pursue structural reforms in reducing the
infrastructure bottlenecks. As part of this effort, the government launched policy to promote investment in August 2013. The policy covers streamlining process for investment’s permit, improving single window service for investment, revising the regulation of negative investment lists and resolving the problem arose in strategic investment projects, such as power plant, oil, gas, mineral mining and infrastructure project. Furthermore, to facilitate trade and investments, the government would spend the capital expenditure to build seaports, roads, railways, energy and airports.
Conclusion
23. To conclude, Indonesia has successfully navigated the turbulence and put forward the stability commitment since the Asian crisis 1997. While the latest development shows a favorable economic condition, the authorities reiterate their unwavering commitment not to lose sight and to pursue sustainable growth. The authorities stand ready to take further measures as warranted. For the longer-term horizon, the authorities will strive for preserving macroeconomic and financial stability and keep pursuing the necessary structural reforms so as to ensure sustainable growth and improved social welfare of the people.
24. Finally, the authorities look forward to maintain close and even-handed collaboration between the authorities and the Fund in the future. Furthermore, the authorities emphasis on the importance of the Fund to have a more balanced assessment and constructive recommendations in the context of its surveillance process. This would be crucial to support member countries and hence the global economy in the road to sustainable recovery