indonesia business and investment dialoguethe finest from the amazon of the sea indonesia business...
TRANSCRIPT

THE FINEST FROM THE AMAZON OF THE SEA
Indonesia Business and Investment DialogueASEAN JAPAN CENTRE
March 2017
Corporate Presentation
Delivering Integrated Fishery Solutions

CORPORATEPROFILE
WORLD’S FISHERY PRODUCTION & TRADE | INDONESIA FISHERY INDUSTRY
FAVORABLE ECONOMY ATMOSPHERE | EXPECTATION ON JAPAN
WHY INVEST DPUM | THE TRANSFORMATION
INTEGRATED BUSINESS MODEL| PEERS BAROMETER
AWARD & CERTIFICATIONS |
SHAREHOLDER |

WORLD’S FISHERY PRODUCTION & TRADE
CORPORATE PRESENTATION 2
4.7%
5.3%
5.6%
6.3%
17.7%
RUSIA
INDIA
USA
INDONESIA
CHINA
Source: FAO, 2012
FISHERY COMMODITIES EXPORT• Indonesia occupies position 11 with the export figure of
2.1% from the total export of USD140 billion.• Indonesia's export figure is lower due to transshipment
and impact the export figures are unrecorded.
2.6%
4.1%
4.5%
5.8%
6.3%
13.0%
INDONESIA
RANK 6TH -10TH COUNTRIES
USA
VIETNAM
THAILAND
NORWAY
CHINA
Source: FAO, 2012
WORLD'S CAPTURE PRODUCTION• Indonesia’s 2nd largest capture production
country.• In 2012, Indonesia contribute 6,3% from 93,4
million tonnage capture production in the world

INDONESIA FISHERY INDUSTRY
CORPORATE PRESENTATION 3
2010 2011 2012 2013 2014 2015
SEAWEED FISH FARMER CAPTURE TOTALID PRODUCTION (MILLION TON/YEAR)
2010 2011 2012 2013 2014 2015 %CAGR
SEAWEED 3.9 5.2 6.5 9.3 10.1 10.8 22.5FISH FARMER 2.4 2.8 3.2 4.0 4.3 4.4 13.3CAPTURE 5.4 5.7 5.8 6.1 6.5 6.5 3.9TOTAL 11.7 13.6 15.5 19.4 20.8 21.7 13.2
GOVT SUPPORT1. Prohibition on foreign construct vessels to operate2. Prohibition to harvest on breeding ground and spawning ground3. Prohibition on any open sea transshipment, ensuring all fisheries to be processed locally4. Presidential Decree No. 7 Year 2016 related economic acceleration in maritime sector5. Open market for investment in cold storage and fishery process.
2010 2011 2012 2013 2014 2015
ID DEMAND 2010 2011 2012 2013 2014 2015 %CAGRKG PERCAPITA/YEAR 30.5 32.3 33.9 35.2 38.1 41.1 6.2
Source: ID Marine Affair & Fisheries Minister
Source: ID Marine Affair & Fisheries Minister

FAVORABLE ECONOMY ATMOSPHERE 2017
CORPORATE PRESENTATION 4
8.34 8.22
7.79
2014 2015 2016
1.58 1.79 2.00
2014 2015 2016
5.94 6.18
5.50
2014 2015 2016
114
122 125
2014 2015 2016
UNEMPLOYEMENT RATE (%) PERCENTAGE OF POOR REGIONAL MIN. WAGES (MILLION)
53.27 37.04
50.77
2014 2015 2016
3.60 3.35
1.97
2014 2015 2016
5,227
4,593
5,416
2014 2015 2016
12,383
13,788 13,05
1
2014 2015 2016
85 3,016
90,161
Jul-16 Aug-16 Sep-16
CONSUMER INDEX RATE INFLATION RATE (%) EXCHANGE RATE (USD/IDR)
CRUDE OIL PRICE (US$/BBL) MARKET SENTIMENT (IHSG) T. A. REDEMPTION FEE (Rp, BILLION)
Source: Bloomberg & Badan Pusat Statistik, September 2016
EXPECTATION ON JAPAN
CORPORATE PRESENTATION 5
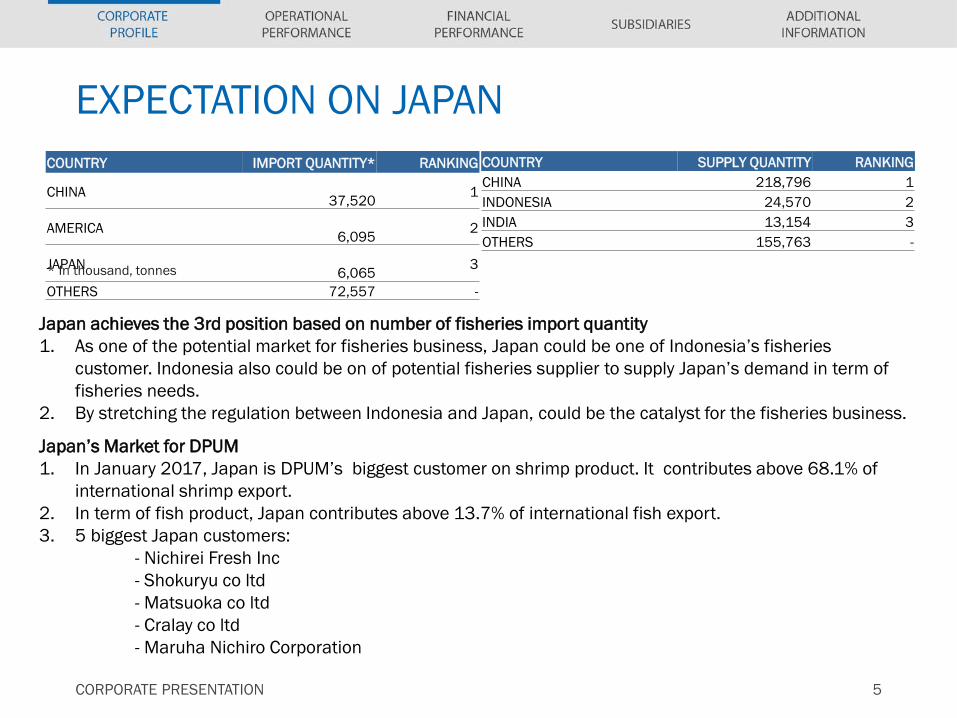
COUNTRY IMPORT QUANTITY* RANKING
CHINA 37,520 1
AMERICA 6,095 2
JAPAN 6,065 3
OTHERS 72,557 -* In thousand, tonnes
Japan achieves the 3rd position based on number of fisheries import quantity1. As one of the potential market for fisheries business, Japan could be one of Indonesia’s fisheries
customer. Indonesia also could be on of potential fisheries supplier to supply Japan’s demand in term of fisheries needs.
2. By stretching the regulation between Indonesia and Japan, could be the catalyst for the fisheries business.
COUNTRY SUPPLY QUANTITY RANKINGCHINA 218,796 1INDONESIA 24,570 2INDIA 13,154 3OTHERS 155,763 -
Japan’s Market for DPUM1. In January 2017, Japan is DPUM’s biggest customer on shrimp product. It contributes above 68.1% of
international shrimp export.2. In term of fish product, Japan contributes above 13.7% of international fish export.3. 5 biggest Japan customers:
- Nichirei Fresh Inc- Shokuryu co ltd- Matsuoka co ltd- Cralay co ltd- Maruha Nichiro Corporation

WHY INVEST DPUM
CORPORATE PRESENTATION 6
External FactorsBig Economy A member of G20 countriesSolid Economy IMF estimate ±6.64% CAGR in 2017-2020Big Population Fourth largest in the worldBiggest Achipelago Approximately ±65 of total IDs territory is marine area with 17.000 islandsStrategic Geographical Marine Indonesia is a tropical archipelago and home of two oceans (Pacific & Indian) Potential Resources Indonesia is the 2nd largest capture production country. Govt Deregulation Prohibition on foreign construct vessels to operate in Indonesia's marine.
Internal FactorsStrong Revenue Growth CAGR 2013-2016 CAGR 90.5% Good Profitability Average net margin ±12%Good Product Quality Certificate of Registration from Food and Drug Administration (FDA) of USStrong Resource Base Indonesia’s water, the amazon of the sea.Sustainable Business The renewable resources ensure the sustainability of the business.Long Track Record Having been running the fisheries business since 2005.Experienced Management Having expirience in related business ±12 years.
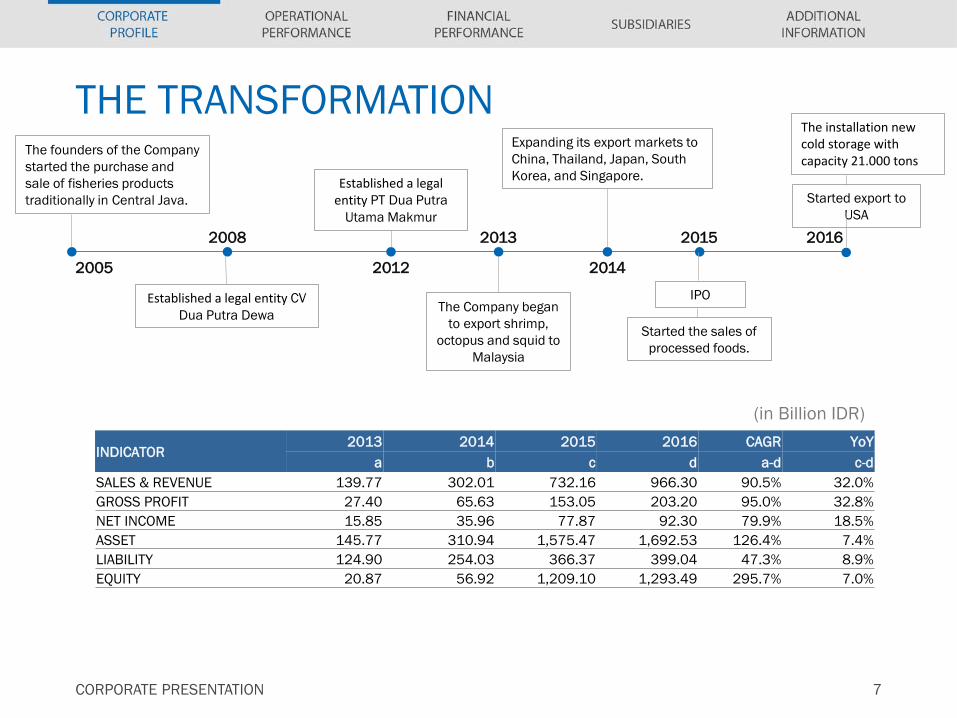
THE TRANSFORMATIONThe founders of the Company started the purchase and sale of fisheries products traditionally in Central Java.
2005
Established a legal entity CV Dua Putra Dewa
2008
Established a legal entity PT Dua Putra
Utama Makmur
2012
The Company began to export shrimp,
octopus and squid to Malaysia
2013
Expanding its export markets to China, Thailand, Japan, South Korea, and Singapore.
2014
2015
Started export to USA
The installation new cold storage with capacity 21.000 tons
IPO
2016
CORPORATE PRESENTATION 7
Started the sales of processed foods.
(in Billion IDR)
INDICATOR2013 2014 2015 2016 CAGR YoY
a b c d a-d c-dSALES & REVENUE 139.77 302.01 732.16 966.30 90.5% 32.0%GROSS PROFIT 27.40 65.63 153.05 203.20 95.0% 32.8%NET INCOME 15.85 35.96 77.87 92.30 79.9% 18.5%ASSET 145.77 310.94 1,575.47 1,692.53 126.4% 7.4%LIABILITY 124.90 254.03 366.37 399.04 47.3% 8.9%EQUITY 20.87 56.92 1,209.10 1,293.49 295.7% 7.0%

INTEGRATED BUSINESS MODEL
CORPORATE PRESENTATION 8
FISHERMANPARTNERSHIP
FISH SUPPLY
SHRIMP SUPPLY
CONTRACT SUPPLIERS
FISH FARMER SME
PROCESSING PLANT
COLD STORAGE DISTRIBUTION
IMPORT
EXPORT

PEERS BAROMETER
CORPORATE PRESENTATION 9
INDICATOR DUA PUTRA UTAMA MAKMUR TBK
DHARMA SAMUDERA FISHING INDONESIA TBK
CENTRAL PROTEINA PRIMA TBK SEKAR LAUT TBK
ESTABLISHED 2012 1973 1980 1966
CHANNEL
Malaysia, Thailand, Vietnam, China, Japan,
Taiwan, Singapore, South Korea, India, Bahrain,
USA, Australia
China, Canada, Rusia, Vietnam, Korea, Europe,
USAEurope, Japan, USA Import (data is n/a)
PRODUCT
Fish Frozen, Shrimp Frozen, Seafood Value
Added Custom, Seafood Processed
Tuna, Fish Fillet, Octopus, Cuttlefish, others
Shrimp Processed, Shrimp Feed and others
feed
Canning, Codiment, crakers and cereals
COLD STORAGE 25.000 T Yes (data is n/a) Yes (data is n/a) N/A
FISHERMAN PARTNERSHIP Yes No No No

AWARD & CERTIFICATIONS
CORPORATE PRESENTATION 10
Food and Drug Administration (FDA) Registry
The United States FDA
Certificate of Implementation of Hazard Analysis & Critical Control Point
(HACCP)Frozen Fish, Shrimp & CephalopodMarine Affair & Fisheries Minister
Quality Management ISO 9001:2008

SHAREHOLDER
CORPORATE PRESENTATION 11
PT DUA PUTRA UTAMA MAKMUR TBKTOTAL SHARE: 4,175,000,000
PT PANDAWA INVESTAMA UOB KAY HIAN PTE LTD PUBLIC
48.29% 22.32% 29.39%
PUBLIC OWNERSHIP DISTRIBUTION
Source: Company Data, December, 2016
DOMESTICMESA & MESOP 0.40%RETAIL 28.99%
OPERATIONALPERFORMANCE
PROCESSING PLANT | PROCESSED PRODUCTS| OPERATIONAL HIGHLIGHTS

ONE OF THE LARGEST PROCESSING PLANT
CORPORATE PRESENTATION 13
INDICATOR 2016CAPACITYCOLD STORAGE (UNIT) 3CAPACITY COLD STORAGE (TON) 25,000 VESSEL (UNIT) 0PRODUCTION CAPACITY (TON/DAY) 30 FACILITY (UNIT)CONVEYOR BELT SYSTEM 9 VACCUM PACK MACHINE 1 METAL DETECTOR 1 CONTACT FREEZER 9 ICE FLAKE MACHINE 4 TUNNEL FREEZER 7 SPIRAL 1 FRYER MACHINE 1

VALUE ADDED SEAFOOD – PROCESSED PRODUCTS
CORPORATE PRESENTATION 14
Nobashi BreadedShrimp
CookedShrimp
CuttlefishSashimi
Sushi Ebi
Tempura Breaded fish
Fillet fishCrab Cake
Calamari

OPERATIONAL HIGHLIGHTS
CORPORATE PRESENTATION 15
4Q15 4Q16 ∆ % YoY OPERATIONAL 12M15 12M16 ∆ % YoY11,384,442 8,333,864 (26.8) GROUP 30,166,298 32,709,475 8.4 11,138,475 7,745,201 (30.5) FISH (KG) 29,290,235 31,326,194 7.0
245,967 588,663 139.3 SHRIMP (KG) 876,063 1,383,281 57.9 92 125 36.0 YIELD FISH (IDR/KG) 20,217 25,004 23.7
4,817 2,128 (55.8) YIELD SHRIMP (IDR/KG) 159,797 132,306 (17.2)10,985,914 7,722,086 (29.7) DOMESTIC 28,838,398 28,040,286 (2.8)10,975,095 7,406,016 (32.5) FISH (KG) 28,823,487 27,583,157 (4.3)
10,819 316,070 2,821.5 SHRIMP (KG) 14,911 457,129 2,965.8 398,529 611,778 53.5 INTERNATIONAL 1,327,900 4,669,189 251.6 163,381 339,185 107.6 FISH (KG) 466,748 3,743,037 701.9 235,148 272,593 15.9 SHRIMP (KG) 861,152 926,152 7.5
4Q15 4Q16 CONTRIBUTION 12M15 12M16100.0% 100.0% GROUP 100.0% 100.0%
96.5% 92.7% DOMESTIC 95.6% 85.7%3.5% 7.3% INTERNATIONAL 4.4% 14.3%
FINANCIALPERFORMANCE
INCOME STATEMENT SUMMARY | OPERATING REVENUE |
BALANCE SHEET SUMMARY | CASH FLOW SUMMARY | CASH & NET GEARING

INCOME STATEMENT
CORPORATE PRESENTATION 17
CONSOLIDATED INCOME STATEMENT (in Billion IDR)
4Q15 4Q16 ∆ % YoY INDICATOR 12M15 12M16 ∆ % YoY
245.40 316.24 28.9 SALES AND REVENUE 732.16 966.30 32.0 (202.95) (274.22) 35.1 COST OF SALES & REVENUE (579.11) (763.11) 31.8
42.44 42.01 (1.0) GROSS PROFIT 153.05 203.20 32.8 (7.47) (23.62) 216.1 GENERAL & ADM (15.62) (58.71) 275.8 (8.60) (8.44) (1.8) FINANCE CHARGES (23.69) (34.55) 45.8
(15.52) 2.41 (115.5) OTHERS (EXPENSES)/INCOME (21.73) 9.83 145.3 10.84 12.35 13.9 OPERATING PROFIT 92.00 119.77 30.2
7.97 (1.95) (124.5) TAX (14.14) (27.47) 94.3 18.81 10.40 (44.7) NET INCOME 77.87 92.30 18.5
4Q15 4Q16 RATIO 12M15 12M16
17.3% 13.3% GROSS PROFIT MARGIN 20.9% 21.0%4.4% 3.9% OPERATING PROFIT MARGIN 12.6% 12.4%7.7% 3.3% NET MARGIN 10.64% 9.55%

OPERATING REVENUE SEGMENT
CORPORATE PRESENTATION 18
(in Billion IDR)
4Q15 4Q16 ∆ % YoY REVENUE SEGMENT 12M15 12M16 ∆ % YoYBY REGION & PRODUCT
194.79 247.23 26.9 DOMESTIC 576.96 648.60 12.4 193.58 214.65 10.9 FISH 575.36 598.69 4.1
1.21 32.58 2,594.2 SHRIMP 1.60 49.91 3,022.7 50.61 69.01 36.4 INTERNATIONAL 155.20 317.70 104.7
6.44 21.73 237.6 FISH 16.81 184.60 998.2 44.17 47.29 7.1 SHRIMP 138.39 133.11 (3.8)
245.40 316.24 28.9 TOTAL 732.16 966.30 32.0
4Q15 4Q16 REVENUE CONTRIBUTION 12M15 12M16BY REGION
79.4% 78.2% DOMESTIC 78.8% 67.1%20.6% 21.8% INTERNATIONAL 21.2% 32.9%
100.0% 100.0% TOTAL 100.0% 100.0%BY PRODUCT
81.5% 74.7% FISH 80.9% 81.1%18.5% 25.3% SHRIMP 19.1% 18.9%
100.0% 100.0% TOTAL 100.0% 100.0%

BALANCE SHEET
CORPORATE PRESENTATION 19
CONSOLIDATED BALANCE SHEET (in Billion IDR)
*Current assets decerease 32.2% due to cash uses for aquisition of fixed assets IDR376.58Billion
INDICATOR FY15 3Q16 ∆ % 4Q16 ∆ % CURRENT ASSET 955.28 647.47 (32.2) 701.13 (26.6)NON CURRENT ASSET 620.18 990.35 59.7 991.40 59.9 TOTAL ASSET 1,575.47 1,637.83 4.0 1,692.53 7.4 CURRENT LIABILITY 191.38 168.16 (12.1) 232.78 21.6 NON CURRENT LIABILITY 175.00 186.75 6.7 166.26 (5.0)TOTAL LIABILITY 366.37 354.91 (3.1) 399.04 8.9 TOTAL EQUITY 1,209.10 1,282.92 6.1 1,293.49 7.0 TOTAL LIABILITY & EQUITY 1,575.47 1,637.83 4.0 1,692.53 7.4
CONTRIBUTIONTOTAL ASSET 100.0% 100.0% 100.0%TOTAL LIABILITY 23.3% 21.7% 23.6%TOTAL EQUITY 76.7% 78.3% 76.4%

GROUP CASH & NET GEARING
CORPORATE PRESENTATION 20
DEBT STRUCTURE
COVENANT
√ NET GEARING MAX 2.0 TIMES (12M16: 0.2 TIME)
√ NET WORTH DECREASE <25% (12M16 : INCREASE 18.5%)
√ DER MAX 3 0 TIMES (12M16 : 0.2 TIME)
(in Billion IDR)
598.
8
39.1
40.8
239.
8
271.
4
309.
7
1,20
9.1
1,28
2.9
1,29
3.5
(0.3)
0.2 0.2
(0.9)
(0.7)
(0.5)
(0.3)
(0.1)
0.1
0.3
1.0
201.0
401.0
601.0
801.0
1,001.0
1,201.0
1,401.0
FY15 3Q16 4Q16
CASH FINANCIAL DEBT EQUITY NET GEARING
46.6%53.4%
SHORT TERM LONG TERM

ADDITIONALINFORMATION
TARGET

TARGET
CORPORATE PRESENTATION 22
INDICATOR FY2016 FY2017 ∆ % YoYFINANCIAL (IDR, Billion)SALES AND REVENUE 966.30 1,432.49 48.2 GROSS PROFIT 203.20 300.57 47.9 OPERATING PROFIT 119.77 221.27 84.7
NET INCOME 92.30 154.71 67.6
ASSET 1,692.53 1,906.98 12.7 LIABILITY 399.04 478.31 19.9 EQUITY 1,293.49 1,428.67 10.5 OPERATIONAL PRODUCTION (KG) 32,709,475 35,123,040 7.4

Head Office
Jl. Raya Pati Juwana Km. 7Desa Purworejo Rt.01 Rw. 05Kecamatan Pati, Kabupaten PatiJawa Tengah 59111 - IndonesiaTel : +62-21 4199011 Fax : +62-21 4199010Email : [email protected]
Investor Relations
Nariba Office Suites, 6th floorJl. Mampang Prapatan Raya No. 39Jakarta Selatan 12790 - IndonesiaTel : +62-21 7919990 Fax : +62-21 7991529Email : [email protected]
www.duaputra.com