indonesia industry focus indonesia property sector
TRANSCRIPT
ed: CK / sa:MA, PY, CS
Dim light at the end of tunnel?
Upgrade property sector to Neutral from Underweight
Slight improvement in rental yield and price appreciation
Possible relaxation of loan-to-value regulation could offset some risks of rate hikes
Maintain Bumi Serpong Damai as our top pick for the sector
Upgrade to Neutral. We upgrade our view on the sector to Neutral from Underweight previously on the back of: 1) decent YTD pre-sales, 2) slight improvement in rental yield and price appreciation, 3) positive regulatory developments, and 4) its undemanding valuation. We advise investors to accumulate stocks with solid earnings and pre-sales like BSDE and CTRA, as we believe the property sector has started to show some improvement. Small ray of hope. In the past few years, property yield premium has been hovering at a very low yield of sub-2%, even at a slight negative in 2016. In 2017, the premium rose significantly and stood at 3.33% premium over deposit rates. The rising property premium is attributable to a lower deposit rate (50bps), slightly higher rental yields, and improvement in capital gain. In our view, the premium started to look decent, but the number is too small compared to the inherent illiquidity risk, in addition to a rising interest rate environment. Possible LTV relaxation may offset the rate hikes. Although the rate hikes are coming the potential for loan-to-value (LTV) relaxation policy could help property sector to some extent. As the problem with low affordability is still haunting the sector, we believe the mere relaxation of mortgage disbursement term will have a significant impact, as it could lower selling price by c.3-9%. Nevertheless, the result will still depend on the appetite of the buyers considering pre-sales trend in the past two or so years during low interest rates period. Top pick for the sector – BSDE. BSDE has less dependency on high-rise developments compared to its peers due to its large landbank that has seen most of the value being unlocked. In view of the oversupply of high-rise residential units, we believe developers with high exposure to landed residential projects will outperform peers. Meanwhile, the valuation is undemanding at 60% discount to RNAV.
JCI : 5,787.60
Analyst Victor STEFANO +6221 3003 4934 [email protected]
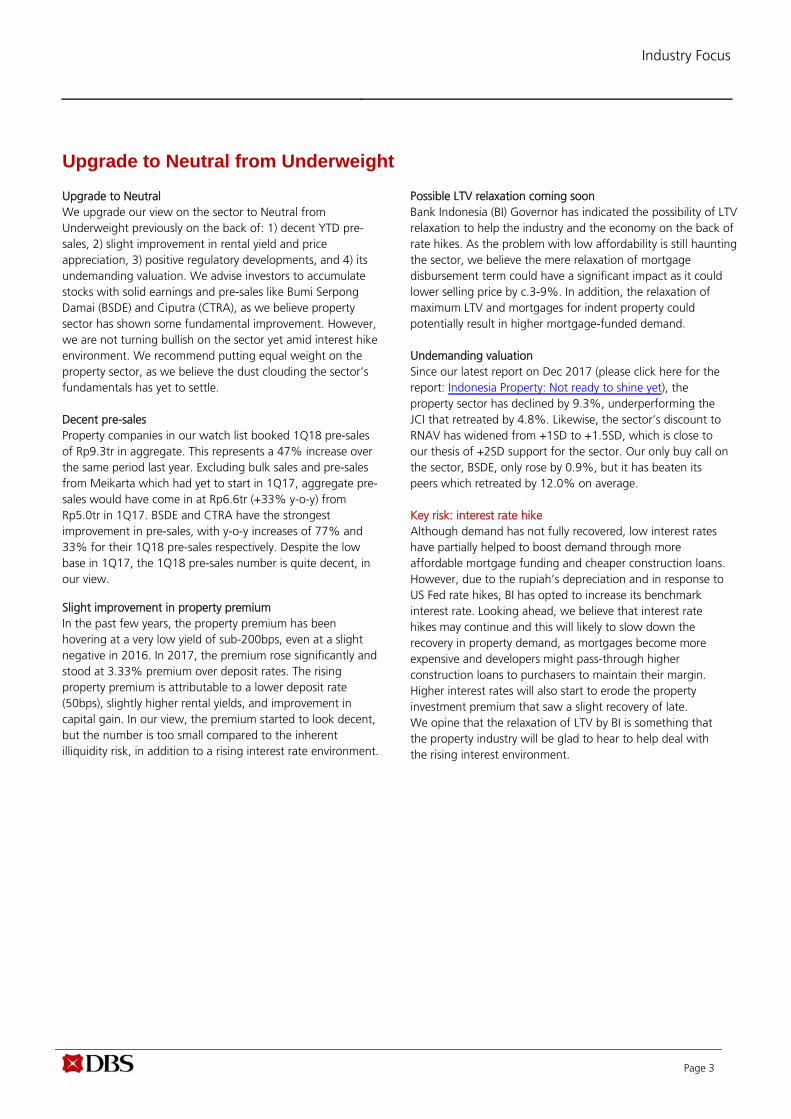
Property sector discount to RNAV
Source: Bloomberg Finance L.P., DBSVI *Aggregate of ASRI, BSDE, CTRA, LPKR, PWON, SMRA
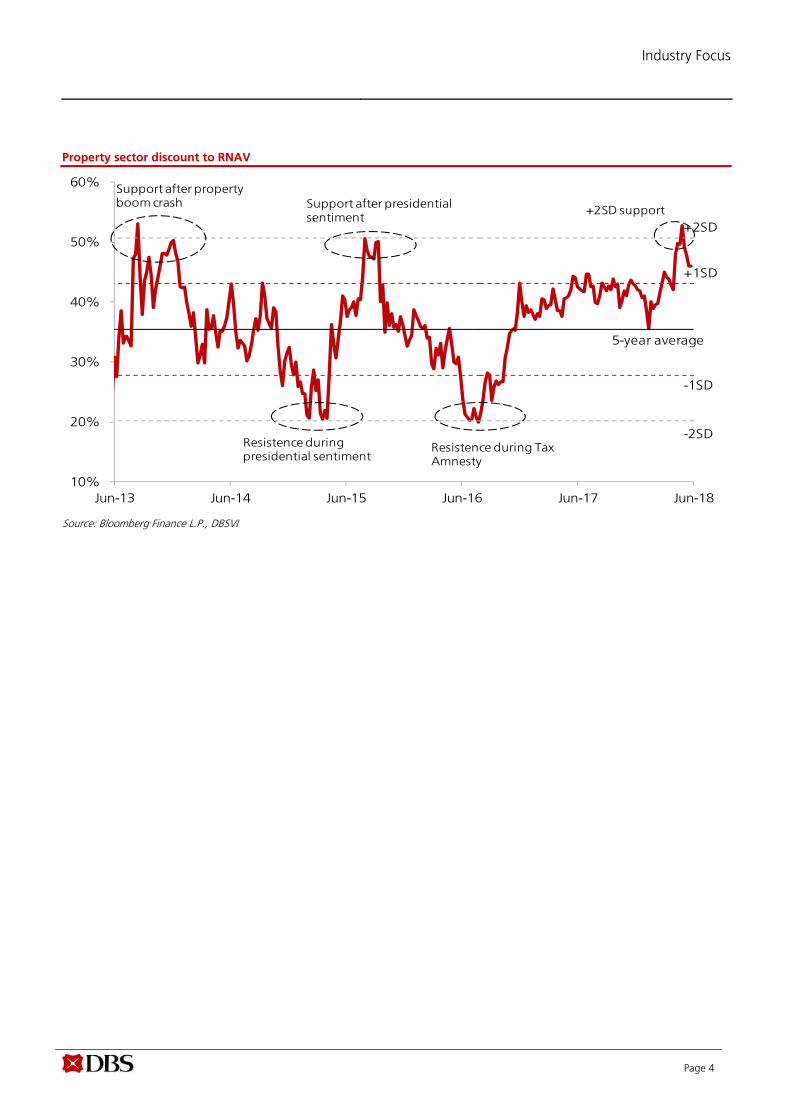
YTD performance of property stocks
Source: Bloomberg Finance L.P., DBSVI
10%
20%
30%
40%
50%
60%
Jun-13 Jun-14 Jun-15 Jun-16 Jun-17 Jun-18
-1SD
-2SD
+2SD
+1SD
5-year average
‐35% ‐30% ‐25% ‐20% ‐15% ‐10% ‐5% 0%
ASRI
BSDE
CTRA
LPKR
PWON
SMRA
JCI
DBS Group Research . Equity 28 Jun 2018
Indonesia Industry Focus
Indonesia Property Sector
Refer to important disclosures at the end of this report
STOCKS
12-mth
Price Mkt Cap Target Price Performance (%)
Rp US$m Rp 3 mth 12 mth Rating
Alam Sutera Realty 342 472 400 (10.5) 7.6 HOLD Bumi Serpong Damai 1,650 2,229 2,100 (5.2) (9.8) BUY Ciputra Development 1,100 1,433 1,150 (3.9) (6.0) HOLD Pakuwon Jati 550 1,859 630 (9.8) (10.6) HOLD Summarecon Agung 990 1,002 1,000 10.6 (23.3) HOLD
Source: DBSVI, Bloomberg Finance L.P. Closing price as of 27 Jun 2018
Industry Focus
Page 2
Table of Contents
Upgrade to Neutral from Underweight ............................................................................................................. 3
Slight improvement in 1Q18 pre-sales ............................................................................................................... 5
Potential rebound in 2Q18 pre-sales .................................................................................................................. 7
Property premium started to improve ............................................................................................................... 8
Possible relaxation of LTV ................................................................................................................................... 9
Impact of LTV relaxation on property sector ................................................................................................... 12
NPL has stabilised but could head north again due to higher interest rate ................................................. 14
Headwinds from interest rate hikes ................................................................................................................. 16
Top pick for the sector ...................................................................................................................................... 18
Company Guide ................................................................................................................................................. 22
Bumi Serpong Damai .............................................................................................................................. 23
Industry Focus
Page 3
Upgrade to Neutral from Underweight Upgrade to Neutral We upgrade our view on the sector to Neutral from Underweight previously on the back of: 1) decent YTD pre-sales, 2) slight improvement in rental yield and price appreciation, 3) positive regulatory developments, and 4) its undemanding valuation. We advise investors to accumulate stocks with solid earnings and pre-sales like Bumi Serpong Damai (BSDE) and Ciputra (CTRA), as we believe property sector has shown some fundamental improvement. However, we are not turning bullish on the sector yet amid interest hike environment. We recommend putting equal weight on the property sector, as we believe the dust clouding the sector’s fundamentals has yet to settle. Decent pre-sales Property companies in our watch list booked 1Q18 pre-sales of Rp9.3tr in aggregate. This represents a 47% increase over the same period last year. Excluding bulk sales and pre-sales from Meikarta which had yet to start in 1Q17, aggregate pre-sales would have come in at Rp6.6tr (+33% y-o-y) from Rp5.0tr in 1Q17. BSDE and CTRA have the strongest improvement in pre-sales, with y-o-y increases of 77% and 33% for their 1Q18 pre-sales respectively. Despite the low base in 1Q17, the 1Q18 pre-sales number is quite decent, in our view.
Slight improvement in property premium In the past few years, the property premium has been hovering at a very low yield of sub-200bps, even at a slight negative in 2016. In 2017, the premium rose significantly and stood at 3.33% premium over deposit rates. The rising property premium is attributable to a lower deposit rate (50bps), slightly higher rental yields, and improvement in capital gain. In our view, the premium started to look decent, but the number is too small compared to the inherent illiquidity risk, in addition to a rising interest rate environment.
Possible LTV relaxation coming soon Bank Indonesia (BI) Governor has indicated the possibility of LTV relaxation to help the industry and the economy on the back of rate hikes. As the problem with low affordability is still haunting the sector, we believe the mere relaxation of mortgage disbursement term could have a significant impact as it could lower selling price by c.3-9%. In addition, the relaxation of maximum LTV and mortgages for indent property could potentially result in higher mortgage-funded demand. Undemanding valuation Since our latest report on Dec 2017 (please click here for the report: Indonesia Property: Not ready to shine yet), the property sector has declined by 9.3%, underperforming the JCI that retreated by 4.8%. Likewise, the sector’s discount to RNAV has widened from +1SD to +1.5SD, which is close to our thesis of +2SD support for the sector. Our only buy call on the sector, BSDE, only rose by 0.9%, but it has beaten its peers which retreated by 12.0% on average. Key risk: interest rate hike Although demand has not fully recovered, low interest rates have partially helped to boost demand through more affordable mortgage funding and cheaper construction loans. However, due to the rupiah’s depreciation and in response to US Fed rate hikes, BI has opted to increase its benchmark interest rate. Looking ahead, we believe that interest rate hikes may continue and this will likely to slow down the recovery in property demand, as mortgages become more expensive and developers might pass-through higher construction loans to purchasers to maintain their margin. Higher interest rates will also start to erode the property investment premium that saw a slight recovery of late. We opine that the relaxation of LTV by BI is something that the property industry will be glad to hear to help deal with the rising interest environment.
Industry Focus
Page 4
Property sector discount to RNAV
Source: Bloomberg Finance L.P., DBSVI
10%
20%
30%
40%
50%
60%
Jun-13 Jun-14 Jun-15 Jun-16 Jun-17 Jun-18
-1SD
-2SD
+2SD
+1SD
5-year average
Support after property boom crash
Resistence during presidential sentiment
Support after presidential sentiment
Resistence during Tax Amnesty
+2SD support

Industry Focus
Page 5
Slight improvement in 1Q18 pre-sales Decent 1Q18 pre-sales Property companies in our watch list booked 1Q18 pre-sales of Rp9.3tr in aggregate. This represents a 47% increase over the same period last year. Excluding bulk sales and pre-sales from Meikarta which had yet to start in 1Q17, aggregate pre-sales would have come in at Rp6.6tr (+33% y-o-y) from Rp5.0tr in 1Q17. BSDE and CTRA have the strongest improvement in pre-sales, with y-o-y increases of 77% and 33% for their 1Q18 pre-sales respectively. Despite the low base in 1Q17, the aggregate 1Q18 pre-sales number is quite decent, in our view. 1Q18 pre-sales (Rp bn)
Source: Company, DBSVI ASRI and LPKR saw weak 1Q18 performance Despite their strong growth in 1Q18 pre-sales numbers (ASRI and LPKR’s 1Q18 pre-sales jumped 285% and 548% y-o-y respectively), their pre-sales were supported by land plot sales to CFLD and the Meikarta project (that had yet to be launched in 1Q17) respectively. Excluding such numbers, ASRI and LPKR’s 1Q18 pre-sales would have contracted y-o-y. PWON and SMRA saw flat 1Q18 performance Both players have the same characteristics for their pre-sales in the sense that no new products were launched during the quarter. Their 1Q18 pre-sales numbers were relatively flat with PWON’s shedding 7% y-o-y while SMRA’s rose 1% y-o-y.
BSDE and CTRA delivered strong 1Q18 performance Both BSDE and CTRA booked decent pre-sales growth in 1Q18. BSDE booked stellar pre-sales growth of 77% y-o-y while CTRA’s pre-sales growth was a robust 33% y-o-y. BSDE’s pre-sales growth was supported by its landed residential project whose pre-sales doubled y-o-y, and its new high-rise projects, i.e. South Gate in Jakarta and Klaska in Surabaya. CTRA’s robust pre-sales was supported by its reclamation project in Makassar, high-rise project in Surabaya, and its old projects in Tangerang and Maja.
1Q18 pre-sales achievement
Source: Company, DBSVI In line pre-sales achievement Although pre-sales varied between companies, the aggregate 1Q18 pre-sales have met 23.2% of the aggregate FY18 pre-sales target. ASRI and BSDE have the best achievement in 1Q18, with c.35% of their FY18 pre-sales targets being achieved. However, ASRI’s pre-sales were supported by its Rp1.2tr bulk sales to CFLD.
1,425
600
2,500
1,614
2,140
605 459
‐
500
1,000
1,500
2,000
2,500
3,000
ASRI APLN BSDE CTRA LPKR PWON SMRA
35.6%
12.2%
34.7%
20.9% 21.4%
24.2%
11.5%
0.0%
5.0%
10.0%
15.0%
20.0%
25.0%
30.0%
35.0%
40.0%
ASRI APLN BSDE CTRA LPKR PWON SMRA
Industry Focus
Page 6
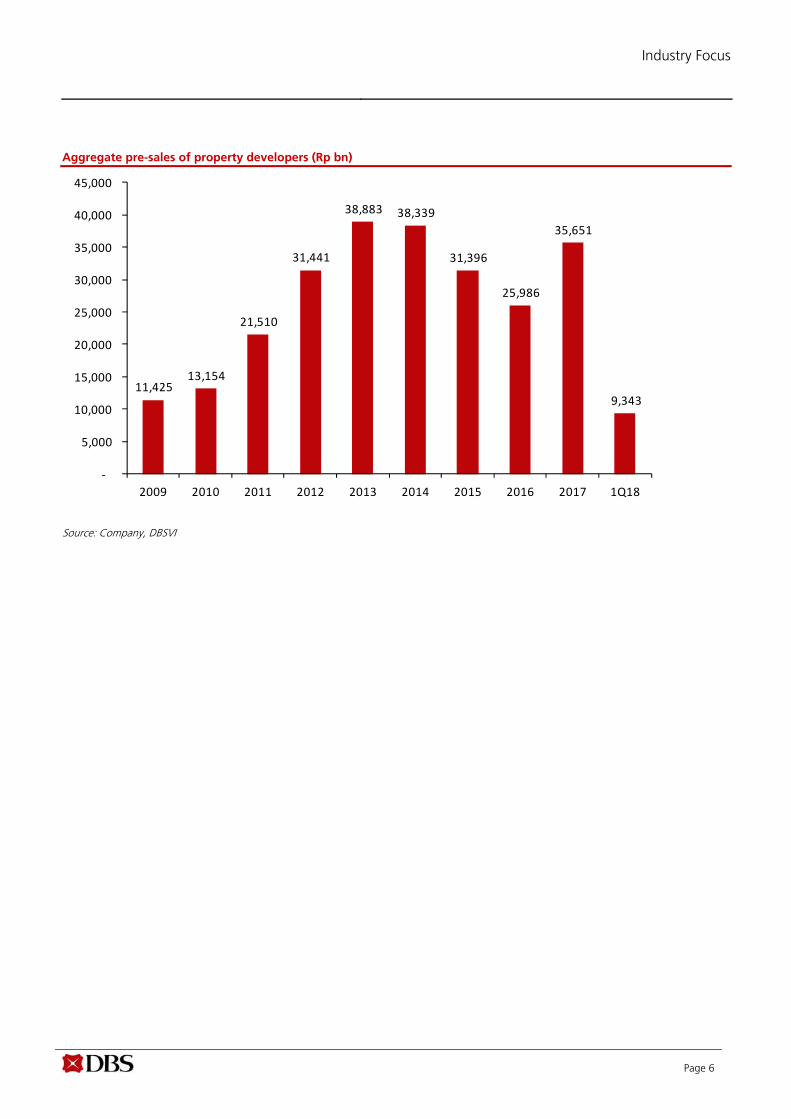
Aggregate pre-sales of property developers (Rp bn)
Source: Company, DBSVI
11,425 13,154
21,510
31,441
38,883 38,339
31,396
25,986
35,651
9,343
‐
5,000
10,000
15,000
20,000
25,000
30,000
35,000
40,000
45,000
2009 2010 2011 2012 2013 2014 2015 2016 2017 1Q18
Industry Focus
Page 7
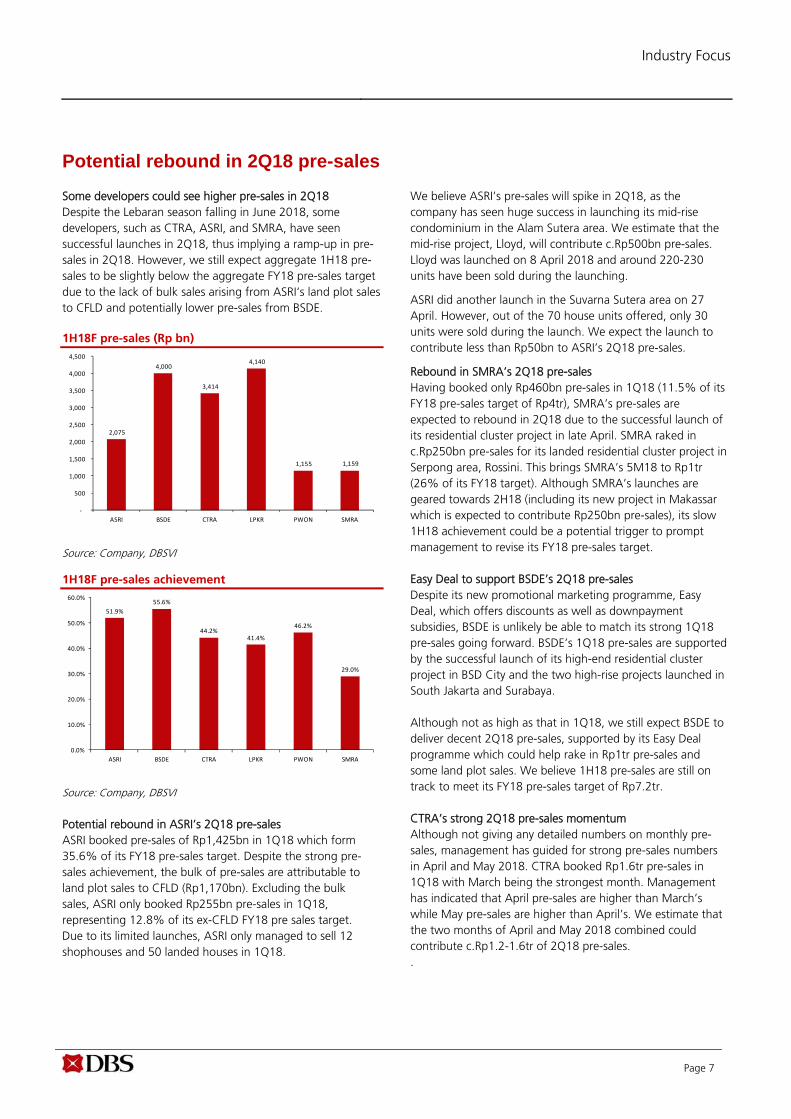
Potential rebound in 2Q18 pre-sales Some developers could see higher pre-sales in 2Q18 Despite the Lebaran season falling in June 2018, some developers, such as CTRA, ASRI, and SMRA, have seen successful launches in 2Q18, thus implying a ramp-up in pre-sales in 2Q18. However, we still expect aggregate 1H18 pre-sales to be slightly below the aggregate FY18 pre-sales target due to the lack of bulk sales arising from ASRI‘s land plot sales to CFLD and potentially lower pre-sales from BSDE. 1H18F pre-sales (Rp bn)
Source: Company, DBSVI
1H18F pre-sales achievement
Source: Company, DBSVI Potential rebound in ASRI’s 2Q18 pre-sales ASRI booked pre-sales of Rp1,425bn in 1Q18 which form 35.6% of its FY18 pre-sales target. Despite the strong pre-sales achievement, the bulk of pre-sales are attributable to land plot sales to CFLD (Rp1,170bn). Excluding the bulk sales, ASRI only booked Rp255bn pre-sales in 1Q18, representing 12.8% of its ex-CFLD FY18 pre sales target. Due to its limited launches, ASRI only managed to sell 12 shophouses and 50 landed houses in 1Q18.
We believe ASRI’s pre-sales will spike in 2Q18, as the company has seen huge success in launching its mid-rise condominium in the Alam Sutera area. We estimate that the mid-rise project, Lloyd, will contribute c.Rp500bn pre-sales. Lloyd was launched on 8 April 2018 and around 220-230 units have been sold during the launching.
ASRI did another launch in the Suvarna Sutera area on 27 April. However, out of the 70 house units offered, only 30 units were sold during the launch. We expect the launch to contribute less than Rp50bn to ASRI’s 2Q18 pre-sales.
Rebound in SMRA’s 2Q18 pre-sales Having booked only Rp460bn pre-sales in 1Q18 (11.5% of its FY18 pre-sales target of Rp4tr), SMRA’s pre-sales are expected to rebound in 2Q18 due to the successful launch of its residential cluster project in late April. SMRA raked in c.Rp250bn pre-sales for its landed residential cluster project in Serpong area, Rossini. This brings SMRA’s 5M18 to Rp1tr (26% of its FY18 target). Although SMRA’s launches are geared towards 2H18 (including its new project in Makassar which is expected to contribute Rp250bn pre-sales), its slow 1H18 achievement could be a potential trigger to prompt management to revise its FY18 pre-sales target. Easy Deal to support BSDE’s 2Q18 pre-sales Despite its new promotional marketing programme, Easy Deal, which offers discounts as well as downpayment subsidies, BSDE is unlikely be able to match its strong 1Q18 pre-sales going forward. BSDE’s 1Q18 pre-sales are supported by the successful launch of its high-end residential cluster project in BSD City and the two high-rise projects launched in South Jakarta and Surabaya. Although not as high as that in 1Q18, we still expect BSDE to deliver decent 2Q18 pre-sales, supported by its Easy Deal programme which could help rake in Rp1tr pre-sales and some land plot sales. We believe 1H18 pre-sales are still on track to meet its FY18 pre-sales target of Rp7.2tr. CTRA’s strong 2Q18 pre-sales momentum Although not giving any detailed numbers on monthly pre-sales, management has guided for strong pre-sales numbers in April and May 2018. CTRA booked Rp1.6tr pre-sales in 1Q18 with March being the strongest month. Management has indicated that April pre-sales are higher than March’s while May pre-sales are higher than April’s. We estimate that the two months of April and May 2018 combined could contribute c.Rp1.2-1.6tr of 2Q18 pre-sales. .
2,075
4,000
3,414
4,140
1,155 1,159
‐
500
1,000
1,500
2,000
2,500
3,000
3,500
4,000
4,500
ASRI BSDE CTRA LPKR PWON SMRA
51.9%
55.6%
44.2%41.4%
46.2%
29.0%
0.0%
10.0%
20.0%
30.0%
40.0%
50.0%
60.0%
ASRI BSDE CTRA LPKR PWON SMRA
Industry Focus
Page 8
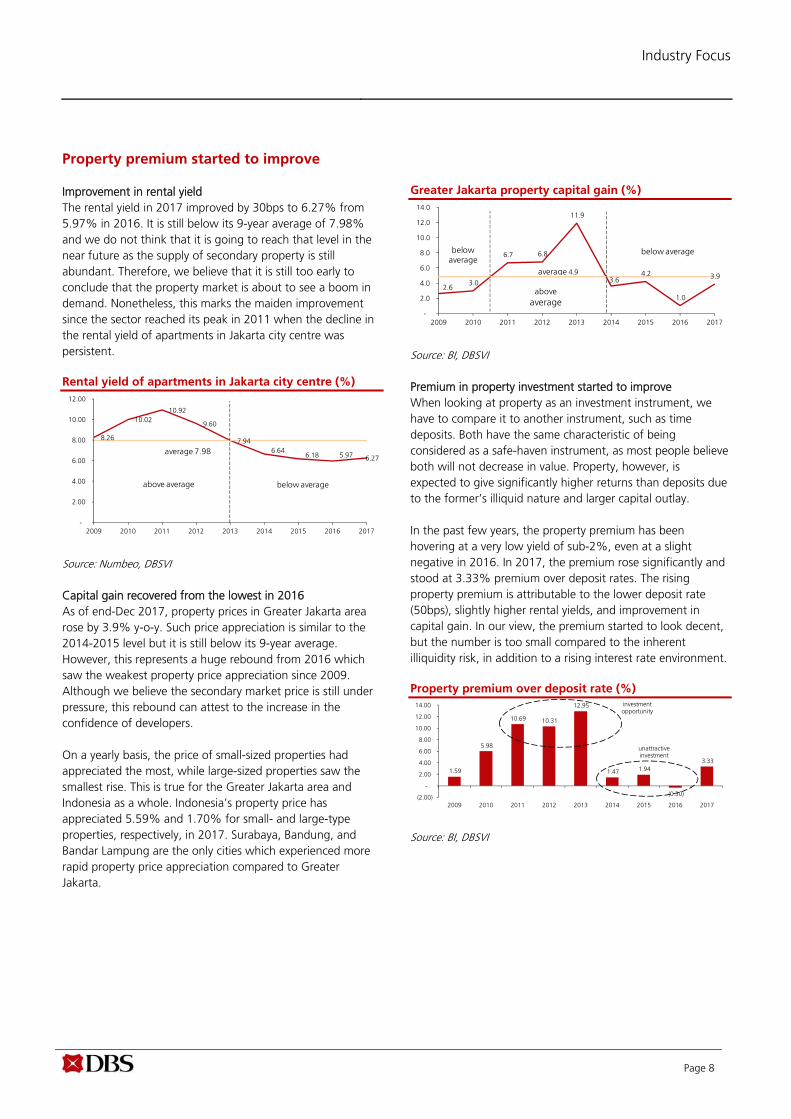
Property premium started to improve Improvement in rental yield The rental yield in 2017 improved by 30bps to 6.27% from 5.97% in 2016. It is still below its 9-year average of 7.98% and we do not think that it is going to reach that level in the near future as the supply of secondary property is still abundant. Therefore, we believe that it is still too early to conclude that the property market is about to see a boom in demand. Nonetheless, this marks the maiden improvement since the sector reached its peak in 2011 when the decline in the rental yield of apartments in Jakarta city centre was persistent. Rental yield of apartments in Jakarta city centre (%)
Source: Numbeo, DBSVI Capital gain recovered from the lowest in 2016 As of end-Dec 2017, property prices in Greater Jakarta area rose by 3.9% y-o-y. Such price appreciation is similar to the 2014-2015 level but it is still below its 9-year average. However, this represents a huge rebound from 2016 which saw the weakest property price appreciation since 2009. Although we believe the secondary market price is still under pressure, this rebound can attest to the increase in the confidence of developers. On a yearly basis, the price of small-sized properties had appreciated the most, while large-sized properties saw the smallest rise. This is true for the Greater Jakarta area and Indonesia as a whole. Indonesia’s property price has appreciated 5.59% and 1.70% for small- and large-type properties, respectively, in 2017. Surabaya, Bandung, and Bandar Lampung are the only cities which experienced more rapid property price appreciation compared to Greater Jakarta.
Greater Jakarta property capital gain (%)
Source: BI, DBSVI Premium in property investment started to improve When looking at property as an investment instrument, we have to compare it to another instrument, such as time deposits. Both have the same characteristic of being considered as a safe-haven instrument, as most people believe both will not decrease in value. Property, however, is expected to give significantly higher returns than deposits due to the former’s illiquid nature and larger capital outlay. In the past few years, the property premium has been hovering at a very low yield of sub-2%, even at a slight negative in 2016. In 2017, the premium rose significantly and stood at 3.33% premium over deposit rates. The rising property premium is attributable to the lower deposit rate (50bps), slightly higher rental yields, and improvement in capital gain. In our view, the premium started to look decent, but the number is too small compared to the inherent illiquidity risk, in addition to a rising interest rate environment. Property premium over deposit rate (%)
Source: BI, DBSVI
8.26
10.02 10.92
9.60
7.94 6.64
6.18 5.97 6.27
-
2.00
4.00
6.00
8.00
10.00
12.00
2009 2010 2011 2012 2013 2014 2015 2016 2017
average 7.98
above average below average
2.6 3.0
6.7 6.8
11.9
3.6 4.2
1.0
3.9
-
2.0
4.0
6.0
8.0
10.0
12.0
14.0
2009 2010 2011 2012 2013 2014 2015 2016 2017
average 4.9
belowaverage
below average
aboveaverage
1.59
5.98
10.69 10.31
12.95
1.47 1.94
(0.30)
3.33
(2.00)
-
2.00
4.00
6.00
8.00
10.00
12.00
14.00
2009 2010 2011 2012 2013 2014 2015 2016 2017
investmentopportunity
unattractiveinvestment
Industry Focus
Page 9
Possible relaxation of LTV
LTV relaxation to boost economic growth through property sector In his decision to ratchet up benchmark interest rates to stabilise the economy and rupiah, BI Governor Perry Warjiyo has committed to support economic growth through macro prudential policy, especially one that targets the property sector. He believes that the property sector is a leading indicator for the overall economy, as it has multiplier effects for the other 174 sectors. The relaxation of LTV would boost transactions in the property sector, which would have spill-over effects that can lead to higher economic growth. Possible LTV relaxation BI’s decision to relax LTV requirements might come in the guise of three different policies, all of which were enacted during the tightening of LTV back in 2013. These policies are:
1. Maximum LTV 2. Mortgage indent regulation 3. Mortgage disbursement term
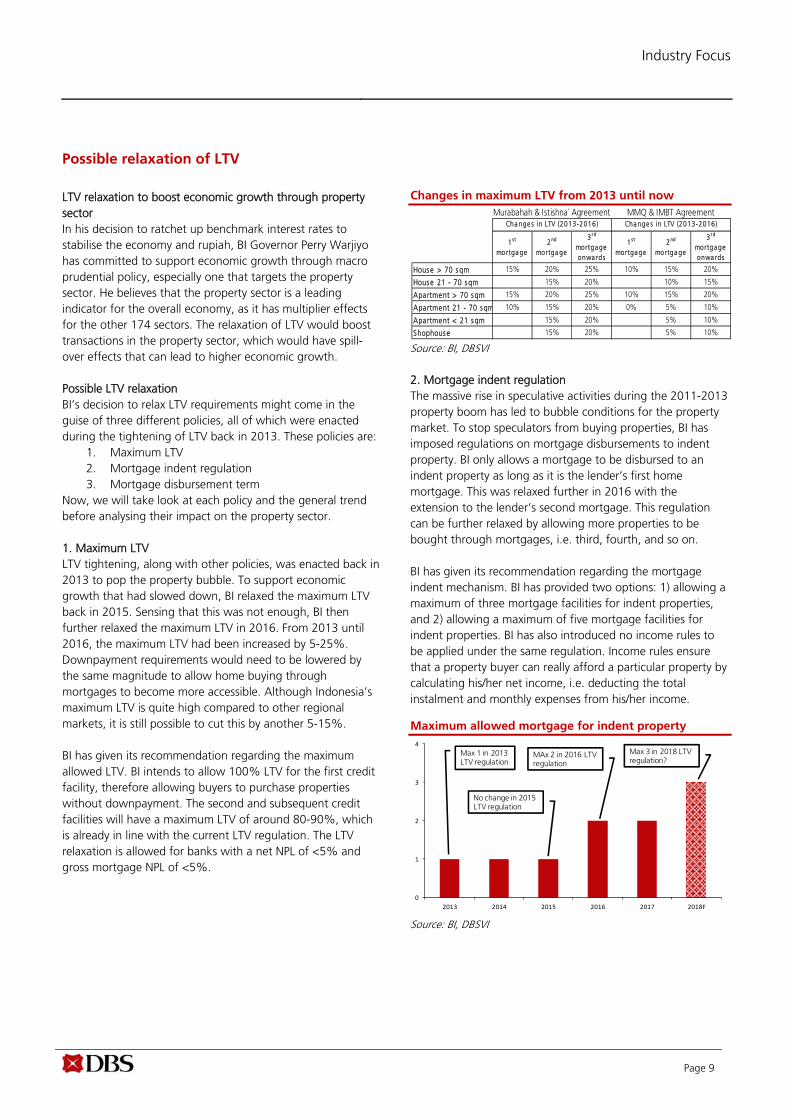
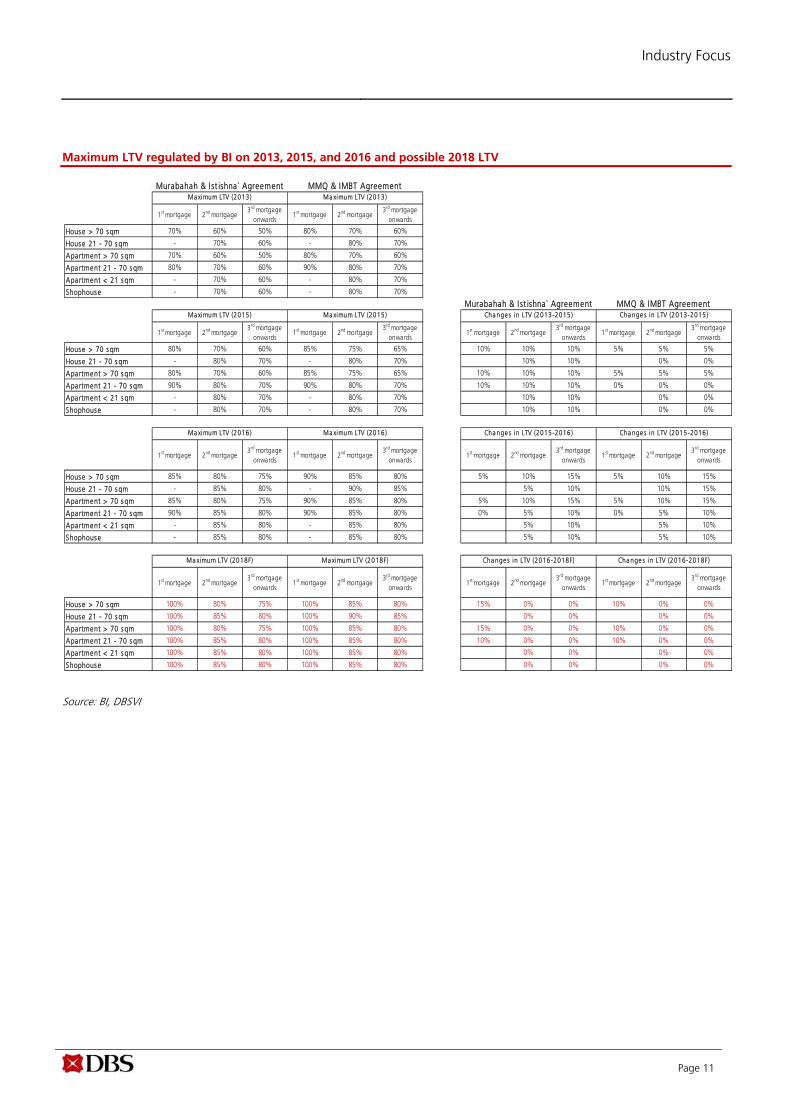
Now, we will take look at each policy and the general trend before analysing their impact on the property sector. 1. Maximum LTV LTV tightening, along with other policies, was enacted back in 2013 to pop the property bubble. To support economic growth that had slowed down, BI relaxed the maximum LTV back in 2015. Sensing that this was not enough, BI then further relaxed the maximum LTV in 2016. From 2013 until 2016, the maximum LTV had been increased by 5-25%. Downpayment requirements would need to be lowered by the same magnitude to allow home buying through mortgages to become more accessible. Although Indonesia’s maximum LTV is quite high compared to other regional markets, it is still possible to cut this by another 5-15%. BI has given its recommendation regarding the maximum allowed LTV. BI intends to allow 100% LTV for the first credit facility, therefore allowing buyers to purchase properties without downpayment. The second and subsequent credit facilities will have a maximum LTV of around 80-90%, which is already in line with the current LTV regulation. The LTV relaxation is allowed for banks with a net NPL of <5% and gross mortgage NPL of <5%.
Changes in maximum LTV from 2013 until now
Source: BI, DBSVI 2. Mortgage indent regulation The massive rise in speculative activities during the 2011-2013 property boom has led to bubble conditions for the property market. To stop speculators from buying properties, BI has imposed regulations on mortgage disbursements to indent property. BI only allows a mortgage to be disbursed to an indent property as long as it is the lender’s first home mortgage. This was relaxed further in 2016 with the extension to the lender’s second mortgage. This regulation can be further relaxed by allowing more properties to be bought through mortgages, i.e. third, fourth, and so on. BI has given its recommendation regarding the mortgage indent mechanism. BI has provided two options: 1) allowing a maximum of three mortgage facilities for indent properties, and 2) allowing a maximum of five mortgage facilities for indent properties. BI has also introduced no income rules to be applied under the same regulation. Income rules ensure that a property buyer can really afford a particular property by calculating his/her net income, i.e. deducting the total instalment and monthly expenses from his/her income.
Maximum allowed mortgage for indent property
Source: BI, DBSVI
0
1
2
3
4
2013 2014 2015 2016 2017 2018F
Max 1 in 2013 LTV regulation
No change in 2015 LTV regulation
MAx 2 in 2016 LTV regulation
Max 3 in 2018 LTV regulation?
1st
mortga ge2nd
mortga ge
3r d
mortga ge onwa rds
1st
mortga ge2nd
mortga ge
3r d
mortga ge onwa rds
Hous e > 70 s qm 15% 20% 25% 10% 15% 20%
Hous e 21 - 70 s qm 15% 20% 10% 15%
Apartment > 70 s qm 15% 20% 25% 10% 15% 20%
Apartment 21 - 70 s qm 10% 15% 20% 0% 5% 10%
Apartment < 21 s qm 15% 20% 5% 10%
Shophous e 15% 20% 5% 10%
Cha nge s in LTV (2013-2016) Cha nge s in LTV (2013-2016)Murabahah & Istishna` Agreement MMQ & IMBT Agreement
Industry Focus
Page 10
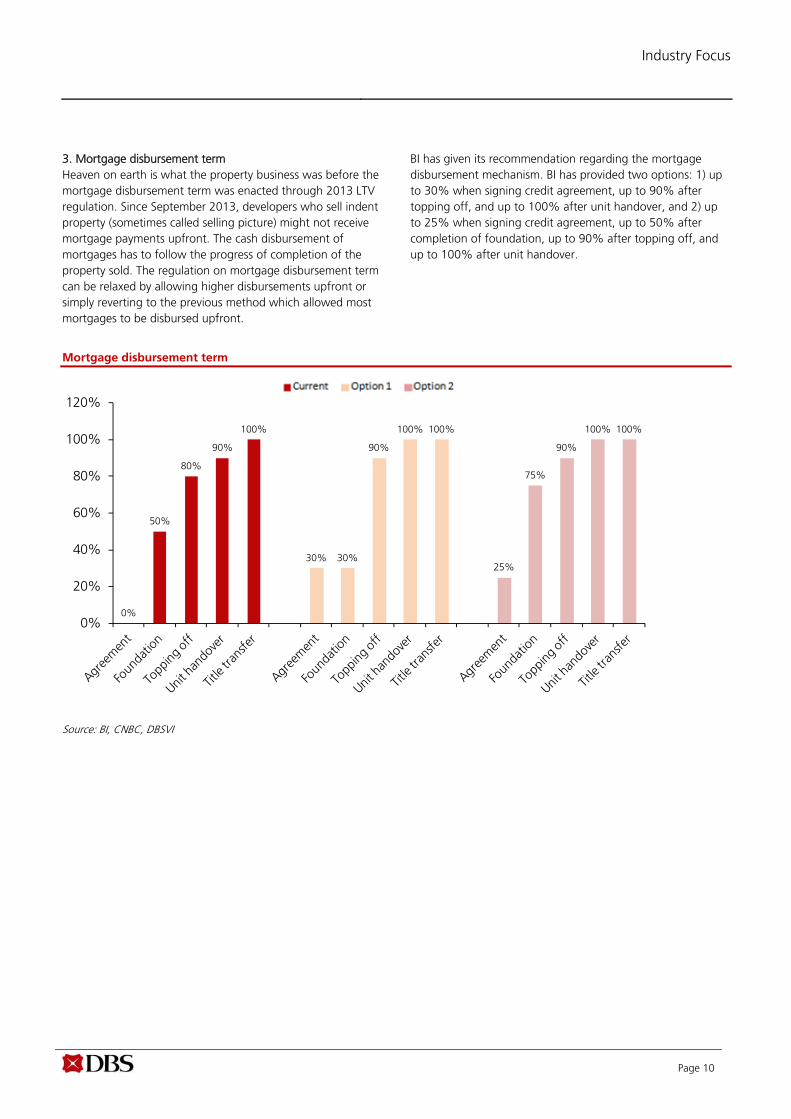
3. Mortgage disbursement term Heaven on earth is what the property business was before the mortgage disbursement term was enacted through 2013 LTV regulation. Since September 2013, developers who sell indent property (sometimes called selling picture) might not receive mortgage payments upfront. The cash disbursement of mortgages has to follow the progress of completion of the property sold. The regulation on mortgage disbursement term can be relaxed by allowing higher disbursements upfront or simply reverting to the previous method which allowed most mortgages to be disbursed upfront.
BI has given its recommendation regarding the mortgage disbursement mechanism. BI has provided two options: 1) up to 30% when signing credit agreement, up to 90% after topping off, and up to 100% after unit handover, and 2) up to 25% when signing credit agreement, up to 50% after completion of foundation, up to 90% after topping off, and up to 100% after unit handover.
Mortgage disbursement term
Source: BI, CNBC, DBSVI
0%
50%
80%
90%
100%
30% 30%
90%
100% 100%
25%
75%
90%
100% 100%
0%
20%
40%
60%
80%
100%
120%
Industry Focus
Page 11
Maximum LTV regulated by BI on 2013, 2015, and 2016 and possible 2018 LTV
Source: BI, DBSVI
1st mortgage 2nd mortgage3rd mortgage
onwards1st mortgage 2nd mortgage
3rd mortgage onwards
Hous e > 70 s qm 70% 60% 50% 80% 70% 60%
Hous e 21 - 70 s qm - 70% 60% - 80% 70%
Apartment > 70 s qm 70% 60% 50% 80% 70% 60%
Apartment 21 - 70 s qm 80% 70% 60% 90% 80% 70%
Apartment < 21 s qm - 70% 60% - 80% 70%
Shophous e - 70% 60% - 80% 70%
1st mortgage 2nd mortgage3rd mortgage
onwards1st mortgage 2nd mortgage
3rd mortgage onwards
1st mortgage 2nd mortgage3rd mortgage
onwards1st mortgage 2nd mortgage
3rd mortgage onwards
Hous e > 70 s qm 80% 70% 60% 85% 75% 65% 10% 10% 10% 5% 5% 5%
Hous e 21 - 70 s qm - 80% 70% - 80% 70% 10% 10% 0% 0%
Apartment > 70 s qm 80% 70% 60% 85% 75% 65% 10% 10% 10% 5% 5% 5%
Apartment 21 - 70 s qm 90% 80% 70% 90% 80% 70% 10% 10% 10% 0% 0% 0%
Apartment < 21 s qm - 80% 70% - 80% 70% 10% 10% 0% 0%
Shophous e - 80% 70% - 80% 70% 10% 10% 0% 0%
1st mortgage 2nd mortgage3rd mortgage
onwards1st mortgage 2nd mortgage
3rd mortgage onwards
1st mortgage 2nd mortgage3rd mortgage
onwards1st mortgage 2nd mortgage
3rd mortgage onwards
Hous e > 70 s qm 85% 80% 75% 90% 85% 80% 5% 10% 15% 5% 10% 15%
Hous e 21 - 70 s qm - 85% 80% - 90% 85% 5% 10% 10% 15%
Apartment > 70 s qm 85% 80% 75% 90% 85% 80% 5% 10% 15% 5% 10% 15%
Apartment 21 - 70 s qm 90% 85% 80% 90% 85% 80% 0% 5% 10% 0% 5% 10%
Apartment < 21 s qm - 85% 80% - 85% 80% 5% 10% 5% 10%
Shophous e - 85% 80% - 85% 80% 5% 10% 5% 10%
1st mortgage 2nd mortgage3rd mortgage
onwards1st mortgage 2nd mortgage
3rd mortgage onwards
1st mortgage 2nd mortgage3rd mortgage
onwards1st mortgage 2nd mortgage
3rd mortgage onwards
Hous e > 70 s qm 100% 80% 75% 100% 85% 80% 15% 0% 0% 10% 0% 0%
Hous e 21 - 70 s qm 100% 85% 80% 100% 90% 85% 0% 0% 0% 0%
Apartment > 70 s qm 100% 80% 75% 100% 85% 80% 15% 0% 0% 10% 0% 0%
Apartment 21 - 70 s qm 100% 85% 80% 100% 85% 80% 10% 0% 0% 10% 0% 0%
Apartment < 21 s qm 100% 85% 80% 100% 85% 80% 0% 0% 0% 0%
Shophous e 100% 85% 80% 100% 85% 80% 0% 0% 0% 0%
Ma ximum LTV (2018F) Ma ximum LTV (2018F) Cha nge s in LTV (2016-2018F) Cha nge s in LTV (2016-2018F)
Ma ximum LTV (2013) Ma ximum LTV (2013)Murabahah & I st ishna` Agreement MMQ & IMBT Agreement
Ma ximum LTV (2015)
Ma ximum LTV (2016) Ma ximum LTV (2016)
Ma ximum LTV (2015)
Cha nge s in LTV (2015-2016) Cha nge s in LTV (2015-2016)
Murabahah & I st ishna` Agreement MMQ & IMBT AgreementCha nge s in LTV (2013-2015) Cha nge s in LTV (2013-2015)
Industry Focus
Page 12
Impact of LTV relaxation on property sector
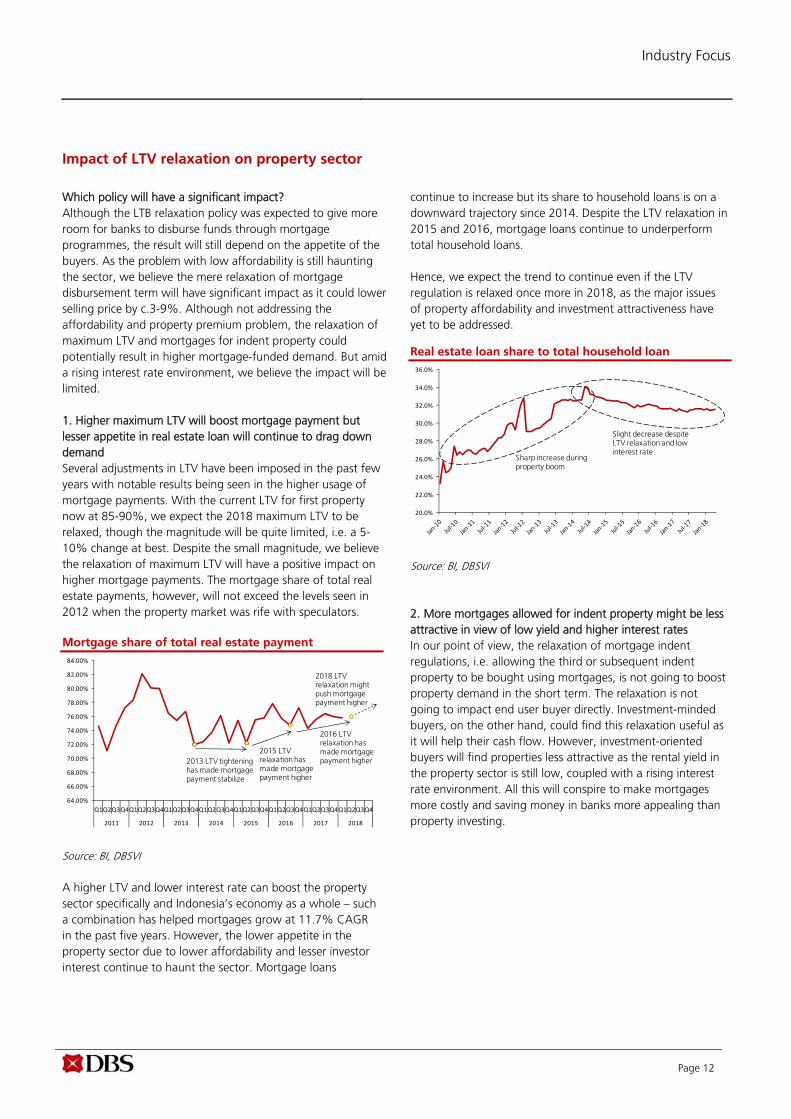
Which policy will have a significant impact? Although the LTB relaxation policy was expected to give more room for banks to disburse funds through mortgage programmes, the result will still depend on the appetite of the buyers. As the problem with low affordability is still haunting the sector, we believe the mere relaxation of mortgage disbursement term will have significant impact as it could lower selling price by c.3-9%. Although not addressing the affordability and property premium problem, the relaxation of maximum LTV and mortgages for indent property could potentially result in higher mortgage-funded demand. But amid a rising interest rate environment, we believe the impact will be limited. 1. Higher maximum LTV will boost mortgage payment but lesser appetite in real estate loan will continue to drag down demand Several adjustments in LTV have been imposed in the past few years with notable results being seen in the higher usage of mortgage payments. With the current LTV for first property now at 85-90%, we expect the 2018 maximum LTV to be relaxed, though the magnitude will be quite limited, i.e. a 5-10% change at best. Despite the small magnitude, we believe the relaxation of maximum LTV will have a positive impact on higher mortgage payments. The mortgage share of total real estate payments, however, will not exceed the levels seen in 2012 when the property market was rife with speculators. Mortgage share of total real estate payment
Source: BI, DBSVI A higher LTV and lower interest rate can boost the property sector specifically and Indonesia’s economy as a whole – such a combination has helped mortgages grow at 11.7% CAGR in the past five years. However, the lower appetite in the property sector due to lower affordability and lesser investor interest continue to haunt the sector. Mortgage loans
continue to increase but its share to household loans is on a downward trajectory since 2014. Despite the LTV relaxation in 2015 and 2016, mortgage loans continue to underperform total household loans. Hence, we expect the trend to continue even if the LTV regulation is relaxed once more in 2018, as the major issues of property affordability and investment attractiveness have yet to be addressed.
Real estate loan share to total household loan
Source: BI, DBSVI 2. More mortgages allowed for indent property might be less attractive in view of low yield and higher interest rates In our point of view, the relaxation of mortgage indent regulations, i.e. allowing the third or subsequent indent property to be bought using mortgages, is not going to boost property demand in the short term. The relaxation is not going to impact end user buyer directly. Investment-minded buyers, on the other hand, could find this relaxation useful as it will help their cash flow. However, investment-oriented buyers will find properties less attractive as the rental yield in the property sector is still low, coupled with a rising interest rate environment. All this will conspire to make mortgages more costly and saving money in banks more appealing than property investing.
64.00%
66.00%
68.00%
70.00%
72.00%
74.00%
76.00%
78.00%
80.00%
82.00%
84.00%
Q1Q2Q3Q4Q1Q2Q3Q4Q1Q2Q3Q4Q1Q2Q3Q4Q1Q2Q3Q4Q1Q2Q3Q4Q1Q2Q3Q4Q1Q2Q3Q4
2011 2012 2013 2014 2015 2016 2017 2018
2013 LTV tightening has made mortgage payment stabilize
2015 LTV relaxation has made mortgage payment higher
2016 LTV relaxation has made mortgage payment higher
2018 LTV relaxation might push mortgage payment higher
20.0%
22.0%
24.0%
26.0%
28.0%
30.0%
32.0%
34.0%
36.0%
Slight decrease despite LTV relaxation and low interest rate
Sharp increase during property boom

Industry Focus
Page 13
Property premium over deposit rate (%)
Source: BI, DBSVI 3. Relaxation of mortgage disbursement term can boost demand by lowering prices As we believe low affordability is one key factor that is affecting the demand for property, the relaxation of mortgage disbursement term, i.e. allowing developers to receive most of the mortgage payments upfront, will definitely boost the demand for property. If the mortgage disbursement term is reverted to the previous arrangement, developers can lower their selling price by c.3-9%, depending on their project and cost of capital. The lowering of selling price through the relaxation of mortgage payments can help
ameliorate the affordability problem. Although we have no clues on whether this regulation will be relaxed or not, we believe this is the most effective way to help the property sector recover amid a rising interest rate environment. Cash disbursement through mortgage payment
Source: BI, DBSVI
50%
30%
10%
10%
0% 10% 20% 30% 40% 50% 60%
Foundation
Topping off
Unit handover
Title transfer
1.59
5.98
10.69 10.31
12.95
1.47 1.94
(0.30)
3.33
(2.00)
-
2.00
4.00
6.00
8.00
10.00
12.00
14.00
2009 2010 2011 2012 2013 2014 2015 2016 2017
investmentopportunity
unattractiveinvestment

Industry Focus
Page 14
NPL has stabilised but could head north again due to higher interest rate
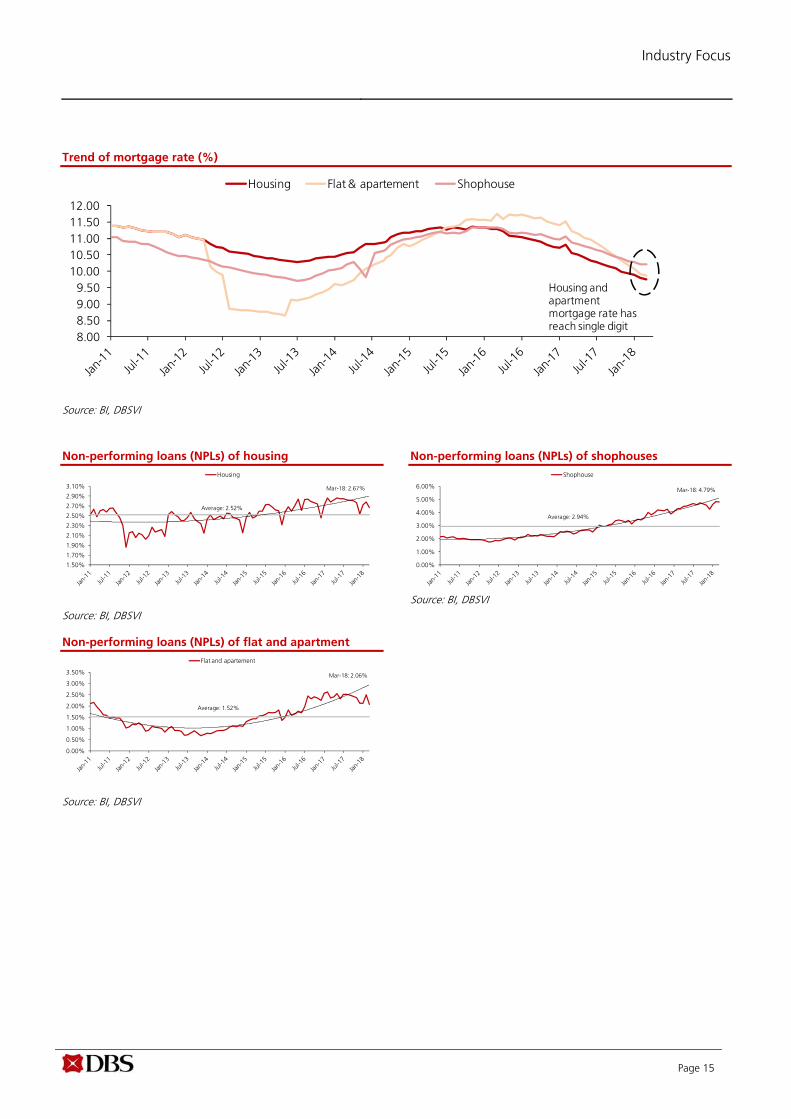
Upward trend of non-performing loans (NPLs) Historical data shows very clearly that when the Central Bank of Indonesia or BI introduces restrictions on the property sector, the NPLs of the property sector tend to trend up. This trend can be seen more clearly for high-rise residential and shophouse units, as both are perceived as superior investment vehicles in the property space. The NPL increase for landed residential properties was less stellar compared to other properties, as end-user buyers tend to buy landed houses for their own occupation. The rising NPL trend could also be explained by the action of some speculators who bought properties during boom times by over-leveraging their financial position in the hope of making quick capital gains. When property price appreciation decelerates and there is not much real demand to absorb incoming supply, NPLs would naturally head north. NPLs of landed houses and apartments have stabilised The upward momentum of NPLs for houses and apartments movement has stalled. The NPLs of landed houses has hovered around 2.7-2.8% in the past two years, while that of flats and apartments at 2.0-2.5%. Despite the flat trend, the NPLs of landed houses and apartments are still above their respective historical levels. The NPL ratio for the landed house segment stood at 2.67% as of end-Mar 2018 – which is above its historical average of 2.52%. As of end-Mar 2018, the NPLs for flats and apartments stood at 2.06%, well above their historical averages of 1.52%.
NPLs of shophouses still moving north The stabilisation of NPLs cannot be seen for shophouse units, as such NPLs continue to head north. The NPL ratio of shophouses reached its all-time high in Feb 2018 at 4.84%, while at end of Mar 2018, it stood at 4.79%. Why is the NPL ratio of shophouses still going up when that of the other two, landed houses and apartments, has stabilised? In our view, this is due to a shophouse’s typically higher ticket size compared to a landed house or apartment. The use of shophouses in operating businesses could also explain the higher NPLs for this segment amid economic stagnation in the past few years. Potential rise in NPLs in view of rising interest rates Mortgage rates that are on a downtrend should help to keep NPLs at a stable clip. However, at the moment, interest rates are likely to rise and this could spark a hike in NPLs for the property sector. Given the current situation of stagnant loan growth and high liquidity in the financial sector, banks are keen to disburse more mortgages by giving promotional fixed rates for the first 3-5 years. Potential NPLs could arise when the fixed rates are switched into floating rates, especially if and when the benchmark interest rate is cranked up to high levels.
Non-performing loans (NPLs) of property sector
Source: BI, DBSVI
0.00%
1.00%
2.00%
3.00%
4.00%
5.00%
Housing Flat and apartement Shophouse
NPL of housing and apartment have
stablised
Industry Focus
Page 15
Trend of mortgage rate (%)
Source: BI, DBSVI Non-performing loans (NPLs) of housing
Source: BI, DBSVI
Non-performing loans (NPLs) of flat and apartment
Source: BI, DBSVI
Non-performing loans (NPLs) of shophouses
Source: BI, DBSVI
1.50%
1.70%
1.90%
2.10%
2.30%
2.50%
2.70%
2.90%
3.10%
Housing
Average: 2.52%
Mar-18: 2.67%
0.00%
0.50%
1.00%
1.50%
2.00%
2.50%
3.00%
3.50%
Flat and apartement
Average: 1.52%
Mar-18: 2.06%
0.00%
1.00%
2.00%
3.00%
4.00%
5.00%
6.00%
Shophouse
Average: 2.94%
Mar-18: 4.79%
8.008.509.009.50
10.0010.5011.0011.5012.00
Housing Flat & apartement Shophouse
Housing and apartment mortgage rate has reach single digit
Industry Focus
Page 16
Headwinds from interest rate hikes
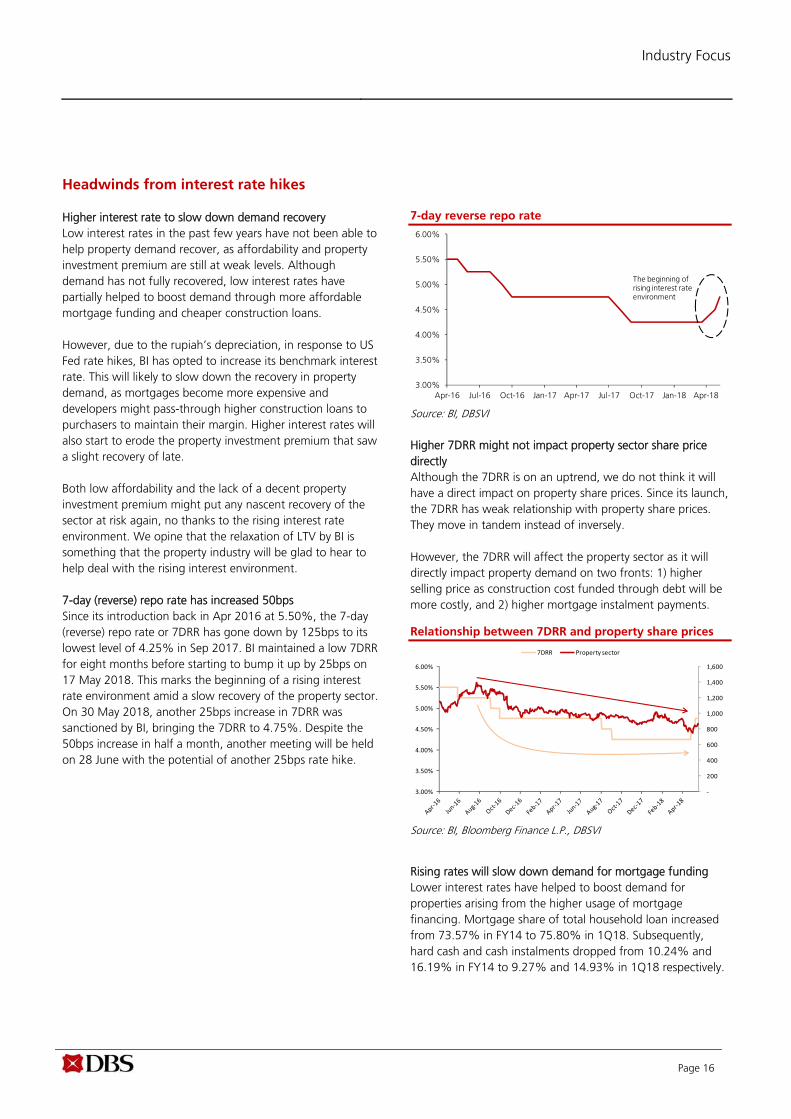
Higher interest rate to slow down demand recovery Low interest rates in the past few years have not been able to help property demand recover, as affordability and property investment premium are still at weak levels. Although demand has not fully recovered, low interest rates have partially helped to boost demand through more affordable mortgage funding and cheaper construction loans. However, due to the rupiah’s depreciation, in response to US Fed rate hikes, BI has opted to increase its benchmark interest rate. This will likely to slow down the recovery in property demand, as mortgages become more expensive and developers might pass-through higher construction loans to purchasers to maintain their margin. Higher interest rates will also start to erode the property investment premium that saw a slight recovery of late. Both low affordability and the lack of a decent property investment premium might put any nascent recovery of the sector at risk again, no thanks to the rising interest rate environment. We opine that the relaxation of LTV by BI is something that the property industry will be glad to hear to help deal with the rising interest environment. 7-day (reverse) repo rate has increased 50bps Since its introduction back in Apr 2016 at 5.50%, the 7-day (reverse) repo rate or 7DRR has gone down by 125bps to its lowest level of 4.25% in Sep 2017. BI maintained a low 7DRR for eight months before starting to bump it up by 25bps on 17 May 2018. This marks the beginning of a rising interest rate environment amid a slow recovery of the property sector. On 30 May 2018, another 25bps increase in 7DRR was sanctioned by BI, bringing the 7DRR to 4.75%. Despite the 50bps increase in half a month, another meeting will be held on 28 June with the potential of another 25bps rate hike.
7-day reverse repo rate
Source: BI, DBSVI Higher 7DRR might not impact property sector share price directly Although the 7DRR is on an uptrend, we do not think it will have a direct impact on property share prices. Since its launch, the 7DRR has weak relationship with property share prices. They move in tandem instead of inversely. However, the 7DRR will affect the property sector as it will directly impact property demand on two fronts: 1) higher selling price as construction cost funded through debt will be more costly, and 2) higher mortgage instalment payments.
Relationship between 7DRR and property share prices
Source: BI, Bloomberg Finance L.P., DBSVI
Rising rates will slow down demand for mortgage funding Lower interest rates have helped to boost demand for properties arising from the higher usage of mortgage financing. Mortgage share of total household loan increased from 73.57% in FY14 to 75.80% in 1Q18. Subsequently, hard cash and cash instalments dropped from 10.24% and 16.19% in FY14 to 9.27% and 14.93% in 1Q18 respectively.
3.00%
3.50%
4.00%
4.50%
5.00%
5.50%
6.00%
Apr-16 Jul-16 Oct-16 Jan-17 Apr-17 Jul-17 Oct-17 Jan-18 Apr-18
The beginning of rising interest rate environment
‐
200
400
600
800
1,000
1,200
1,400
1,600
3.00%
3.50%
4.00%
4.50%
5.00%
5.50%
6.00%
7DRR Property sector
Industry Focus
Page 17
The 50bps 7DRR increase in May 2018 will have a negative impact on mortgage demand. However, it will not have a significant impact on the 2Q18 number as the interest rate hikes took place in May and will have some time lag before they start to affect mortgage rates and demand.
Mortgage share of property financing
Source: BI, DBSVI
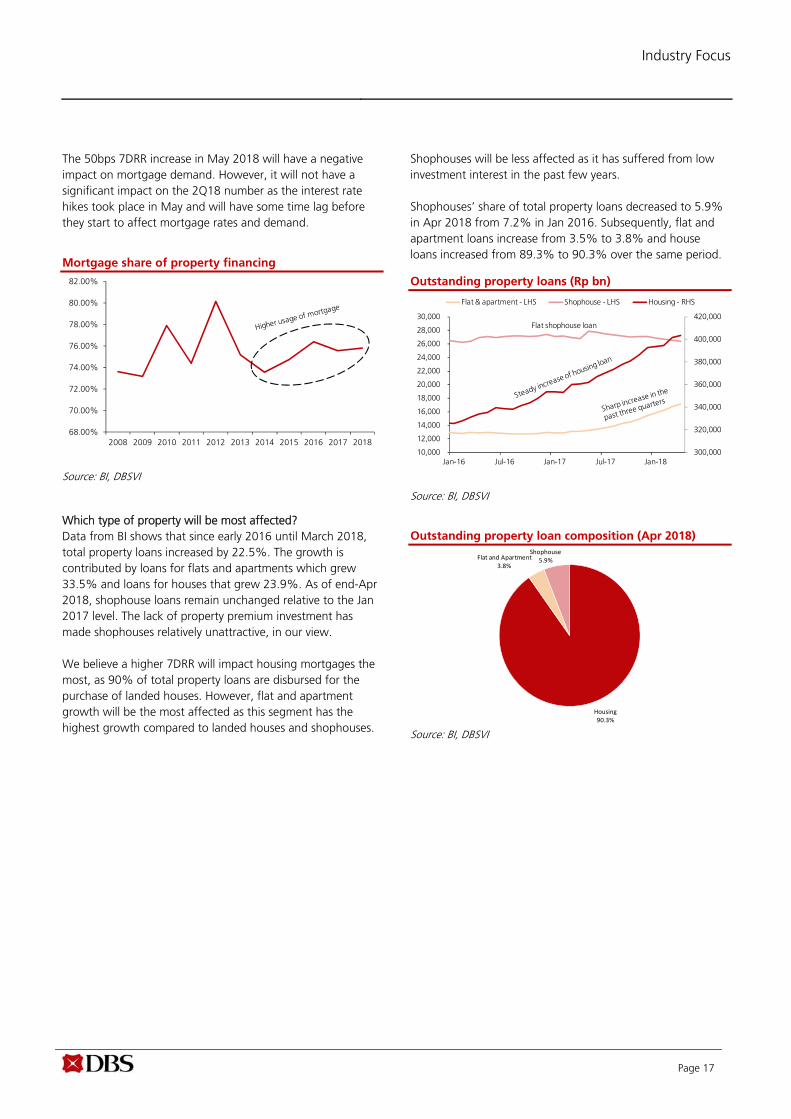
Which type of property will be most affected? Data from BI shows that since early 2016 until March 2018, total property loans increased by 22.5%. The growth is contributed by loans for flats and apartments which grew 33.5% and loans for houses that grew 23.9%. As of end-Apr 2018, shophouse loans remain unchanged relative to the Jan 2017 level. The lack of property premium investment has made shophouses relatively unattractive, in our view. We believe a higher 7DRR will impact housing mortgages the most, as 90% of total property loans are disbursed for the purchase of landed houses. However, flat and apartment growth will be the most affected as this segment has the highest growth compared to landed houses and shophouses.
Shophouses will be less affected as it has suffered from low investment interest in the past few years. Shophouses’ share of total property loans decreased to 5.9% in Apr 2018 from 7.2% in Jan 2016. Subsequently, flat and apartment loans increase from 3.5% to 3.8% and house loans increased from 89.3% to 90.3% over the same period.
Outstanding property loans (Rp bn)
Source: BI, DBSVI
Outstanding property loan composition (Apr 2018)
Source: BI, DBSVI
300,000
320,000
340,000
360,000
380,000
400,000
420,000
10,000
12,000
14,000
16,000
18,000
20,000
22,000
24,000
26,000
28,000
30,000
Jan-16 Jul-16 Jan-17 Jul-17 Jan-18
Flat & apartment - LHS Shophouse - LHS Housing - RHS
Flat shophouse loan
68.00%
70.00%
72.00%
74.00%
76.00%
78.00%
80.00%
82.00%
2008 2009 2010 2011 2012 2013 2014 2015 2016 2017 2018
Housing90.3%
Flat and Apartment3.8%
Shophouse5.9%
Industry Focus
Page 18
0
10
20
30
40
50
60
ASRI BSDE CTRA LPKR PWON SMRA
average
0
10
20
30
40
50
60
70
80
ASRI BSDE CTRA LPKR PWON SMRA
average
FY2017 FY2018 FY2017 FY2018 FY2017 FY2018
Alam Sutera Realty 6,799 346 400 HOLD 15.6% 8.1x 4.7x 0.9x 0.8x 0.4% 0.0%
Bumi Serpong Damai 31,661 1,645 2100 BUY 27.7% 10.0x 10.0x 1.2x 1.1x 0.3% 0.0%
Ciputra Development 20,416 1,100 1150 HOLD 4.5% 18.1x 18.3x 1.5x 1.3x 0.4% 0.8%
Pakuwon Jati 25,525 530 630 HOLD 18.9% 12.0x 11.0x 2.5x 2.1x 0.8% 0.8%
Summarecon Agung 13,633 945 1000 HOLD 5.8% 32.9x 28.7x 2.1x 2.0x 0.2% 0.3%
Market
CapitalisationCompany
Current
Price
Target
Price
Recomme
ndationUpside PE Forward (X) Price/ BVPS (X) Dividend Yield %
Top pick for the sector
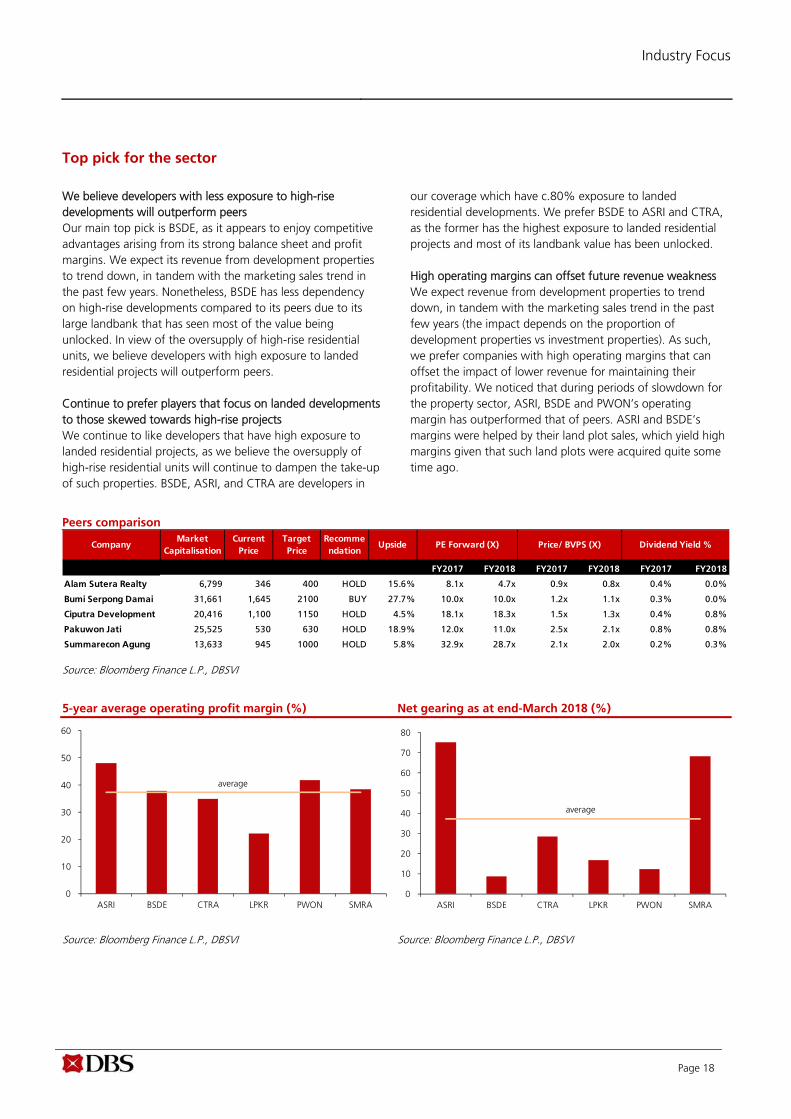
We believe developers with less exposure to high-rise developments will outperform peers Our main top pick is BSDE, as it appears to enjoy competitive advantages arising from its strong balance sheet and profit margins. We expect its revenue from development properties to trend down, in tandem with the marketing sales trend in the past few years. Nonetheless, BSDE has less dependency on high-rise developments compared to its peers due to its large landbank that has seen most of the value being unlocked. In view of the oversupply of high-rise residential units, we believe developers with high exposure to landed residential projects will outperform peers. Continue to prefer players that focus on landed developments to those skewed towards high-rise projects We continue to like developers that have high exposure to landed residential projects, as we believe the oversupply of high-rise residential units will continue to dampen the take-up of such properties. BSDE, ASRI, and CTRA are developers in
our coverage which have c.80% exposure to landed residential developments. We prefer BSDE to ASRI and CTRA, as the former has the highest exposure to landed residential projects and most of its landbank value has been unlocked. High operating margins can offset future revenue weakness We expect revenue from development properties to trend down, in tandem with the marketing sales trend in the past few years (the impact depends on the proportion of development properties vs investment properties). As such, we prefer companies with high operating margins that can offset the impact of lower revenue for maintaining their profitability. We noticed that during periods of slowdown for the property sector, ASRI, BSDE and PWON’s operating margin has outperformed that of peers. ASRI and BSDE’s margins were helped by their land plot sales, which yield high margins given that such land plots were acquired quite some time ago.
Peers comparison
Source: Bloomberg Finance L.P., DBSVI
5-year average operating profit margin (%) Net gearing as at end-March 2018 (%)
Source: Bloomberg Finance L.P., DBSVI Source: Bloomberg Finance L.P., DBSVI
Industry Focus
Page 19
0%
10%
20%
30%
40%
50%
60%
70%
80%
Jan-13 Jan-14 Jan-15 Jan-16 Jan-17 Jan-18
+2SD
+1SD
-2SD
-1SD
AVG
30%
35%
40%
45%
50%
55%
60%
65%
70%
Jan-13 Jan-14 Jan-15 Jan-16 Jan-17 Jan-18
+2SD
+1SD
-2SD
-1SD
AVG
0%
10%
20%
30%
40%
50%
60%
Jan-13 Jan-14 Jan-15 Jan-16 Jan-17 Jan-18
+2SD
+1SD
-2SD
-1SD
AVG
10%
20%
30%
40%
50%
60%
70%
80%
Jan-13 Jan-14 Jan-15 Jan-16 Jan-17 Jan-18
+2SD
+1SD
-2SD
-1SD
AVG
-20%
-10%
0%
10%
20%
30%
40%
50%
60%
Jan-13 Jan-14 Jan-15 Jan-16 Jan-17 Jan-18
+2SD
+1SD
-2SD
-1SD
AVG
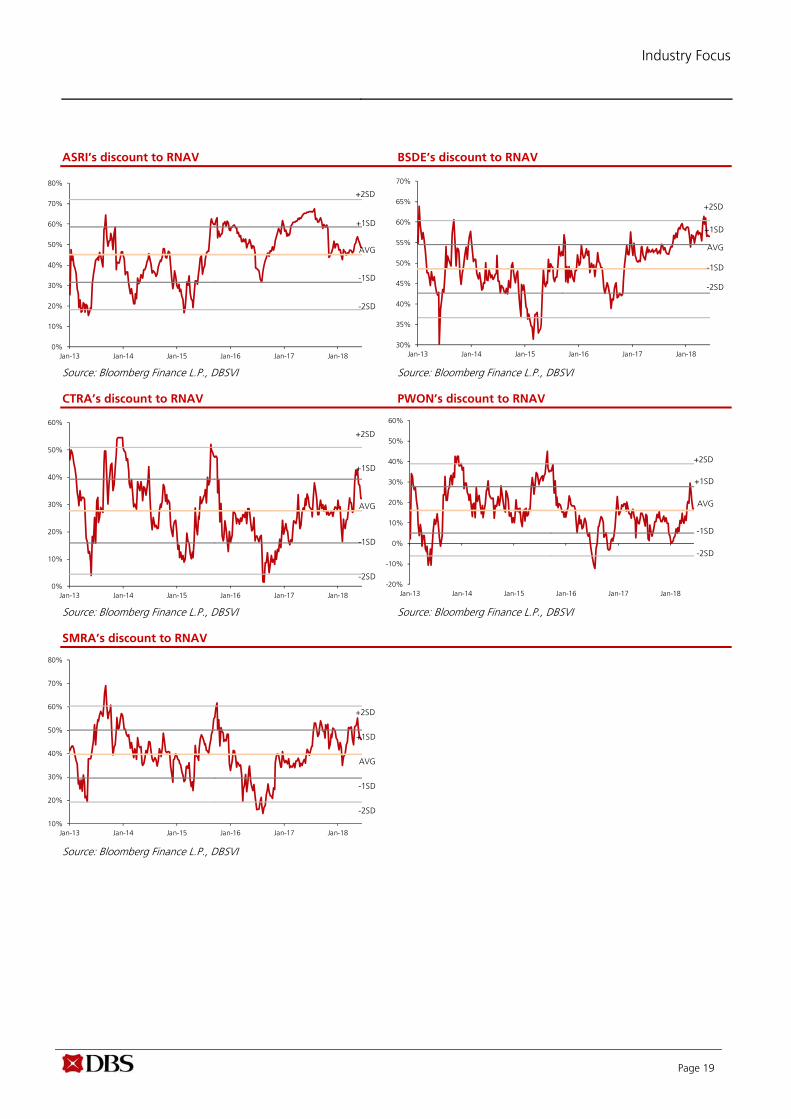
ASRI’s discount to RNAV BSDE’s discount to RNAV
Source: Bloomberg Finance L.P., DBSVI Source: Bloomberg Finance L.P., DBSVI CTRA’s discount to RNAV PWON’s discount to RNAV
Source: Bloomberg Finance L.P., DBSVI Source: Bloomberg Finance L.P., DBSVI
SMRA’s discount to RNAV
Source: Bloomberg Finance L.P., DBSVI
Industry Focus
Page 20
0
50
100
150
200
250
300
Jan‐11 Jan‐12 Jan‐13 Jan‐14 Jan‐15 Jan‐16 Jan‐17 Jan‐18
DBS Property Index BSDE
0
50
100
150
200
250
300
350
400
Jan‐11 Jan‐12 Jan‐13 Jan‐14 Jan‐15 Jan‐16 Jan‐17 Jan‐18
DBS Property Index ASRI
0
100
200
300
400
500
600
Jan‐11 Jan‐12 Jan‐13 Jan‐14 Jan‐15 Jan‐16 Jan‐17 Jan‐18
DBS Property Index CTRA
0
50
100
150
200
250
300
Jan‐11 Jan‐12 Jan‐13 Jan‐14 Jan‐15 Jan‐16 Jan‐17 Jan‐18
DBS Property Index LPKR
0
50
100
150
200
250
300
350
400
Jan‐11 Jan‐12 Jan‐13 Jan‐14 Jan‐15 Jan‐16 Jan‐17 Jan‐18
DBS Property Index PWON
0
50
100
150
200
250
300
350
400
Jan‐11 Jan‐12 Jan‐13 Jan‐14 Jan‐15 Jan‐16 Jan‐17 Jan‐18
DBS Property Index SMRA
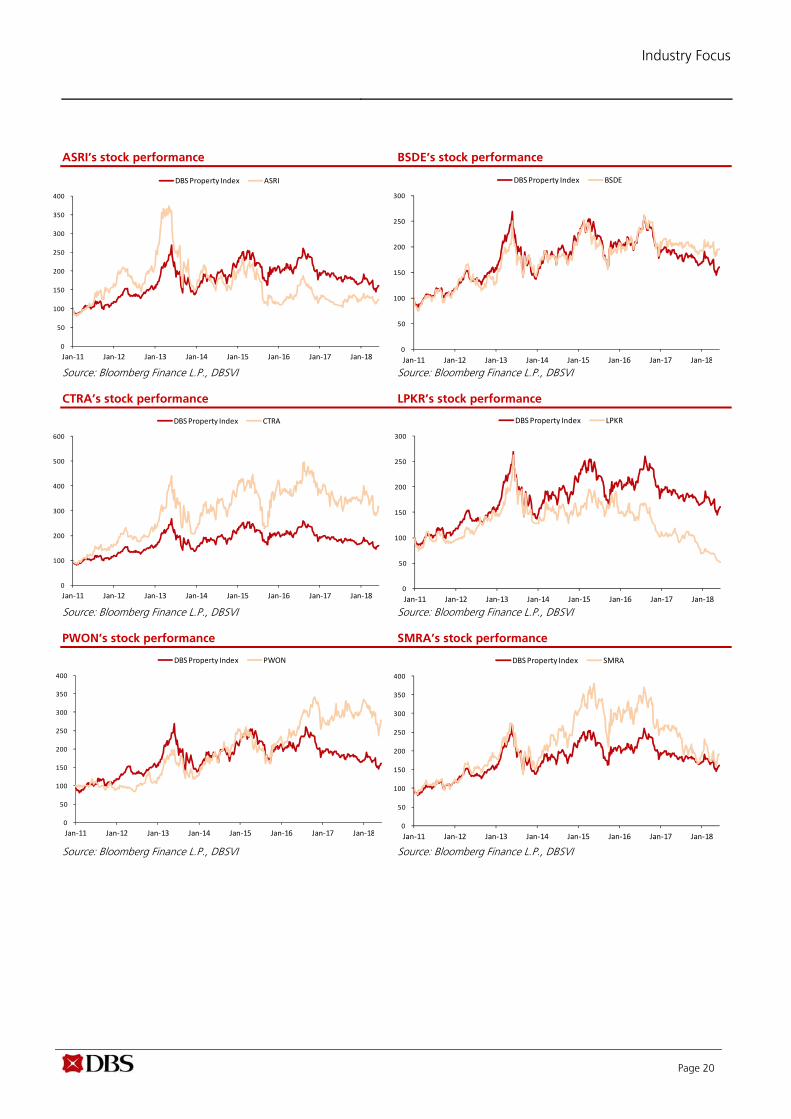
ASRI’s stock performance BSDE’s stock performance
Source: Bloomberg Finance L.P., DBSVI Source: Bloomberg Finance L.P., DBSVI CTRA’s stock performance LPKR’s stock performance
Source: Bloomberg Finance L.P., DBSVI Source: Bloomberg Finance L.P., DBSVI
PWON’s stock performance SMRA’s stock performance
Source: Bloomberg Finance L.P., DBSVI Source: Bloomberg Finance L.P., DBSVI
Industry Focus
Page 21
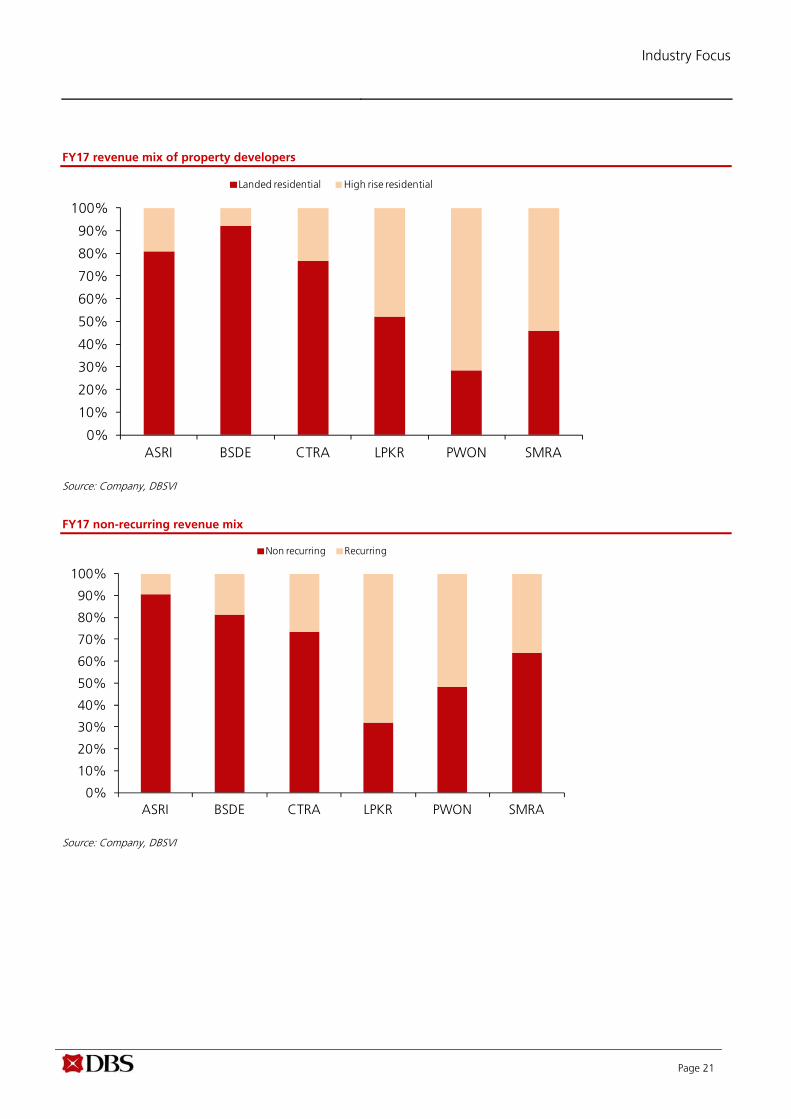
FY17 revenue mix of property developers
Source: Company, DBSVI
FY17 non-recurring revenue mix
Source: Company, DBSVI
0%
10%
20%
30%
40%
50%
60%
70%
80%
90%
100%
ASRI BSDE CTRA LPKR PWON SMRA
Landed residential High rise residential
0%
10%
20%
30%
40%
50%
60%
70%
80%
90%
100%
ASRI BSDE CTRA LPKR PWON SMRA
Non recurring Recurring

Industry Focus
Page 22
Company Guide
ed: kk / sa:MA, PY, CS
BUY
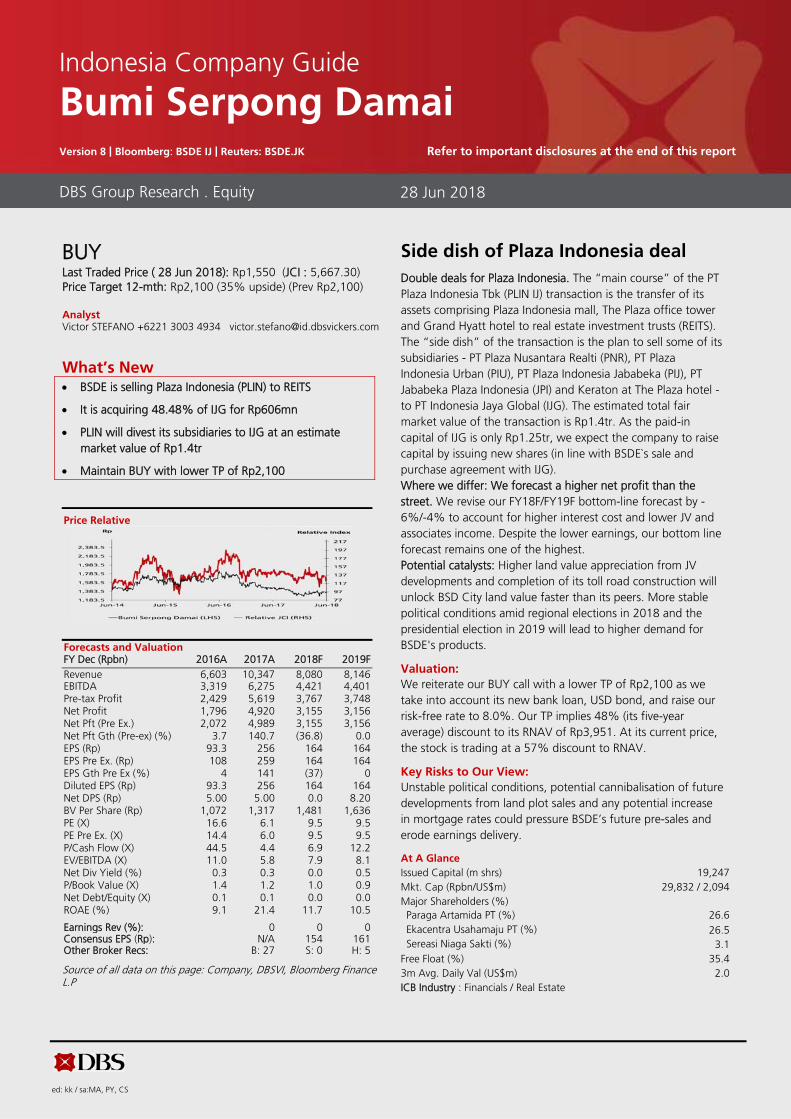
Last Traded Price ( 28 Jun 2018): Rp1,550 (JCI : 5,667.30) Price Target 12-mth: Rp2,100 (35% upside) (Prev Rp2,100) Analyst Victor STEFANO +6221 3003 4934 [email protected]
What’s New BSDE is selling Plaza Indonesia (PLIN) to REITS
It is acquiring 48.48% of IJG for Rp606mn
PLIN will divest its subsidiaries to IJG at an estimate market value of Rp1.4tr
Maintain BUY with lower TP of Rp2,100
Price Relative
Forecasts and Valuation FY Dec (Rpbn) 2016A 2017A 2018F 2019F Revenue 6,603 10,347 8,080 8,146 EBITDA 3,319 6,275 4,421 4,401 Pre-tax Profit 2,429 5,619 3,767 3,748 Net Profit 1,796 4,920 3,155 3,156 Net Pft (Pre Ex.) 2,072 4,989 3,155 3,156 Net Pft Gth (Pre-ex) (%) 3.7 140.7 (36.8) 0.0 EPS (Rp) 93.3 256 164 164 EPS Pre Ex. (Rp) 108 259 164 164 EPS Gth Pre Ex (%) 4 141 (37) 0 Diluted EPS (Rp) 93.3 256 164 164 Net DPS (Rp) 5.00 5.00 0.0 8.20 BV Per Share (Rp) 1,072 1,317 1,481 1,636 PE (X) 16.6 6.1 9.5 9.5 PE Pre Ex. (X) 14.4 6.0 9.5 9.5 P/Cash Flow (X) 44.5 4.4 6.9 12.2 EV/EBITDA (X) 11.0 5.8 7.9 8.1 Net Div Yield (%) 0.3 0.3 0.0 0.5 P/Book Value (X) 1.4 1.2 1.0 0.9 Net Debt/Equity (X) 0.1 0.1 0.0 0.0 ROAE (%) 9.1 21.4 11.7 10.5 Earnings Rev (%): 0 0 0 Consensus EPS (Rp): N/A 154 161 Other Broker Recs: B: 27 S: 0 H: 5
Source of all data on this page: Company, DBSVI, Bloomberg Finance L.P
Side dish of Plaza Indonesia deal Double deals for Plaza Indonesia. The “main course” of the PT Plaza Indonesia Tbk (PLIN IJ) transaction is the transfer of its assets comprising Plaza Indonesia mall, The Plaza office tower and Grand Hyatt hotel to real estate investment trusts (REITS). The “side dish” of the transaction is the plan to sell some of its subsidiaries - PT Plaza Nusantara Realti (PNR), PT Plaza Indonesia Urban (PIU), PT Plaza Indonesia Jababeka (PIJ), PT Jababeka Plaza Indonesia (JPI) and Keraton at The Plaza hotel - to PT Indonesia Jaya Global (IJG). The estimated total fair market value of the transaction is Rp1.4tr. As the paid-in capital of IJG is only Rp1.25tr, we expect the company to raise capital by issuing new shares (in line with BSDE`s sale and purchase agreement with IJG). Where we differ: We forecast a higher net profit than the street. We revise our FY18F/FY19F bottom-line forecast by -6%/-4% to account for higher interest cost and lower JV and associates income. Despite the lower earnings, our bottom line forecast remains one of the highest. Potential catalysts: Higher land value appreciation from JV developments and completion of its toll road construction will unlock BSD City land value faster than its peers. More stable political conditions amid regional elections in 2018 and the presidential election in 2019 will lead to higher demand for BSDE's products. Valuation:
We reiterate our BUY call with a lower TP of Rp2,100 as we take into account its new bank loan, USD bond, and raise our risk-free rate to 8.0%. Our TP implies 48% (its five-year average) discount to its RNAV of Rp3,951. At its current price, the stock is trading at a 57% discount to RNAV. Key Risks to Our View:
Unstable political conditions, potential cannibalisation of future developments from land plot sales and any potential increase in mortgage rates could pressure BSDE’s future pre-sales and erode earnings delivery. At A Glance Issued Capital (m shrs) 19,247 Mkt. Cap (Rpbn/US$m) 29,832 / 2,094 Major Shareholders (%) Paraga Artamida PT (%) 26.6 Ekacentra Usahamaju PT (%) 26.5 Sereasi Niaga Sakti (%) 3.1
Free Float (%) 35.4 3m Avg. Daily Val (US$m) 2.0 ICB Industry : Financials / Real Estate
DBS Group Research . Equity 28 Jun 2018
Indonesia Company Guide
Bumi Serpong Damai Version 8 | Bloomberg: BSDE IJ | Reuters: BSDE.JK Refer to important disclosures at the end of this report
Page 24
Company Guide
Bumi Serpong Damai
WHAT’S NEW
Side dish of Plaza Indonesia deal
Slow earnings recognition
Bumi Serpong Damai (BSDE) booked 1Q18 revenue of Rp1.7tr (-6% y-o-y, -62% q-o-q) and earnings of Rp407bn (-37% y-o-y, -84% q-o-q). Revenue forms 21% of our and consensus FY18 forecasts while earnings forms only 12% and 13% of our and consensus forecasts`. Despite low earnings, we still maintain our forecast as we are expecting some land plot sales to be booked this year.
Higher revenue from investment properties
Revenue from property development declined 11% y-o-y. Higher revenue from commercial products could not offset lower revenue from residential products. Revenue from investment properties rose 16% y-o-y from operations of office towers - Green Office Park BSD, Sinarmas MSIG Tower and Bakrie Tower. However, BSDE’s revenue from investment properties dropped 6% from 4Q17. This may be attributed to declining occupancy and/or rental price.
No dividend
Contrary to our previous expectations, the company will not be paying any dividend this year from its spectacular Rp4.9tr FY17 earnings. Instead, the company plans to utilise its cash for expansion. The company allocated Rp4-5tr capital expenditure (capex) this year, out of which Rp1-1.5tr is for land acquisition, Rp1-1.2tr for investment property development and the rest for working capital.
Net gearing remains stable
As of end March 2018, BSDE net gearing stood at 9%, a slight increase from 8% as of end December 2018. Despite the stable gearing, BSDE’s debt increased to Rp11.2tr from Rp9tr last quarter, mainly due to an additional Rp2.1tr long term bank loan from Bank Mandiri. At the same time, BSDE put Rp3tr into a short-term investment in Mandiri Investa Pasar Uang mutual fund.
Revised FY18F/FY19F earnings by -6%/-4%
We lower our FY18F/FF19F earnings forecast by 6%/4% as we impute higher interest expenses arising from higher debt due to its its additional long-term bank loan and US$300mn senior notes.
Revised RNAV to Rp3,951/share
We lower our RNAV calculations to take into account the lower earnings and higher risk-free rate. We adjust our risk-free rate assumption from 7.5% to 8.0% to account for a rising interest rate environment. Our RNAV calculations are
down to Rp3,951 from Rp4,132 previously. We have not taken into account the potential sale of its listed subsidiary Plaza Indonesia (PLIN IJ) into our RNAV calculations.
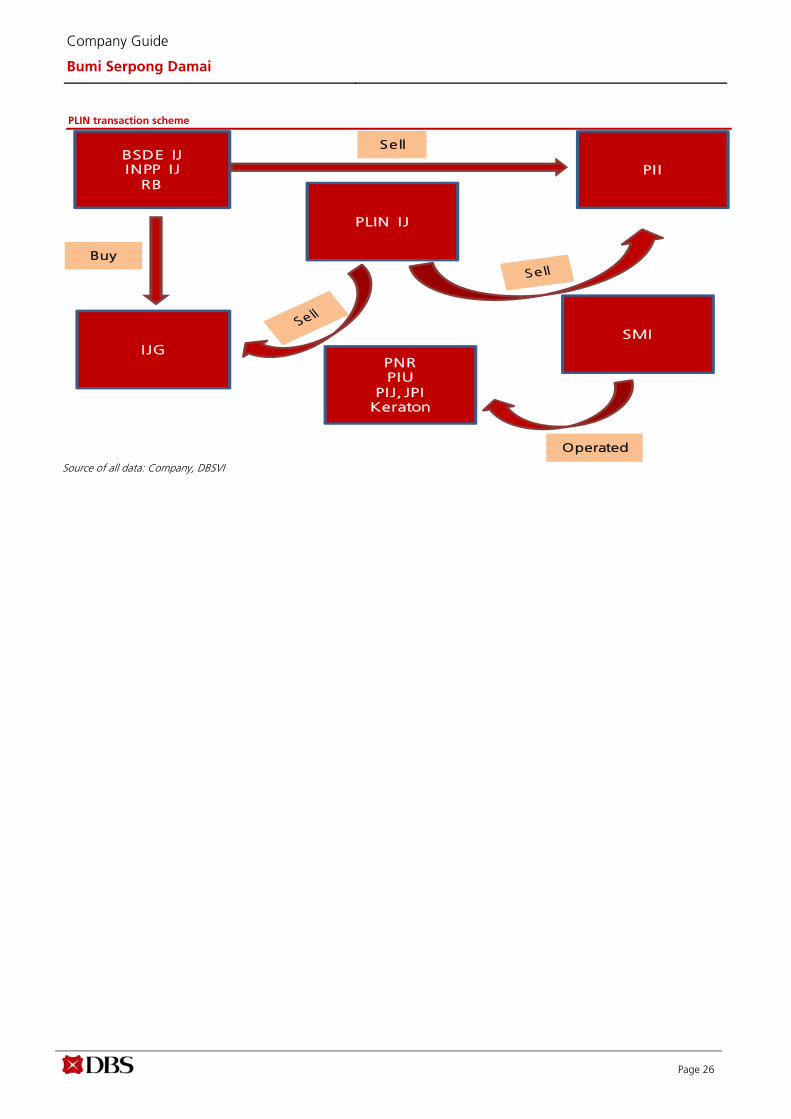
Sale of Plaza Indonesia to REITS
BSDE is planning to sell Plaza Indonesia (PLIN IJ) to PT Plaza Indonesia Investama - a REITS special purpose vehicle (SPV) - for Rp5.3tr. This implies a share price of Rp3,740, higher than current price of Rp3,300. Depending on the actual transaction value, BSDE will likely gain on the sale of PLIN. As of end March 2018, the carrying value of its investment in PLIN is Rp5.1tr.
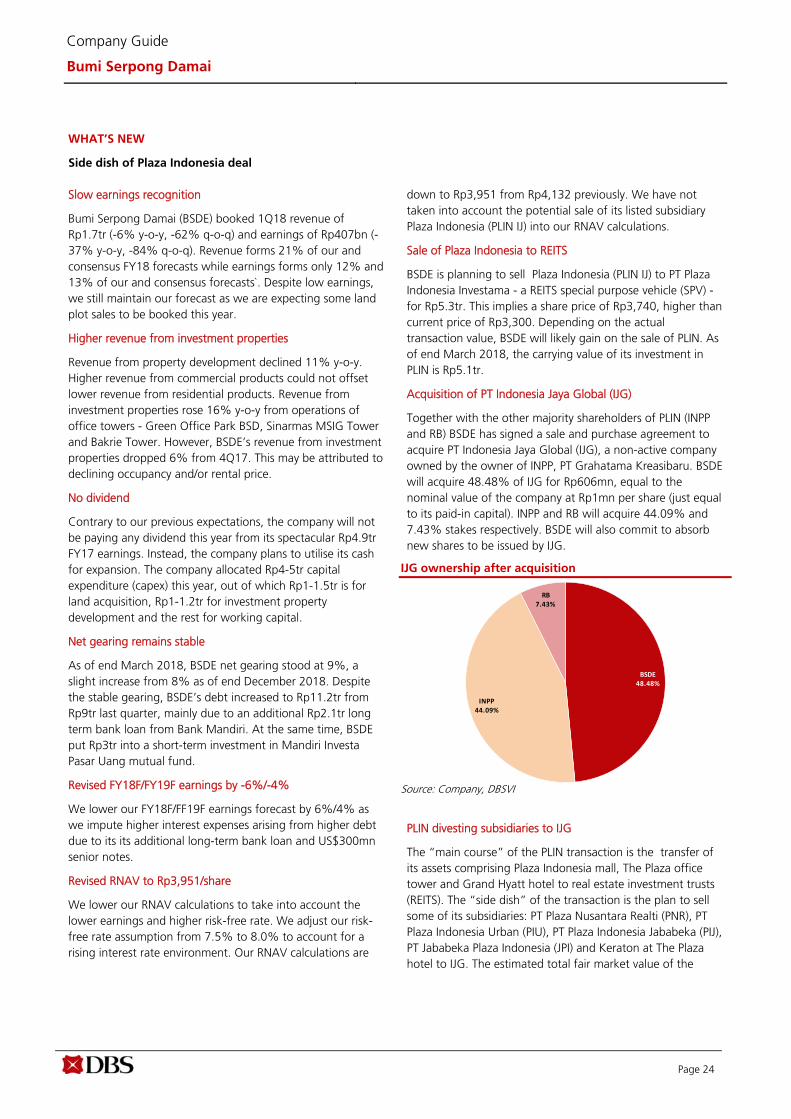
Acquisition of PT Indonesia Jaya Global (IJG)
Together with the other majority shareholders of PLIN (INPP and RB) BSDE has signed a sale and purchase agreement to acquire PT Indonesia Jaya Global (IJG), a non-active company owned by the owner of INPP, PT Grahatama Kreasibaru. BSDE will acquire 48.48% of IJG for Rp606mn, equal to the nominal value of the company at Rp1mn per share (just equal to its paid-in capital). INPP and RB will acquire 44.09% and 7.43% stakes respectively. BSDE will also commit to absorb new shares to be issued by IJG.
IJG ownership after acquisition
Source: Company, DBSVI
PLIN divesting subsidiaries to IJG
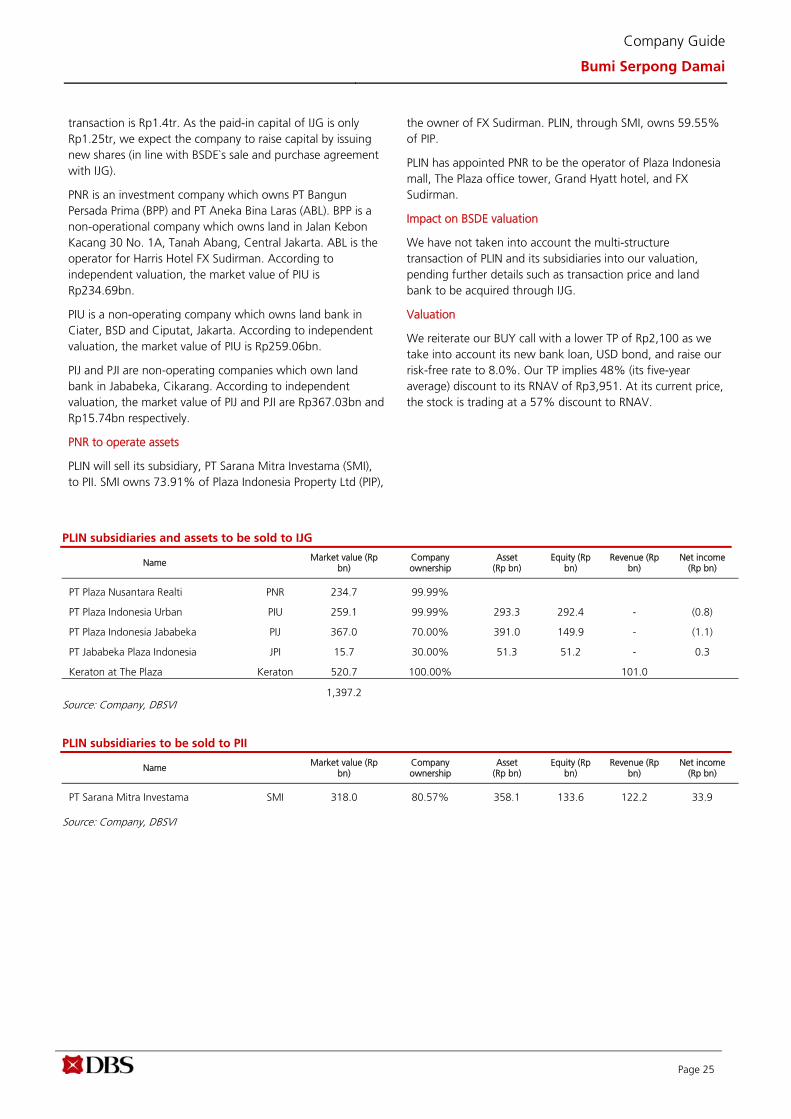
The “main course” of the PLIN transaction is the transfer of its assets comprising Plaza Indonesia mall, The Plaza office tower and Grand Hyatt hotel to real estate investment trusts (REITS). The “side dish” of the transaction is the plan to sell some of its subsidiaries: PT Plaza Nusantara Realti (PNR), PT Plaza Indonesia Urban (PIU), PT Plaza Indonesia Jababeka (PIJ), PT Jababeka Plaza Indonesia (JPI) and Keraton at The Plaza hotel to IJG. The estimated total fair market value of the
BSDE48.48%
INPP44.09%
RB7.43%
Page 25
Company Guide
Bumi Serpong Damai
transaction is Rp1.4tr. As the paid-in capital of IJG is only Rp1.25tr, we expect the company to raise capital by issuing new shares (in line with BSDE`s sale and purchase agreement with IJG).
PNR is an investment company which owns PT Bangun Persada Prima (BPP) and PT Aneka Bina Laras (ABL). BPP is a non-operational company which owns land in Jalan Kebon Kacang 30 No. 1A, Tanah Abang, Central Jakarta. ABL is the operator for Harris Hotel FX Sudirman. According to independent valuation, the market value of PIU is Rp234.69bn.
PIU is a non-operating company which owns land bank in Ciater, BSD and Ciputat, Jakarta. According to independent valuation, the market value of PIU is Rp259.06bn.
PIJ and PJI are non-operating companies which own land bank in Jababeka, Cikarang. According to independent valuation, the market value of PIJ and PJI are Rp367.03bn and Rp15.74bn respectively.
PNR to operate assets
PLIN will sell its subsidiary, PT Sarana Mitra Investama (SMI), to PII. SMI owns 73.91% of Plaza Indonesia Property Ltd (PIP),
the owner of FX Sudirman. PLIN, through SMI, owns 59.55% of PIP.
PLIN has appointed PNR to be the operator of Plaza Indonesia mall, The Plaza office tower, Grand Hyatt hotel, and FX Sudirman.
Impact on BSDE valuation
We have not taken into account the multi-structure transaction of PLIN and its subsidiaries into our valuation, pending further details such as transaction price and land bank to be acquired through IJG.
Valuation
We reiterate our BUY call with a lower TP of Rp2,100 as we take into account its new bank loan, USD bond, and raise our risk-free rate to 8.0%. Our TP implies 48% (its five-year average) discount to its RNAV of Rp3,951. At its current price, the stock is trading at a 57% discount to RNAV.
PLIN subsidiaries and assets to be sold to IJG
Name
Market value (Rp bn)
Company ownership
Asset (Rp bn)
Equity (Rp bn)
Revenue (Rp bn)
Net income (Rp bn)
PT Plaza Nusantara Realti PNR 234.7 99.99%
PT Plaza Indonesia Urban PIU 259.1 99.99% 293.3 292.4 - (0.8)
PT Plaza Indonesia Jababeka PIJ 367.0 70.00% 391.0 149.9 - (1.1)
PT Jababeka Plaza Indonesia JPI 15.7 30.00% 51.3 51.2 - 0.3
Keraton at The Plaza Keraton 520.7 100.00% 101.0
1,397.2 Source: Company, DBSVI
PLIN subsidiaries to be sold to PII
Name
Market value (Rp bn)
Company ownership
Asset (Rp bn)
Equity (Rp bn)
Revenue (Rp bn)
Net income (Rp bn)
PT Sarana Mitra Investama SMI 318.0 80.57% 358.1 133.6 122.2 33.9 Source: Company, DBSVI
Page 26
Company Guide
Bumi Serpong Damai
PLIN transaction scheme
Source of all data: Company, DBSVI
PLIN I J
PI IBSDE IJINPP IJ
RB
SMIIJG
PNRPIU
PIJ, JPIKeraton
Buy
Sell
Operated
Page 27
Company Guide
Bumi Serpong Damai
CRITICAL DATA POINTS TO WATCH
Critical Factors
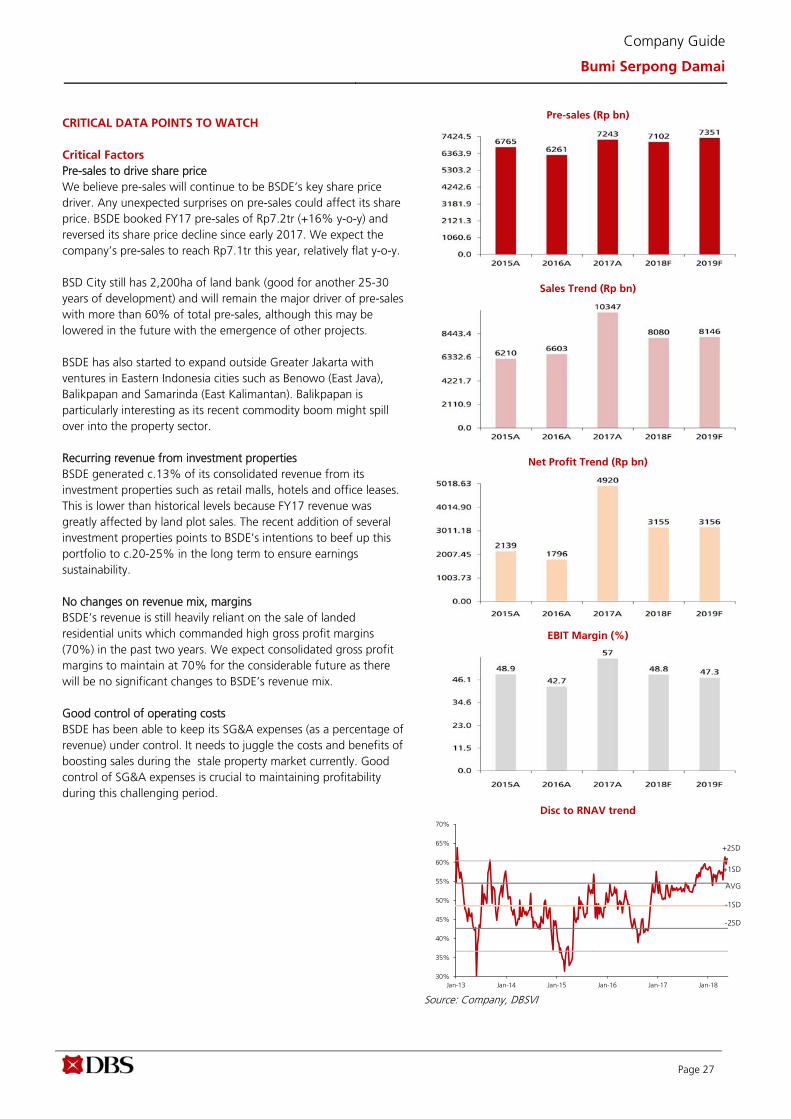
Pre-sales to drive share price We believe pre-sales will continue to be BSDE’s key share price driver. Any unexpected surprises on pre-sales could affect its share price. BSDE booked FY17 pre-sales of Rp7.2tr (+16% y-o-y) and reversed its share price decline since early 2017. We expect the company’s pre-sales to reach Rp7.1tr this year, relatively flat y-o-y. BSD City still has 2,200ha of land bank (good for another 25-30 years of development) and will remain the major driver of pre-sales with more than 60% of total pre-sales, although this may be lowered in the future with the emergence of other projects. BSDE has also started to expand outside Greater Jakarta with ventures in Eastern Indonesia cities such as Benowo (East Java), Balikpapan and Samarinda (East Kalimantan). Balikpapan is particularly interesting as its recent commodity boom might spill over into the property sector. Recurring revenue from investment properties BSDE generated c.13% of its consolidated revenue from its investment properties such as retail malls, hotels and office leases. This is lower than historical levels because FY17 revenue was greatly affected by land plot sales. The recent addition of several investment properties points to BSDE’s intentions to beef up this portfolio to c.20-25% in the long term to ensure earnings sustainability. No changes on revenue mix, margins BSDE’s revenue is still heavily reliant on the sale of landed residential units which commanded high gross profit margins (70%) in the past two years. We expect consolidated gross profit margins to maintain at 70% for the considerable future as there will be no significant changes to BSDE’s revenue mix. Good control of operating costs BSDE has been able to keep its SG&A expenses (as a percentage of revenue) under control. It needs to juggle the costs and benefits of boosting sales during the stale property market currently. Good control of SG&A expenses is crucial to maintaining profitability during this challenging period.
Pre-sales (Rp bn)
Sales Trend (Rp bn)
Net Profit Trend (Rp bn)
EBIT Margin (%)
Disc to RNAV trend
Source: Company, DBSVI
30%
35%
40%
45%
50%
55%
60%
65%
70%
Jan-13 Jan-14 Jan-15 Jan-16 Jan-17 Jan-18
+2SD
+1SD
-2SD
-1SD
AVG
Page 28
Company Guide
Bumi Serpong Damai
0
2
4
6
8
10
12
14
16
0
500
1000
1500
2000
2500
Jan‐09 Jan‐10 Jan‐11 Jan‐12 Jan‐13 Jan‐14 Jan‐15 Jan‐16 Jan‐17
Share Price BSD land price (Rp m psm)
Accelerated land price appreciation in BSD City followed by share price movement
Land price appreciation moderated, share price is expected to follow the trend
0
1000
2000
3000
4000
5000
6000
7000
8000
9000
0
500
1000
1500
2000
2500
Jan‐09 Jan‐10 Jan‐11 Jan‐12 Jan‐13 Jan‐14 Jan‐15 Jan‐16 Jan‐17
Share Price Marketing Sales (Rp bn)
Marketing sales increased exponentially (CAGR 31%) -share price increase accordingly
Marketing sales flatten
Share price is supported frommarketing salesimprovement
Deviation from TaxAmnestyprogram
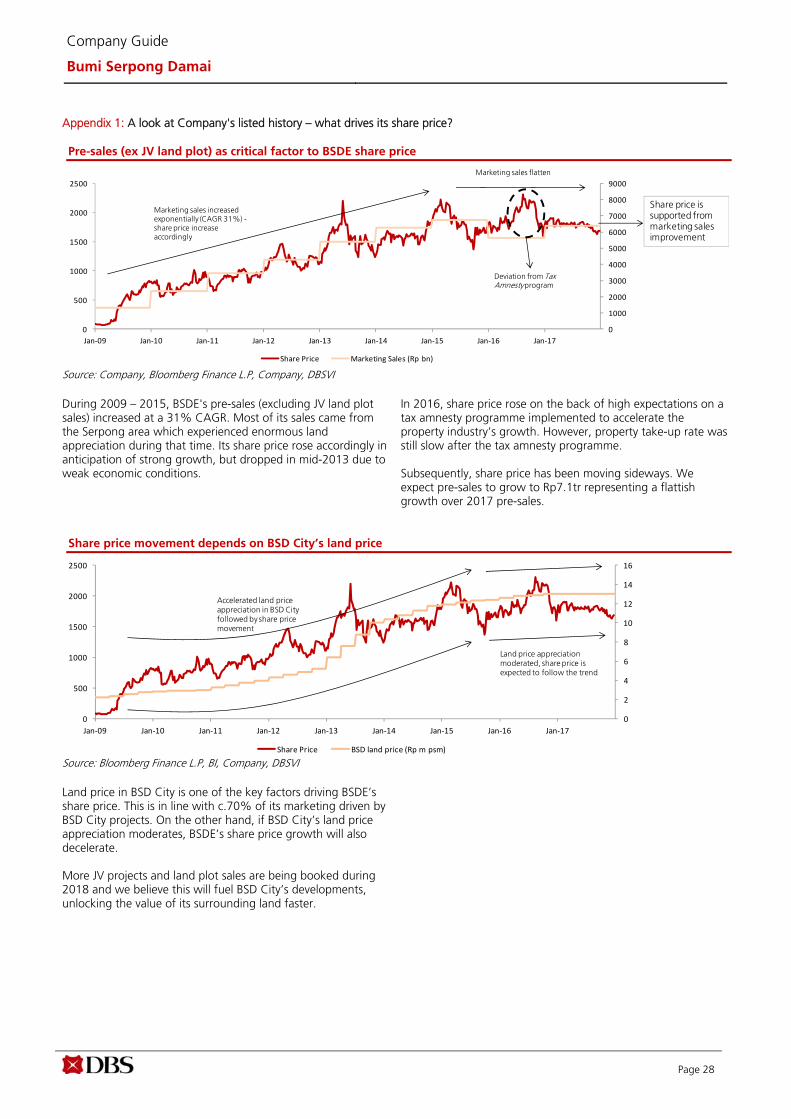
Appendix 1: A look at Company's listed history – what drives its share price? Pre-sales (ex JV land plot) as critical factor to BSDE share price
Source: Company, Bloomberg Finance L.P, Company, DBSVI During 2009 – 2015, BSDE's pre-sales (excluding JV land plot sales) increased at a 31% CAGR. Most of its sales came from the Serpong area which experienced enormous land appreciation during that time. Its share price rose accordingly in anticipation of strong growth, but dropped in mid-2013 due to weak economic conditions.
In 2016, share price rose on the back of high expectations on a tax amnesty programme implemented to accelerate the property industry’s growth. However, property take-up rate was still slow after the tax amnesty programme. Subsequently, share price has been moving sideways. We expect pre-sales to grow to Rp7.1tr representing a flattish growth over 2017 pre-sales.
Share price movement depends on BSD City’s land price
Source: Bloomberg Finance L.P, BI, Company, DBSVI Land price in BSD City is one of the key factors driving BSDE’s share price. This is in line with c.70% of its marketing driven by BSD City projects. On the other hand, if BSD City’s land price appreciation moderates, BSDE’s share price growth will also decelerate. More JV projects and land plot sales are being booked during 2018 and we believe this will fuel BSD City’s developments, unlocking the value of its surrounding land faster.
Page 29
Company Guide
Bumi Serpong Damai
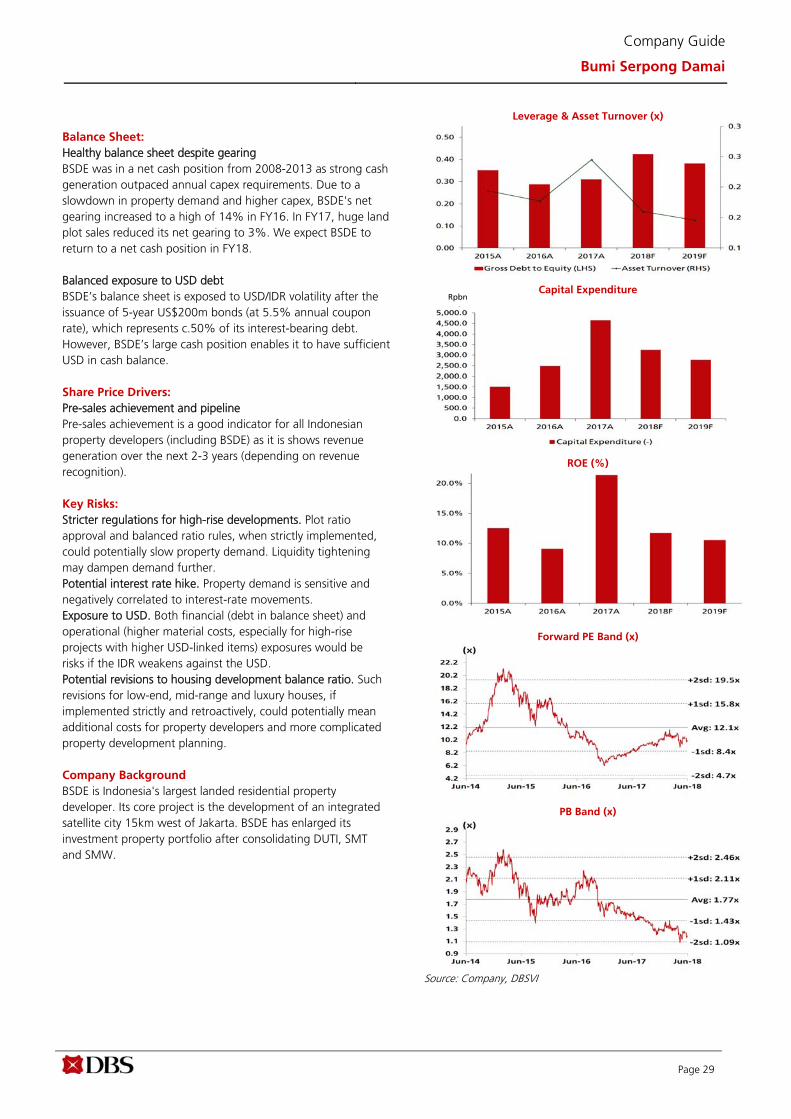
Balance Sheet:
Healthy balance sheet despite gearing BSDE was in a net cash position from 2008-2013 as strong cash generation outpaced annual capex requirements. Due to a slowdown in property demand and higher capex, BSDE's net gearing increased to a high of 14% in FY16. In FY17, huge land plot sales reduced its net gearing to 3%. We expect BSDE to return to a net cash position in FY18. Balanced exposure to USD debt BSDE’s balance sheet is exposed to USD/IDR volatility after the issuance of 5-year US$200m bonds (at 5.5% annual coupon rate), which represents c.50% of its interest-bearing debt. However, BSDE’s large cash position enables it to have sufficient USD in cash balance. Share Price Drivers:
Pre-sales achievement and pipeline Pre-sales achievement is a good indicator for all Indonesian property developers (including BSDE) as it is shows revenue generation over the next 2-3 years (depending on revenue recognition). Key Risks:
Stricter regulations for high-rise developments. Plot ratio approval and balanced ratio rules, when strictly implemented, could potentially slow property demand. Liquidity tightening may dampen demand further. Potential interest rate hike. Property demand is sensitive and negatively correlated to interest-rate movements. Exposure to USD. Both financial (debt in balance sheet) and operational (higher material costs, especially for high-rise projects with higher USD-linked items) exposures would be risks if the IDR weakens against the USD. Potential revisions to housing development balance ratio. Such revisions for low-end, mid-range and luxury houses, if implemented strictly and retroactively, could potentially mean additional costs for property developers and more complicated property development planning. Company Background
BSDE is Indonesia's largest landed residential property developer. Its core project is the development of an integrated satellite city 15km west of Jakarta. BSDE has enlarged its investment property portfolio after consolidating DUTI, SMT and SMW.
Leverage & Asset Turnover (x)
Capital Expenditure
ROE (%)
Forward PE Band (x)
PB Band (x)
Source: Company, DBSVI
Rpbn
Page 30
Company Guide
Bumi Serpong Damai
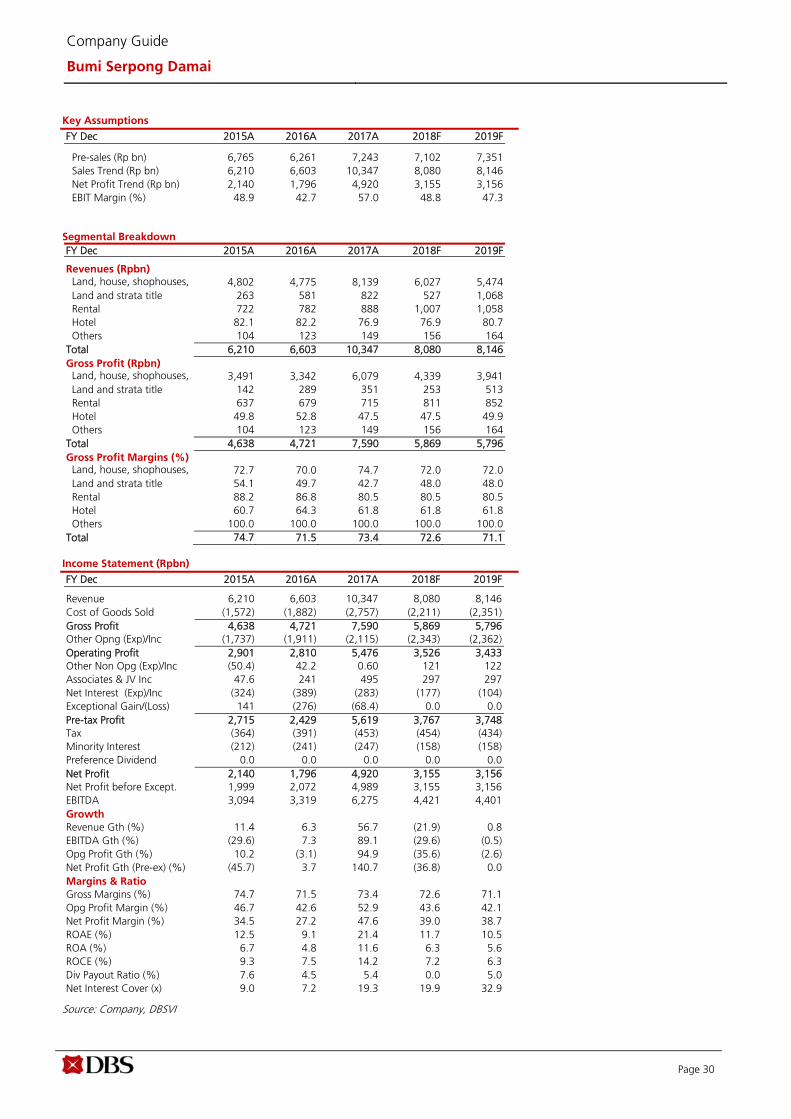
Key Assumptions
FY Dec 2015A 2016A 2017A 2018F 2019F Pre-sales (Rp bn) 6,765 6,261 7,243 7,102 7,351 Sales Trend (Rp bn) 6,210 6,603 10,347 8,080 8,146 Net Profit Trend (Rp bn) 2,140 1,796 4,920 3,155 3,156 EBIT Margin (%) 48.9 42.7 57.0 48.8 47.3
Segmental Breakdown
FY Dec 2015A 2016A 2017A 2018F 2019F Revenues (Rpbn) Land, house, shophouses, 4,802 4,775 8,139 6,027 5,474 Land and strata title 263 581 822 527 1,068 Rental 722 782 888 1,007 1,058 Hotel 82.1 82.2 76.9 76.9 80.7 Others 104 123 149 156 164 Total 6,210 6,603 10,347 8,080 8,146 Gross Profit (Rpbn) Land, house, shophouses, 3,491 3,342 6,079 4,339 3,941 Land and strata title 142 289 351 253 513 Rental 637 679 715 811 852 Hotel 49.8 52.8 47.5 47.5 49.9 Others 104 123 149 156 164 Total 4,638 4,721 7,590 5,869 5,796 Gross Profit Margins (%) Land, house, shophouses, 72.7 70.0 74.7 72.0 72.0 Land and strata title 54.1 49.7 42.7 48.0 48.0 Rental 88.2 86.8 80.5 80.5 80.5 Hotel 60.7 64.3 61.8 61.8 61.8 Others 100.0 100.0 100.0 100.0 100.0 Total 74.7 71.5 73.4 72.6 71.1
Income Statement (Rpbn)
FY Dec 2015A 2016A 2017A 2018F 2019F Revenue 6,210 6,603 10,347 8,080 8,146 Cost of Goods Sold (1,572) (1,882) (2,757) (2,211) (2,351) Gross Profit 4,638 4,721 7,590 5,869 5,796 Other Opng (Exp)/Inc (1,737) (1,911) (2,115) (2,343) (2,362) Operating Profit 2,901 2,810 5,476 3,526 3,433 Other Non Opg (Exp)/Inc (50.4) 42.2 0.60 121 122 Associates & JV Inc 47.6 241 495 297 297 Net Interest (Exp)/Inc (324) (389) (283) (177) (104) Exceptional Gain/(Loss) 141 (276) (68.4) 0.0 0.0 Pre-tax Profit 2,715 2,429 5,619 3,767 3,748 Tax (364) (391) (453) (454) (434) Minority Interest (212) (241) (247) (158) (158) Preference Dividend 0.0 0.0 0.0 0.0 0.0 Net Profit 2,140 1,796 4,920 3,155 3,156 Net Profit before Except. 1,999 2,072 4,989 3,155 3,156 EBITDA 3,094 3,319 6,275 4,421 4,401 Growth Revenue Gth (%) 11.4 6.3 56.7 (21.9) 0.8 EBITDA Gth (%) (29.6) 7.3 89.1 (29.6) (0.5) Opg Profit Gth (%) 10.2 (3.1) 94.9 (35.6) (2.6) Net Profit Gth (Pre-ex) (%) (45.7) 3.7 140.7 (36.8) 0.0 Margins & Ratio Gross Margins (%) 74.7 71.5 73.4 72.6 71.1 Opg Profit Margin (%) 46.7 42.6 52.9 43.6 42.1 Net Profit Margin (%) 34.5 27.2 47.6 39.0 38.7 ROAE (%) 12.5 9.1 21.4 11.7 10.5 ROA (%) 6.7 4.8 11.6 6.3 5.6 ROCE (%) 9.3 7.5 14.2 7.2 6.3 Div Payout Ratio (%) 7.6 4.5 5.4 0.0 5.0 Net Interest Cover (x) 9.0 7.2 19.3 19.9 32.9
Source: Company, DBSVI
Page 31
Company Guide
Bumi Serpong Damai
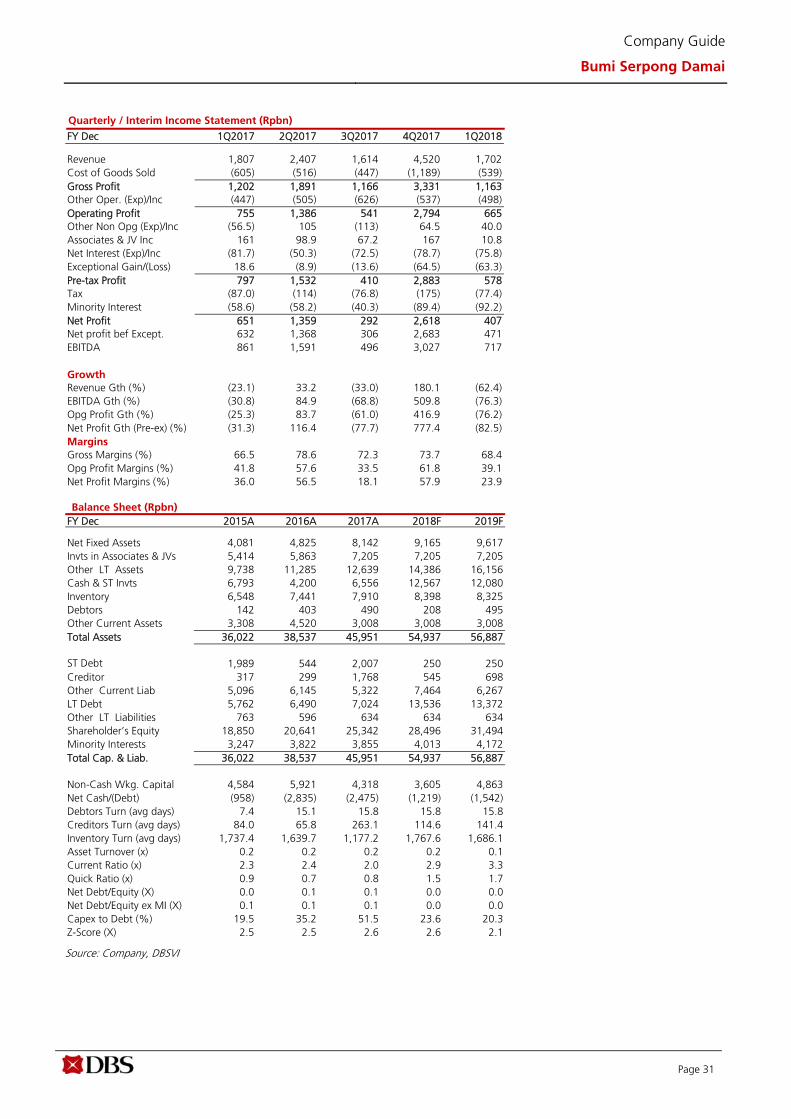
Quarterly / Interim Income Statement (Rpbn)
FY Dec 1Q2017 2Q2017 3Q2017 4Q2017 1Q2018 Revenue 1,807 2,407 1,614 4,520 1,702 Cost of Goods Sold (605) (516) (447) (1,189) (539) Gross Profit 1,202 1,891 1,166 3,331 1,163 Other Oper. (Exp)/Inc (447) (505) (626) (537) (498) Operating Profit 755 1,386 541 2,794 665 Other Non Opg (Exp)/Inc (56.5) 105 (113) 64.5 40.0 Associates & JV Inc 161 98.9 67.2 167 10.8 Net Interest (Exp)/Inc (81.7) (50.3) (72.5) (78.7) (75.8) Exceptional Gain/(Loss) 18.6 (8.9) (13.6) (64.5) (63.3) Pre-tax Profit 797 1,532 410 2,883 578 Tax (87.0) (114) (76.8) (175) (77.4) Minority Interest (58.6) (58.2) (40.3) (89.4) (92.2) Net Profit 651 1,359 292 2,618 407 Net profit bef Except. 632 1,368 306 2,683 471 EBITDA 861 1,591 496 3,027 717 Growth Revenue Gth (%) (23.1) 33.2 (33.0) 180.1 (62.4) EBITDA Gth (%) (30.8) 84.9 (68.8) 509.8 (76.3) Opg Profit Gth (%) (25.3) 83.7 (61.0) 416.9 (76.2) Net Profit Gth (Pre-ex) (%) (31.3) 116.4 (77.7) 777.4 (82.5) Margins Gross Margins (%) 66.5 78.6 72.3 73.7 68.4 Opg Profit Margins (%) 41.8 57.6 33.5 61.8 39.1 Net Profit Margins (%) 36.0 56.5 18.1 57.9 23.9
Balance Sheet (Rpbn)
FY Dec 2015A 2016A 2017A 2018F 2019F Net Fixed Assets 4,081 4,825 8,142 9,165 9,617 Invts in Associates & JVs 5,414 5,863 7,205 7,205 7,205 Other LT Assets 9,738 11,285 12,639 14,386 16,156 Cash & ST Invts 6,793 4,200 6,556 12,567 12,080 Inventory 6,548 7,441 7,910 8,398 8,325 Debtors 142 403 490 208 495 Other Current Assets 3,308 4,520 3,008 3,008 3,008 Total Assets 36,022 38,537 45,951 54,937 56,887 ST Debt 1,989 544 2,007 250 250 Creditor 317 299 1,768 545 698 Other Current Liab 5,096 6,145 5,322 7,464 6,267 LT Debt 5,762 6,490 7,024 13,536 13,372 Other LT Liabilities 763 596 634 634 634 Shareholder’s Equity 18,850 20,641 25,342 28,496 31,494 Minority Interests 3,247 3,822 3,855 4,013 4,172 Total Cap. & Liab. 36,022 38,537 45,951 54,937 56,887 Non-Cash Wkg. Capital 4,584 5,921 4,318 3,605 4,863 Net Cash/(Debt) (958) (2,835) (2,475) (1,219) (1,542) Debtors Turn (avg days) 7.4 15.1 15.8 15.8 15.8 Creditors Turn (avg days) 84.0 65.8 263.1 114.6 141.4 Inventory Turn (avg days) 1,737.4 1,639.7 1,177.2 1,767.6 1,686.1 Asset Turnover (x) 0.2 0.2 0.2 0.2 0.1 Current Ratio (x) 2.3 2.4 2.0 2.9 3.3 Quick Ratio (x) 0.9 0.7 0.8 1.5 1.7 Net Debt/Equity (X) 0.0 0.1 0.1 0.0 0.0 Net Debt/Equity ex MI (X) 0.1 0.1 0.1 0.0 0.0 Capex to Debt (%) 19.5 35.2 51.5 23.6 20.3 Z-Score (X) 2.5 2.5 2.6 2.6 2.1
Source: Company, DBSVI

Page 32
Company Guide
Bumi Serpong Damai
Cash Flow Statement (Rpbn)
FY Dec 2015A 2016A 2017A 2018F 2019F Pre-Tax Profit 2,715 2,429 5,619 3,767 3,748 Dep. & Amort. 196 225 304 477 549 Tax Paid (364) (391) (453) (454) (434) Assoc. & JV Inc/(loss) (47.6) (241) (495) (297) (297) Chg in Wkg.Cap. (1,621) (1,336) 1,602 713 (1,257) Other Operating CF (249) (257) (315) (158) (158) Net Operating CF 678 670 6,759 4,345 2,447 Capital Exp.(net) (1,510) (2,473) (4,648) (3,247) (2,770) Other Invts.(net) 0.0 0.0 0.0 0.0 0.0 Invts in Assoc. & JV (611) (449) (1,342) 0.0 0.0 Div from Assoc & JV 156 575 33.8 158 158 Other Investing CF (440) (210) (291) 0.0 0.0 Net Investing CF (2,405) (2,558) (6,247) (3,089) (2,612) Div Paid (289) (96.2) (96.2) 0.0 (158) Chg in Gross Debt 3,493 (716) 1,997 4,755 (164) Capital Issues 1,771 11.9 21.0 0.0 0.0 Other Financing CF (117) 94.7 (76.3) 0.0 0.0 Net Financing CF 4,858 (705) 1,845 4,755 (321) Currency Adjustments 0.0 0.0 0.0 0.0 0.0 Chg in Cash 3,130 (2,593) 2,357 6,010 (487) Opg CFPS (Rp) 119 104 268 189 192 Free CFPS (Rp) (43.3) (93.7) 110 57.0 (16.8)
Source: Company, DBSVI
Target Price & Ratings History
Source: DBSVI
Analyst: Victor STEFANO
Industry Focus
Page 33
DBSVI recommendations are based an Absolute Total Return* Rating system, defined as follows:
STRONG BUY (>20% total return over the next 3 months, with identifiable share price catalysts within this time frame)
BUY (>15% total return over the next 12 months for small caps, >10% for large caps)
HOLD (-10% to +15% total return over the next 12 months for small caps, -10% to +10% for large caps)
FULLY VALUED (negative total return i.e. > -10% over the next 12 months)
SELL (negative total return of > -20% over the next 3 months, with identifiable catalysts within this time frame)
Share price appreciation + dividends Completed Date: 28 Jun 2018 16:22:48 (WIB) Dissemination Date: 28 Jun 2018 17:23:49 (WIB)
Sources for all charts and tables are DBSVI unless otherwise specified.
GENERAL DISCLOSURE/DISCLAIMER
This report is prepared by PT DBS Vickers Sekuritas Indonesia (''DBSVI''). This report is solely intended for the clients of DBS Bank Ltd, its respective
connected and associated corporations and affiliates only and no part of this document may be (i) copied, photocopied or duplicated in any form
or by any means or (ii) redistributed without the prior written consent of PT DBS Vickers Sekuritas Indonesia (''DBSVI'').
The research set out in this report is based on information obtained from sources believed to be reliable, but we (which collectively refers to DBS
Bank Ltd, its respective connected and associated corporations, affiliates and their respective directors, officers, employees and agents (collectively,
the “DBS Group”) have not conducted due diligence on any of the companies, verified any information or sources or taken into account any other
factors which we may consider to be relevant or appropriate in preparing the research. Accordingly, we do not make any representation or
warranty as to the accuracy, completeness or correctness of the research set out in this report. Opinions expressed are subject to change without
notice. This research is prepared for general circulation. Any recommendation contained in this document does not have regard to the specific
investment objectives, financial situation and the particular needs of any specific addressee. This document is for the information of addressees
only and is not to be taken in substitution for the exercise of judgement by addressees, who should obtain separate independent legal or financial
advice. The DBS Group accepts no liability whatsoever for any direct, indirect and/or consequential loss (including any claims for loss of profit)
arising from any use of and/or reliance upon this document and/or further communication given in relation to this document. This document is not
to be construed as an offer or a solicitation of an offer to buy or sell any securities. The DBS Group, along with its affiliates and/or persons
associated with any of them may from time to time have interests in the securities mentioned in this document. The DBS Group, may have
positions in, and may effect transactions in securities mentioned herein and may also perform or seek to perform broking, investment banking and
other banking services for these companies.
Any valuations, opinions, estimates, forecasts, ratings or risk assessments herein constitutes a judgment as of the date of this report, and there can
be no assurance that future results or events will be consistent with any such valuations, opinions, estimates, forecasts, ratings or risk assessments.
The information in this document is subject to change without notice, its accuracy is not guaranteed, it may be incomplete or condensed, it may
not contain all material information concerning the company (or companies) referred to in this report and the DBS Group is under no obligation to
update the information in this report.
This publication has not been reviewed or authorized by any regulatory authority in Singapore, Hong Kong or elsewhere. There is no planned
schedule or frequency for updating research publication relating to any issuer.
The valuations, opinions, estimates, forecasts, ratings or risk assessments described in this report were based upon a number of estimates and
assumptions and are inherently subject to significant uncertainties and contingencies. It can be expected that one or more of the estimates on
which the valuations, opinions, estimates, forecasts, ratings or risk assessments were based will not materialize or will vary significantly from actual
results. Therefore, the inclusion of the valuations, opinions, estimates, forecasts, ratings or risk assessments described herein IS NOT TO BE RELIED
UPON as a representation and/or warranty by the DBS Group (and/or any persons associated with the aforesaid entities), that:
(a) such valuations, opinions, estimates, forecasts, ratings or risk assessments or their underlying assumptions will be achieved, and
(b) there is any assurance that future results or events will be consistent with any such valuations, opinions, estimates, forecasts, ratings or risk
assessments stated therein.
Please contact the primary analyst for valuation methodologies and assumptions associated with the covered companies or price targets.
Any assumptions made in this report that refers to commodities, are for the purposes of making forecasts for the company (or companies)
mentioned herein. They are not to be construed as recommendations to trade in the physical commodity or in the futures contract relating to the
commodity referred to in this report.
Industry Focus
Page 34
DBSVUSA, a US-registered broker-dealer, does not have its own investment banking or research department, has not participated in any public
offering of securities as a manager or co-manager or in any other investment banking transaction in the past twelve months and does not engage
in market-making.
ANALYST CERTIFICATION
The research analyst(s) primarily responsible for the content of this research report, in part or in whole, certifies that the views about the
companies and their securities expressed in this report accurately reflect his/her personal views. The analyst(s) also certifies that no part of his/her
compensation was, is, or will be, directly or indirectly, related to specific recommendations or views expressed in the report. The research analyst (s)
primarily responsible for the content of this research report, in part or in whole, certifies that he or his associate1 does not serve as an officer of the
issuer or the new listing applicant (which includes in the case of a real estate investment trust, an officer of the management company of the real
estate investment trust; and in the case of any other entity, an officer or its equivalent counterparty of the entity who is responsible for the
management of the issuer or the new listing applicant) and the research analyst(s) primarily responsible for the content of this research report or
his associate does not have financial interests2 in relation to an issuer or a new listing applicant that the analyst reviews. DBS Group has
procedures in place to eliminate, avoid and manage any potential conflicts of interests that may arise in connection with the production of
research reports. The research analyst(s) responsible for this report operates as part of a separate and independent team to the investment
banking function of the DBS Group and procedures are in place to ensure that confidential information held by either the research or investment
banking function is handled appropriately. There is no direct link of DBS Group's compensation to any specific investment banking function of the
DBS Group.
COMPANY-SPECIFIC / REGULATORY DISCLOSURES
1. DBS Bank Ltd, DBS HK, DBS Vickers Securities (Singapore) Pte Ltd (''DBSVS''), DBSV HK or their subsidiaries and/or other affiliates have a
proprietary position in Bumi Serpong Damai recommended in this report as of 31 May 2018.
2. Neither DBS Bank Ltd, DBS HK nor DBSV HK market makes in equity securities of the issuer(s) or company(ies) mentioned in this Research
Report.
Compensation for investment banking services:
3. DBS Bank Ltd., DBSVS, their subsidiaries and/or other affiliates of DBSVUSA have received compensation, within the past 12 months for
investment banking services from Ciputra Development as of 31 May 2018.
4. BS Bank Ltd., DBSVS, their subsidiaries and/or other affiliates of DBSVUSA have managed or co-managed a public offering of securities for
Ciputra Development in the past 12 months, as of 31 May 2018.
5. DBSVUSA does not have its own investment banking or research department, nor has it participated in any public offering of securities as a
manager or co-manager or in any other investment banking transaction in the past twelve months. Any US persons wishing to obtain further
information, including any clarification on disclosures in this disclaimer, or to effect a transaction in any security discussed in this document
should contact DBSVUSA exclusively.
Disclosure of previous investment recommendation produced:
6. DBS Bank Ltd, DBS Vickers Securities (Singapore) Pte Ltd (''DBSVS''), their subsidiaries and/or other affiliates may have published other
investment recommendations in respect of the same securities / instruments recommended in this research report during the preceding 12
months. Please contact the primary analyst listed in the first page of this report to view previous investment recommendations published by
DBS Bank Ltd, DBS Vickers Securities (Singapore) Pte Ltd (''DBSVS''), their subsidiaries and/or other affiliates in the preceding 12 months.
1 An associate is defined as (i) the spouse, or any minor child (natural or adopted) or minor step-child, of the analyst; (ii) the trustee of a trust of which the analyst, his
spouse, minor child (natural or adopted) or minor step-child, is a beneficiary or discretionary object; or (iii) another person accustomed or obliged to act in accordance with the directions or instructions of the analyst.
2 Financial interest is defined as interests that are commonly known financial interest, such as investment in the securities in respect of an issuer or a new listing applicant, or financial accommodation arrangement between the issuer or the new listing applicant and the firm or analysis. This term does not include commercial lending conducted at arm's length, or investments in any collective investment scheme other than an issuer or new listing applicant notwithstanding the fact that the scheme has investments in securities in respect of an issuer or a new listing applicant.

Industry Focus
Page 35
RESTRICTIONS ON DISTRIBUTION
General This report is not directed to, or intended for distribution to or use by, any person or entity who is a citizen or resident of or located in any locality, state, country or other jurisdiction where such distribution, publication, availability or use would be contrary to law or regulation.
Australia This report is being distributed in Australia by DBS Bank Ltd. (“DBS”) or DBS Vickers Securities (Singapore) Pte Ltd (“DBSVS”). DBS holds Australian Financial Services Licence no. 475946. DBSVS is exempted from the requirement to hold an Australian Financial Services Licence under the Corporation Act 2001 (“CA”) in respect of financial services provided to the recipients. DBSVS is regulated by the Monetary Authority of Singapore under the laws of Singapore, which differ from Australian laws. Distribution of this report is intended only for “wholesale investors” within the meaning of the CA.
Hong Kong This report has been prepared by an entity(ies) which is not licensed by the Hong Kong Securities and Futures Commission to carry on the regulated activity of advising on securities pursuant to the Securities and Futures Ordinance (Chapter 571 of the Laws of Hong Kong). This report is being distributed in Hong Kong and is attributable to DBS Vickers Hong Kong Limited, a licensed corporation licensed by the Hong Kong Securities and Futures Commission to carry on the regulated activity of advising on securities pursuant to the Securities and Futures Ordinance (Chapter 571 of the Laws of Hong Kong).
For any query regarding the materials herein, please contact Paul Yong (CE. No. ASE988) at [email protected].
Indonesia This report is being distributed in Indonesia by PT DBS Vickers Sekuritas Indonesia.
Malaysia This report is distributed in Malaysia by AllianceDBS Research Sdn Bhd ("ADBSR"). Recipients of this report, received from ADBSR are to contact the undersigned at 603-2604 3333 in respect of any matters arising from or in connection with this report. In addition to the General Disclosure/Disclaimer found at the preceding page, recipients of this report are advised that ADBSR (the preparer of this report), its holding company Alliance Investment Bank Berhad, their respective connected and associated corporations, affiliates, their directors, officers, employees, agents and parties related or associated with any of them may have positions in, and may effect transactions in the securities mentioned herein and may also perform or seek to perform broking, investment banking/corporate advisory and other services for the subject companies. They may also have received compensation and/or seek to obtain compensation for broking, investment banking/corporate advisory and other services from the subject companies.
Wong Ming Tek, Executive Director, ADBSR
Singapore This report is distributed in Singapore by DBS Bank Ltd (Company Regn. No. 196800306E) or DBSVS (Company Regn No.
198600294G), both of which are Exempt Financial Advisers as defined in the Financial Advisers Act and regulated by the Monetary Authority of Singapore. DBS Bank Ltd and/or DBSVS, may distribute reports produced by its respective foreign entities, affiliates or other foreign research houses pursuant to an arrangement under Regulation 32C of the Financial Advisers Regulations. Where the report is distributed in Singapore to a person who is not an Accredited Investor, Expert Investor or an Institutional Investor, DBS Bank Ltd accepts legal responsibility for the contents of the report to such persons only to the extent required by law. Singapore recipients should contact DBS Bank Ltd at 6327 2288 for matters arising from, or in connection with the report.
Thailand This report is being distributed in Thailand by DBS Vickers Securities (Thailand) Co Ltd.
Industry Focus
Page 36
United Kingdom
This report is produced by PT DBS Vickers Sekuritas Indonesia which is regulated by the Otoritas Jasa Keuangan (OJK). This report is disseminated in the United Kingdom by DBS Vickers Securities (UK) Ltd, ("DBSVUK"). DBSVUK is authorised and regulated by the Financial Conduct Authority in the United Kingdom. In respect of the United Kingdom, this report is solely intended for the clients of DBSVUK, its respective connected and associated corporations and affiliates only and no part of this document may be (i) copied, photocopied or duplicated in any form or by any means or (ii) redistributed without the prior written consent of DBSVUK. This communication is directed at persons having professional experience in matters relating to investments. Any investment activity following from this communication will only be engaged in with such persons. Persons who do not have professional experience in matters relating to investments should not rely on this communication.
Dubai International Financial Centre
This research report is being distributed by DBS Bank Ltd., (DIFC Branch) having its office at PO Box 506538, 3rd Floor, Building 3, East Wing, Gate Precinct, Dubai International Financial Centre (DIFC), Dubai, United Arab Emirates. DBS Bank Ltd., (DIFC Branch) is regulated by The Dubai Financial Services Authority. This research report is intended only for professional clients (as defined in the DFSA rulebook) and no other person may act upon it.
United Arab Emirates
This report is provided by DBS Bank Ltd (Company Regn. No. 196800306E) which is an Exempt Financial Adviser as defined in the Financial Advisers Act and regulated by the Monetary Authority of Singapore. This report is for information purposes only and should not be relied upon or acted on by the recipient or considered as a solicitation or inducement to buy or sell any financial product. It does not constitute a personal recommendation or take into account the particular investment objectives, financial situation, or needs of individual clients. You should contact your relationship manager or investment adviser if you need advice on the merits of buying, selling or holding a particular investment. You should note that the information in this report may be out of date and it is not represented or warranted to be accurate, timely or complete. This report or any portion thereof may not be reprinted, sold or redistributed without our written consent.
United States This report was prepared by PT DBS Vickers Sekuritas Indonesia (''DBSVI''). DBSVUSA did not participate in its preparation. The research analyst(s) named on this report are not registered as research analysts with FINRA and are not associated persons of DBSVUSA. The research analyst(s) are not subject to FINRA Rule 2241 restrictions on analyst compensation, communications with a subject company, public appearances and trading securities held by a research analyst. This report is being distributed in the United States by DBSVUSA, which accepts responsibility for its contents. This report may only be distributed to Major U.S. Institutional Investors (as defined in SEC Rule 15a-6) and to such other institutional investors and qualified persons as DBSVUSA may authorize. Any U.S. person receiving this report who wishes to effect transactions in any securities referred to herein should contact DBSVUSA directly and not its affiliate.
Other jurisdictions
In any other jurisdictions, except if otherwise restricted by laws or regulations, this report is intended only for qualified, professional, institutional or sophisticated investors as defined in the laws and regulations of such jurisdictions.
Industry Focus
Page 37
DBS Regional Research Offices HONG KONG DBS Vickers (Hong Kong) Ltd Contact: Paul Yong 18th Floor Man Yee Building 68 Des Voeux Road Central Central, Hong Kong Tel: 65 6878 8888 Fax: 65 65353 418 e-mail: [email protected] Participant of the Stock Exchange of Hong Kong
MALAYSIA AllianceDBS Research Sdn Bhd Contact: Wong Ming Tek (128540 U) 19th Floor, Menara Multi-Purpose, Capital Square, 8 Jalan Munshi Abdullah 50100 Kuala Lumpur, Malaysia. Tel.: 603 2604 3333 Fax: 603 2604 3921 e-mail: [email protected]
SINGAPORE DBS Bank Ltd Contact: Janice Chua 12 Marina Boulevard, Marina Bay Financial Centre Tower 3 Singapore 018982 Tel: 65 6878 8888 Fax: 65 65353 418 e-mail: [email protected] Company Regn. No. 196800306E
INDONESIA PT DBS Vickers Sekuritas (Indonesia) Contact: Maynard Priajaya Arif DBS Bank Tower Ciputra World 1, 32/F Jl. Prof. Dr. Satrio Kav. 3-5 Jakarta 12940, Indonesia Tel: 62 21 3003 4900 Fax: 6221 3003 4943 e-mail: [email protected]
THAILAND DBS Vickers Securities (Thailand) Co Ltd Contact: Chanpen Sirithanarattanakul 989 Siam Piwat Tower Building, 9th, 14th-15th Floor Rama 1 Road, Pathumwan, Bangkok Thailand 10330 Tel. 66 2 857 7831 Fax: 66 2 658 1269 e-mail: [email protected] Company Regn. No 0105539127012 Securities and Exchange Commission, Thailand