indonesia industry focus indonesian multi-finance … the auto penetration ... other developing...
TRANSCRIPT

ed-CK / sa- MA, PY
Bridging gaps with the under-banked Multi-finance companies are capillaries of the financial
system that channels funds to the unbankable population;
crucial to financial inclusion Fragmented industry with the largest player capturing 8%
of loan market share; most big players are backed by banks
or auto dealers Auto sales, the main driver of growth; multi-purpose
financing gaining popularity; leasing and factoring may
resurface with commodity prices recovering Undemanding valuations given high ROE in this high risk-
high return segment; BFIN is our preferred listed proxy;
stock liquidity is however limited
Proxy to the unbankable population. Indonesia has among the lowest bankable population in the world at 36% of the country’s adult population. The government’s push towards improving financial inclusion opens opportunities to the multi-finance companies which are able to meet the financing needs of the lower income households. These companies typically serve the non-banking population in Indonesia, providing them with access to financing. Execution and monitoring mechanisms are manual and labour intensive but have proven to be effective. The risk profiles of multi-finance companies are higher than banks but the returns are also more lucrative, judging from the well-managed multi-finance companies we have screened.
Consumer financing is its driving force; new avenues opening
up; potential M&A opportunities. While the multi-finance companies largely focus on consumer financing, the regulators are gradually opening more financing options. In 2014, Otoritas Jasa Keuangan (OJK) officially allowed multi-finance companies to finance multi-purpose loans, refinancing and infrastructure loans. Multi-finance companies used to see leasing for heavy equipment as a growth driver but that has since declined as commodities’ prices slumped three years ago. OJK is also working towards bridging the gap with banks in terms of regulations. We believe this move will gradually mitigate risks to the multi-finance companies as an investment option, and perhaps, also an avenue to consolidate the currently fragmented sector as well as potential M&A opportunities.
Recovery in commodity prices and auto sales a positive boost;
regulatory changes could add fuel to auto sales. Commodity prices have held up quite well to date and are expected to boost purchasing power in the near term. Receivable growth has also accelerated to +7.2% in February 2017 (vs -1% in January 2016). We expect the flow-through of this positive development to be gradual. The visible turnaround for the auto industry would bode better for the multi-finance companies. The relaxation of down payment rules should also add fuel to auto sales. We expect financing growth to recover to 8% in 2017, driven by auto financing.
BFIN is a good listed proxy; opportunities among the top 20
multi-finance companies. Selected listed multi-finance companies are attractive; BFIN (BUY, TP Rp5,000) is our pick. The main concern investors may have is the limited stock liquidity. We highlight ADMF, BCAF, and MTF, which are subsidiaries to banks, and ASDF (4W market leader) and FIF (2W market leader), which are Astra-related companies – these have strong parent companies. We believe they are opportunities among smaller multi-finance companies, both organic and inorganic, in this current operating environment.
JCI : 5,616.50
Analyst Sue Lin LIM +65 8332 6843 [email protected]
Benedictus Agung SWANDONO +6221 3003 4935 [email protected]
STOCKS/COMPANIES
* Not listed Source: DBS Bank, DBSVI, Bloomberg Finance L.P. Closing price as of 13 Apr 2017
Multi-finance companies: Market share of top 20 players
Note: Based on outstanding on balance sheet net receivables. Data represents 2015 numbers Source: Infobank, DBS Bank, DBSVI
Multi-finance companies: Financing activities y-o-y growth
Source: OJK, BI, DBSVI
8%7% 7% 7%
5%
4%
3%3% 3% 2% 2% 2% 2% 2% 2% 2% 1% 1% 1% 1%
0%
1%
2%
3%
4%
5%
6%
7%
8%
ASD
F
FIF
AD
MF
C.J
. Pow
er
Oto
M
TAFS
Dip
o S.
F
BFIN
Sum
mit
O.F
Man
diri
T.F
Indo
mob
il F,
I
Buss
an A
.F
CFI
N
BCA
F
CIM
B F.
Mits
ui L
easi
ng
Orix
I.F
Sury
a A
rtha
N.F
MPM
F.
WO
MF
26.4%
4.1%
31.0% 32.3%
23.1%
15.2%
5.2%
-0.8%
6.7%
-5%
0%
5%
10%
15%
20%
25%
30%
35%
-
50
100
150
200
250
300
350
400
450
2008 2009 2010 2011 2012 2013 2014 2015 2016Total Financing Financing growth y-o-y
Rp bn % growth
DBS Group Research . Equity 18 Apr 2017
Indonesia Industry Focus
Indonesian Multi-finance Companies
Refer to important disclosures at the end of this report
Price Mkt Cap Target Price
Performance (%)
Rp US$m Rp 3 mth 12 mth Rating
BFI Finance Ind (BFIN( 4,100 493 5,000 17.1 57.7 BUY Clipan Finance (CFIN) 298 89.4 300 15.5 13.7 HOLD Adira Dinamika Multifinance (ADMF) 6,625 471 Not Rated 4.0 105.0 N/A Astra Sedaya Finance (ASDF)* - - Not Listed N/A N/A N/A BCA Finance (BCAF)* - - Not Listed N/A N/A N/A Federal International Finance (FIF)* - - Not Listed N/A N/A N/A Mandiri Tunas Finance (MTF)* - - Not Listed N/A N/A N/A

Industry Focus
Page 2
Table of Contents
Investment Summary 3
Opportunities with the unbankable population 4
A. Financial inclusion, a key to growth 4
B. The multi-finance industry landscape 5
C. Prospects for the multi-finance industry 9
Key drivers to the multi-finance industry 11
A. Automotive industry 11
B. Leasing and heavy equipment 13
Key players and market position 15
A. 4-wheeler market 18
B. 2-wheeler market 19
Regulatory framework for multi-finance companies 20
Valuation and recommendation 23
A. Valuation tables 24
B. P/BV Bands 25
Company Guides 27
BFI Finance (BFIN) 28
Clipan Finance (CFIN) 36
Company Profiles (Non-rated) 44
Adira Dinamika Multifinance (ADMF) (Non-rated; Listed) 45
Astra Sedaya Finance (ASDF) (Non-rated; Not listed) 50
BCA Finance (BCAF) (Non-rated; Not listed) 55
Federal International Finance (FIF) (Non-rated; Not listed) 60
Mandiri Tunas Finance (MTF) (Non-rated; Not listed) 65

Industry Focus
Page 3
Investment Summary
Multi-finance companies – bridging gaps with the under-banked. Indonesia has among the lowest bankable population in the world at 35.9% of the country’s adult population. Banking with the unbankable population includes looking at instances in micro lending, especially in the rural areas. The initiation of the branchless banking agenda has addressed this to some extent. But beyond that, the need to further reach out to the unbankable population lies in the hands of the multi-finance companies which cover both urban and rural areas. The government’s push towards improving financial inclusion opens opportunities for the multi-finance companies which are able to meet the financing needs of the lower income households. Multi-finance companies are licensed to offer a range of services, including leasing, consumer financing (bulk of its business), credit card financing and factoring. But unlike banks, they are not allowed to accept deposits. Similar to banks, multi-finance companies are governed by Otoritas Jasa Keuangan (OJK), the regulatory arm of the Minister of Finance (MoF).
Turning optimistic; three critical factors to watch. We expect an improvement in financing demand in 2017. The Multi-finance Company Association (APPI/Asosiasi Perusahaan Pembiayaan Indonesia) recently announced its forecast of 10% financing growth for 2017 on the back of an improving economy and improved commodity price trends. We identified three critical factors that will drive multi-finance companies’ earnings in 2017: (1) lower credit cost, (2) higher NIM and better growth, and (3) well controlled expenses. Note that some multi-finance companies had to accelerate provisions as they had to change how NPLs were classified following stricter regulations to streamline recognition similar to the banks; this caused provisions to be higher in 2016. We expect NIM expansion in 2017 on the back of lower funding cost as the banks have started to price down their loans, which means multi-finance companies now enjoy lower funding costs via bank borrowings (one of the main sources of funding for multi-finance companies). Meanwhile, asset yields are expected to stay constant as the interest rates offered to the customers are not sensitive towards the change in interest rate environment. In addition, operating costs are expected to be flat as the companies have not been aggressive in expanding their service points.
Auto industry recovery, key driver for multi-finance companies’ growth. With consumer financing dominating the multi-finance companies’ loan portfolio, the auto industry would be the key growth driver. Leasing growth relies mainly on heavy equipment financing which in turn unfortunately is dependent on commodity prices. Both these segments have been in the doldrums in the past two years. The near-term exuberance for
commodity prices might not sustain throughout the year but we believe the positive impact should be gradually felt. We expect the auto industry to pick up in 2017, boosting the growth prospects of the multi-finance companies.
Long-term potential, especially for 4W. The auto penetration rate in Indonesia remains one of the lowest in the region. Based on data by Badan Pusat Statistik (BPS)/ Indonesian Statistics Centre and automotive association, in 2015 there are only 13.7m cars and 99m motorcycles outstanding on Indonesian roads (vs its population of 250m). The penetration rate for 4-wheeler vehicles (4W) is a mere 5%, lower than other developing countries like Malaysia and Thailand. However, 2-wheeler vehicles’ (2W) penetration is much higher at 40% in 2015.
Fragmented industry; obvious market leaders. There are a total of 201 multi-finance companies, with the top 20 companies commanding 65% (financing) market share. Each of them caters to its own niche by specialising in several categories such as products financed (4W, 2W, heavy equipment (HE), etc) and by geographical reach. Multi-finance companies are typically owned by banks (both domestic and foreign), brand-holding sole agents (Agen Tunggal Pemegang Merek, ATPM) of cars and foreign principals of car makers (e.g. Astra International), and a few which are family/individual-owned. The strong multi-finance companies are those affiliated to banks and ATPMs. The largest player, Astra Sedaya Finance (ASDF) has only 8% market share, marginally higher among the top 6 multi-finance companies, which indicates how fragmented the industry is.
Top players have better profitability metrics than banks. Compared to banks, multi-finance companies generate better returns. Generally, the major multi-finance players record higher ROE and ROA as the benefits of higher asset yield outweigh the negatives of higher cost of funds, operating cost, and credit cost. The higher asset yield is due to the ability to tap the unbankable market, an advantage that banks lack. But it requires heavy infrastructure and labour to tap into this market while its elevated credit cost is due to the higher risk profile of the customers compared to banks.
Opportunities among multi-finance companies. We believe they are opportunities among the multi-finance companies, both organic and inorganic, in this current operating environment. Among the listed players, our pick would be BFIN. Indirect plays would be via banks which own the larger multi-finance companies such as BCAF (100% owned by Bank Central Asia, BBCA) and ADMF (Bank Danamon, BDMN).

Industry Focus
Page 4
Opportunities with the unbankable population
Indonesia has among the lowest bankable population in the world at 35.9% of the country’s adult population. Banking with the unbankable population includes looking at instances in micro lending, especially in the rural areas. The initiation of the branchless banking agenda has addressed this to some extent. But beyond that, the need to further reach out to the unbankable population lies in the hands of the multi-finance companies which cover both urban and rural areas. The government’s push towards improving financial inclusion opens opportunities for the multi-finance companies which are able to meet the financing needs of the lower income households. A. Financial inclusion, a key to growth The state of financial inclusion in Indonesia: Indonesia has lagged behind other developing countries in terms of financial inclusion. A survey conducted by World Bank in 2014 indicated that only 36% of the adult population has a formal account in a financial institution. This is lower than the average of East Asia and Pacific countries (69%), average of lower middle- income countries (42%), and even ASEAN peers such as Thailand (78%). In terms of lending, the statistics is even less encouraging. Only 13% of the adult population borrowed from financial institutions. However it is quite surprising that 42% of these people prefer to borrow money from family or friends. This indicates that there are plenty of untapped markets for lending in Indonesia. Poor infrastructure and education are few reasons of why these markets remain isolated from the modern world. Indonesia: Banking penetration rate
*The numbers are as % of adult population (age 15+) Source: Little Data Book on Financial Inclusion 2015, DBS Bank, DBSVI
Indonesia: Many are excluded from the financial system
*The numbers are as % of adult population (age 15+) Source: Little Data Book on Financial Inclusion 2015, DBS Bank, DBSVI Who are the unbankable? Reaching out the unbankable has become a challenge mainly due to Indonesia’s unique geographical features and underdeveloped infrastructure. Furthermore, the potential businesses in these areas are too small for financial institutions to set up their branches. The operating cost to reach out to rural areas has outweighed the benefits due to the small-scale nature of such operations. Indonesia: Geographical and economic mapping
* Banking penetration defined as percentage of respondents reported to have an account at a financial institution Note: BRI – Bank Rakyat Indonesia (Indonesia People’s Bank), BPR – Bank Perkreditan Rakyat (People’s Credit Bank/rural banks), BKD – Badan Kredit Desa (Village Credit Board), LKBD – Lembaga Keuangan Bukan Bank (Non-bank Financial Fund) Source: KPMG
36%
69%
42%
78%
0%
10%
20%
30%
40%
50%
60%
70%
80%
90%
Indonesia East Asia & Pacfific
Lower Middle Income Countries
Thailand
% of adult population with financial insititution account
13%
42%
11%
28%
8%
33%
15%
31%
0%
5%
10%
15%
20%
25%
30%
35%
40%
45%
Borrowed from a financial institution
Borrowed from familiy or friends
Indonesia East Asia & Pacfific
Lower Middle Income Countries Thailand

Industry Focus
Page 5
Indonesia: Economic pyramid
Note: <USD1.9 a day, 96m people; USD 1.9-USD4.5, 107m people Source: World Bank, KPMG, DBS Bank, DBSVI Multi-finance companies are crucial proxies for financial inclusion: Multi-finance companies should be seen as the capillaries of financial system where it can channel stream of funds to the unbankable space in more remote areas. Their operations should not be viewed as ‘shadow banking’ as their existence fits well with the regulators’ intention to improve financial inclusion in the country. Since 2014, the government has allowed the multi-finance companies to disburse multi-purpose financing which provides a simple and fast underwriting process. As an anecdotal example, BFI Finance (BFIN) can underwrite multi-purpose financing over 1-2 days. A looser regulatory environment has enabled multi-finance companies to be more flexible. On the flipside, multi-finance companies are not allowed to gather deposits from customers and tend to draw funding from banks, either by bank borrowings, joint financing, or channelling. They can also issue bonds to gather larger chunks of financing. Multi-finance companies’ customers are not typical banking customers. Consumer financing customers are mostly in the lower income bracket and deemed unbankable by larger banks. These consumers may not have sufficient collateral, work in the informal sector, and may not have verifiable credit history. Some do not have proper documentation such as a tax identification (ID) card, which is needed to apply for a bank loan. The implied higher risk also means multi-finance companies are able to charge higher rates than banks. Cost is also higher as multi-finance companies typically need a larger network to remain close to its customer base. The business is also fairly labour intensive, especially for collections and sales. Service over pricing. Lower income customers are not sensitive towards interest rates charged on their loans as long as they
can cope with the monthly instalment. They prefer financing companies that provide fast approval and easy service. Auto-related loans dominate financing segments currently. Currently, consumer financing dominates c.70% of the total loan portfolio of multi-finance companies and this mainly involves auto-related financing. However, as the market for automotive financing becomes more saturated, we should see other form of financing such as multi-purpose financing, refinancing and also infrastructure loans gathering growth pace. Furthermore, the government has allowed multi-finance companies to participate in disbursing subsidised micro loans (Kredit Usaha Rakyat/KUR). B. The multi-finance industry landscape A fragmented industry. There are 201 financing companies in operation in 2016. Over the past 10 years, several had their licenses revoked due to non-compliance with regulations, the most common being inadequate capital. Prior to the Asian Financial Crisis, there were over 212 multi-finance companies nationwide. They typically provide financing for consumption needs (vehicle financing), leasing, factoring and credit cards. Currently, the majority of multi-finance companies focus on consumer financing (motorcycles, 2-wheelers (2W) and cars, 4-wheelers (4W), new and used) and leasing. Factoring remains a small part of the industry. Credit cards are no longer a feature among the multi-finance companies and it has become the target segment of banks. However, we noted that a handful of multi-finance companies are getting back into the game. New multi-finance company licences are still available. Last year, PT Group Lease Finance Indonesia, a joint venture between PT J Trust bank and Group Lease PLC in Thailand, was granted a licence. Multi-finance companies: Financing activities (Aug 2016)
Note: OJK changed breakdown category data since Sep 2016 Source: OJK, BI, DBS Bank, DBSVI
1-2 m people
203 m people
44 m people
1. Upper class: >USD 22.1 a day
2. Middle class:USD 4.5 - USD 22.1 a day
3. Poor:<USD 4.5 a day
Conventionalbanking and insurance markets
Microfinance market
Leasing27%
Factoring3%Consumer
Financing70%
Cars and motorcycles are collectivelyreferred as consumer financing

Industry Focus
Page 6
Change of financing classification by OJK from Sep 16. We note that OJK has changed the classification for its financing activities from Sep 16. Rather than “by type”, the classification is now “by purpose” – investment, working capital and multi-purpose loans – appears to be more similar to the banks’ classification. For example, the passenger 2W and 4W (for personal use) financing is included under “multi-purpose loans”. Commercial automotive financing with tenors of less than two years is considered “working capital financing”, while tenors of more than 2 years fall into “investments financing”. Multi-finance companies: Financing activities (Feb 2017)
Note: OJK changed breakdown category data based on financing activities since Sep 2016. Source: OJK, DBS Bank, DBSVI Overall growth has moderated since 2011. Despite growing at a faster rate compared to the banks, financing growth has moderated in the past five years. There has been a confluence of factors contributing to the moderating growth, the main one being the steep fall in commodity prices apart from regulatory changes. After the relaxation of the minimum down payment (DP) regulation in June 2015 (please see details in the table on page 21), automotive sales growth started to pick up and swing into the positive territory. We noted, however, that 4W sales recovered faster compared to 2W. We believe that the low commodity price environment was more detrimental to the purchasing power of ex-Java buyers who usually rely on 2W transport. 4W sales, on the other hand, are more related to the economic activity in major cities and urbanised areas which experienced lesser impact from softer commodity prices.
Multi-finance companies: Automotive sales vs CPO price
Source: Bloomberg Finance L.P., Gaikindo, AISI Multi-finance companies: Financing activities y-o-y growth
Source: OJK, BI, DBS Bank, DBSVI Auto: Volume sales improvement after DP rule relaxation
Source: Gaikindo, AISI, DBS Bank, DBSVI
28%
13%
59%
Investments Working Capital Multipurpose
-1,000 2,000 3,000 4,000 5,000 6,000 7,000 8,000 9,000
-500
1,000 1,500 2,000 2,500 3,000 3,500 4,000 4,500
Dec
-95
Feb-
97
Apr
-98
Jun-
99
Aug
-00
Oct
-01
Dec
-02
Feb-
04
Apr
-05
Jun-
06
Aug
-07
Oct
-08
Dec
-09
Feb-
11
Apr
-12
Jun-
13
Aug
-14
Oct
-15
Dec
-16
CPO Price (MYR/ton) - LHS 4W ('000 units) - LHS
2W ('000 units) - RHS
26.4%
4.1%
31.0% 32.3%
23.1%
15.2%
5.2%
-0.8%
6.7%
-5%
0%
5%
10%
15%
20%
25%
30%
35%
-
50
100
150
200
250
300
350
400
450
2008 2009 2010 2011 2012 2013 2014 2015 2016Total Financing Financing growth y-o-y
Rp bn % growth
-50%
-40%
-30%
-20%
-10%
0%
10%
20%
30%
Jan-
15Fe
b-15
Mar
-15
Apr
-15
May
-15
Jun-
15Ju
l-15
Aug
-15
Sep-
15O
ct-1
5N
ov-1
5D
ec-1
5Ja
n-16
Feb-
16M
ar-1
6A
pr-1
6M
ay-1
6Ju
n-16
Jul-1
6A
ug-1
6Se
p-16
Oct
-16
Nov
-16
Dec
-16
4W y-o-y growth 2W y-o-y growth
LTV Relaxation
Industry Focus
Page 7
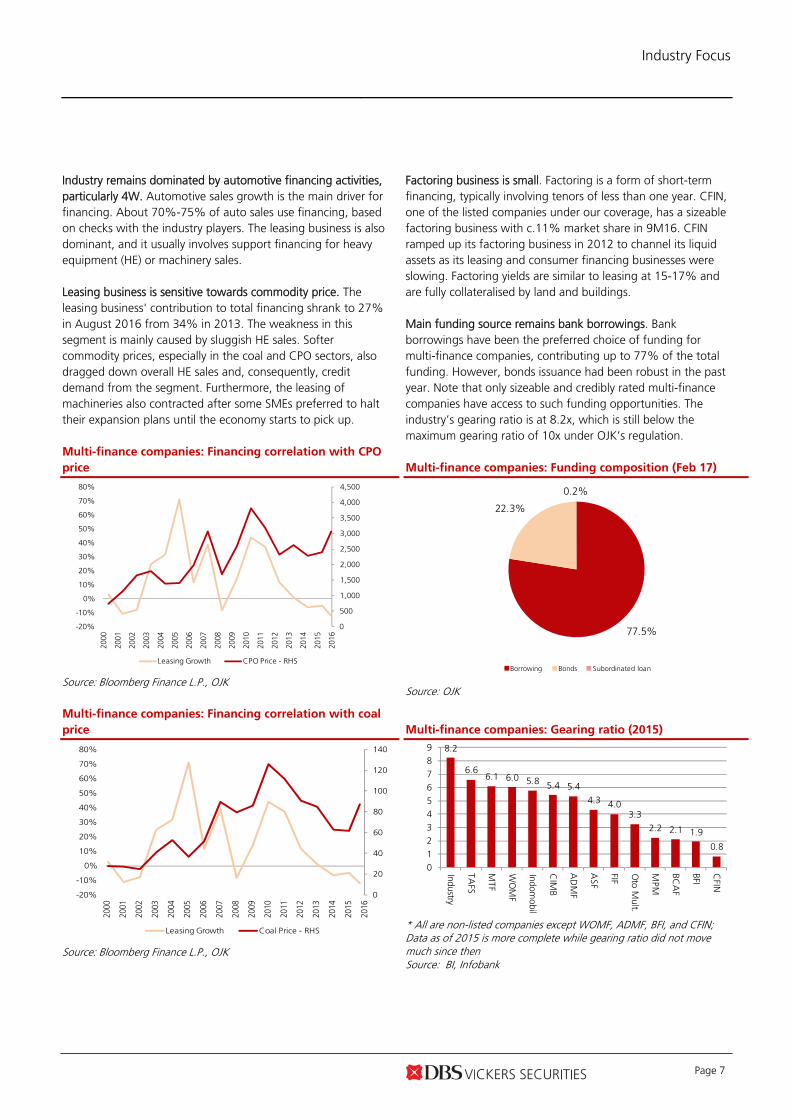
Industry remains dominated by automotive financing activities, particularly 4W. Automotive sales growth is the main driver for financing. About 70%-75% of auto sales use financing, based on checks with the industry players. The leasing business is also dominant, and it usually involves support financing for heavy equipment (HE) or machinery sales. Leasing business is sensitive towards commodity price. The leasing business' contribution to total financing shrank to 27% in August 2016 from 34% in 2013. The weakness in this segment is mainly caused by sluggish HE sales. Softer commodity prices, especially in the coal and CPO sectors, also dragged down overall HE sales and, consequently, credit demand from the segment. Furthermore, the leasing of machineries also contracted after some SMEs preferred to halt their expansion plans until the economy starts to pick up. Multi-finance companies: Financing correlation with CPO
price
Source: Bloomberg Finance L.P., OJK Multi-finance companies: Financing correlation with coal
price
Source: Bloomberg Finance L.P., OJK
Factoring business is small. Factoring is a form of short-term financing, typically involving tenors of less than one year. CFIN, one of the listed companies under our coverage, has a sizeable factoring business with c.11% market share in 9M16. CFIN ramped up its factoring business in 2012 to channel its liquid assets as its leasing and consumer financing businesses were slowing. Factoring yields are similar to leasing at 15-17% and are fully collateralised by land and buildings. Main funding source remains bank borrowings. Bank borrowings have been the preferred choice of funding for multi-finance companies, contributing up to 77% of the total funding. However, bonds issuance had been robust in the past year. Note that only sizeable and credibly rated multi-finance companies have access to such funding opportunities. The industry’s gearing ratio is at 8.2x, which is still below the maximum gearing ratio of 10x under OJK’s regulation.
Multi-finance companies: Funding composition (Feb 17)
Source: OJK Multi-finance companies: Gearing ratio (2015)
* All are non-listed companies except WOMF, ADMF, BFI, and CFIN; Data as of 2015 is more complete while gearing ratio did not move much since then Source: BI, Infobank
0
500
1,000
1,500
2,000
2,500
3,000
3,500
4,000
4,500
-20%
-10%
0%
10%
20%
30%
40%
50%
60%
70%
80%
2000
2001
2002
2003
2004
2005
2006
2007
2008
2009
2010
2011
2012
2013
2014
2015
2016
Leasing Growth CPO Price - RHS
0
20
40
60
80
100
120
140
-20%
-10%
0%
10%
20%
30%
40%
50%
60%
70%
80%
2000
2001
2002
2003
2004
2005
2006
2007
2008
2009
2010
2011
2012
2013
2014
2015
2016
Leasing Growth Coal Price - RHS
77.5%
22.3%
0.2%
Borrowing Bonds Subordinated loan
8.2
6.66.1 6.0 5.8 5.4 5.4
4.3 4.03.3
2.2 2.1 1.9
0.8
0123456789
Industry
TAFS
MTF
WO
MF
Indomobil
CIM
B
AD
MF
ASF
FIF
Oto M
ult.
MPM
BCA
F
BFI
CFIN
Industry Focus
Page 8
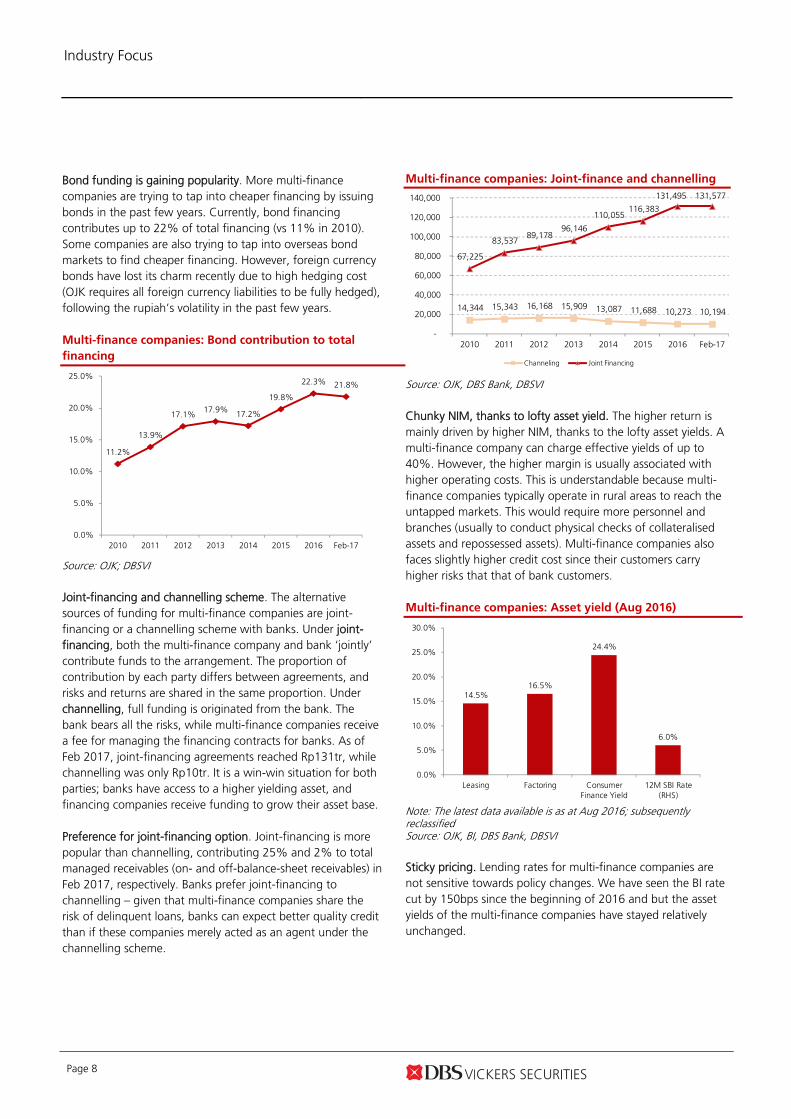
Bond funding is gaining popularity. More multi-finance companies are trying to tap into cheaper financing by issuing bonds in the past few years. Currently, bond financing contributes up to 22% of total financing (vs 11% in 2010). Some companies are also trying to tap into overseas bond markets to find cheaper financing. However, foreign currency bonds have lost its charm recently due to high hedging cost (OJK requires all foreign currency liabilities to be fully hedged), following the rupiah’s volatility in the past few years.
Multi-finance companies: Bond contribution to total
financing
Source: OJK; DBSVI Joint-financing and channelling scheme. The alternative sources of funding for multi-finance companies are joint-financing or a channelling scheme with banks. Under joint-financing, both the multi-finance company and bank ‘jointly’ contribute funds to the arrangement. The proportion of contribution by each party differs between agreements, and risks and returns are shared in the same proportion. Under channelling, full funding is originated from the bank. The bank bears all the risks, while multi-finance companies receive a fee for managing the financing contracts for banks. As of Feb 2017, joint-financing agreements reached Rp131tr, while channelling was only Rp10tr. It is a win-win situation for both parties; banks have access to a higher yielding asset, and financing companies receive funding to grow their asset base. Preference for joint-financing option. Joint-financing is more popular than channelling, contributing 25% and 2% to total managed receivables (on- and off-balance-sheet receivables) in Feb 2017, respectively. Banks prefer joint-financing to channelling – given that multi-finance companies share the risk of delinquent loans, banks can expect better quality credit than if these companies merely acted as an agent under the channelling scheme.
Multi-finance companies: Joint-finance and channelling
Source: OJK, DBS Bank, DBSVI Chunky NIM, thanks to lofty asset yield. The higher return is mainly driven by higher NIM, thanks to the lofty asset yields. A multi-finance company can charge effective yields of up to 40%. However, the higher margin is usually associated with higher operating costs. This is understandable because multi-finance companies typically operate in rural areas to reach the untapped markets. This would require more personnel and branches (usually to conduct physical checks of collateralised assets and repossessed assets). Multi-finance companies also faces slightly higher credit cost since their customers carry higher risks that that of bank customers. Multi-finance companies: Asset yield (Aug 2016)
Note: The latest data available is as at Aug 2016; subsequently reclassified Source: OJK, BI, DBS Bank, DBSVI Sticky pricing. Lending rates for multi-finance companies are not sensitive towards policy changes. We have seen the BI rate cut by 150bps since the beginning of 2016 and but the asset yields of the multi-finance companies have stayed relatively unchanged.
11.2%
13.9%
17.1%17.9% 17.2%
19.8%
22.3% 21.8%
0.0%
5.0%
10.0%
15.0%
20.0%
25.0%
2010 2011 2012 2013 2014 2015 2016 Feb-17
14,344 15,343 16,168 15,909 13,087 11,688 10,273 10,194
67,225
83,537 89,178
96,146
110,055 116,383
131,495 131,577
-
20,000
40,000
60,000
80,000
100,000
120,000
140,000
2010 2011 2012 2013 2014 2015 2016 Feb-17
Channeling Joint Financing
14.5%16.5%
24.4%
6.0%
0.0%
5.0%
10.0%
15.0%
20.0%
25.0%
30.0%
Leasing Factoring Consumer Finance Yield
12M SBI Rate (RHS)

Industry Focus
Page 9
Multi-finance companies: Asset yield vs 12M SBI Rate
Source: OJK, BI, DBS Bank, DBSVI
Asset quality issues to be monitored; mostly regulatory driven. Multi-finance companies have been plagued with asset-quality deterioration during the previous economic downcycle, bringing the NPL ratio to a high of 2.2% in August 2016, from 1.45% in Dec 2015. In September 2016, OJK changed its NPL recognition category to be more similar with that for the banks (five categories) from three categories previously. The reclassification saw the NPL ratio starting from a high of 3.4% in Sep 2016. However, it moderated to 3.0% by end-Feb 2017. Moreover, we also witnessed the spike in credit cost which reached 2.51% in August 2016, ending the year at 2.88%, vs 2.36% in December 2015. Multi-finance companies: NPL ratio
*OJK reclassified NPL ratio for multi-finance companies to be more similar with that for banks since September. The reporting adjustment resulted in the spike of NPL ratio Source: OJK, DBS Bank, DBSVI
Multi-finance companies: Changes in NPL recognition
Overdue Before Sep 2016 3 Category
After Sep 2016 5 Category
On time payment Current
Current 90 days in arrears Special Mention 90-120 days in arrears Sub Standard 120- 180 days in arrears Doubtful Doubtful more than 180 days in arrears Loss Loss
Note: Red font considered NPL Source: OJK, DBS Bank, DBSVI
Multi-finance companies: Credit cost
Source: OJK, BI, DBS Bank, DBSVI C. Prospects for the multi-finance industry Turning optimistic. We expect an improvement in financing demand this year. The Multi-finance Company Association (APPI/Asosiasi Perusahaan Pembiayaan Indonesia) recently announced its forecast of 10% financing growth this year on the back of an improving economy and higher commodity prices. However, we believe it is an optimistic number as the sustained positive growth needs to be supported by real improvements in purchasing power and business confidence which we have yet to see. Multi-finance companies: Financing growth vs GDP growth
Source: OJK, BPS, DBS Bank, DBSVI Earnings growth traction should improve from here. We believe earnings should recover in 2017 on the back of lower credit cost due to improved commodity prices which can help boost purchasing power, especially in the lower income segment. We do not expect much deviation on NIM due to the stable yields and cost of funds of the multi-finance companies. Operating costs are also expected to be flat as the companies have not been aggressive in expanding their service points.
5.0%
5.5%
6.0%
6.5%
7.0%
7.5%
8.0%
10%
12%
14%
16%
18%
20%
22%
24%
26%
Blended Yield 12M SBI Rate (RHS)
2.5%2.3%
2.0%2.0%
1.6%1.4%1.4%1.4%
1.6%1.6%
2.0%2.2%
2.2%2.2%
2.2%
3.4%3.2%3.2%3.3%3.2%
3.0%
0.00%
0.50%
1.00%
1.50%
2.00%
2.50%
3.00%
3.50%
4.00%
NPL NPL*
1.77%1.82%
2.24%
1.95%
1.76%
2.13%
2.36%
2.88%
1.50%
1.70%
1.90%
2.10%
2.30%
2.50%
2.70%
2.90%
3.10%
2009 2010 2011 2012 2013 2014 2015 2016
4.1%
31.0%32.3%
23.1%
15.2%
5.2%‐0.8%
6.7%8%
4.6%
6.1%6.5%
6.2%5.8%
5.0%4.7%
5.0%5.3%
0%
1%
2%
3%
4%
5%
6%
7%
‐5.0%
0.0%
5.0%
10.0%
15.0%
20.0%
25.0%
30.0%
35.0%
2009 2010 2011 2012 2013 2014 2015 2016 2017F
Total Financing (% y‐o‐y) Real GDP Growth (%y‐o‐y)

Industry Focus
Page 10
Multi-finance companies: Earnings growth
*Average earnings growth of BFIN and CFIN Source: OJK, Companies, DBS Bank, DBSVI Potential NIM expansion. We expect NIM expansion on the back of lower funding cost as the banks have started to price down their loans, which means multi-finance companies now enjoy lower funding costs via bank borrowings. Meanwhile, asset yields are expected to be constant as the interest rates offered to the customers are not sensitive towards the change in interest rate environment. Multi-finance customers typically are more concerned about monthly instalments (whether they are able to pay), fast approval, and easy service more than interest rates. The higher reliance on bond financing could lower funding costs. Bond financing has been gaining popularity and the data shows that bond financing portion is on the uptrend. This might lower the blended cost of funds further as bond financing is typically cheaper than bank financing. Multi-finance companies: NIM
Source: Companies, DBS Bank, DBSVI Operating expenses should remain in check. Historically, cost to income ratio were stable around 40%. The slight uptick in 2015 is mainly due to weakening profitability – largely
attributed to the slowdown in the automotive business and heavy equipment. A slight improvement in 2016 was triggered by some cost efficiency measures. We noted that ADMF and MTF had successfully improved their cost-to-income ratio in 2016 via network and employee rationalisation. Multi-finance companies: Cost-to-income ratio
Source: Companies, DBS Bank, DBSVI Improvement in asset quality. Multi-finance companies reported lower NPL ratios in 2016. However, the multi-finance companies we met were hesitant to turn bullish. Better commodity price would be positive for their customers, especially for commercial heavy equipment leasing and factoring but these customers need a sustained high commodity price to help their distressed cash flow. However, we believe that positive asset-quality trends may come from the portfolio shift towards customer financing and tighter financing approval. Multi-finance companies: NPL ratio
Source: Companies, DBS Bank, DBSVI
14%
2%
33%
19%
-16%-13%
2%
27%30%
17%
9% 10%
-10% -3%
28%
9%
17%
-20%
-10%
0%
10%
20%
30%
40%
2010 2011 2012 2013 2014 2015 2016 2017F 2018F 2019F
Industry Earnings Growth Average*
13.1%12.4% 12.0% 12.2%
12.9%
0.0%
2.0%
4.0%
6.0%
8.0%
10.0%
12.0%
14.0%
0.0%
5.0%
10.0%
15.0%
20.0%
25.0%
30.0%
35.0%
2012 2013 2014 2015 2016
BCA Finance Mandiri Tunas Finance FIF
ASDF ADMF BFIN
CFIN Average - RHS
%%
37.5 36.3 38.040.0 39.4
0.0
5.0
10.0
15.0
20.0
25.0
30.0
35.0
40.0
45.0
0.0
10.0
20.0
30.0
40.0
50.0
60.0
2012 2013 2014 2015 2016
BCA Finance Mandiri Tunas Finance FIF
ASDF ADMF BFIN
CFIN Average
%%
1.09 0.96 1.00
1.21 1.13
-
0.20
0.40
0.60
0.80
1.00
1.20
1.40
0
0.5
1
1.5
2
2.5
2012 2013 2014 2015 2016
BCA Finance Mandiri Tunas Finance FIF
ASDF ADMF BFIN
CFIN Average - RHS
%%

Industry Focus
Page 11
Key drivers for the multi-finance industry
With consumer financing dominating the loan portfolio of multi-finance companies, the auto industry would be the key growth driver. Leasing growth relies mainly on heavy equipment financing which in turn unfortunately is dependent on commodity prices. Both these segments have been in the doldrums in the past two years. The near-term exuberance of commodity prices might not sustain throughout the year but we believe the positive impact would be moderate. We expect the auto industry to pick up slightly this year, boosting the growth prospects of multi-finance companies. A. Automotive Industry Outlook Improved auto sector outlook for 2017; expect a stronger 2H17. 2016 industry sales came in slightly lower than our expectation, with FY16 volume growing 4.8% y-o-y (we forecasted 5% y-o-y). Meanwhile, 2W demand is still weak as FY16 sales volume shrank 8%, mainly driven by weak ex-java sales due to sustained low commodity prices. We are less optimistic about the 2W segment and expect only 2% volume growth in FY17. Astra International’s management has guided that sales in FY17 will be second-half-heavy while the first half of the year should see flat volume growth. Temporary support from commodity prices. Sustained high CPO prices should help automotive sales, especially in the ex-Java areas. However, purchasing power in the commodity-related regions has yet to show significant improvement so far. We believe the high commodity prices need to be sustained long enough to allow the positive effects to spill over to the auto sector. Therefore, we only expect modest growth (c.5% for 4W and c.2% for 2W) this year. Long term-potential is still there, especially for 4W. The auto penetration rate in Indonesia remains one of the lowest in the region. Based on data by Badan Pusat Statistik (BPS)/Indonesian Statistics Centre and automotive association, in 2015 there are only 13.7m cars and 99m motorcycles outstanding on Indonesian roads (vs its population of 250m). The penetration rate for 4W is a mere 5%, lower than other developing countries like Malaysia and Thailand. However, 2W penetration is much higher at 40% in 2015.
Auto penetration in developing countries
Source: CEIC, BPS, Gaikindo, DBS Bank, DBSVI Auto: 4W sales trend – recovery after being severely hit
Source: Gaikindo, DBS Bank, DBSVI Auto: 2W sales trend – slower growth
Source: AISI, DBS Bank, DBSVI
Indonesia, 4.68%
China, 4.52%
India, 2.68%
Thailand, 15.22%
Malaysia, 32.17%
-
1,000
2,000
3,000
4,000
5,000
6,000
7,000
8,000
9,000
0% 5% 10% 15% 20% 25% 30% 35%
Car ownership ratio
GD
P p
er c
apit
a U
S$
-
200,000
400,000
600,000
800,000
1,000,000
1,200,000
1,400,000
2005
2006
2007
2008
2009
2010
2011
2012
2013
2014
2015
2016F
2017F
2018F
CAGR: 5%
-
1,000,000
2,000,000
3,000,000
4,000,000
5,000,000
6,000,000
7,000,000
8,000,000
9,000,000
2005
2006
2007
2008
2009
2010
2011
2012
2013
2014
2015
2016F
2017F
2018F
CAGR: 2%

Industry Focus
Page 12
Penetration is low, but is it that low? Only half the population can buy a car. Despite the appeal of a low 4W penetration rate in Indonesia, we argue that only around half of the Indonesian population can afford a car. Income equality has become the key feature in the Indonesian economy. This can be seen in the increase in Gini coefficient to 0.4 in 2016 vs 0.36 in 1996. Data from BPS indicates that the top 20% of the Indonesian population contributes to 48% of total expenditure, as shown in the chart below. Indonesia: Inequality is an important feature
Source: BPS 2014, DBS Bank, DBSVI Indonesia: Auto loan penetration
Note: Calculated as number of vehicles divided by national population Source: BPS, Gaikindo, AISI, DBS Bank, DBSVI Affordability estimates. We estimate how much the price of a car an average Indonesian can afford in each segment. Using the nominal GDP per capita as a proxy of income, we estimated that the top 20% of the working population (with age 15-64) have an average annual income of Rp176m/year. Assuming 30% of the income is allocated to car installment, dual income, 25% down payment, and 4 years installment period, we believe that the families in this class can afford a Rp350m car (please see the following table).
Auto: Price segmentation based on income
Income Brackets
Pop. (m person)*
Annual GDP Nominal 2016 (Rp tr)
Annual GDP per Capita (Rp m)
Capability of monthly installment per family (Rp m)**
Ideal Price Segment (Rp m)***
Top 20% 34,046 5,988 176 8.8 350
Middle 40% 68,092 4,292 63 3.2 125
Bottom 40% 68,092 2,134 31 1.6 60
Total 170,230 12,415 73 3.6
* Productive age (age 15-64) is 66.9% of total population, based on World Bank data in 2014 **Assuming dual income and installment is maximum 30% of monthly income. Calculated as: annual GDP per capita* 2 * 30% / 12 *** ideal price segment is based on credit simulation on Astra Credit Companies website assuming 25% down payment and 4 years tenor Source: BPS; Gaikindo; AISI; DBS Bank, DBSVI Small MPVs are favourite. The affordability analysis might explain why the small multi-purpose vehicles (MPV) (Avanza, Xenia, Mobilio, and Ertiga) have become the favourite cars in Indonesia. The prices of those cars fall in the income range of the top 20% and middle 40% segments. Some brands like Innova have also moved up to the higher-end target market segments to capture the more affluent customers. Auto: Price and units sold by top 10 brands in 2016
Source:Gaikindo, DBS Bank, DBSVI LCGC segment has the lowest penetrated market; strong growth ability. We believe the middle 40% market offers the biggest potential due to its huge population. Based on the assumption we have laid out earlier, people in this segment can afford a car with price tags of around Rp125m. This might be suitable for low-cost green cars (LCGC) which are usually priced around Rp100m-150m per unit. This segment has been barely penetrated. LCGC sales have not even reached 1m units vs the potential market of 51m units (assuming 102m people in the middle segment use one car per two persons).
17%
40%
35%
40%
48%
20%
0%
10%
20%
30%
40%
50%
60%
70%
80%
90%
100%
Expenditure Population
Top 20%
Middle 40%
Bottom 40%
-
50
100
150
200
250
300
0%
5%
10%
15%
20%
25%
30%
35%
40%
45%
50%
1990
1991
1992
1993
1994
1995
1996
1997
1998
1999
2000
2001
2002
2003
2004
2005
2006
2007
2008
2009
2010
2011
2012
2013
2014
F20
15F
2016
F20
17F
2018
F
Population (mn) 2W penetration 4W penetration
6.1mn
- 50,000 100,000 150,000 200,000
Motorcycle (Rp17m)
Ayla (Rp110m)
Agya (Rp120m)
BRV (Rp130m)
Calya (Rp140m)
Xenia (Rp170m)
Avanza (Rp200m)
Mobilio (Rp200m)
Brio Satya (Rp240m)
HR-V (Rp300m)
Innova (Rp350m)
Unit Sold in 2016
LCGC235,171 units/
22.1% of total industry sales

Industry Focus
Page 13
Auto: Market size for each segment
Note: Number of families are calculated as working population (age 15-64) divided by two. Source: BPS, Gaikindo, DBS Bank, DBSVI LCGC is gaining market share. LCGC car volume saw a significant increase in market share, especially during the economic slowdown in 2015. The market share of LCGC cars swelled to 22% in 2016 from 14% in 2014. The strong penetration rate is due to LCGC’s well-accepted value proposition to the lower-income consuming class which is price sensitive. LCGC cars also offer better fuel efficiency. It can carry 5-7 passenger cars, which is also a strong selling point for young families in Indonesia. Auto: LCGC is gaining market share
Source: Gaikindo, DBS Bank, DBSVI
B. Leasing and heavy equipment Sluggish leasing growth in 2016. Leasing shrank by 12% in Aug 2016, the weakest growth since the GFC. Low commodity prices such as coal and CPO hit the demand for new heavy equipment (HE), resulting in a 44% contraction for Komatsu HE (the market leader in Indonesia) annual sales volume. Furthermore, the soft economic conditions also dragged down the sales of trucks and machinery, which eventually translate into low leasing demand. The leasing business is more cyclical by nature compared to consumer financing. Moderately higher coal prices in 2017. Our coal price assumption for FY17 onwards is at US$65 per ton, supported by supply and demand rebalancing following China’s intention to limit its coal production volume as well as the stickier-than-expected Chinese coal demand in the short to medium term. Besides the China coal production cut, coal restocking for the 4Q16 winter season provided a short-term cushion for coal prices. A recovery in sight, but we are not overly bullish on coal price outlook. While the coal price benchmark has risen by more than 25% in 2H16, we believe it is more due to supply disruption rather than demand improvement. We have not seen any structural improvement in demand from key importers like China; beyond the upcoming capacity under construction. Beyond 2016, we believe the supply and demand situation is improving, even though a structural supply and demand recovery is not in sight yet. The higher coal price trend of late is not expected to translate into a full-fledged coal price recovery cycle. Newcastle coal price trend and forecast (US$/ton)
Source: Bloomberg Finance L.P., DBS Bank, DBSVI
17
34
34
Top 20%
Middle 40%
Bottom 40%
Regular Car Segment (Rp350m/unit)
LCGC Segment (Rp125m/unit)
Used Car/Motorcycle Segment (Rp60m/unit)
Million families
14%16%
22%
0%
5%
10%
15%
20%
25%
2014 2015 2016
LCGC Share
0
20
40
60
80
100
120
140

Industry Focus
Page 14
Leasing: Hampered by low commodity prices
Note: HE sales as of 3Q16; the latest data available is as at Aug 2016; subsequently reclassified Source: companies, OJK, DBS Bank, DBSVI;
Demand for heavy equipment leasing should recover. The leasing business is highly dependent on HE volume which in turn depends on commodity prices. We expect the improvement in HE sales to come from higher demand from the mining and construction sectors. With a recovery in commodity prices, we should at least expect the leasing business of the multi-finance companies to stop sliding.
39%
-8%
14%
44%
37%
12%
-5% -5%
-12%
-20%
-10%
0%
10%
20%
30%
40%
50%
-
2,000
4,000
6,000
8,000
10,000
12,000
14,000
16,000
18,000
20,000
2008 2009 2010 2011 2012 2013 2014 2015 8M16
HE Industry Sales Leasing Growth - RHS
Units

Industry Focus
Page 15
Key players and market position
Who’s who in the Indonesian multi-finance industry? The industry is very fragmented. As mentioned above, there are a total of 201 multi-finance companies, with the top 20 companies commanding 65% (financing) market share. While we profile all the multi-finance companies in the industry by business type and ownership, we will focus on the top companies to analyse their strategies and profitability. We will also narrow our analysis on the multi-finance companies by focusing on consumer financing which forms the bulk of their business. Fragmented market. The industry is fragmented and each company caters to its own niche. The top 20 multi-finance companies have a combined market share of 65%. Each of them caters to its own niche by specialising in several categories such as product financed (4W, 2W, HE, etc) and geographical reach. The biggest player (Astra Sedaya Finance, ASDF) only has 8% market share, marginally higher among the top 4 companies. Some multi-finance companies invest in huge branch network, such as BFIN (204 branches) and Adira Finance (201) for local presence and to gain the local knowledge in specific geographical areas. Synergy with banks and automotive players. Multi-finance companies are typically owned by banks (both domestic and foreign), brand-holding sole agents (ATPM) of cars and foreign principals of car makers (e.g. Astra), and a few which are family/individual-owned. The strong multi-finance companies are those affiliated to banks or car makers and ATPMs. ATPMs seek to team up with multi-finance companies to support their sales. Some ATPMs have their own financing companies. The Astra Group, which is the ATPM for Toyota, Daihatsu and Isuzu cars and Honda motorcycles, has Astra Sedaya Finance, Toyota Astra Finance for 4W/car financing and Federal International Finance for 2W/motorcycle financing. The Indomobil Group also has its own financing firms – Indomobil Finance Indonesia for 4W/car financing and Suzuki Finance Indonesia for 2W/motorcycle financing.
Multi-finance companies: Market share of top 20 players
Note: Based on outstanding on balance sheet net receivable. Data represents 2015 numbers Source: Infobank, OJK, DBS Bank, DBSVI Multi-finance companies: Breakdown by business type
Note: Others include leasing, factoring, and multi-purpose financing; data represents 2015 numbers Source: Company annual reports & websites, DBS Bank, DBSVI
Multi-finance companies: Breakdown by ownership
Source: DBS Bank, DBSVI
8%7% 7% 7%
5%
4%
3%3% 3% 2% 2% 2% 2% 2% 2% 2% 1% 1% 1% 1%
0%
1%
2%
3%
4%
5%
6%
7%
8%
ASD
F
FIF
AD
MF
C.J
. Pow
er
Oto
M
TAFS
Dip
o S.
F
BFIN
Sum
mit
O.F
Man
diri
T.F
Indo
mob
il F,
I
Buss
an A
.F
CFI
N
BCA
F
CIM
B F.
Mits
ui L
easi
ng
Orix
I.F
Sury
a A
rtha
N.F
MPM
F.
WO
MF
96%
2%
41%
100% 100%
38%
96%
37%
100%
58%
89%
58%
100%19%
4% 9%1%
62%
4%
44% 42%
0%
10%
20%
30%
40%
50%
60%
70%
80%
90%
100%A
SDF
FIF
AD
MF
Oto
M
TAFS
BFIN
Sum
mit
O.F
Man
diri
T.F
Indo
mob
il F,
I
BCA
F
CFI
N
4W 2W Others
INDEPENDENT
BANK RELATEDAUTO RELATED
FIF
MPM FinanceTAFS
Indomobil Fin.
ASDF
Mandiri TF
Adira
BCA FinanceClipan Finance
CIMB Niaga AF
BFINOto MultiarthaSummit Oto F.

Industry Focus
Page 16
Top players have better profitability metrics than banks. Compared to banks, multi-finance companies generate better returns. Generally, the major multi-finance players record higher ROE and ROA as the benefits of higher asset yield outweigh the negatives of higher cost of funds, operating cost, and credit cost. The higher asset yield is due to the ability to tap the unbankable market, an advantage that banks lack. But it requires vast infrastructure to tap into this market while the high credit cost is due to the high risk profile of customers.
Multi-finance companies (vs banks): ROE
Note: Data represents 2015 numbers Source: Infobank, OJK, BI, DBS Bank, DBSVI Multi-finance companies vs banks: ROA
Notes: Data represents 2015 numbers Source: Infobank, OJK, BI, DBS Bank, DBSVI
Multi-finance companies: Comparison with banks
Multifinance Companies
(Rp bn) Banks
(Rp bn)
NIM 12.9% 7.14% Credit Cost 2.89% 1.64% Opex/loan 8.00% 3.6% NPL 1.11% 2.18%
(All ratios using average three years of data for banks and multi-finance covered in this report) Note: Data represents 2016 numbers Source: OJK, BI, DBS Bank, DBSVI
Leveraging on banks’ balance sheet through joint financing to enhance ROE. Multi-finance companies, especially the ones related with banks, often use joint financing to enhance returns and therefore ROE. That explains why BCAF, MTF, and ADMF can offer lower effective loan rates for their products but can yet enjoy astronomical asset yields and ROEs. This is the key benefit of having a bank as a shareholder; as it can use the bank’s balance sheet to grow more aggressively and achieve higher ROE. Automotive-related companies also can use joint financing/channelling but the portion is usually smaller. Take ASDF, for example. Comparatively, it does not have a significant joint financing portion for its managed receivables and has relatively low asset yield and ROE.
18%
29%
16%
8%
15%
21%17%
30%
56%
20%
12%
20%
12%10%
15% 13%
8%
0%
10%
20%
30%
40%
50%
60%
ASD
F
FIF
AD
MF
Oto
M
TAFS
Dip
o S.
F
BFIN
Man
diri
T.F
BCA
F
BBC
A
BMRI
BBRI
BBN
I
BDM
N
BBTN
BTPN
PNBN
3%
6%
2% 2% 2%3%
6%
4%
16%
3%2%
3%2% 2% 1%
2%1%
0%
2%
4%
6%
8%
10%
12%
14%
16%
18%
ASD
F
FIF
AD
MF
Oto
M
TAFS
Dip
o S.
F
BFIN
Man
diri
T.F
BCA
F
BBC
A
BMRI
BBRI
BBN
I
BDM
N
BBTN
BTPN
PNBN

Industry Focus
Page 17
Multi-finance companies: Top 20 players (by asset size) – 2015 Company Asset
2015 (Rp bn)
Financing 2015
(Rp bn)
Liabilities 2015
(Rp bn)
Equity 2015
(Rp bn)
Gearing Ratio
Major Product
Financed
ROE Number of
Branches
Astra Sedaya Finance 30,392 27,542 24,699 5,693 4.34 4W% 18.1% 61 Central Java Power 29,880 24,425 24,088 5,792 4.31 Power Plant 25.3% N/A
Federal International Finance 28,734 25,962 23,011 5,723 4.02 2W% 29.2% 169
Adira Dinamika Multi Finance 27,744 24,919 23,383 4,361 5.36 4W, 2W 15.8% 654
Oto Multiartha 22,288 19,717 17,301 4,986 3.25 4W 8.3% 72
Toyota Astra Financial Services 17,804 15,986 15,548 2,256 7.17 4W 15.1% 27
Dipo Star Finance 14,304 11,967 12,087 2,216 4.74 4W 20.9% 31
BFI Finance Indonesia 11,770 9,898 7,751 4,019 1.93 Multipurpose 17.0% 204
Summit Oto Finance 10,575 9,120 6,655 3,920 1.73 2W 6.1% 133
Mandiri Tunas Finance 9,203 8,482 8,030 1,173 6.55 4W 29.6% 88
Indomobil Finance Indonesia 8,913 8,085 7,597 1,316 4.90 4W, 2W 6.4% 80
Bussan Auto Finance 8,880 7,566 7,276 1,604 5.07 4W, 2W 0.2% 188
BCA Finance 6,824 5,707 4,634 2,190 2.12 4W 56.2% 60
Orix Indonesia Finance 6,727 4,950 4,533 2,194 2.11 4W, 2W, HE 9.9% 10
Surya Artha Nusantara Finance 6,693 5,260 5,285 1,408 3.66 HE 7.9% 15
Clipan Finance 6,647 6,430 3,048 3,599 0.85 4W 8.4% 45
CIMB Niaga Auto Finance 6,438 5,903 5,459 979 5.73 4W, 2W, HE 8.6% 68
Mitsui Leasing Capital Indonesia 5,910 5,638 4,860 1,051 4.78 4W, HE 7.0% 15
Wahana Ottomitra Multiartha 5,306 4,190 4,451 856 6.02 2W 2.2% 99
Mitra Pinasthika Mustika Finance 5,240 4,671 3,548 1,692 2.19 4W, 2W, HE 1.3% 91
Notes: Data represents 2015 numbers Source: Infobank, OJK, BI, DBS Bank, DBSVI
Multi-finance companies: Shareholding structure of the top 20 players
Company Shareholder 1 Shareholder 2
Astra Sedaya Finance PT Astra International 75% PT Bank Permata Tbk.25%
Central Java Power Summit Power Capital Limited (UK) 50% Summit Power Global Management I B.V (Netherlands) 25%
Federal International Finance PT Astra International, Tbk. 99,99% PT Asrya Kharisma 0,01%
Adira Dinamika Multi Finance PT Bank Danamon Indonesia 75,00% Mega Value Profit Limited 17,42%
Oto Multiartha Sumitomo Corporation 85% PT Sumitomo Indonesia 10%
Toyota Astra Financial Services PT Astra International 50%; Toyota Financial Services Corporation 50%
Dipo Star Finance MC Automobile Holding Asia B.V. 85% PT MC Auto Consulting Indonesia 10%
BFI Finance Indonesia Trinugraha Capital & Co SCA 44,10% Lainnya 55,90%
Summit Oto Finance Sumitomo Corporation 85,00% PT Sumitomo Indonesia 10,00%
Mandiri Tunas Finance Bank Mandiri 51% PT Tunas Mobilindo Parama 49%
Indomobil Finance Indonesia PT Indomobil Sukses International, Tbk. 99,875% PT IMG Sejahtera Langgeng 0,125%
Bussan Auto Finance Mitsui & Co., Ltd Japan 58,33% Yamaha Motor Co.,Ltd Japan 17,67%
BCA Finance PT Bank Central Asia Tbk. 99,58% PT Bank Central Asia Tbk. 99,58%
Orix Indonesia Finance Orix Corporation 96,02% Yayasan Kesejahteraan Karyawan BI 3,98%
Surya Artha Nusantara Finance PT Sedaya Multi Investama 60% Marubeni Corporation, Jepang 35%
Clipan Finance PT Bank Pan Indonesia, Tbk. 54,35% Public 45,65%
CIMB Niaga Auto Finance PT Bank CIMB Niaga Tbk. 99,94% -
Mitsui Leasing Capital Indonesia JA Mitsui Leasing, Ltd. 85% PT Matahari Artha Nusantara 15%
Wahana Ottomitra Multiartha Tbk PT Bank Internasional Indonesia 62,00% PT Wahana Makmur Sejati 17,59%
Mitra Pinasthika Mustika Finance PT Mitra Pinasthika Mustika Tbk 59,99% JACCS Co, Ltd 40,00%
Notes: Data represents 2015 numbers Source: Infobank, OJK, BI, DBS Bank, DBSVI

Industry Focus
Page 18
Multi-finance companies: Joint-financing arrangements
Joint-financing & Channelling
Portion* Joint-financing Partner
Joint-financing Facility Amount
(bn)
Joint-financing Portion
Agreement
Effective Interest Rate Offered
Yield on Consumer Financing FY16
ROA FY16 (%)
BCA Finance 89% Bank BCA n.a 95% 7% - 27% 35% 14%
Mandiri Tunas Finance
64% Bank Mandiri 20,500 99% 14,1%- 4W 21.8% 2W
15.5% - Others 20% 2.9%
FIF 16%
TAFS Unlimited 70%-99%
25.1% - 42.6% 28% 6.1%
PT Bank Permata Tbk 6,100 90%-99% PT Bank Permata Tbk - Syariah 3,000 90%-99%
PT Bank Commonwealth 3,000 70%-99%
PT Bank CIMB Niaga 2,500 70%-99% PT Bank CIMB Niaga - Syariah 3,000 90%-99% PT Surya Artha Nusantara Finance 2,000 70%-99%
PT Bank Sahabat Keluarga 1,000 70%-99%
PT Astra Sedaya Finance 300 70%-99%
PT Bank Panin Syariah 500 90%-99%
ASDF 22%
PT Bank Permata Tbk 10,700 90%
7.1% - 29.6% 16% 3%
PT Bank Commonwealth 2,000 90% PT Sahabat Finansial Keluarga 1,000 90%
PT Bank CIMB Niaga Tbk 1,000 90%
PT Bank OCBC NISP Tbk 500 90%
ADMF 40% PT Bank Danamon n.a 99% 17%-22% - 4W
33% - 41% - 2W 24% 3.7%
PT Bank Commonwealth n.a 99%
BFIN 18%
PT Bank Rakyat Indonesia 600 Channelling 16% – 21%- 4W 38%-41% - 2W
14%-18% - Prop. 21% 6.3% PT Bank Mandiri Tbk 500 95%
PT Bank Maybank Indonesia Tbk 0.5 95%
CFIN 3% PT Bank Pan Indonesia Tbk 2,000 Channelling 17.20% 16% 3.1%
* % of managed receivables, gross of unearned interest Source: Annual reports, DBSVI, DBS Bank
A. 4-wheeler (4W) market space 4W market dominated by Astra and bank-backed parentage. We note that the top six players that dominate this segment have 77% of the estimated new 4W financing market in terms of unit financed. Astra Sedaya Finance (ASDF) is the market leader in this segment, thanks to the backing of its automotive distributor and bank parent, Bank Permata. In terms of nominal value of new financing, however, BCAF is the market leader with Rp30.7tr new bookings in FY16 (including joint financing), thanks to the strong consumer banking franchise which enables it to tap into customers in the affluent class segment.
Top 4W players: Market share in terms of unit financed
Assuming 70% of new 4W domestic sales using financing Source: Companies, DBS Bank, DBSVI
BCAF15%
ASDF18%
MTF13%TAFS
11%
OTO M14%
ADMF6%
Others23%

Industry Focus
Page 19
Top 4W players: New bookings for new 4W in 2016
*Data for Oto Multiarta (OTO M) is a management target in 2016 ** Data for BCAF is an estimation based on disclosed market share Source: Companies, DBS Bank, DBSVI
Top 4W players: Market share movement
Source: Companies, DBS Bank, DBSVI B. 2-wheeler (2W) market space 2W market dominated by FIF and ADMF. In the new 2W financing segment, we see three dominant players in this segment – led by Federal International Finance (FIF), Adira Dinamika Multifinance (ADMF), and WOM Finance (WOMF). In the past five years, we note that FIF has consistently been increasing market share, supported by Honda’s strong performance. We understand that nearly half of Honda’s sales are financed through FIF. Honda saw its market share rise gradually to 74% in FY16 from 58% five years ago; this has been the main driver for FIF’s strong performance.
Top 2W players: Market share movement
Notes: Assuming 70% of new 2W sales using financing. WOMF number for 2016 using annualised 9M16 number. Source: Companies, DBS Bank, DBSVI Top 2W players: Market share in 2016
Notes: Assuming 70% of new 2W sales using financing. WOMF number for 2016 using annualised 9M16 number. Source: Companies, DBS Bank, DBSVI
Top 2W players: Market share of 2W brands
Source: Gaikindo
133
114 100 99
82
48
-
20
40
60
80
100
120
140
ASDF BCAF** OTO M* MTF TAFS ADMF
New
Thousands Unit
4.00%
6.00%
8.00%
10.00%
12.00%
14.00%
16.00%
18.00%
20.00%
2012 2013 2014 2015 2016
BCAF ASDF MTF TAFS OTO M ADMF
24.0%24.2%
26.6%
31.5%34.6%
22.4%18.1% 18.1% 17.2% 17.5%
7.9% 7.2% 7.8% 7.6%5.7%
0.3% 0.3% 0.3% 0.3% 0.1%0.0%
5.0%
10.0%
15.0%
20.0%
25.0%
30.0%
35.0%
40.0%
2012 2013 2014 2015 2016
FIF ADMF WOMF MTF
34.6%
17.5%5.7%0.1%
42.1%
FIF ADMF WOMF MTF Others
58%61%
64%69%
74%
34% 32% 30% 28%23%
6% 5% 3% 2% 1%2% 2%2%
2%2%
0%
10%
20%
30%
40%
50%
60%
70%
80%
2012 2013 2014 2015 2016
Honda Yamaha Suzuki Others

Industry Focus
Page 20
Regulatory framework for multi-finance companies
Regulated by OJK. Multi-finance companies are licensed to offer a range of services, including leasing, consumer financing, credit card financing and factoring. These companies target the financing needs of the lower income households. But unlike banks, they are not allowed to accept deposits. Similar to banks, multi-finance companies are governed by OJK, the regulatory arm of the Minister of Finance (MoF). Prior to the formation of OJK in 2011, multi-finance companies were under the purview of Bapepam. OJK issued 28/POJK.05/2014 to regulate the licensing and the institution of multi-finance companies. The main takeaways from the regulation include: Steps to incorporate a multi-finance company: Establishment of Limited Liability Company. Limited
liability company is the most common legal entity for a multi-finance company in Indonesia. For further details in establishing a limited liability company, please refer to the Indonesian Investment Coordinating Board (BKPM/Badan Koordinasi Penanaman Modal) website http://www.bkpm.go.id/en/investment-procedures
Obtain licence from OJK. The directors need to obtain a licence from OJK. The proposal needs to follow the formats and be attached with all the documents required in accordance to 28/POJK.05/2014.
Fit and proper test for the directors and commissioners. OJK will decide in 30 days or less after all the documents
have been submitted properly. If OJK perceives the documents to be incomplete, OJK will notify the applicant in 20 days or less.
Companies that already have obtained the licence must start the business in two months or less.
Capital requirements: Minimum paid-up capital of Rp100bn (USD7.5m) for a
limited liability entity. Maximum foreign ownership is 85% of paid-up capital. For publicly listed entity: Maximum floating shares of
85%. Local ownership needs to be maintained at a minimum level of 15% of the non-listed shares.
Foreign labour restriction: Companies can only hire a non-Indonesian employee as
consultant, advisor, or high-ranked officials (director or one level below directors.
Membership requirement in other organisations: Multi-finance companies must join the membership of the
appointed credit bureau. Multi-finance companies must join the membership of the
appointed association.
Credit bureau: Multi-finance companies can subscribe to credit history
data for customers from Bank Indonesia (BI checking) and Pefindo (private credit rating agency/credit bureau).
Multi-finance companies can also retrieve information on blacklisted customers from the relevant association (APPI/Asosiasi Perusahaan Pembiayaan Indonesia).
Merger and acquisition: OJK defines controlling shareholder as >=25% ownership
of a person or entity or proven to have been controlling the company directly or indirectly.
Approval from OJK must be obtained before a change in controlling shareholder.
Acquisition cost for new 4W dealership: By releasing SE OJK No.1/seojk.05/2016, OJK puts the cap
on acquisition cost (commission paid to the dealer in % terms of the revenue from one customer) at 15%.
Regulators also put a cap of 20% acquisition cost for 2W financing, based on our checks with industry players.
Regulations/restrictions in operating a multi-finance company. OJK also stipulates the conduct of a multi-finance company. The table below summarises the requirements/restrictions: Multi-finance companies: Regulations/restrictions for
operating a multi-finance company
Requirement/restrictions under POJK No 29/POJK.05/2014
Non Performing Financing max 5% Financing to Asset Ratio min 40% Minimum Equity Rp100bn Gearing Ratio max 10% Foreign currency liabilities must be fully hedged Cannot gather deposits directly from customers
Source: OJK, DBS Bank, DBSVI NPL classification similar to banks now. Multi-finance companies have started to implement an NPL classification that is similar to that for banks (NPL as loans with 90 days past due) effective from Jan 2016. It has also been reflected in the Sep 16 NPL figures, which jumped to 3.4% from 2.2% in Aug 16 (refer to the earlier section on page 9). However, there are still deviations for the write-off policies, depending on the level of conservatism.

Industry Focus
Page 21
Collection and write-off policies may vary; provisions are regulated. Multi-finance companies may implement different collection and write-off policies. Adira Finance, for example, implements a 210-day automatic write-off policy while Mandiri Tunas Finance implements 180 days. Provisioning, however, is more regulated. The companies need to set aside 100% provisioning after 180 days overdue. LTV regulation for auto financing. The loan-to-value (LTV) regulation has been an effective tool that is often used by OJK to manage the multi-finance industry. Prior to 2013, there were no LTV criteria instituted for multi-finance companies. Despite that, there were some multi-finance companies which were more prudent than others (having their own LTV criteria).
During the boom times for 2W and 4W in 2010-2013, some multi-finance companies gave out financing without any down payment requirement. Relaxing the LTV criteria. In 2015, OJK relaxed the stringent LTV regulation to stimulate the sluggish economic growth. OJK has further relaxed the minimum down payment requirement in May 2016 by issuing circular letter OJK NO.47/SEOJK.05/2016. With the new regulation, the minimum down payment was relaxed to as low as 5% for multi-finance companies with NPLs lower than 1%. This is a significant relaxation compared with the previous regulation which required 15%-20% down payment.
Multi-finance companies: Minimum down payment regulation changes
Current Regulation Previous Regulation
NPF ≤ 5% NPF>5% For Syariah Entity
Before June 2015 Vehicle NPF ≤
1% 1%<NPF ≤3%
3%<NPF ≤5%
NPF ≤ 5%*
NPF>5% Conv. Syariah Conv. Syariah
2W 5% 10% 15% 15% 20% 15% 10% 20% 15% 15% 20%
4W - Productive 5% 10% 15% 15% 20% 15% 15% 20% 20% 15% 20%
4W - Consumptive 5% 10% 15% 20% 25% 20% 20% 25% 25% 20% 25%
Source: OJK, DBS Bank, DBSVI *For companies who do not meet the minimum financial health
Regulatory framework of the multi-finance companies
Source: Indonesian Multi-finance Companies Association (APPI/Asosiasi Perusahaan Pembiayaan Indonesia)

Industry Focus
Page 22
Multi-finance companies: How regulatory changes affected financing growth in the multi-finance industry
Source: BI, OJK, DBS Bank, DBSVI
-5%
0%
5%
10%
15%
20%
25%
30%
35%
40%
Feb-
11
Apr
-11
Jun-
11
Au g
-11
Oct
-11
Dec
-11
Feb-
12
Apr
-12
Jun-
12
Au g
-12
Oct
-12
Dec
-12
Feb-
13
Apr
-13
Jun-
13
Au g
-13
Oct
-13
Dec
-13
Feb-
14
Apr
-14
Jun-
14
Au g
-14
Oct
-14
Dec
-14
Feb-
15
Apr
-15
Jun-
15
Au g
-15
Oct
-15
Dec
-15
Feb-
16
Apr
-16
Jun-
16
Aug
-16
Oct
-16
Dec
-16
Feb-
17
In March 2012, BI implemented minimum down payment of 25% for 2W, and 30% for non-commercial 4W.
In June 2015, BI relaxed minimum down payment to 15% for 2W and 20% for non-commercial 4W.
OJK issued 29/POJK.05/2014 which enabled MFCsto disburse mutipurpose and infrastructure financing
Further relaxation of down payment regulation. Miniimumdown payment can be as low as 5%, depends on NPL level

Industry Focus
Page 23
Valuation and recommendation
Trading at a discount to banks. The listed multi-finance companies are trading at a significant discount to the banks despite the fact that most of them have superior ROE. The strong and established ones such as BFIN and ADMF have much better NIM which compensates for their higher operating costs and credit costs. This translates into higher ROE levels. Some other good names such as ASDF, BCAF, MTF and FIF are not listed. The listed multi-finance companies are trading at a significant discount compared to the banks. On average, the listed multi-finance companies trade at 0.8x FY16 BV vs banks‘ 1.3x FY16 BV. We have used historical BV as most of the other listed multi-finance companies do not have consensus forecasts. Upside is attractive but discount with the banks will still prevail. We highlight that multi-finance companies generally have riskier business models as well as governance issues. Furthermore, there are also views that multi-finance companies can still enjoy their current niche position because the banks are still getting good margins from the bigger ticket size loans. This means that the banks (without any multi-finance companies as subsidiaries or associates) could decide to enter the financing business if they want to. The gap in regulatory supervisory and corporate governance will narrow. The regulators have been proactively issuing supportive regulations for multi-finance companies. Recently, OJK has pushed for multi-finance companies to adopt NPL recognition and provisioning policies that are similar to banks’. Going forward, we would not discount the possibility of the introduction of more uniformed regulations vis-à-vis banks, including capital requirements. BFIN (BUY, TP Rp5,000) is our top pick. We like BFIN for its unique business model that has proven to be resilient even during economic downturns. It has a strong value proposition that is supported by its back-end processes, which enables it to expand into the refinancing business. BFIN is currently underleveraged with a net gearing of below 2x, much lower than the industry average and regulatory limit. We believe that its currently high ROE of c.20% can further improve if it decides to gear up and grow more aggressively, albeit prudently. CFIN (HOLD, TP Rp 300) has a lot of potential. CFIN offers a wider range of financing products: leasing, consumer financing (mostly used cars), and factoring. Recently, it is expanding its new 4W financing business by teaming up with its bank parent
(Panin Bank) through a channelling arrangement. CFIN is also underleveraged with a gearing ratio of below 1x and still has ample of room to grow. Indirect plays via banks for unlisted multi-finance companies: Bank Central Asia (BBCA) – BCAF. BCAF’s business is
mainly in new 4W financing, with some used 4W financing. It targets the top-tier customers with lower risk by offering very competitive pricing. It uses BBCA’s balance sheet through a joint-financing arrangement with low cost of funds, which translates into lower pricing for the products offered.
Bank Mandiri (BMRI) – MTF. MTF is consistently growing market share for its new 4W financing business, thanks to the strong synergies with its bank and dealer parentage.
Bank Danamon (BDMN) – ADMF. ADMF has a strong track record, brand name, and network across Indonesia. It had previously focused on the 2W financing business and 4W commercial segment. However, its new 4W financing business is gaining importance as ADMF is trying to rebalance its business portfolio following the weak commercial and 2W performance in the past few years. ADMF also derives a lot of synergies with its bank parent (BDMN) in terms of cross-selling bank, insurance, and financing products.
Astra International’s gold mine – ASDF, FIF, and TAFS. ASDF, FIF, and Toyota Astra Financial Services (TAFS) are the subsidiaries of the Astra Group and part of its automotive business value chain. They mostly offer Astra-related brands such as Toyota and Daihatsu for 4W and Honda for 2W. Both ASDF and FIF are the market leaders in the new 4W and 2W financing space, thanks to the support of the Astra Group which has also been performing well in the past few years. Opportunities among multi-finance companies. We believe they are opportunities for the smaller multi-finance players, both organic and inorganic, in this current operating environment. For example, when Bank Maybank Indonesia (BNII) sold WOM Finance (WOMF) to Reliance Group, WOMF’s share price spiked up by 43%. Key concern: Stock liquidity. The main concern investors may have is the limited stock liquidity. The size of these companies is also much smaller compared to the banks. Key risks for the sector. Weakening automotive business and lower commodity prices. A spike in inflation can also erode the purchasing power of middle- to low-income earners which are the main customers of multi-finance companies.

Industry Focus
Page 24
A. Valuation tables
Multi-finance companies: Peer valuation table (listed and under coverage) Banking Group Market
cap Price Target
Price Rating PE (x)
CAGR PBV (x)
ROE (%) Net div
(%)
(US$m) (Rp/s) (Rp/s) FY16A FY17F FY18F ^ (%) FY16A FY17F FY18F FY17F FY17F
BFI Finance 494 4,100 5,000 BUY 6.7x 5.5x 0.0x 12.6 1.6x 1.5x 1.4x 19.7 6.0
Clipan Finance 90 298 300 HOLD 3.6x 5.1x 0.0x 22.5 0.3x 0.3x 0.3x 7.5 0.0
Simple average 5.2x 5.3x 0.0x 17.5 1.0x 0.9x 0.8x 13.6 3.0
^ Refers to 2-year EPS CAGR for FY16-18F
Multi-finance companies: Peer valuation table (listed but not under coverage) Banking Group Market
cap Price PE (x)
CAGR PBV (x)
ROE (%) Net div
(%)
(US$m) (Rp/s) FY14A FY15A FY16A ^ (%) FY14A FY15A FY16A FY16A FY16A
Adira Finance 471 6,625 8.4 10.0 6.6 13% 1.64 1.52 1.33 21.6 5.0
Buana Finance 109 880 13.1 23.4 27.1 -31% 1.31 1.34 1.32 4.9 2.0
Batavia Prosperindo 60 500 12.4 16.3 20.1 -21% 1.56 1.36 1.35 6.8 4.4
Radana Bhaskara 56 320 14.4 15.2 n.m -98% 1.73 1.50 0.01 0.0 1.1
Indomobil Multi Jasa 100 308 10.7 16.4 9.7 5% 0.79 0.75 0.20 2.1 -
Mandala Multifinance 148 1,485 6.4 8.0 7.7 -9% 1.42 1.23 1.09 15.0 1.3
Tifa Finance 11 140 4.2 7.5 8.6 -30% 0.53 0.51 0.49 5.8 5.0
Verena Multi Finance 9 113 4.6 46.9 17.5 -49% 0.40 0.40 0.39 2.3 -
Wahana Ottomitra 53 202 11.7 43.3 11.7 0% 0.82 0.93 0.86 7.7 -
Simple average 9.5 20.8 13.6 -20% 1.1 1.1 0.8 7.3 2.1
^ Refers to 2-year EPS CAGR for FY14-16A
Indonesian Banks: Peer valuation table
Banking Group Market
cap Price Target Price Rating PE (x) CAGR PBV (x)
ROE (%)
Net div (%)
(US$m) (Rp/s) (Rp/s) FY16A FY17F FY18F ^ (%) FY16A FY17F FY18F FY17F FY17F
Bank Central Asia 32,252 17,350 18,400 BUY 20.7x 16.6x 14.5x 19.7 3.8x 3.2x 2.7x 21.0% 1.4%
Bank Danamon 3,447 4,770 5,900 BUY 14.6x 10.7x 8.5x 30.7 1.3x 1.2x 1.1x 11.2% 1.8%
Bank Mandiri 20,496 11,650 12,800 HOLD 19.7x 13.1x 9.8x 41.8 1.8x 1.7x 1.5x 13.4% 2.3%
Bank Negara Indonesia 8,823 6,275 6,600 HOLD 10.3x 9.3x 7.9x 14.3 1.3x 1.2x 1.1x 13.7% 2.9%
Bank Rakyat Indonesia 23,622 12,700 15,000 BUY 11.9x 10.7x 9.6x 11.2 2.1x 1.8x 1.6x 18.4% 2.8%
Bank Tabungan Negara 1,820 2,280 2,300 HOLD 9.0x 7.9x 7.3x 11.0 1.2x 1.1x 1.0x 14.9% 3.3% Bank Tabungan Pensiunan Nasional 1,154 2,620 3,500 BUY 8.5x 9.5x 8.8x -2.0 0.9x 0.8x 0.8x 9.3% 0.0%
Panin Bank 1,689 930 1,100 BUY 9.3x 8.4x 7.4x 12.5 0.7x 0.7x 0.6x 8.1% 0.0%
Weighted average 16.5x 13.0x 11.0x 21.7 2.5x 2.1x 1.9x 17.1% 2.1%
Simple average 13.0x 10.8x 9.2x 17.4 1.7x 1.5x 1.3x 13.8% 1.8%
Weighted average (ex BBCA) 14.2x 11.1x 9.2x 22.8 1.8x 1.6x 1.4x 15.1% 2.5%
Simple average (ex BBCA) 11.9x 10.0x 8.5x 17.1 1.3x 1.2x 1.1x 12.7% 1.9%
^ Refers to 2-year EPS CAGR for FY16-18F Closing price as of 13 April 2017 Source: Companies, Bloomberg Finance L.P., DBS Bank, DBSVI

Industry Focus
Page 25
B. P/BV bands
Multi-finance companies: Forward P/BV bands (listed and under coverage)
P/BV band: BFI Finance (BFIN)
P/BV band: Clipan Finance (CFIN)
Source: Companies, Bloomberg Finance L.P., DBS Bank, DBSVI Multi-finance companies: Historical P/BV bands (listed but not under coverage)
P/BV band: Adira Finance (ADMF)
P/BV band: Buana Finance (BBLD)
P/BV band: Batavia Prosperindo (BPFI)
Source: Companies, Bloomberg Finance L.P., DBS Bank, DBSVI n
P/BV band: WOM Finance (WOMF)
Mean, 1.02
+1SD, 1.16
+2SD, 1.29
-1SD, 0.88
-2SD, 0.75
0.6
0.8
1.0
1.2
1.4
1.6
12 13 14 15 16 17
P BV (X)
Mean, 0.45
+1SD, 0.60
+2SD, 0.74
-1SD, 0.31
-2SD, 0.16
0.0
0.1
0.2
0.3
0.4
0.5
0.6
0.7
0.8
0.9
12 13 14 15 16 17
PBV (X)
Mean, 1.61
+1SD, 2.23
+2SD, 2.85
-1SD, 0.98
-2SD, 0.36
0.0
0.5
1.0
1.5
2.0
2.5
3.0
3.5
12 13 14 15 16 17
P BV (X)
0.63
0.83
1.04
0.42
0.21
0.0
0.2
0.4
0.6
0.8
1.0
1.2
Apr-1
2
Oct-1
2
Apr-1
3
Oct-1
3
Apr-1
4
Oct-1
4
Apr-1
5
Oct-1
5
Apr-1
6
Oct-1
6
Apr-1
7
(x)
3.18
3.99
4.80
2.37
1.55
0.0
1.0
2.0
3.0
4.0
5.0
6.0
7.0
8.0
Apr-1
2
Oct-1
2
Apr-1
3
Oct-1
3
Apr-1
4
Oct-1
4
Apr-1
5
Oct-1
5
Apr-1
6
Oct-1
6
Apr-1
7
(x)
0.77
1.10
1.43
0.44
0.11
-0.1
0.1
0.3
0.5
0.7
0.9
1.1
1.3
1.5
Apr-1
2
Oct-1
2
Apr-1
3
Oct-1
3
Apr-1
4
Oct-1
4
Apr-1
5
Oct-1
5
Apr-1
6
Oct-1
6
Apr-1
7
(x)

Industry Focus
Page 26
P/BV band: Radana Bhaskara Finance (HDFA)
P/BV band: Indomobil Multi Jasa (IMJS)
P/BV band: Mandala Multifinance (MFIN)
P/BV band: Tifa Finance (TIFA)
P/BV band: Verena Multi Finance (VRNA)
Source: Companies, Bloomberg Finance L.P., DBS Bank, DBSVI
1.22
1.52
1.82
0.91
0.61
0.0
0.5
1.0
1.5
2.0
2.5
Apr-12
Oct-12
Apr-13
Oct-13
Apr-14
Oct-14
Apr-15
Oct-15
Apr-16
Oct-16
Apr-17
(x)
0.0
0.5
1.0
1.5
2.0
2.5
Apr-14
Oct-14
Apr-15
Oct-15
Apr-16
Oct-16
Apr-17
(x)
0.79
1.12
1.45
0.47
0.14 0.0
0.2
0.4
0.6
0.8
1.0
1.2
1.4
1.6
Apr-12
Oct-12
Apr-13
Oct-13
Apr-14
Oct-14
Apr-15
Oct-15
Apr-16
Oct-16
Apr-17
(x)
0.83
1.13
1.42
0.53
0.23
0.0
0.2
0.4
0.6
0.8
1.0
1.2
1.4
1.6
1.8
2.0
Apr-12
Oct-12
Apr-13
Oct-13
Apr-14
Oct-14
Apr-15
Oct-15
Apr-16
Oct-16
Apr-17
(x)
0.47
0.61
0.74
0.34
0.20
0.0
0.1
0.2
0.3
0.4
0.5
0.6
0.7
0.8
0.9
Apr-1
2
Oct-1
2
Apr-1
3
Oct-1
3
Apr-1
4
Oct-1
4
Apr-1
5
Oct-1
5
Apr-1
6
Oct-1
6
Apr-1
7
(x)

Industry Focus
Page 27
Company Guides

ASIAN INSIGHTS VICKERS SECURITIES ed: JS / sa: MA, PY
BUY Last Traded Price ( 6 Apr 2017): Rp4,200 (JCI : 5,680.20) Price Target 12-mth: Rp5,000 (19% upside) (Prev Rp3,700) Potential Catalyst: Stronger-than-expected growth; potential M&A Where we differ: We are the only house covering the stock Analyst Sue Lin LIM +65 8332 6843 [email protected] Benedictus Agung SWANDONO +6221 3003 4935 [email protected]
What’s New Strong deliveries in FY16 with positive outlook FY16 earnings were 11% higher than our estimate
on stronger-than-expected receivable growth Non-dealer business maintains positive traction Maintain BUY with higher TP of Rp5,000 while
FY17F/18F earnings are lifted by 8%/9%
Price Relative
Forecasts and Valuation FY Dec (Rpbn) 2016A 2017F 2018F 2019F Pre-prov. Profit 1,298 1,437 1,645 1,855 Net Profit 798 884 1,018 1,150 Net Pft (Pre Ex.) 798 884 1,018 1,150 Net Pft Gth (Pre-ex) (%) 22.8 10.7 15.1 13.0 EPS (Rp) 509 561 646 730 EPS Pre Ex. (Rp) 509 561 646 730 EPS Gth Pre Ex (%) 22 10 15 13 Diluted EPS (Rp) 507 561 646 730 PE Pre Ex. (X) 8.2 7.5 6.5 5.8 Net DPS (Rp) 210 253 281 323 Div Yield (%) 5.0 6.0 6.7 7.7 ROAE Pre Ex. (%) 19.3 19.7 20.2 21.6 ROAE (%) 19.3 19.7 20.2 21.6 ROA (%) 6.6 6.7 6.9 7.1 BV Per Share (Rp) 2,700 3,008 3,373 3,373 P/Book Value (x) 1.6 1.4 1.2 1.2 Earnings Rev (%): 8 9 N/A Consensus EPS (Rp): 518 595 N/A Other Broker Recs: B: 1 S: 0 H: 0
Source of all data on this page: Company, DBS Bank, DBSVI, Bloomberg Finance L.P.
Maintaining positive momentum Strong deliveries; maintain BUY. BFI Finance (BFIN) stands out as one of the best performers among its peers with double-digit earnings growth, coupled with a stable non-performing loan (NPL) ratio. This was despite the dismal performance of the Indonesian multi-finance industry amid the soft economy and asset-quality deterioration. BFIN’s strategy to put more weight on refinancing since 2015 has paid off since demand had slowed for heavy equipment and dealer financing. Its excellent back-end capability is a strong foundation for its refinancing business. We nudged up our earnings by 8%/9% for FY17F/18F and accordingly our TP to 5,000 after we imputed higher assumptions for receivable growth and net interest margin (NIM).
Maintain positive momentum in 4Q16. BFIN's FY16 net profit of Rp798bn (+23%y-o-y) represented 111% of our full-year estimate. The performance was underpinned by a strong 4Q16 net profit of Rp245bn (+15% q-o-q; +25% y-o-y). Total receivables grew 16.7% y-o-y, driven by the strong momentum in non-dealer financing (+23% y-o-y). Fee income grew strongly and opex was kept in check. NPL inched down to 0.91%.
Unique business model is its key asset. Despite remaining cautious on the multi-finance industry, we are more positive on BFIN’s outlook. Our preference for BFIN over Clipan Finance (CFIN; HOLD), the other multi-finance company we cover, is due to its proven resilience and unique direct financing model. BFIN is also expected to maintain a generous dividend payout policy of around 48%, thus implying an attractive dividend yield.
Valuation:
Maintain BUY. We raised our TP to Rp5,000 after we revised up our FY17F/18F earnings by 8%/9% and imputed a lower risk free rate assumption of 8%. Our TP is based on Gordon Growth Model – 19% ROE, 9% growth rate, and 15.2% cost of equity – and this implies 1.6x FY17F BV. Key Risks to Our View:
Tougher competition may hamper profitability. Sustained weakness in the commodity and automotive markets may also drag down growth and erode asset quality. At A Glance Issued Capital (m shrs) 1,597 Mkt. Cap (Rpbn/US$m) 6,706 / 503 Major Shareholders (%) Trinugraha Capital & Co (%) 43.7 Fil Ltd (%) 0.7 Commonwealth Bank (%) 0.2
Free Float (%) 55.4 3m Avg. Daily Val (US$m) 0.01 ICB Industry : Financials / General Financial
DBS Group Research . Equity 7 Apr 2017
Indonesia Company Guide
BFI Finance Ind Version 5 | Bloomberg: BFIN IJ | Reuters: BFIN.JK Refer to important disclosures at the end of this report

ASIAN INSIGHTS VICKERS SECURITIES Page 25
Company Guide
BFI Finance Ind
WHAT’S NEW
Maintaining positive momentum
Highlights
Strong 4Q16 earnings. BFIN's FY16 net profit of Rp798bn (23%y-o-y) represented 111% of our full-year estimate on stronger-than-expected receivable growth and fee income. 4Q16 net profit came in at Rp245bn (+15%q-o-q; +25%y-o-y).
Higher spreads from higher asset yield; strong fee income. Interest spread increased 65bps y-o-y mainly due to higher asset yields from a higher proportion of non-dealer financing. Fee income grew 15.8%, mainly driven by strong new bookings and receivable growth
Operating costs and credit costs kept in check. Operating costs rose 8% y-o-y with cost-to-income ratio inching up 17bps to 47%. The efficiency ratio was kept in check despite the aggressive expansion of 38 new outlets to 305 outlets nationwide. Credit costs, however, were lower at 1.8% (vs 2.17% in FY15).
Strong receivable growth driven by refinancing business. Total receivables grew 16.7% y-o-y, faster than the growth of managed receivables at 6.5%, mainly due to a lower portion of off-balance sheet joint-financing. The strong growth was driven by strong non-dealer financing growth at 23% y-o-y. Despite the non-dealer financing portion hitting its targeted 50% mark, management is maintaining its focus on this segment and does not rule out the possibility of further expansion.
Lower NPL mainly due to higher write-offs due to change in write-off policy. NPL improved to 0.91% from 1.33% a year ago, helped by a higher write-off rate (gross write-off rate of 2.15% from 1.83% in 2015). On a quarterly basis, its write-off rate spiked from 1.67% in 9M16 due to change in the write-off policy to 210 days overdue from the previous 270 days overdue.
Tax rate normalised. BFIN booked tax provisions in 1H16 to cushion against potential additional tax expenses from the undergoing tax investigation. However, it has stopped booking these tax provisions in 2H16 and the tax rate for FY16 has normalised to c.20% from 26% previously.
Gearing ratio remained low at 1.76x. Gearing ratio is slightly higher at 1.76x from 1.63x the previous year. But the gearing level is way below the regulated 10x level.
Outlook
Management maintains positive outlook; aggressive branch expansion. Management is maintaining its positive outlook, which is fuelled by its optimism in the refinancing business. It is planning to add 50 additional outlets (mostly in Java, Sumatera, Bali, and East Timor). Going forward, management targets 20% new bookings growth, driven by non-dealer financing.
More optimistic on the leasing business; staying away from new 4W financing. Management is more optimistic on the leasing business this year compared to last year. The recent improvement in commodity prices has prompted management to expand in the commodity-driven regions such as Sumatera. The leasing will be driven by smaller-ticket machineries with an average duration of 15-18 months while waiting for demand for heavy equipment machineries to pick up.
Expect asset quality to stabilise. Management expects asset quality to stabilise towards the normal c.1.2% level (higher than last year’s 0.93%), aided by improving commodity prices. Elsewhere, management has guided for credit cost to remain stable (with a maximum increase of 10bps). The recent change of write-off policy to 210 days overdue (from 270 days) should not affect its credit cost. By regulation, multi-finance companies have to set aside 100% provisions for loans that are 180 days overdue.
Expecting higher opex. Higher opex may come from rapid branch expansion and also improvements in system and technology.
NIM to remain elevated. The high NIM should be supported by greater contribution of non-dealer financing (which offers higher asset yields compared to 4W). The recent rating upgrade by Fitch may also allow BFIN to price its bond at a lower rate.
Valuation and recommendation
Maintain BUY. We raised our TP to Rp5,000 after revising up our FY17F/18F earnings by 8%/9% and imputed a lower risk free rate assumption of 8%. Our TP is based on Gordon Growth Model – 19% ROE, 9% growth rate, and 15.2% cost of equity – and this implies 1.6x FY17F BV.

ASIAN INSIGHTS VICKERS SECURITIES Page 3,
Company Guide
BFI Finance Ind
Quarterly / Interim Income Statement (Rpbn)
FY Dec 4Q2015 3Q2016 4Q2016 % chg yoy % chg qoq FY2015 FY2016 % chg yoy
Net Interest Income 373 413 441 18.4 6.8 1,447.9 1,629.7 13%
Non-Interest Income 185 193 228 23.2 17.9 670.6 805.1 20%
Operating Income 557 606 669 20.0 10.3 2,118.5 2,434.8 15% Operating Expenses (260) (268) (311) 19.9 16.1 (1,052.8) (1,136.5) 8%
Pre-Provision Profit 298 338 358 20.0 5.8 1,065.6 1,298.3 22%
Provisions (27.1) (81.2) (51.3) 89.3 (36.9) (230.2) (273.3) 19%
Associates 0.0 0.0 0.0 nm nm - - nm
Exceptionals 0.0 0.0 0.0 nm nm - - nm
Pretax Profit 271 257 306 13.1 19.3 835.5 1,025.0 23%
Taxation (75.3) (43.4) (61.6) (18.2) 41.8 (185.2) (226.6) 22%
Minority Interests 0.0 0.0 0.0 nm nm - nm
Net Profit 196 213 245 25.2 14.7 650.3 798.4 23%
Growth (%)
Net Interest Income Gth 1.9 3.5 6.8
Net Profit Gth 24.3 18.2 14.7
Key ratio (%)
NIM 15.3 15.5 15.7
NPL ratio 1.1 1.4 0.7
Cost-to-income 46.6 44.2 46.5
Source of all data: Company, DBS Bank, DBSVI

ASIAN INSIGHTS VICKERS SECURITIES Page /-
Company Guide
BFI Finance Ind
CRITICAL DATA POINTS TO WATCH
Earnings Drivers:
Strong growth of non-dealer financing. Managed receivables (on and off balance sheet) grew 6.5% last year while total receivables (balance sheet only) grew 16.7%, driven by strong non-dealer financing and a lower portion of off-balance sheet financing. Looking at the improvement in asset quality last year, management indicated that it is comfortable to take on more risk this year and has guided for c.20% increase of new bookings but with a lower financing duration. We expect the strong growth momentum in the non-dealer business, along with the improvement in the commodity-related business, to support a sustainable 12%-13% loan growth going forward. Diverse products. BFIN offers a variety of products including dealer new/used 4W financing, as well as non-dealer 4W and 2W financing. There are also heavy equipment and machinery leasing. However, management will continue to focus on the non-dealer financing business with the portfolio targeted to be maintained at the current 50% level. Possible NIM improvement. Further expansion in the non-dealer business can increase asset yield further. The yields from non-dealer 4W and 2W financing can be up to 20% and 40%, respectively, much higher than dealer financing yields of 15-16%. Elsewhere, the bond rating upgrade from Fitch and lower interest rate environment may enablep BFIN to lower its cost of funds further. Non-interest income supported by financing growth. About 60% of BFIN’s non-interest income is upfront fees worth 2-3% of loan size, while 40% are other fees such as late and transaction penalty charges. NPL and credit cost to stabilise. We believe NPL and credit cost can be maintained at current levels, as the economy and automotive market should stabilise this year. We expect NPL to hover around 1.2%, while credit cost should be flattish. Higher opex due to expansion. We expect higher operating expenses to stem from its aggressive expansion plan. Last year, BFIN added 38 new outlets to the 267 existing outlets across the nation (14% growth y-o-y). This year, it targets to add 35-50 outlets.
Margin Trends
Gross Loan & Growth
Loan-to-Deposit Ratio Trend
Cost & Income Structure
Source: Company, DBS Bank, DBSVI

ASIAN INSIGHTS VICKERS SECURITIES Page /.
Company Guide
BFI Finance Ind
Balance Sheet:
Funding is not an issue. Funding is not an issue this year as BFIN continues to utilise bond issuances and bank borrowings. Currently, bonds contribute c.40% of the funding and no significant change is expected. USD debt exposures are about 30% of its total debt and are fully hedged. NPLs should stabilise. Management expects NPL to be stable at around c.1.2% level. The company recently changed its write -off policy on its automotive loans to 210 days overdue from 270 days previously. Gearing ratio remains low. The company’s gearing ratio has been at 1.4-1.8x historically. BFIN is well-capitalised and carries low solvency risk. Going forward, management expects the gearing ratio to be at 1.5-2.0x. Share Price Drivers:
Near-term resilience will support valuation; M&A will boost multiples over the long term. BFIN’s diversified portfolio and unique direct financing business will continue to deliver sustainable earnings in the long term. BFIN is also an attractive M&A target given its cheap valuation, and also that it is one of the few sizeable multi-finance companies not directly backed by a bank. Key Risks:
Upside risk from sustained high commodity prices. Sustained high commodity prices can support demand for leasing. Leasing usually has a higher ticket size and longer duration compared to non-dealer financing. Thus, leasing could be a significant addition to receivable growth. Slower-than-expected growth; more intense competition. The slower growth of consumer financing would be a downside risk to our forecast. Tougher competition can also lower yields and erode NIM. Company Background
BFI Finance (BFIN) is a financing company that focuses on consumer financing, both dealer generated and direct lending. The major shareholder with a 44.95% stake is a consortium comprising TPG Capital, Northstar Equity Partners and Boy Garibaldi Thohir.
Asset Quality
ROE (%)
Forward PE Band (x)
PB Band (x)
Source: Company, DBS Bank, DBSVI

ASIAN INSIGHTS VICKERS SECURITIES Page //
Company Guide
BFI Finance Ind
Key Assumptions
FY Dec 2015A 2016A 2017F 2018F 2019F
Gross Loans Growth 15.6 16.8 11.9 12.0 13.2 Yld. On Earnings Assets 17.6 18.4 19.6 19.5 19.6 Avg Cost Of Funds 11.1 10.6 10.9 10.7 10.7 Income Statement (Rpbn)
FY Dec 2015A 2016A 2017F 2018F 2019F Net Interest Income 1,448 1,630 1,872 2,151 2,444 Non-Interest Income 671 805 886 992 1,111
Operating Income 2,119 2,435 2,758 3,143 3,555 Operating Expenses (1,053) (1,137) (1,321) (1,498) (1,700)
Pre-provision Profit 1,066 1,298 1,437 1,645 1,855 Provisions (230) (273) (318) (357) (399) Associates 0.0 0.0 0.0 0.0 0.0 Exceptionals 0.0 0.0 0.0 0.0 0.0
Pre-tax Profit 836 1,025 1,119 1,288 1,455 Taxation (185) (227) (235) (271) (306) Minority Interests 0.0 0.0 0.0 0.0 0.0 Preference Dividend 0.0 0.0 0.0 0.0 0.0
Net Profit 650 798 884 1,018 1,150 Net Profit bef Except 650 798 884 1,018 1,150 Growth (%) Net Interest Income Gth 12.1 12.6 14.9 14.9 13.6 Net Profit Gth 8.9 22.8 10.7 15.1 13.0
Margins, Costs & Efficiency (%) Spread 6.6 7.8 8.7 8.8 8.9 Net Interest Margin 11.8 12.4 13.3 13.4 13.4 Cost-to-Income Ratio 49.7 46.7 47.9 47.7 47.8
Business Mix (%) Net Int. Inc / Opg Inc. 68.3 66.9 67.9 68.4 68.8 Non-Int. Inc / Opg inc. 31.7 33.1 32.1 31.6 31.2 Fee Inc / Opg Income 25.6 29.2 28.4 27.9 27.6 Oth Non-Int Inc/Opg Inc 6.1 3.9 3.8 3.7 3.6
Profitability (%) ROAE Pre Ex. 17.0 19.3 19.7 20.2 21.6 ROAE 17.0 19.3 19.7 20.2 21.6 ROA Pre Ex. 6.1 6.6 6.7 6.9 7.1 ROA 6.1 6.6 6.7 6.9 7.1
Source: Company, DBS Bank, DBSVI
NIM improvement due to better funding mix
Cost to income ratio slightly higher due to branch expansion

ASIAN INSIGHTS VICKERS SECURITIES Page /0
Company Guide
BFI Finance Ind
Quarterly / Interim Income Statement (Rpbn)
FY Dec 4Q2015 1Q2016 2Q2016 3Q2016 4Q2016 Net Interest Income 373 377 399 413 441 Non-Interest Income 185 185 200 193 228
Operating Income 557 561 599 606 669 Operating Expenses (260) (269) (288) (268) (311)
Pre-Provision Profit 298 292 311 338 358 Provisions (27.1) (74.6) (66.3) (81.2) (51.3) Associates 0.0 0.0 0.0 0.0 0.0 Exceptionals 0.0 0.0 0.0 0.0 0.0
Pretax Profit 271 218 245 257 306 Taxation (75.3) (57.5) (64.1) (43.4) (61.6) Minority Interests 0.0 0.0 0.0 0.0 0.0
Net Profit 196 160 180 213 245 Growth (%) Net Interest Income Gth 1.9 1.1 5.9 3.5 6.8 Net Profit Gth 24.3 (18.2) 12.8 18.2 14.7
Balance Sheet (Rpbn)
FY Dec 2015A 2016A 2017F 2018F 2019F Cash/Bank Balance 777 165 283 625 40.0 Government Securities 0.0 0.0 0.0 0.0 0.0 Inter Bank Assets 0.0 0.0 0.0 0.0 0.0 Total Net Loans & Advs. 9,898 11,583 12,856 14,291 16,079 Investment 0.0 0.0 0.10 0.0 0.0
Associates 0.0 0.0 0.0 0.0 0.0 Fixed Assets 450 414 415 414 411 Goodwill 0.0 0.0 0.0 0.0 0.0 Other Assets 645 313 313 313 313
Total Assets 11,770 12,476 13,868 15,643 16,843 Customer Deposits 0.0 0.0 0.0 0.0 0.0 Inter Bank Deposits 0.0 0.0 0.0 0.0 0.0 Debts/Borrowings 7,318 7,656 8,656 9,856 11,056 Others 434 565 472 472 472 Minorities 0.0 0.0 0.0 0.0 0.0 Shareholders' Funds 4,019 4,255 4,740 5,315 5,315
Total Liab& S/H’s Funds 11,770 12,476 13,868 15,643 16,843
Source: Company, DBS Bank, DBSVI
Strong receivable growth to continue
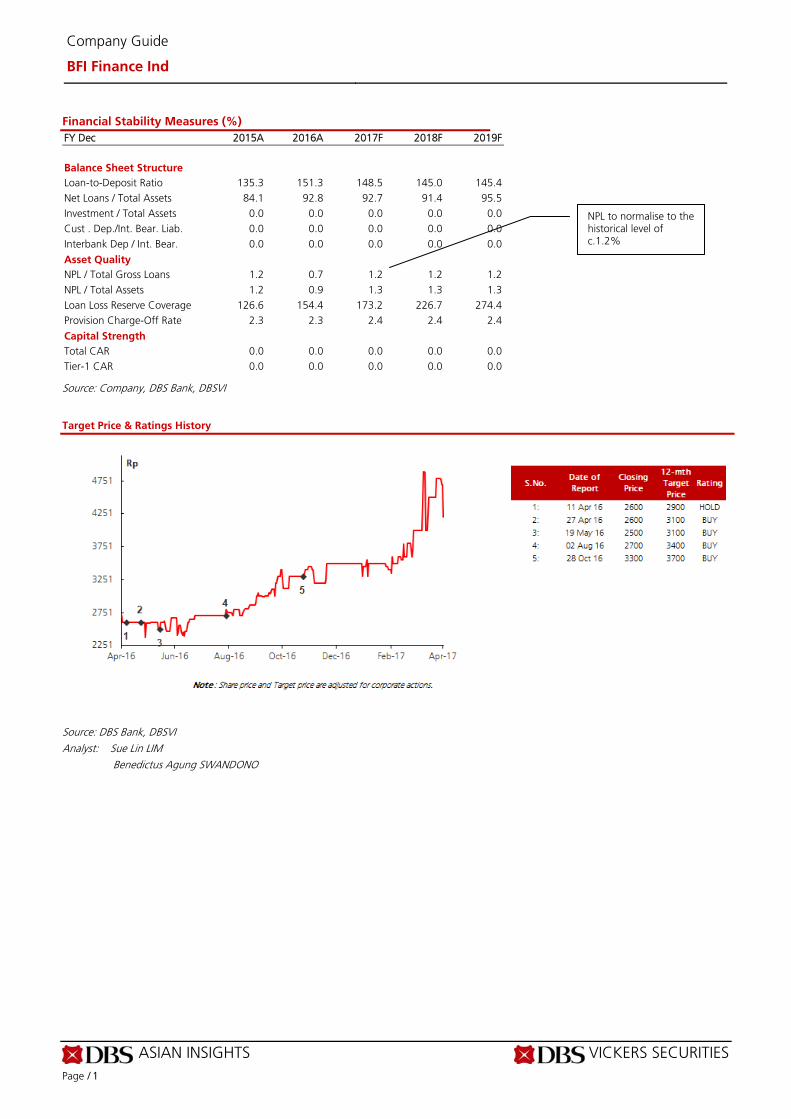
ASIAN INSIGHTS VICKERS SECURITIES Page /1
Company Guide
BFI Finance Ind
Financial Stability Measures (%)
FY Dec 2015A 2016A 2017F 2018F 2019F Balance Sheet Structure Loan-to-Deposit Ratio 135.3 151.3 148.5 145.0 145.4 Net Loans / Total Assets 84.1 92.8 92.7 91.4 95.5 Investment / Total Assets 0.0 0.0 0.0 0.0 0.0 Cust . Dep./Int. Bear. Liab. 0.0 0.0 0.0 0.0 0.0 Interbank Dep / Int. Bear. 0.0 0.0 0.0 0.0 0.0
Asset Quality NPL / Total Gross Loans 1.2 0.7 1.2 1.2 1.2 NPL / Total Assets 1.2 0.9 1.3 1.3 1.3 Loan Loss Reserve Coverage 126.6 154.4 173.2 226.7 274.4 Provision Charge-Off Rate 2.3 2.3 2.4 2.4 2.4
Capital Strength Total CAR 0.0 0.0 0.0 0.0 0.0 Tier-1 CAR 0.0 0.0 0.0 0.0 0.0
Source: Company, DBS Bank, DBSVI
Target Price & Ratings History
Source: DBS Bank, DBSVI
Analyst: Sue Lin LIM
Benedictus Agung SWANDONO
NPL to normalise to the historical level of c.1.2%

ASIAN INSIGHTS VICKERS SECURITIES ed: CK / sa: MA, PY
HOLD Last Traded Price ( 11 Apr 2017): Rp296 (JCI : 5,627.90) Price Target 12-mth: Rp300 (1% upside) (Prev Rp250) Potential Catalyst: Sustained high commodity prices Where we differ: We are the only house that covers the stock Analyst
Sue Lin LIM +65 8332 6843 [email protected] Benedictus Agung SWANDONO +6221 3003 4935 [email protected]
What’s New
Slow growth, dragged by leasing and factoring
business, will likely persist Better-than-expected FY16 earnings on higher-
than-expected NIM Expanding its new 4W financing business Maintain HOLD with higher TP of Rp300/share
Price Relative
Forecasts and Valuation FY Dec (Rpbn) 2016A 2017F 2018F 2019F Pre-prov. Profit 511 585 620 669 Net Profit 205 297 308 375 Net Pft (Pre Ex.) 205 297 308 375 Net Pft Gth (Pre-ex) (%) (28.3) 44.4 3.8 21.8 EPS (Rp) 54.4 78.6 81.6 99.3 EPS Pre Ex. (Rp) 54.4 78.6 81.6 99.3 EPS Gth Pre Ex (%) (28) 44 4 22 Diluted EPS (Rp) 54.4 78.6 81.6 99.3 PE Pre Ex. (X) 5.4 3.8 3.6 3.0 Net DPS (Rp) 0.0 0.0 0.0 0.0 Div Yield (%) 0.0 0.0 0.0 0.0 ROAE Pre Ex. (%) 5.6 7.5 7.2 8.2 ROAE (%) 5.6 7.5 7.2 8.2 ROA (%) 3.1 4.2 4.1 4.6 BV Per Share (Rp) 1,006 1,085 1,167 1,266 P/Book Value (x) 0.3 0.3 0.3 0.2 Earnings Rev (%): (11) (18) N/A Consensus EPS (Rp): 59.0 78.0 N/A Other Broker Recs: B: 1 S: 0 H: 1
Source of all data on this page: Company, DBS Bank, DBSVI, Bloomberg Finance L.P.
Steering through headwinds Slow growth persists; HOLD. The leasing and factoring businesses contribute to 22% and 20% of CFIN’s portfolio, respectively, and are the main cause of its weak performance last year. This year, Clipan Finance (CFIN) is planning to expand its new 4W financing business by channelling Panin Bank’s 4W financing this year. We expect single-digit receivable growth this year while earnings recovery should mainly come from higher NIM. High credit cost should taper off over time. However, we expect higher operating costs due to the employee addition and branches expansion for the new 4W business. Hence, we cut our earnings by 11%/18% for 17F/18F accordingly but we bump up our TP to Rp300 to reflect a lower risk-free rate assumption of 8% (vs 8.5% previously). Better-than-expected 4Q16 earnings due to higher NIM. Net profit in FY16 came in at Rp205bn (-28% y-o-y), 23% higher than of our full-year earnings forecast mainly due to better-than-expected NIM, especially in 4Q16 where NIM spiked to 8.6% (vs 8% in 3Q16). However, slow loan growth (flat y-o-y), higher provisions (32% y-o-y) and higher opex (14% y-o-y) caused earnings to contract 28% y-o-y. NPL remained high at 3% (flat y-o-y) with credit cost higher at 3.6% vs 2.7% in FY15. Expanding 4W financing business. CFIN is teaming up with its parent, Panin Bank, to expand its new 4W financing business. CFIN will receive commission for every loan it underwrites but the loans will be on PNBN’s book. It has appointed a new director responsible for this business and targets to book Rp2.5tr 4W financing this year. CFIN is also planning to enter the refinancing business for 4W, in which it will give out multipurpose loans and take 4W as collateral. Higher operating costs from the new initiatives should be expected. Valuation: Despite the lower earnings forecast, we bump up our TP to Rp300 after imputing a lower risk-free rate assumption of 8% (vs 8.5% previously). Our TP (based on Gordon Growth Model – 8% ROE, 6% growth rate, and 14.5% cost of equity) implies 0.27x FY17 BV. Key Risks to Our View: Slow growth and deteriorating asset quality. A key risk would be slower-than-expected receivables growth and further deterioration of asset quality. Low commodity prices and slow realisation of infrastructure projects will also soften demand and increase NPL ratios for the leasing segment further. At A Glance Issued Capital (m shrs) 3,985 Mkt. Cap (Rpbn/US$m) 1,179 / 88.8 Major Shareholders (%) Bank Pan Indonesia TBK 54.4 Mackenzie Financial Corporation 13.8
Free Float (%) 31.9 3m Avg. Daily Val (US$m) 0.01 ICB Industry : Financials / General Financial
DBS Group Research . Equity 12 Apr 2017
Indonesia Company Guide
Clipan Finance Version 6 | Bloomberg: CFIN IJ | Reuters: CFIN.JK Refer to important disclosures at the end of this report
ASIAN INSIGHTS VICKERS SECURITIES Page 37
Company Guide
Clipan Finance
WHAT’S NEW
Waiting for the tide
Better-than-expected 4Q16 earnings due to higher NIM. Net profit in FY16 came in at Rp205bn (-28% y-o-y), 23% higher than of our full-year earnings forecast mainly due to better- than-expected NIM, especially in 4Q16 where NIM spiked to 8.6% (vs 8% in 3Q16). However, higher provisions (32% y-o-y) and higher opex (14% y-o-y) was a drag on earnings. NPL remained high at 3% (flat y-o-y) with credit cost higher at 3.6% vs 2.7% a year ago. Receivable is virtually flat with fund borrowings declining 6%y-o-y. Gearing stayed low at 0.7x (lower than 0.8x last year).
Improvement in leasing and factoring has yet to be seen. Despite the recent coal price improvement, management expects the business in the heavy equipment sector to remain challenging. The factoring business is also facing tough conditions with higher NPLs and write offs. Both the leasing and factoring businesses have become the main culprits behind CFIN’s weak performance in 2016. Management is planning to maintain a careful stance in these two areas. The underwriting standard in the leasing business has become more conservative than before.
New initiatives in consumer business. Management thinks that expansion is only feasible in the consumer business. The company plans to expand its new 4W financing business by channelling Panin Bank’s 4W financing. CFIN will receive commission for every loan it underwrites but the loans will be on PNBN’s book. It has appointed a new director responsible for this business and targets to book Rp2.5tr 4W financing this year.
Entering 4W refinancing business. Furthermore, CFIN is also planning to enter the refinancing business for 4W, in which it will give out multipurpose loans and take 4W as collateral. The refinancing business should yield c.17%, with estimated cost of fund at 9.5%, cost of credit 2%, and overhead cost at 2%.
Branch expansion and employee addition. CFIN would see personnel-related expenses at significantly higher levels this year, as it is planning to aggressively hire new staff to support its 4W financing and 4W refinancing business. Management has guided that the number of employees could rise to almost 2,000 from c.1,500 currently . In addition, CFIN is planning to add 10 new branches this year (from five per year previously).
Outlook
Expecting modest 7% receivable growth this year. Management has set a modest 7% receivable growth target – driven by the consumer financing segment. The newly introduced new 4W financing and used 4W refinancing will be the main driver in this segment.
Better NIM this year due to lower cost of funds. Cost of funds is expected to be lower this year as the banks have started to price down corporate loans following sustained low policy rates. Elsewhere, asset yield is expected to remain constant since multi-finance companies tend to compete on service rather than pricing. Therefore, we expect NIM to be higher this year.
Expecting higher operating costs. Aggressive branch expansion and employee addition should increase operating expenses this year. Management expects these operational costs to be the main drag on earnings.
Valuation and recommendation
Maintain HOLD, TP bumped up. Despite the lower earnings forecast, we bump our TP to Rp300 after imputing a lower risk-free rate assumption of 8% (vs 8.5% previously). Our TP (based on Gordon Growth Model – 8% ROE, 6% growth rate, and 14.5% cost of equity) implies 0.27x FY17 BV.

ASIAN INSIGHTS VICKERS SECURITIES Page 38
Company Guide
Clipan Finance
Quarterly / Interim Income Statement (Rpbn)
FY Dec 4Q2015 3Q2016 4Q2016 % chg yoy % chg qoq FY2015 FY2016 % chg yoy
Net Interest Income 137 146 168 22.5 14.8 602 562 -7%
Non-Interest Income 48.1 35.0 42.1 (12.6) 20.2 141 150 6%
Operating Income 185 181 210 13.4 15.8 743 711 -4%
Operating Expenses (57.9) (45.3) (60.5) 4.4 33.4 (174) (198) 14%
Pre-Provision Profit 127 136 149 17.5 9.9 569 513 -10%
Provisions (67.8) (74.4) (57.1) (15.9) (23.2) (179) (237) 32%
Associates 0.0 0.0 0.0 nm nm
Exceptionals 0.0 0.0 0.0 nm nm
Pretax Profit 60.2 62.4 93.2 54.7 49.3 392 278 -29%
Taxation (19.6) (15.0) (25.2) 29.0 68.2 (103) (71) -32%
Minority Interests 0.0 0.0 0.0 nm nm - -
Net Profit 40.7 47.4 68.0 67.0 43.4 288 207 -28%
Growth (%)
Net Interest Income Gth (17.3) 15.8 14.8
Net Profit Gth (33.2) 12.8 43.4
Key ratio (%)
NIM 9.2 8.0 8.6
NPL ratio 3.0 2.4 3.0
Loan-to deposit N/A N/A N/A
Cost-to-income 31.3 25.0 28.8
Total CAR N/A N/A N/A
Source of all data: Company, DBS Bank, DBSVI

ASIAN INSIGHTS VICKERS SECURITIES Page 39
Company Guide
Clipan Finance
CRITICAL DATA POINTS TO WATCH
Earnings Drivers:
Maintaining conservative stance. Management has guided for 7% receivables growth this year, driven by consumer financing and the newly introduced refinancing business. About 89% of its consumer financing loan book is derived from used 4Ws, which have shown resilient demand. Leasing is driven by non-heavy equipment leasing such as automotive (commercial vehicles), shipping, and machineries. Expanding consumer 4W financing business. Management thinks that expansion is only feasible in the consumer business. The company plans to expand its new 4W financing business by channelling Panin Bank’s 4W financing. CFIN will receive commission for every loan it underwrites but the loans will be on PNBN’s book. It has appointed a new director responsible for this business and targets to book Rp2.5tr 4W financing this year. Currently, the new 4W financing contributes a mere 6.4% of total financing in FY16. CFIN is also planning to enter into the 4W refinancing business which offers a higher yield than the new 4W financing.
Expecting higher NIM. NIM should be higher on the back of lower cost of funds as borrowing rate should adjust lower this year. Furthermore, a higher off-balance-sheet financing portion from the 4W channelling business will also contribute to interest income. NPL and credit cost should stabilise. We expect credit cost to normalise from last year’s high level of 3.6%. Higher coal price this year should also help customers, especially in the leasing business. Higher operating costs from initiatives. CFIN would see significantly higher personnel-related expenses this year, as it is planning to aggressively hire new staff to support its 4W financing and 4W refinancing business. Management has guided that the number of employees could rise to almost 2,000 from c.1,500 currently. In addition, CFIN is planning to add 10 new branches this year (from five per year previously).
Margin Trends
Gross Loan & Growth
Loan-to-Deposit Ratio Trend
Cost & Income Structure
Source: Company, DBS Bank, DBSVI

ASIAN INSIGHTS VICKERS SECURITIES Page 40
Company Guide
Clipan Finance
Balance Sheet:
Low gearing. CFIN has kept its gearing ratio below 1x, leaving ample room for growth and funding opportunities. CFIN usually utilises medium-term notes and bank borrowings for funding. However, the company has yet to announce major funding plans for this year. Unlike its competitors, CFIN does not seem keen to reduce cost of funds through cheaper offshore financing and prefers to stick with safer domestic borrowings without having to deal with exchange rate risks. NPL should taper off. 2016 was a tough year. NPL remained elevated at 3%. Most NPLs came from the heavy equipment leasing segment which contributes 70% of its leasing portfolio and 15% of its total financing portfolio. With better coal price this year, we expect NPL to start tapering off. CFIN does not have an automatic write-off policy and reviews its loans on a case-by-case basis. CFIN remains confident in recovering 70% of its loan loss provision. Share Price Drivers:
Consistent quality growth. Accelerating growth through the 4W financing business, while maintaining a low opex, is the main challenge this year. Thin liquidity of its stock. The thin trading liquidity is a major constraint for many investors, and could cap any share price upside. Key Risks:
Asset-quality risk. Further asset-quality deterioration could still happen if the high commodity price starts to unwind. Further weakness in GDP growth and purchasing power could also affect the consumer financing business. Further slowdown in factoring. Since factoring is a niche market, demand may be capped or continue to slow down (like in past few quarters). Company Background
Clipan Finance (CFIN) provides consumer financing, leasing and factoring services. The multi-finance company was established in 1982 and is part of the Panin Group; currently, Panin Bank has a 54.4% stake. Its leasing business targets the transportation, mining and plantation sectors, and consumer financing focuses on new and used cars.
Asset Quality
ROE (%)
Forward PE Band (x)
PB Band (x)
Source: Company, DBS Bank, DBSVI

ASIAN INSIGHTS VICKERS SECURITIES Page 41
Company Guide
Clipan Finance
Key Assumptions
FY Dec 2015A 2016A 2017F 2018F 2019F
Gross Loans Growth 0.6 0.8 7.0 9.0 10.4 Customer Deposits Growth N/A N/A N/A N/A N/A Yld. On Earnings Assets 14.8 13.4 13.9 13.7 13.9 Avg Cost Of Funds 12.2 11.5 11.6 11.1 11.1 Income Statement (Rpbn)
FY Dec 2015A 2016A 2017F 2018F 2019F Net Interest Income 602 562 656 707 778 Non-Interest Income 142 150 154 166 181
Operating Income 743 711 811 874 958 Operating Expenses (175) (201) (225) (254) (289)
Pre-provision Profit 568 511 585 620 669 Provisions (178) (235) (190) (210) (169) Associates 0.0 0.0 0.0 0.0 0.0 Exceptionals 0.0 0.0 0.0 0.0 0.0
Pre-tax Profit 390 276 396 411 500 Taxation (103) (70.6) (98.9) (103) (125) Minority Interests 0.0 0.0 0.0 0.0 0.0 Preference Dividend 0.0 0.0 0.0 0.0 0.0
Net Profit 286 205 297 308 375 Net Profit bef Except 286 205 297 308 375 Growth (%) Net Interest Income Gth (1.0) (6.6) 16.8 7.8 9.9 Net Profit Gth (28.1) (28.3) 44.4 3.8 21.8
Margins, Costs & Efficiency (%) Spread 2.6 1.9 2.3 2.6 2.8 Net Interest Margin 9.2 8.5 9.2 9.2 9.4 Cost-to-Income Ratio 23.6 28.2 27.8 29.0 30.2
Business Mix (%) Net Int. Inc / Opg Inc. 81.0 79.0 81.0 81.0 81.2 Non-Int. Inc / Opg inc. 19.0 21.0 19.0 19.0 18.8 Fee Inc / Opg Income 12.9 15.9 14.6 14.9 15.1 Oth Non-Int Inc/Opg Inc 6.1 5.1 4.5 4.1 3.8
Profitability (%) ROAE Pre Ex. 8.4 5.6 7.5 7.2 8.2 ROAE 8.4 5.6 7.5 7.2 8.2 ROA Pre Ex. 4.3 3.1 4.2 4.1 4.6 ROA 4.3 3.1 4.2 4.1 4.6
Source: Company, DBS Bank, DBSVI
Expecting higher NIM this year due to lower cost of funds
Slow loan growth to persist

ASIAN INSIGHTS VICKERS SECURITIES Page 42
Company Guide
Clipan Finance
Quarterly / Interim Income Statement (Rpbn)
FY Dec 4Q2015 1Q2016 2Q2016 3Q2016 4Q2016 Net Interest Income 137 122 126 146 168 Non-Interest Income 48.1 33.3 39.2 35.0 42.1
Operating Income 185 155 165 181 210 Operating Expenses (57.9) (41.6) (51.1) (45.3) (60.5)
Pre-Provision Profit 127 113 114 136 149 Provisions (67.8) (46.0) (59.4) (74.4) (57.1) Associates 0.0 0.0 0.0 0.0 0.0 Exceptionals 0.0 0.0 0.0 0.0 0.0
Pretax Profit 60.2 67.5 54.9 62.4 93.2 Taxation (19.6) (17.4) (12.9) (15.0) (25.2) Minority Interests 0.0 0.0 0.0 0.0 0.0
Net Profit 40.7 50.1 42.0 47.4 68.0 Growth (%) Net Interest Income Gth (17.3) (11.0) 3.6 15.8 14.8 Net Profit Gth (33.2) 23.0 (16.0) 12.8 43.4
Balance Sheet (Rpbn)
FY Dec 2015A 2016A 2017F 2018F 2019F Cash/Bank Balance 30.4 30.3 311 334 209 Government Securities 0.0 81.6 0.0 0.0 0.0 Inter Bank Assets 0.0 0.0 0.0 0.0 0.0 Total Net Loans & Advs. 6,409 6,397 6,772 7,314 8,073 Investment 0.0 0.0 0.0 0.0 0.0 Associates 0.0 0.0 0.0 0.0 0.0 Fixed Assets 101 118 94.4 87.7 80.5 Goodwill 0.0 0.0 0.0 0.0 0.0 Other Assets 106 118 118 118 118
Total Assets 6,647 6,744 7,294 7,853 8,480 Customer Deposits 0.0 0.0 0.0 0.0 0.0 Inter Bank Deposits 0.0 0.0 0.0 0.0 0.0 Debts/Borrowings 2,874 2,742 2,992 3,242 3,492 Others 174 203 207 207 210 Minorities 0.0 0.0 0.0 0.0 0.0 Shareholders' Funds 3,599 3,799 4,096 4,404 4,778
Total Liab& S/H’s Funds 6,647 6,744 7,294 7,853 8,480
Source: Company, DBS Bank, DBSVI
Provisions remained elevated on a quarterly basis

ASIAN INSIGHTS VICKERS SECURITIES Page 43
Company Guide
Clipan Finance
Financial Stability Measures (%)
FY Dec 2015A 2016A 2017F 2018F 2019F Balance Sheet Structure Loan-to-Deposit Ratio 223.0 233.3 226.3 225.6 231.2 Net Loans / Total Assets 96.4 94.8 92.8 93.1 95.2 Investment / Total Assets 0.0 0.0 0.0 0.0 0.0 Cust . Dep./Int. Bear. Liab. 0.0 0.0 0.0 0.0 0.0 Interbank Dep / Int. Bear. 0.0 0.0 0.0 0.0 0.0
Asset Quality NPL / Total Gross Loans 2.3 2.0 2.0 1.4 1.4
NPL / Total Assets 2.3 1.9 1.9 1.4 1.4 Loan Loss Reserve Coverage 74.7 136.2 185.1 329.5 333.0 Provision Charge-Off Rate 2.7 3.6 2.7 2.7 2.0
Capital Strength Total CAR 0.0 0.0 0.0 0.0 0.0 Tier-1 CAR 0.0 0.0 0.0 0.0 0.0
Source: Company, DBS Bank, DBSVI
Target Price & Ratings History
Source: DBS Bank, DBSVI
Analyst: Sue Lin LIM
Benedictus Agung SWANDONO
Credit cost to taper off over time

Industry Focus
Page 44
Company Profiles (Non-rated)

ASIAN INSIGHTS VICKERS SECURITIES ed: CK / sa: MA, PY
NOT RATED Reason for Report : A proxy for the multi-finance industry Potential Catalyst: Higher-than-expected growth amid improving efficiency. Analyst Sue Lin LIM +65 8332 6843 [email protected] Benedictus Agung SWANDONO +6221 3003 4935 [email protected] Financials
FY Dec (Rp bn) 2013A 2014A 2015A 2016A
Pre-prov. Profit 3,561 2,870 2,679 3,370 Net Profit 1,707 792 665 1,009 Net Pft (Pre Ex.) 1,707 792 665 1,009 EPS (Rp) 1,707 792 665 1,009 EPS Pre Ex. (Rp) 1,707 792 665 1,009 EPS Gth (%) 23 (54) (16) 52 EPS Gth Pre Ex (%) 23 (54) (16) 52 Diluted EPS (Rp) 1,707 792 665 1,009 PE Pre Ex. (X) 3.94 8.49 10.12 6.66 Net DPS (Rp) 709 2,700 390 333 Div Yield (%) 11.99 10.75 40.91 5.91 ROAE Pre Ex. (%) 30.9 15.8 15.8 21.6 ROAE (%) 30.9 15.8 15.8 21.6 ROA (%) 6.0 2.6 2.3 3.6 BV Per Share (Rp) 6,022 4,034 4,361 4,977 P/Book Value (x) 1.31 1.10 1.64 1.51
ICB Industry : Financials ICB Sector: Financial Services Principal Business: Adira Dinamika Multifinance (ADMF) is a subsidiary of Bank Danamon (BDMN). It mainly provides financing for 2W and 4W (both commercial and passenger), Source of all data on this page: Company, DBS Vickers
Ready for growth
Improved auto sector outlook should lend support
to positive receivables growth this year
Operating efficiency in internal process as well as
digitisation should help bottom-line
Expecting lower credit cost, thanks to better
economic growth and commodity prices
Synergies with BDMN for sustained growth ahead
Expecting positive growth momentum. Adira Dinamika Multi Finance (ADMF) should see 5-10% new bookings in 2017, supported by improvements in the automotive industry. NPL is expected to stay below 2% while credit costs is also expected to head lower, supported by better commodity prices which help lift income, especially in the non-Java areas. NIM and credit cost should depend on ADMF’s strategy for its portfolio mix. Used vehicle financing should offer higher yields but should also be associated with higher credit costs. ADMF has proven its ability to keep its operating cost stable since 2013 by improving the efficiency in internal process as well as through digitisation.
Synergistic benefits with BDMN. Bank Danamon (BDMN) is the major shareholder of ADMF with a 92% stake. Synergy within subsidiaries is one of the key initiatives introduced by BDMN since its CEO joined in 2015. BDMN channels lending through ADMF and cross-sells other products to ADMF’s customers.
Key risks: Intensifying competition and higher credit cost.
We believe intensifying competition, especially with Astra- related finance companies, should be the major risk since Astra is the market leader in both 2W and 4W segments. Moreover, higher credit cost has been the major cause of earnings fluctuations in the past three years and may still be a problem going forward if economic growth and/or commodity prices weaken.
Trading at 1.51x 16A P/BV. ADMF is listed on the Indonesian Stock Exchange, comparable to the two other multi-finance companies under our coverage (BFIN and CFIN). But ADMF’s free float is smaller at 7.9% (vs BFIN at 57.2%)
At A Glance Issued Capital (m shrs) 1,000 Mkt. Cap (Rpbn/US$m) 6,750 / 509 Major Shareholders (%) Bank Danamon Tbk 92%
Free Float (%) 8% 3m Avg. Daily Val (US$m) 0.04
DBS Group Research . Equity 18 April 2017
Indonesia Company Focus
Adira Dinamika Multifinance Bloomberg: ADMF IJ | Reuters: ADMF.JK Refer to important disclosures at the end of this report

At
ASIAN INSIGHTS VICKERS SECURITIES Page 46
Company Focus
Adira Dinamika Multifinance
Company Background
Solid support from the group. Adira Dinamika Multi Finance (ADMF) was established as a multi-finance company in 1990 by Raphael Adi Rachmat, Linda Rachmat and Yus Winata. It was a part of the Triputra Group, a conglomerate with many businesses, including a motorcycle dealership, auto parts manufacturing, and auto parts retail. After ADMF went public, Bank Danamon (BDMN) has since become major shareholder with a 95% stake after exercising its call options over the years. After a small divestment in 2016, BDMN currently holds a 92.1% stake in ADMF.
Financial Analysis
Focused almost solely on consumer financing. Auto sales is the main driver of ADMF’s income since 99% of its managed portfolio is derived from automotive financing, with the remaining 1% contributed by durable goods. Administration fee income is the second largest contributor, which goes hand in hand with new bookings.
Strong presence across Indonesia. ADMF is the third largest multi-finance company in Indonesia with c.7% market share in 2016. ADMF offers 2W and 4W financing, leasing, and multi-purpose financing. It has the second largest market share for 2W financing and significant presence in commercial 4W financing. It has the largest network, with 518 business network spread across the Indonesian archipelago.
Strong brand and network. ADMF has strong brand recognition not only among auto buyers, but also the dealerships. It has proven a strong track record to be a reliable partner to support financing auto sales. One of the reasons is the support of major shareholder, BDMN. The bank has a joint financing arrangement with ADMF and cross-sells other products to ADMF’s customers. The company is diversified in terms of auto segment and brands.
Expanding alternative business. The company also expanding its multi-purpose financing business by offering financing for Umrah (religious trip to Mecca). The CEO expects the business will help to contribute to its non-auto products to grow at double digit this year.
No material asset-quality issues. ADMF has been able to keep its NPL ratio below 2% even during the downturn of the automotive industry in 2015. It considers an asset to be non-performing when repayment is 90 days past due. It also has an automatic write-off policy after 210 days overdue. ADMF tries to maintain asset quality by increasing intensity of collection, improving approval process, and adopting more prudent risk management.
Enhancing efficiency. ADMF, like its parent, is undergoing a transformation process to rationalise costs and enhance efficiency to adapt to the weakening auto market. The number of business networks and employees has been gradually aligned to the operational activities requirement as the company continues to enhance its internal process through digitisation.
ADMF: Financing portfolio (2016)
Source: Company, DBS Vickers ADMF: NPL ratio
Source: Company, DBS Vickers ADMF: Business network
Source: Company ADMF: Number of employees
Source: Company, DBS Vickers
2W48%4W
51%
Durables1%
1.39% 1.30% 1.52% 1.73% 1.59%
3.25%
4.34%
6.22%6.84%
6.34%
0.00%
1.00%
2.00%
3.00%
4.00%
5.00%
6.00%
7.00%
8.00%
2012 2013 2014 2015 2016
NPL Credit Cost
523
196 199 201
341 334 290
107 9767
23 15
0
100
200
300
400
500
600
700
800
2013 2014 2015 2016
Total branch representative office kiosk outlet
reduce number of service points by 22% since 2013.
28519
26098
2135120087
0
5000
10000
15000
20000
25000
30000
2013 2014 2015 2016
reduce number of employees by 30% since 2013

ASIAN INSIGHTS VICKERS SECURITIES Page 47
Company Focus
Adira Dinamika Multifinance
Funding sources. ADMF’s bond funding proportion is one of the highest in the industry, thanks to its good reputation and long track record which enabled it to tap into the bond market. The bond market typically has a lower interest rate compared to bank borrowings, which should help lower its blended cost of funds. In 4Q16, ADMF settled its matured bonds and mudharabah bonds amounting to Rp2.4tr. But ADMF is prepared to issue new bonds to finance its growth. ADMF typically issues Rp2-3tr new bonds every year. ADMF: Funding source in FY16
Source: Company, DBS Vickers ADMF: Gearing and ROE
Source: Company, DBS Vickers Outlook
ADMF’s transformation story. Similar to its parent company, BDMN, ADMF has also been going through a transformation phase. ADMF’s business has been hurt the past three years due to a combination of regulatory changes (changes in down payment regulations and increase in minimum wages) and a slowdown in the auto industry (due to lower commodity prices). In 2015, ADMF conducted a review of its business model, particularly for its operations. Three key things top management’s agenda: (1) The need to defend ADMF’s household branding and ensuring its footprint remains strong throughout Indonesia – ADMF would need to
deepen its relationship with its customers and attempt to bundle products (auto + insurance products); (2) Improve efficiency – As part of its efficiency efforts, ADMF had reduced its number of outlets in the past two years where nearby outlets were combined. ADMF has moved to digitise its business. The success of these two efforts combined was evident in 2016 where opex remained flat. Digitising its business processes will be a multi-year exercise. Expect more efficiency gains to emerge from here; (3) Growing new businesses – Multifinance companies were allowed to finance multi-purpose loans, re-financing and infrastructure loans in 2014. ADMF should be able to tap on its rich customer base, coupled with its strong relationships with auto dealers and vendors. In addition, cross-selling opportunities with BDMN are also part of the group transformation agenda. We should expect more ADMF-BDMN synergies going forward. Over 2016, we understand that ADMF had benefited from lower funding costs, thanks to BDMN. Recovery and its prospects. Despite setbacks, ADMF has consistently maintained its market share ranking at #2 for the 2W business with a market share of 13-14%, after Federal International Finance (FIF), Astra’s 2W multi-finance company. ADMF’s 4W business remains small with a market share of only 4-5%. ADMF saw a recovery in its new sales for both 2W and 4W in 4Q16. ADMF expects 2017 new bookings of 5-10%. We understand that ADMF is gradually shifting its portfolio towards 4W given its better prospects expected. Indonesia’s 4W penetration is low. With rising GDP per capita in coming years, the growth prospects for the 4W business should outweigh the more saturated 2W market. The company expects NPL to stay below 2%. ADMF is exposed to USD debt but it is fully hedged using cross-currency swaps. NIM is expected to head lower – if ADMF continues to enlarge the new 4W financing portion due to its lower yield. However, credit cost is expected to head lower since 4W financing is typically less risky than 2W financing. Key Risks: intensifying competition.
Reliance on auto industry. ADMF’s financing is dominated by auto financing (99% of its receivables portfolio), while the rest is contributed by durable goods. Fluctuations in automotive industry sales should directly affect ADMF’s revenue. Intense competition. Competition would likely emerge from Astra-related financing companies since Astra is the market leader in both 2W and 4W sales in Indonesia. Regulatory changes. As 2W financing targets the lower income segment, it is therefore more sensitive towards down payment regulations.
57%
43%
Bank Loans Bond
3.6 3.7
5.7
4.7 4.0
29%31%
16% 16%
22%
0%
5%
10%
15%
20%
25%
30%
35%
-
1.0
2.0
3.0
4.0
5.0
6.0
7.0
2012 2013 2014 2015 2016
Gearing ROE - RHS

ASIAN INSIGHTS VICKERS SECURITIES Page 48
Company Focus
Adira Dinamika Multifinance
Key Assumptions
FY Dec 2012 2013 2014 2015 2016
Gross Consumer Financing Gth 69.6 22.0 (2.7) (10.0) 5.1 Yld. On Earnings Assets 20.1 18.5 19.8 21.4 24.1 Avg Cost Of Funds 8.3 8.3 10.0 10.1 9.0
Income Statement (Rpbn)
FYDec 2012 2013 2014 2015 2016
ConsumerFinancingIncome 4,180 5,271 6,233 6,343 6,707 OtherIncome 2,545 2,902 2,260 1,985 1,898 TotalIncome 6,725 8,173 8,493 8,328 8,605 OperatingExpense (4,107) (4,504) (5,381) (5,385) (5,043) Pre-ProvisionProfit 2,617 3,669 3,111 2,943 3,561 Provision (750) (1,278) (1,809) (1,778) (1,652) Pre-TaxProfit 1,868 2,282 1,061 901 1,718 Tax (477) (575) (268) (236) (708) NetProfit 1,391 1,707 792 665 1,009 NetProfitbefExcept 1,391 1,707 792 665 1,009 Growth(%)
NetInterestIncomeGth 20.7 16.9 6.8 4.1 18.0 NetProfitGth (11.4) 22.8 (53.6) (16.1) 51.8 Margins,Costs&Efficiency(%)
Spread 11.8 10.2 9.8 11.3 15.1 NetInterestMargin 14.4 12.5 12.3 13.6 17.4 Cost-to-IncomeRatio 52.7 44.3 52.1 54.3 48.0 BusinessMix(%)
NetInt.Inc/OpgInc. 44.4 43.3 45.2 48.1 54.4 Non-Int.Inc/Opginc. 37.8 36.0 27.4 24.6 22.6 Profitability(%)
ROAEPreEx. 29.4 30.9 15.8 15.8 21.6 ROAE 29.4 30.9 15.8 15.8 21.6 ROAPreEx. 6.6 6.0 2.6 2.3 3.6 ROA 6.6 6.0 2.6 2.3 3.6
Source: Company, DBSVickers
Consumer financing picked up along with the 4W automotive industry last year

ASIAN INSIGHTS VICKERS SECURITIES Page 49
Company Focus
Adira Dinamika Multifinance
Balance Sheet (Rpbn)
FYDec 2012 2013 2014 2015 2016
Cash and Cash Equivalents 2,249 1,264 879 1,060 490 Consumer Financing (net) 22,389 28,505 27,990 24,919 25,321 Fixed Asset 290 283 296 243 225 Derivative Receivables - - - - - Deferred Tax Asset - - - - - Other Assets 533 942 766 1,522 1,607 Total Assets 25,460 30,994 29,931 27,744 27,643 Fund Borrowing 8,286 11,252 12,454 11,388 11,620 Bonds 9,802 10,984 10,725 9,088 8,433 Taxes Payable 146 89 64 58 34 Deferred Tax Liabilities 396 347 144 - - Other Liabilities 1,796 2,301 2,510 2,849 2,580 Shareholders' Funds 5,036 6,022 4,034 4,361 4,977 Total Liab& S/H’s Funds 25,460 30,994 29,931 27,744 27,643 Cash and Cash Equivalents 2,249 1,264 879 1,060 490 Consumer Financing (net) 22,389 28,505 27,990 24,919 25,321 Fixed Asset 290 283 296 243 225
Financial Stability Measures (%)
FYDec 2012 2013 2014 2015 2016
Balance Sheet Structure Consumer Financing/ Total A t
87.9 92.0 93.5 89.8 91.6
Earning Asset/ Total Asset 96.8 96.0 96.5 93.6 93.4 Debt/Total Liability 88.6 89.0 89.5 87.6 88.5 Borrowings/ Int. Bear. Liab. 45.8 50.6 53.7 55.6 57.9 Bonds/ Int. Bear. Liab. 54.2 49.4 46.3 44.4 42.1
Asset Quality NPL / Total Gross Loans 1.4 1.3 1.5 1.7 1.6
NPL / Total Assets 3.1 2.5 3.1 3.6 3.2
Loan Loss Reserve Coverage 94.3 162.8 189.7 174.3 185.4
Provision Charge-off rate (3.2) (4.3) (6.2) (6.8) (6.2)
Capital Strength
Gearing Ratio 3.6 3.7 5.7 4.7 4.0
Source: Company, DBSVickers
NPL remained low due to disciplined 210 days overdue write-off policy

ASIAN INSIGHTS VICKERS SECURITIES ed: CK / sa: MA, PY
NOT LISTED/NOT RATED Reason for Report : A proxy for the multi-finance industry Potential Catalyst: Automotive sales improvement Analyst Benedictus Agung SWANDONO +6221 3003 4935 [email protected] Sue Lin LIM +65 8332 6843 [email protected] Financials
FY Dec (Rp bn) 2013A 2014A 2015A 2016A
Pre-prov. Profit 1,948 2,122 2,161 2,279 Net Profit 1,011 1,138 969 934 Net Pft (Pre Ex.) 1,011 1,138 969 934 EPS (Rp) 1,418 1,197 1,020 983 EPS Pre Ex. (Rp) 1,418 1,197 1,020 983 EPS Gth (%) 22.2 (15.6) (14.9) (3.6) EPS Gth Pre Ex (%) 22.2 (15.6) (14.9) (3.6) Diluted EPS (Rp) 1,418 1,197 1,020 983 Net DPS (Rp) 566 2,872 425 652 ROAE Pre Ex. (%) 24 24 18 16 ROAE (%) 23.4 24.1 23.9 18.1 ROA (%) 3.3 3.3 3.4 3.2 BV Per Share (Rp) 4,516 5,064 5,693 5,831
ICB Industry : Financials ICB Sector: Financial Services Principal Business: Astra Sedaya Finance (ASDF) focuses on providing consumer financing for new and used cars and is part of the Astra Group's value chain Source of all data on this page: Company, DBS Bank, DBS Vickers
The big 4W kahuna
Well positioned to grow with the automotive
industry due to its size and Astra group’s support
Proven resilience even during the economic
downcycle while maintaining high ROE levels
Good access to capital markets both local and
foreign, which enable it to use low cost financing
Asset quality below industry average despite the
spike in credit cost. Efficiency ratio remained in
check
Integral part of Astra group’s value chain. Astra Sedaya Finance (ASDF) is an integral of Astra Group’s 4W automotive business. It holds the largest financing of around 20% of Astra International’s (ASII) total car sales. While 75%-80% of ASDF’s financing is related to Astra’s brands, it is also supported by Bank Permata (10th largest bank in Indonesia) as its shareholder (25% ownership). ASDF also benefits from its scale with 414k customers – 27-30% of them being quality repeat customers; this should help keep its asset quality in check.
Sound financial performance and profitability. ASDF has been consistently booking positive growth in pre-provision profit in the past decade. It also showed resilience during the downturn of the automotive industry during 2014-2015 by maintaining high-teens ROEs despite higher credit cost. Its NPL is maintained at 0.2% due to its disciplined 150-days overdue write-off policy. Its strong footprint allowed ASDF to tap into a wider range of financing sources such as banks and capital markets, both local and foreign. Key risks: Intensifying competition. It could face tougher competition in the 4W segment, as other multi-finance companies also target Astra’s products. We believe BCA Finance and Mandiri Tunas Finance could be serious competitors in light of the strong support from their bank parents.
At A Glance Major Shareholders (%) Astra International Tbk 75% Bank Permata Tbk 25%
DBS Group Research . Equity 18 April 2017
Indonesia Company Focus
Astra Sedaya Finance Bloomberg: n.a | Reuters: n.a Refer to important disclosures at the end of this report
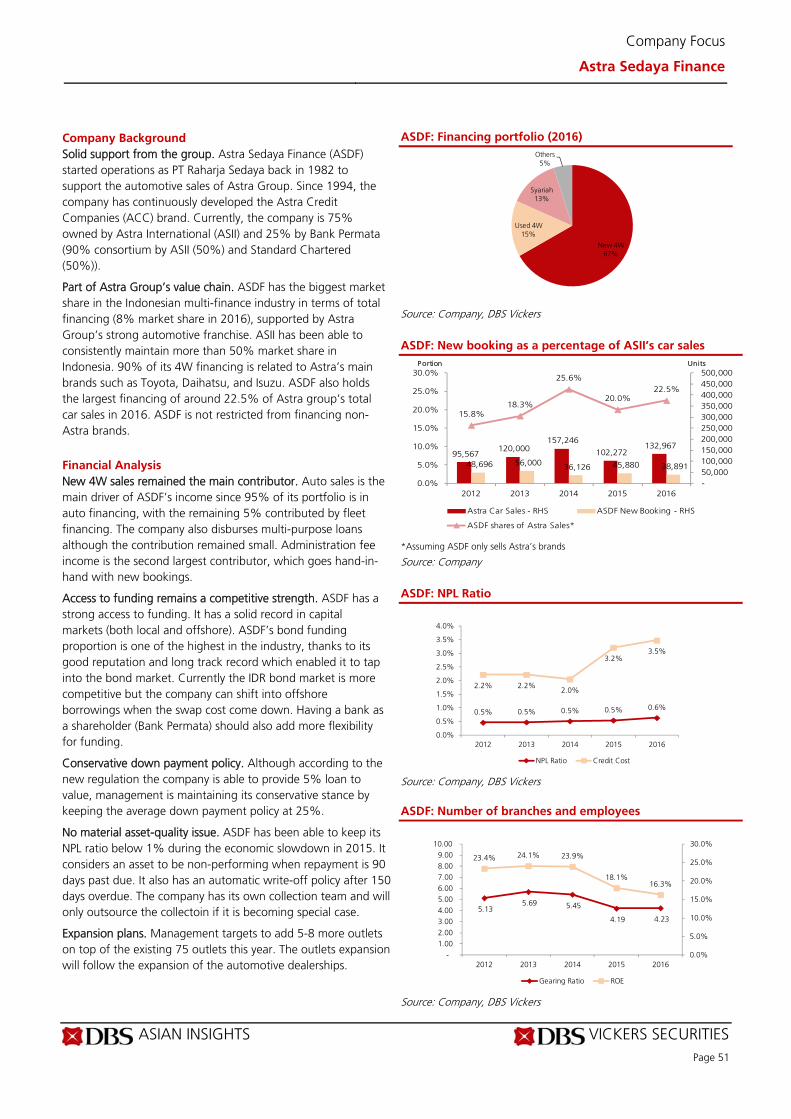
ASIAN INSIGHTS VICKERS SECURITIES Page 51
Company Focus
Astra Sedaya Finance
Company Background
Solid support from the group. Astra Sedaya Finance (ASDF) started operations as PT Raharja Sedaya back in 1982 to support the automotive sales of Astra Group. Since 1994, the company has continuously developed the Astra Credit Companies (ACC) brand. Currently, the company is 75% owned by Astra International (ASII) and 25% by Bank Permata (90% consortium by ASII (50%) and Standard Chartered (50%)).
Part of Astra Group’s value chain. ASDF has the biggest market share in the Indonesian multi-finance industry in terms of total financing (8% market share in 2016), supported by Astra Group’s strong automotive franchise. ASII has been able to consistently maintain more than 50% market share in Indonesia. 90% of its 4W financing is related to Astra’s main brands such as Toyota, Daihatsu, and Isuzu. ASDF also holds the largest financing of around 22.5% of Astra group’s total car sales in 2016. ASDF is not restricted from financing non-Astra brands. Financial Analysis
New 4W sales remained the main contributor. Auto sales is the main driver of ASDF’s income since 95% of its portfolio is in auto financing, with the remaining 5% contributed by fleet financing. The company also disburses multi-purpose loans although the contribution remained small. Administration fee income is the second largest contributor, which goes hand-in-hand with new bookings.
Access to funding remains a competitive strength. ASDF has a strong access to funding. It has a solid record in capital markets (both local and offshore). ASDF’s bond funding proportion is one of the highest in the industry, thanks to its good reputation and long track record which enabled it to tap into the bond market. Currently the IDR bond market is more competitive but the company can shift into offshore borrowings when the swap cost come down. Having a bank as a shareholder (Bank Permata) should also add more flexibility for funding.
Conservative down payment policy. Although according to the new regulation the company is able to provide 5% loan to value, management is maintaining its conservative stance by keeping the average down payment policy at 25%.
No material asset-quality issue. ASDF has been able to keep its NPL ratio below 1% during the economic slowdown in 2015. It considers an asset to be non-performing when repayment is 90 days past due. It also has an automatic write-off policy after 150 days overdue. The company has its own collection team and will only outsource the collectoin if it is becoming special case.
Expansion plans. Management targets to add 5-8 more outlets on top of the existing 75 outlets this year. The outlets expansion will follow the expansion of the automotive dealerships.
ASDF: Financing portfolio (2016)
Source: Company, DBS Vickers ASDF: New booking as a percentage of ASII’s car sales
*Assuming ASDF only sells Astra’s brands
Source: Company ASDF: NPL Ratio
Source: Company, DBS Vickers ASDF: Number of branches and employees
Source: Company, DBS Vickers
New 4W67%
Used 4W15%
Syariah13%
Others5%
95,567 120,000
157,246
102,272 132,967
48,696 56,000 36,126 45,880 38,891
15.8%18.3%
25.6%
20.0%22.5%
-50,000 100,000 150,000 200,000 250,000 300,000 350,000 400,000 450,000 500,000
0.0%
5.0%
10.0%
15.0%
20.0%
25.0%
30.0%
2012 2013 2014 2015 2016
Astra Car Sales - RHS ASDF New Booking - RHS
ASDF shares of Astra Sales*
UnitsPortion
0.5% 0.5% 0.5% 0.5% 0.6%
2.2% 2.2%2.0%
3.2%3.5%
0.0%
0.5%
1.0%
1.5%
2.0%
2.5%
3.0%
3.5%
4.0%
2012 2013 2014 2015 2016
NPL Ratio Credit Cost
5.13 5.69 5.45
4.19 4.23
23.4% 24.1% 23.9%
18.1%16.3%
0.0%
5.0%
10.0%
15.0%
20.0%
25.0%
30.0%
-1.00 2.00 3.00 4.00 5.00 6.00 7.00 8.00 9.00
10.00
2012 2013 2014 2015 2016
Gearing Ratio ROE

At
ASIAN INSIGHTS VICKERS SECURITIES Page 52
Company Focus
Astra Sedaya Finance
Funding sources. ASDF’s bond funding proportion is one of the highest in the industry, thanks to its good reputation and long track record which enabled them to tap into the bond market. Bond market typically has a lower interest rate compared to bank borrowings, which should help lower its blended cost of funds. ASDF also does joint financing which consists of 20%-25% of its loan portfolio.
Gearing remains low. Gearing stood at 4.2x in FY16, much below the industry average at 8x and maximum regulated level of 10x. We also note that this level is below the 10-year average of 4.8%. These should indicate that the company still have room for growth and help lift its ROE back to the c.23% level (from 16% in FY16).
Huge customer base is an advantage. ASDF has a large customer base with around 414k customers and 27-30% of them are repeat customers. A large customer database is very important for multi-finance companies in Indonesia due to the absence of a strong credit bureau for the industry. This will help ASDF to lower delinquencies and maintain its strong asset quality. Outlook
It expects 4%-5% growth of 4W sales, not much different than last year’s 5% growth. We believe the company will continue to grow in line with the automotive industry going forward. Upside might come from the heavy equipment leasing business due to the coal industry’s rebound this year. Key Risks: Intensifying competition. It could face tougher competition in the 4W segment, as other multi-finance companies also target Astra’s products. We believe that BCA Finance and Mandiri Tunas Finance could pose a credible threat due to the strong support from their bank parents.
ASDF: Funding source in FY16:
Source: Company, DBS Vickers
ASDF: Gearing and ROE
Source: Company, DBS Vickers, DBS Bank
ASDF: Shareholding structure
Source: Company
Borrowings40%
Bonds60%
5.13 5.69 5.45
4.19 4.23
23.4% 24.1% 23.9%
18.1%16.3%
0.0%
5.0%
10.0%
15.0%
20.0%
25.0%
30.0%
-1.00 2.00 3.00 4.00 5.00 6.00 7.00 8.00 9.00
10.00
2012 2013 2014 2015 2016
Gearing Ratio ROE

ASIAN INSIGHTS VICKERS SECURITIES Page 53
Company Focus
Astra Sedaya Finance
Key Assumptions
FY Dec 2012 2013 2014 2015 2016
Consumer Financing Gth 32.3 21.4 9.1 (9.5) 12.1 Leasing Gth 40.4 24.9 (2.4) (14.9) (17.4) Yld. On Earnings Assets 16.1 15.0 15.4 16.3 16.0 Avg Cost Of Funds 8.9 8.0 8.8 9.7 9.2
Income Statement (Rpbn)
FYDec 2012 2013 2014 2015 2016
Net Interest Income 1,914 2,265 2,496 2,561 2,646 Non-Interest Income 283 295 397 414 467 Operating Income 2,197 2,560 2,893 2,975 3,113 Operating Expenses (605) (612) (771) (814) (834) Pre-provision Profit 1,592 1,948 2,122 2,161 2,279 Provisions (533) (649) (648) (915) (1,080)
Associates - 1 2 3 3 Exceptionals - 1 2 3 3 Pre-tax Profit 1,059 1,301 1,478 1,252 1,205 Taxation (276) (334) (376) (302) (296) Minority Interests - 1 2 3 3 Preference Dividend - 1 2 3 3 Net Profit 783 969 1,106 956 915 Net Profit bef Except 783 969 1,106 956 915 Growth(%)
Net Interest Income Gth 24.3 18.3 10.2 2.6 3.3 Net Profit Gth 30.2 22.2 12.6 (14.9) (3.6) Margins, Costs & Efficiency (%)
Spread 7.1 7.0 6.6 6.5 6.8 Net Interest Margin 8.9 8.3 8.0 8.3 8.7 Cost-to-Income Ratio 27.5 23.9 26.7 27.4 26.8 Business Mix (%)
Net Int.Inc/Opg Inc. 87.1 88.5 86.3 86.1 85.0 Non-Int. Inc/Opg inc. 12.9 11.5 13.7 13.9 15.0 Fee Inc/Opg Income 5.7 6.6 8.1 8.3 8.7 Oth Non-Int Inc/Opg Inc 7.1 4.9 5.6 5.6 6.3 Profitability (%)
ROAE PreEx. 23.4 24.1 23.9 18.1 16.3 ROAE 23.4 24.1 23.9 18.1 16.3 ROA PreEx. 3.3 3.3 3.4 3.2 3.0 ROA 3.3 3.3 3.4 3.2 3.0
Source: Company, DBSVickers
Provisions remained elevated in the past two years party due to the automatic write-off policy
Consumer financing picked up along with the 4W automotive industry last year

At
ASIAN INSIGHTS VICKERS SECURITIES Page 54
Company Focus
Astra Sedaya Finance
Balance Sheet (Rpbn)
FYDec 2012 2013 2014 2015 2016
Cash/Bank Balance 713 697 1,316 821 510 Government Securities - - - - - Interbank Assets - - - - - Total Net Loans & Advs. 23,260 28,336 30,617 27,542 29,976 Investment - - - - - Associates - - - - - Fixed Assets 151 154 147 139 372 Goodwill - - - - - Other Assets 766 1,815 1,223 1,890 620 Total Assets 24,890 31,002 33,303 30,392 31,478 Customer Deposits - - - - - Interbank Deposits - - - - - Debts/Borrowings 19,960 25,647 27,322 23,866 24,439 Others 1,040 849 967 833 1,257 Minorities - - - - - Shareholders ‘Funds 3,890 4,506 5,014 5,693 5,782 Total Liab & S/H’s Funds 24,890 31,002 33,303 30,392 31,478
Financial Stability Measures(%)
FYDec 2012 2013 2014 2015 2016
Balance Sheet Structure
Consumer Financing/Tota lAsset 93.5 91.4 91.9 90.6 95.2 Debt/Total Liability 95.0 96.8 96.6 96.6 95.1 Borrowings/Int. Bear. Liab. 56.9 53.9 50.2 37.8 39.8 Bonds/Int. Bear. Liab. 43.1 46.1 49.8 62.2 60.2 Asset Quality NPL/Total Gross Loans 0.17 0.19 0.20 0.21 0.19 NPL/Total Assets 0.46 0.47 0.51 0.54 0.63 NPL(absolute) 49.0 66.0 76.0 73.0 75.0 Liabilities Measure Gearing Ratio 5.13 5.69 5.45 4.19 4.23 Liability/Equity 5.40 5.88 5.64 4.34 4.44
Source: Company, DBSVickers
NPL remained low due to disciplined 150 days overdue write-off policy

ASIAN INSIGHTS VICKERS SECURITIES ed: CK / sa: MA, PY
NOT LISTED/NOT RATED Reason for Report : A proxy for the multi-finance industry Potential Catalyst: Automotive sales improvement Analyst Benedictus Agung SWANDONO +6221 3003 4935 [email protected] Sue Lin LIM +65 8332 6843 [email protected] Financials
FY Dec (Rp bn) 2013A 2014A 2015A 2016A
Pre-prov. Profit 1,264 1,358 1,437 1,548 Net Profit 935 1,001 1,047 1,139 Net Pft (Pre Ex.) 935 1,001 1,047 1,139 EPS (Rp) 47 50 52 57 EPS Pre Ex. (Rp) 47 50 52 57 EPS Gth (%) 28.2 7.0 4.6 8.7 EPS Gth Pre Ex (%) 28.2 7.0 4.6 8.7 Diluted EPS (Rp) 47 50 52 57 Net DPS (Rp) 20 20 20 20 ROAE Pre Ex. (%) 81 76 56 45 ROAE (%) 80.7 76.2 56.2 44.7 ROA (%) 16.1 16.3 15.3 14.0 BV Per Share (Rp) 1,110 1,552 2,210 2,929
ICB Industry : Financials ICB Sector: Financial Services Principal Business: BCA Finance is a multi-finance arm of Bank BCA and focuses on providing new 4W financing. Source of all data on this page: Company, DBS Vickers
Aiming for the top of the class
The multi-finance arm of Bank Central Asia (BBCA)
Mainly uses the parent’s balance sheet to offer
competitive rates to compete for top-tier
customers
The business model allowed BCAF to increase
market share while keeping asset quality under
control
Targets customers in the urban/city areas,
enabling it to incur lower credit cost and expenses
Multi-finance arm of BBCA. BCA Finance (BCAF) is the multi-finance arm of Bank Central Asia (BBCA) which was the largest private bank in Indonesia. The business model is generally based on using its parent’s balance sheet for joint financing, thus offering customers a very competitive rate. BCAF targets the lowest risk customers which are typically price-sensitive by behaviour. The business model has enabled BCAF to consistently increase market share in the new 4W financing business. Moreover, BCAF also does financing for used 4W but it typically does not include joint-financing schemes with its parent.
Strong profitability metrics and sound asset quality. BCAF has been able to book c.50% ROE in the past five years. It is also able to consistently keep credit cost below 1%, thanks to its success in capturing the best-tier customers. NPL is also maintained at around 1%. Key risks: Intensifying competition. It could face tougher competition in the 4W segment, as other multi-finance companies also target Astra’s products. We believe Astra-related multi-finance companies and Mandiri Tunas Finance could pose competitive threats in view of the strong support from their parents.
At A Glance Major Shareholders (%) Bank Central Asia Tbk. 99.58% BCA Finance Limited 0.42%
DBS Group Research . Equity 18 April 2017
Indonesia Company Focus
BCA Finance Bloomberg: n.a | Reuters: n.a Refer to important disclosures at the end of this report

At
ASIAN INSIGHTS VICKERS SECURITIES Page 56
Company Focus
BCA Finance
Company Background
Bank-backed parentage. BCA Finance (BCAF) became a subsidiary of Bank Central Asia (BBCA) after the Salim group relinquished control of BCAF in 1996. BCAF is basically the financing arm of BBCA to disburse both new and used 4W loans. The 2W business is mainly operated by Central Santosa Finance, another subsidiary of BBCA. Financial Analysis
Competitive pricing in urban city areas. BCAF competes for the upper high-end segment for new 4W financing in the urban/city areas with low credit risk by offering competitive pricing, thanks to joint-financing schemes from its parent which have low cost of funds. Recently, the company launched a promotional rate of 3.6% flat for 36 days, equivalent to 7.01% p.a. effective rate (which was lower than competitor’s cost of funds). BCAF also expanded into the riskier used 4W financing business but usually this does not include joint-financing from the parent.
Joint-financing scheme. The joint-financing scheme requires BCAF to pay 9.5% to the parent and take the spread between the effective yield plus a fee income. BCAF is responsible for handling the underwriting process and collection.
Access to funding remains a competitive strength. Aside from joint financing with its parent, BCAF has solid funding capability. BCAF’s bond funding proportion is one of the highest in the industry, thanks to its good reputation and long track record which enabled it to tap into the bond market which typically has a lower interest rate compared to bank borrowings.
Conservative down-payment policy. Loan to value (LTV) is usually lower than 80% despite the regulation that allows BCAF to give a higher LTV. The company has its NPL maintained at 1-3% and therefore the new regulation should allow it to give down payment as low as 10%. The high down payment also reflects BCAF’s strategy to capture low-risk customers.
NPL and credit costs remained low. Credit cost has been able to be maintained at below 1% in the last four years while its NPL hovers at around the 1% level. The consistently low credit cost and NPL prove that being conservative has its benefits.
Expansion plans. BCAF has no intentions to add a significant number of new branches but prefers to leverage on its parent’s vast network. BCAF’s target market is the affluent middle class living in urban areas, which should be covered by the current BBCA network.
BCAF: Financing portfolio based on location
Source: Company, DBS Vickers
BCAF: New booking and market share
Source: Companies; *Assuming BCAF only sells Astra’s brands
BCAF: Promotional material
Source: Company, DBS Vickers
BCAF: NPL Ratio
Source: Company, DBS Vickers
Jabodetabek60%
Surabaya8%
Bandung5%
Semarang3%
Pekanbaru2%
Others20%
12.80% 13.03%
11.07%
13.24%
15.30%
-
50,000
100,000
150,000
200,000
250,000
0.00%
2.00%
4.00%
6.00%
8.00%
10.00%
12.00%
14.00%
16.00%
18.00%
2012 2013 2014 2015 2016
New Booking - RHS Market Share New 4W
UnitsMarket Share
0.73%
0.82%
1.63%1.50%
1.20%1.01%
0.38%
0.54%0.66%
0.53%
0.00%
0.20%
0.40%
0.60%
0.80%
1.00%
1.20%
1.40%
1.60%
1.80%
2012 2013 2014 2015 2016
NPL Credit Cost

ASIAN INSIGHTS VICKERS SECURITIES Page 57
Company Focus
BCA Finance
Joint financing for new 4W business. BCAF uses its parent’s balance sheet to grow in the new 4W financing business through joint-financing agreements with BBCA. The joint- financing portion contributes up to 89% of consumer financing managed receivable portfolio in FY16. The high joint financing portion explains why BCAF can enjoy high asset yields despite offering very competitive rates to its customers. Meanwhile, internal funding is mostly contributed by bond financing.
Gearing remains low. Gearing stood at 1.4x in FY16, much below the industry average at 8x and maximum regulated level of 10x. We also note that this level is the lowest in five years. However, BCAF’s funding is mainly off-balance sheet which is not reflected in the gearing ratio.
Leveraging BBCA vast network. 35%-40% BCAF’s customers are from the parent’s branches which are also BBCA’s customers who have good credit records. This will help BCAF to manage delinquencies and maintain its strong asset quality.
Outlook
BBCA plans to grow its car financing business through BCA Finance. However, management stated that the company will only ride through the industry growth. We expect the 4W industry to grow at 5% this year. However BCAF can grow more than that by taking up more market share.
Key Risks: Intensifying competition. It could face tougher competition in the 4W segment, as other multi-finance companies – especially the Astra-related companies such as Astra Sedaya Finance and Toyota Astra Finance – vie for a bigger slice of the market. BCAF: Funding source in FY16
Source: Company, DBS Vickers
BCAF: Managed receivable on consumer financing portfolio
Source: Company, DBS Vickers BCAF: Gearing and ROE
Source: Company, DBS Vickers
BCAF: Market share and new booking
Source: Company, DBS Vickers
Borrowings42%
Bond58%
Joint Financing 89%
On Balance Sheet11%
2.19
3.25
2.21
1.51 1.36
54%
81%76%
56%
45%
0%
10%
20%
30%
40%
50%
60%
70%
80%
90%
-0.50 1.00 1.50
2.00 2.50 3.00 3.50 4.00 4.50
5.00
2012 2013 2014 2015 2016
Gearing Ratio ROE
Gearing (x) ROE
12.80% 13.03%
11.07%
13.24%
15.30%
-
50,000
100,000
150,000
200,000
250,000
0.00%
2.00%
4.00%
6.00%
8.00%
10.00%
12.00%
14.00%
16.00%
18.00%
2012 2013 2014 2015 2016
New Booking - RHS Market Share New 4W
UnitsMarket Share

At
ASIAN INSIGHTS VICKERS SECURITIES Page 58
Company Focus
BCA Finance
Key Assumptions
FY Dec 2012 2013 2014 2015 2016
Consumer Financing Gth 29.0 16.3 (3.0) 8.9 19.6 Leasing Gth 276.7 60.2 3.4 (9.9) (8.4) Yld. On Earnings Assets 34.3 33.1 35.2 36.0 34.8 Avg Cost Of Funds 9.7 7.6 8.7 9.1 8.1
Income Statement (Rpbn)
FYDec 2012 2013 2014 2015 2016
Net Interest Income 1,206 1,448 1,616 1,706 1,905 Non-Interest Income 189 247 263 370 439 Operating Income 1,395 1,695 1,878 2,075 2,344 Operating Expenses (375) (431) (520) (638) (796) Pre-provision Profit 1,019 1,264 1,358 1,437 1,548 Provisions (46) (20) (28) (38) (36)
Associates - - - - - Exceptionals - - - - - Pre-tax Profit 973 1,243 1,329 1,399 1,512 Taxation (243) (308) (329) (352) (374) Minority Interests - - - - - Preference Dividend - - - - - Net Profit 730 935 1,001 1,047 1,139 Net Profit bef Except 730 935 1,001 1,047 1,139 Growth (%)
Net Interest Income Gth 12.3 20.1 11.6 5.6 11.7 Net Profit Gth 8.8 28.2 7.0 4.6 8.7 Margins, Costs & Efficiency (%)
Spread 24.6 25.4 26.6 27.0 26.6 Net Interest Margin 29.2 28.4 29.7 30.6 30.1 Cost-to-Income Ratio 26.9 25.4 27.7 30.8 33.9 Business Mix (%)
Net Int.Inc/Opg Inc. 86.5 85.4 86.0 82.2 81.3 Non-Int. Inc/Opg inc. 13.5 14.6 14.0 17.8 18.7 Fee Inc/Opg Income 12.7 12.9 12.1 16.0 16.8 Oth Non-Int Inc/Opg Inc 0.9 1.6 1.9 1.8 1.9 Profitability (%)
ROAE PreEx. 54.0 80.7 76.2 56.2 44.7 ROAE 54.0 80.7 76.2 56.2 44.7 ROA PreEx. 15.1 16.1 16.3 15.3 14.0 ROA 15.1 16.1 16.3 15.3 14.0
Source: Company, DBSVickers
Provisions remained low
High asset yield mainly due to significant chunk of joint- financing portion

ASIAN INSIGHTS VICKERS SECURITIES Page 59
Company Focus
BCA Finance
Balance Sheet (Rpbn)
FYDec 2012 2013 2014 2015 2016 Cash/Bank Balance 4 3 5 3 5 Government Securities - - - - - Interbank Assets - - - - - Total Net Loans & Advs. 4,610 5,426 5,274 5,707 6,785 Investment - - - - - Associates - - - - - Fixed Assets 28 30 109 180 198 Goodwill - - - - - Other Assets 201 340 741 934 1,165 Total Assets 4,843 5,798 6,128 6,824 8,152 Customer Deposits - - - - - Interbank Deposits - - - - - Debts/Borrowings 2,688 3,541 3,390 3,314 3,959 Others 926 1,167 1,203 1,321 1,291 Minorities - - - - - Shareholders ‘Funds 1,229 1,090 1,536 2,190 2,902 Total Liab & S/H’s Funds 4,843 5,798 6,128 6,824 8,152
Financial Stability Measures (%)
FYDec 2012 2013 2014 2015 2016
Balance Sheet Structure
Consumer Financing/Total Asset 95.2 93.6 86.1 83.6 83.2 Debt/Total Liability 74.4 75.2 73.8 71.5 75.4
Borrowings/Int. Bear. Liab. 6.2 19.7 38.2 27.0 42.3 Bonds/Int. Bear. Liab. 93.8 80.3 61.8 73.0 57.7 Asset Quality NPL/Total Gross Loans 0.73 0.82 1.63 1.50 1.20 NPL/Total Assets 0.69 0.75 1.37 1.23 0.99 NPL(absolute) 229.5 183.4 96.9 97.4 100.0 Provision Coverage Ratio 1.01 0.38 0.54 0.66 0.53 Liabilities Measure Gearing Ratio 2.19 3.25 2.21 1.51 1.36 Liability/Equity 2.94 4.32 2.99 2.12 1.81
Source: Company, DBSVickers
NPL maintained at low levels

ASIAN INSIGHTS VICKERS SECURITIES ed: CK / sa: MA, PY
NOT LISTED/NOT RATED Reason for Report : A proxy for the multi-finance industry Potential Catalyst: Automotive sales improvement surprise Analyst Benedictus Agung SWANDONO +6221 3003 4935 [email protected] Sue Lin LIM +65 8332 6843 [email protected] Financials
FY Dec (Rp bn) 2013A 2014A 2015A 2016A
Pre-prov. Profit 2,168 2,502 2,762 3,129 Net Profit 1,205 1,307 1,507 1,806 Net Pft (Pre Ex.) 1,205 1,307 1,507 1,806 EPS (Rp) 4,305 4,669 5,381 6,449 EPS Pre Ex. (Rp) 4,305 4,669 5,381 6,449 EPS Gth (%) 7.1 8.5 15.3 19.8 EPS Gth Pre Ex (%) 7.1 8.5 15.3 19.8 Diluted EPS (Rp) 4,305 4,669 5,381 6,449 Net DPS (Rp) - - - - ROAE Pre Ex. (%) 29 29 29 34 ROAE (%) 30.3 29.0 29.3 29.2 ROA (%) 5.9 5.6 5.2 5.2 BV Per Share (Rp) 4,600 4,820 5,831 5,061
ICB Industry : Financials ICB Sector: Financial Services Principal Business: Astra Sedaya Finance (ADMF) focuses on providing consumer financing for new and used cars, and is part of Astra Group's value chain Source of all data on this page: Company, DBS Vickers, DBS Bank
The king of two-wheeler financing
The market leader for new 2W financing; strong
support from the Astra Group
Strong presence in Java and Sumatera,
contributing up to 61% and 19%, respectively, of
total asset portfolio in FY16
Good access to both capital market and bank
funding with low cost of funds
NPL remained stable at below 1% with credit costs
still on the downtrend
Fruitful synergy with Honda motorcycles. Federal International Finance (FIF) is a captive finance company for Honda motorcycles. FIF focuses on its operation to finance Honda sales while around 30% of Honda sales are financed through FIF. Honda has consistently gained more market share, reaching 74% in FY16 (from 53% five years ago). Moreover FIF is also growing its used motorcycle business with new bookings growing at 30% CAGR 2012-2016, making up to 24% of FY16 new bookings. These helped FIF to continuously record positive new booking trends (14.8% CAGR 2012-2016).
Continuous improvement. FIF has been able to deliver strong profitability with its ROE averaging 29% in the past decade. The company is able to lower its credit cost to 1.8% in FY16 from 8.7% a decade ago. NPL is maintained at below 1% due to its disciplined 150-day overdue write-off policy. The huge customer base enables FIF to extract data for better screening process, which should allow it to maintain its good asset quality. Its strong record and business stability allowed FIF to tap into a wider range of financing sources such as banks and capital markets, both local and foreign. Key risks: Inflation. Management believes that inflation is the main risk. 65% FIF customers’ income level is less than Rp4m. The volatile price of basic needs could have an impact on customers’ purchasing power and ability to make payments.
At A Glance Major Shareholders (%) Astra Internaltional Tbk 99.9% Arya Kharisma 0.00004%
DBS Group Research . Equity 18 Apr 2017
Indonesia Company Focus
Federal International Finance Bloomberg: n.a | Reuters: n.a Refer to important disclosures at the end of this report

ASIAN INSIGHTS VICKERS SECURITIES Page 61
Company Focus
Federal International Finance
Company Background
An Astra International subsidiary. Federal International Finance (FIF) is a subsidiary of PT Astra International Tbk (ASII) and started its business in consumer financing, factoring, and leasing. Since 1996, FIF has transformed its business line by focusing on the Honda motorcycle financing segment. FIF has also expanded towards the used 2W segment. Beyond motorcycle, FIF also offers electronic & home appliances financing services and also car financing. FIF is 99.9% owned by ASII. Financial Analysis
Riding on Honda’s strong momentum. FIF is the market leader in the 2W financing space, specialising in financing new Honda motorcycles. In 2016, 33% of Astra’s 2W Honda sales were financed by FIF. Honda has proven itself to be the dominant player by increasing its market share to 74% in 2016 compared to 53% a decade ago.
2W financing remained the main contributor. Auto sales is the main driver of FIF’s income since 91% of its portfolio is 2W financing, with the remaining 9% contributed by multi-purpose and car financing. FIF also have SPEKTRA as one of the multi-purpose financing products to finance electronics, furniture, household furnishing, and hand tractor. However, the contribution remained small at 6.9%.
Good funding capabilities. FIF has a good access to funding both banks and capital markets. The company received syndicated loans amounting to USD200m-USD550m, with Sumitomo Mitsui Banking Corporation (SMBC) as facility agent from various foreign banks. In the past three years, FIF has issued bonds totalling Rp20tr with an issuance size of Rp5tr-9tr per year and has a good track record in paying interest and principal.
No material asset-quality issues. FIF has been able to keep its NPL ratio below 1% even during the slump in the motorcycle industry in 2015-2016. It considers an asset to be non-performing when repayment is 90 days past due with automatic write-off policy after 150 days overdue. Management believes that almost all of their customers are non-bankable and emphasises the importance of data customer data coverage and quality for the screening process. However, management remains confident of maintaining its strong asset quality, as 30% of the customers are recurring customers which should be less risky than new ones.
Expansion plans. Management targets new bookings to reach Rp36tr this year, while outlets and branches expansion will track the dealership expansion.
FIF: Booking composition by product (2016)
Source: Company, DBS Vickers, DBS Bank FIF: New booking as a percentage of Honda sales
Source: Company, DBS Vickers, DBS Bank Note: 68-72% of Honda sales use financing
FIF: NPL ratio and credit cost
Source: Company, DBS Vickers, DBS Bank FIF: Number of branches and employees
Source: Company, DBS Vickers, DBS Bank
New 2W67%
Used 2W24%
Multipurpose7%
Car2%
1,188 1,314 1,462 1,428 1,436
4,089
4,697 5,051 4,454 4,381
45%
44%
43%
47% 48%
39%
40%
41%
42%
43%
44%
45%
46%
47%
48%
49%
-
1,000
2,000
3,000
4,000
5,000
6,000
2012 2013 2014 2015 2016
FIF New 2W Honda Honda Sales FIF Share - RHS
% from total honda '000 Units
1.2%
0.3% 0.3% 0.4% 0.4%
3.7%
2.8%3.1%
2.6%
1.8%
0.0%
0.5%
1.0%
1.5%
2.0%
2.5%
3.0%
3.5%
4.0%
2012 2013 2014 2015 2016
NPL Ratio Credit Cost
15,363 15,429 15,75416,788
18,675
3,443 3,557 3,924 4,188 4,550
0
2,000
4,000
6,000
8,000
10,000
12,000
14,000
16,000
18,000
20,000
2012 2013 2014 2015 2016
Employee Account Managed

At
ASIAN INSIGHTS VICKERS SECURITIES Page 62
Company Focus
Federal International Finance
Funding source. Bond financing formed a significant 39% of FIF’s funding, thanks to its good reputation and long track record which enabled it to tap into the bond market. The bond market typically has a lower interest rate compared to bank borrowings, which should help lower its blended cost of funds. FIF also does joint financing, which consists of 19% of its total portfolio in FY16.
Gearing remains low. Gearing stood at 4.6x in FY16, the highest in the past four years due to FIF’s rapid growth, thanks to Honda’s improving market share. However, the low gearing level is much lower than the industry average at 8% and the regulated threshold of 10x.
Huge customer base is its advantage. FIF has a large customer base with around 4.5m active customers and 30% of them are repeat customers. A large customer database is very important since most of them are non-bankable and therefore do not have credit records. The exclusive and huge customer base should enable FIF to do better credit screening, which could translate into improving asset quality. Outlook
We believe the company will continue to grow in line with Honda sales going forward. Upside might come from the rapid growth of used motorcycle financing and the strong performance of multi-purpose financing through SPEKTRA. Key Risks: Inflation. Management believes that inflation is the main risk. 65% FIF customers has income less than Rp4m. The price volatility of basic needs could have an impact on customers’ purchasing power and ability to make payments.
FIF: Funding source in FY16
Source: Company, DBS Vickers FIF: Gearing and ROE
Source: Company, DBS Vickers FIF: Customers distribution based on income
Source: Company, DBS Vickers FIF: Customer payment method (2016)
Source: Company, DBS Vickers
Borrowings61%
Bonds39%
3.54 3.47
4.15 3.74
4.60
30% 29% 29% 29%34%
0%
10%
20%
30%
40%
50%
60%
-
0.50
1.00
1.50
2.00
2.50
3.00
3.50
4.00
4.50
5.00
2012 2013 2014 2015 2016
Gearing Ratio ROE - RHS
1.4
5.6
10.8
11.3
15.3
10
10.5
35.1
0 5 10 15 20 25 30 35 40
Income <= 1 mn
1 mn < Income <= 1.5 mn
1.5 mn < Income <= 2mn
2 mn < Income <= 2.5 mn
2.5 mn < Income <= 3 mn
3 mn < Income <= 3.5 mn
3.5 mn < Income <= 4 mn
Above 4 mn
% of customers
Credit, 68%
Cash, 32%

ASIAN INSIGHTS VICKERS SECURITIES Page 63
Company Focus
Federal International Finance
Key Assumptions
FY Dec 2012 2013 2014 2015 2016
Consumer Financing Gth 8.4 8.8 23.0 11.1 6.6 Asset Gth 10.0 12.5 17.9 13.2 2.4 Yld. On Earnings Assets 28.4 26.8 26.9 27.7 28.6 Avg Cost Of Funds 9.1 8.8 9.3 10.2 10.0
Income Statement (Rpbn)
FYDec 2012 2013 2014 2015 2016
Net Interest Income 4,078 4,092 4,603 5,259 5,975 Non-Interest Income 168 173 154 139 145 Operating Income 4,246 4,265 4,757 5,397 6,120 Operating Expenses (2,066) (2,098) (2,255) (2,635) (2,991) Pre-provision Profit 2,179 2,168 2,502 2,762 3,129 Provisions (683) (565) (763) (719) (518) Associates - - - - - Exceptionals - - - - - Pre-tax Profit 1,497 1,602 1,739 2,043 2,611 Taxation (372) (397) (432) (537) (805) Minority Interests - - - - - Preference Dividend - - - - - Net Profit 1,125 1,205 1,307 1,507 1,806 Net Profit bef Except 1,125 1,205 1,307 1,507 1,806 Growth (%)
Net Interest Income Gth 9.2 0.4 12.5 14.2 13.6 Net Profit Gth 4.3 7.1 8.5 15.3 19.8 Margins, Costs & Efficiency (%)
Spread 19.3 17.9 17.7 17.5 18.6 Net Interest Margin 21.8 20.4 20.1 19.9 20.9 Cost-to-Income Ratio 48.7 49.2 47.4 48.8 48.9 Business Mix (%)
Net Int. Inc / Opg Inc. 96.1 95.9 96.8 97.4 97.6 Non-Int. Inc / Opg inc. 3.9 4.1 3.2 2.6 2.4 Fee Inc / Opg Income - - - - - Oth Non-Int Inc/Opg Inc 3.9 4.1 3.2 2.6 2.4 Profitability (%)
ROAE Pre Ex. 30.3 29.0 29.3 29.2 33.8 ROAE 30.3 29.0 29.3 29.2 33.8 ROA Pre Ex. 5.9 5.6 5.2 5.2 6.1 ROA 5.9 5.6 5.2 5.2 6.1
Source: Company, DBS Vickers, DBS Bank
Strong financing growth despite the downturn in 2W industry sales
High asset yield in the 2W financing business is the main reason behind the high ROE level

At
ASIAN INSIGHTS VICKERS SECURITIES Page 64
Company Focus
Federal International Finance
Balance Sheet (Rpbn)
FYDec 2012 2013 2014 2015 2016
Cash/Bank Balance 957 575 437 131 241 Government Securities - - - - - Inter Bank Assets - - - - - Total Net Loans & Advs. 17,195 18,832 23,267 25,962 28,001 Investment - - - - - Associates - - - - - Fixed Assets 246 247 284 285 310 Goodwill - - - - - Other Assets 731 1,868 1,390 2,356 859 Total Assets 19,129 21,522 25,378 28,734 29,411 Customer Deposits - - - - - Inter Bank Deposits - - - - - Debts/Borrowings 14,017 15,064 19,028 21,389 22,804 Others 1,152 2,118 1,763 1,623 1,651 Minorities - - - - - Shareholders' Funds 3,960 4,340 4,586 5,723 4,955 Total Liab& S/H’s Funds 19,129 21,522 25,378 28,734 29,411
Financial Stability Measures (%)
FYDec 2012 2013 2014 2015 2016
Balance Sheet Structure Consumer Financing/ Total A t
89.9 87.5 91.7 90.4 95.2 Debt/Total Liability 92.4 87.7 91.5 92.9 93.2
Borrowings/ Int. Bear. Liab. 44.7 46.0 74.4 67.6 61.1 Bonds/ Int. Bear. Liab. 55.3 54.0 25.6 32.4 38.9
Asset Quality NPL / Total Gross Loans 1.23 0.35 0.35 0.37 0.38 NPL / Total Assets 1.19 0.32 0.34 0.35 0.37 NPL (absolute) 227.2 69.6 86.1 100.9 110.3 Provision Coverage Ratio 578.8 1,871.0 1,731.3 1,523.7 1,185.9
Liabilities Measure Gearing Ratio 3.54 3.47 4.15 3.74 4.60 Liability/Equity 3.83 3.96 4.53 4.02 4.94
Source: Company, DBS Vickers, DBS Bank
Asset quality remained stable despite the soft economic environment

ASIAN INSIGHTS VICKERS SECURITIES ed: CK / sa: MA, PY
NOT LISTED/NOT RATED Reason for Report : A proxy for the multi-finance industry Potential Catalyst: Automotive sales improvement surprise Analyst Benedictus Agung SWANDONO +6221 3003 4935 [email protected] Sue Lin LIM +65 8332 6843 [email protected] Financials
FY Dec (Rp bn) 2013A 2014A 2015A 2016A
Pre-prov. Profit 394 532 700 876 Net Profit 176 234 307 335 Net Pft (Pre Ex.) 176 234 307 335 EPS (Rp) 7 9 12 13 EPS Pre Ex. (Rp) 7 9 12 13 EPS Gth (%) (84.9) 32.7 31.1 9.3 EPS Gth Pre Ex (%) (84.9) 32.7 31.1 9.3 Diluted EPS (Rp) 7 9 12 13 PE Pre Ex. (X) N/A N/A N/A N/A Net DPS (Rp) 16 109 16 16 Div Yield (%) N/A N/A N/A N/A ROAE Pre Ex. (%) 29 30 30 25 ROAE (%) 24.8 29.0 29.6 29.7 ROA (%) 2.7 3.1 3.2 3.3 BV Per Share (Rp) 696 908 1,193 1,563 P/Book Value (x) N/A N/A N/A N/A
ICB Industry : Financials ICB Sector: Financial Services Principal Business: Mandiri Tunas Finance's business is mainly in new 4W financing. Currently, it also growing its 2W and multi-purpose financing businesses. The company is supported by a bank and automotive dealer shareholder. Source of all data on this page: Company, DBSVI, DBS Bank
Breaking boundaries
Impressive growth in the past five years, making it
one of the major players in new 4W financing
Strong synergy between Bank Mandiri and Tunas
Ridean that are MTF’s shareholders
Proven ability to keep asset quality under control
and high ROE at 25%-29%
Target to compete for top-tier customers going
forward.
Climbing to the top of the league. In the past five years, Mandiri Tunas Finance (MTF) has become a significant player in the 4W financing business with a market share of 13.3% in FY16 (from 5.8% in 2012) in terms of new units booked. It has established good networks with trademark holding sole agents (ATPM/Agen Tunggal Pemilik Merk) and automotive dealers, providing MTF with the opportunity to tap into a wider range of brands and segments. Synergies with its bank shareholder (Bank Mandiri) and automotive dealer shareholder (Tunas Ridean) have also yielded positive results.
Sound financial performance and profitability. MTF has been consistently booking positive net profit growth in the past five years, showing resilience during the downturn of the automotive industry over 2014-2015. It also able to maintain high ROE levels (25%-29%) mainly due to stable credit costs that averaged 3.3% in the past five years. Its NPL is higher than its peers at 1.5% in FY16 mainly due to write-off policy differences. Key risks: Intensifying competition. It could face tougher competition in the 4W segment, as other multi-finance companies also target Astra’s products. We believe MTF will likely to face stiff competition from BCA Finance, Astra Sedaya, and Adira Finance.
At A Glance Major Shareholders (%) Bank Mandiri Tbk 51% Tunas Ridean Tbk 49%
DBS Group Research . Equity 18 Apr 2017
Indonesia Company Focus
Mandiri Tunas Finance Bloomberg: n.a | Reuters: n.a Refer to important disclosures at the end of this report

At
ASIAN INSIGHTS VICKERS SECURITIES Page 66
Company Focus
Mandiri Tunas Finance
Company Background
Mandiri Tunas Finance (MTF) started operations as PT Tunas Financindo Corporation in 1989 to support the 4W sales of the Tunas Ridean Group. In 2009, Bank Mandiri Tbk (BMRI) acquired 51% of the shares and changed the company’s name to Mandiri Tunas Finance. 49% of the remaining shares are still owned by PT Tunas Ridean Tbk (which was owned by the Jardine Group who also owns Astra International). Geographically, 68% of the portfolio is concentrated in Java and Bali. Financial Analysis
New 4W sales remained the main contributor. Auto sales, especially 4W, is the main driver of MTF’s income since 91% of its portfolio is 4W related, while the remaining came from 2W and heavy equipment leasing. The company started to disburse multi-purpose loans last year, although the contribution remained small. Non-interest income contribution is an important contributor with 38% contribution to operating income in FY16. The fees include administration, insurances premium fees, and insurance handling fees.
Synergy with Tunas. MTF has established a strong synergy with its automotive shareholder Tunas Ridean Tbk (TURI). About 15% of MTF’s new bookings came from Tunas while 39% of Tunas’ automotive sales were financed by MTF, according to management.
Conservative growth. Management indicated that it is targeting top-tier customers with a minimum down payment of 25%. This segment should contribute 60%-70% of new lending going forward. The same conservative strategy is also used in the commercial segment. MTF will compete on service quality by offering an easy application process (two days approval for dealer reference and one day approval for bank reference) and competitive pricing. Geographically, the company would like to penetrate more into Jabodetabek (greater Jakarta) and East Java in the hope of improving its asset quality.
NPL below industry. MTF has been able to keep its NPL ratio below 2% during the economic slowdown. It considers an asset to be non-performing when repayment is 90 days past due. The company has no automatic write-off policy but it will automatically assign 100% provisions for loans 180 days past due.
Expansion plans. In FY16 MTF has 91 branches and 21 satellites. Management targets to add four new satellite offices and eight new branches to potential regions to improve market penetration.
MTF: Asset breakdown in FY16
Source: Company, DBSVI
MTF: New booking and market share
Source: Companies; *Assuming MTF only sells Astra’s brands
MTF: NPL ratio
Source: Company, DBSVI
MTF: Number of branches and employees
Source: Company, DBSVI
4W Retail76%
2W Retail2%
4W Fleet15%
Others7%
5.8%
8.3%
11.8%
14.8%13.3%
0.0%
2.0%
4.0%
6.0%
8.0%
10.0%
12.0%
14.0%
16.0%
-20,000 40,000 60,000 80,000
100,000 120,000 140,000 160,000 180,000 200,000
2012 2013 2014 2015 2016
New Bookings 4W New New Bookings 4W Used
Market Share
Unit Person
1.2% 1.1% 1.0%1.2%
1.5%
2.9% 2.8%3.0% 3.1%
3.8%
0.0%
0.5%
1.0%
1.5%
2.0%
2.5%
3.0%
3.5%
4.0%
4.5%
2012 2013 2014 2015 2016
NPL Ratio Credit Cost
68 77
88 93 91
2,371
2,793
3,329
3,725 3,577
-
500
1,000
1,500
2,000
2,500
3,000
3,500
4,000
-
10
20
30
40
50
60
70
80
90
100
2012 2013 2014 2015 2016
Branches Employee - RHS
Unit Person
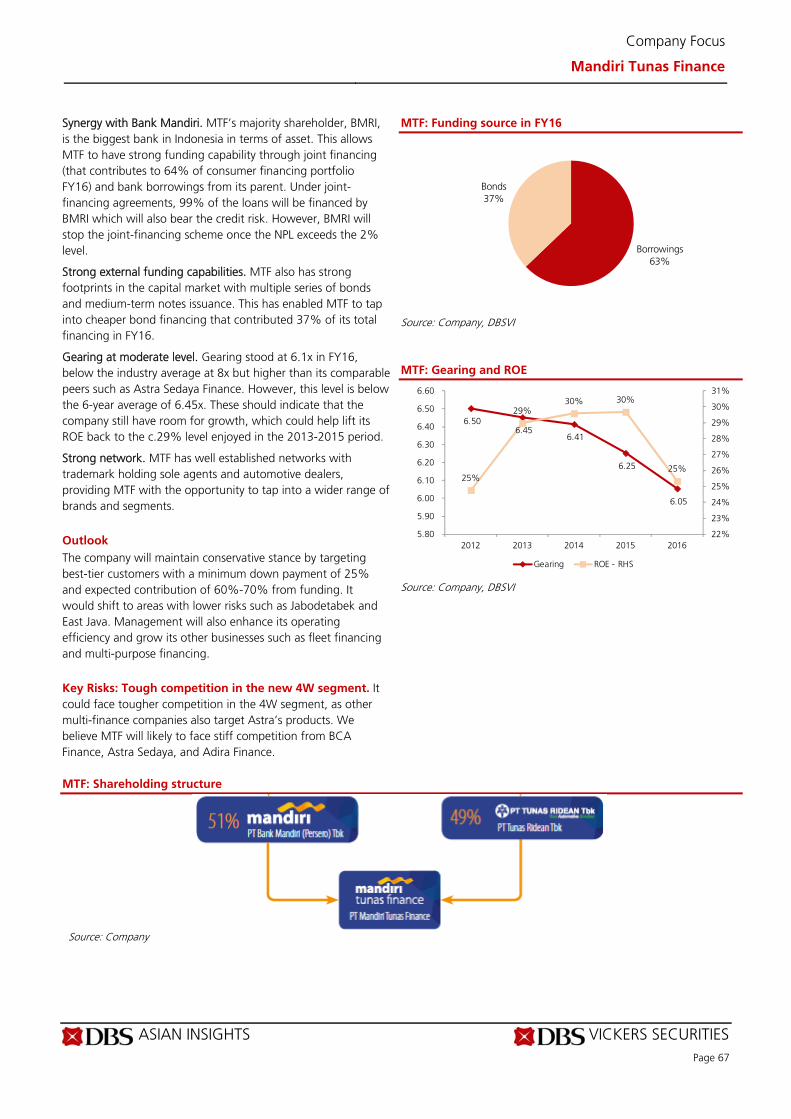
ASIAN INSIGHTS VICKERS SECURITIES Page 67
Company Focus
Mandiri Tunas Finance
Synergy with Bank Mandiri. MTF’s majority shareholder, BMRI, is the biggest bank in Indonesia in terms of asset. This allows MTF to have strong funding capability through joint financing (that contributes to 64% of consumer financing portfolio FY16) and bank borrowings from its parent. Under joint- financing agreements, 99% of the loans will be financed by BMRI which will also bear the credit risk. However, BMRI will stop the joint-financing scheme once the NPL exceeds the 2% level.
Strong external funding capabilities. MTF also has strong footprints in the capital market with multiple series of bonds and medium-term notes issuance. This has enabled MTF to tap into cheaper bond financing that contributed 37% of its total financing in FY16.
Gearing at moderate level. Gearing stood at 6.1x in FY16, below the industry average at 8x but higher than its comparable peers such as Astra Sedaya Finance. However, this level is below the 6-year average of 6.45x. These should indicate that the company still have room for growth, which could help lift its ROE back to the c.29% level enjoyed in the 2013-2015 period.
Strong network. MTF has well established networks with trademark holding sole agents and automotive dealers, providing MTF with the opportunity to tap into a wider range of brands and segments. Outlook
The company will maintain conservative stance by targeting best-tier customers with a minimum down payment of 25% and expected contribution of 60%-70% from funding. It would shift to areas with lower risks such as Jabodetabek and East Java. Management will also enhance its operating efficiency and grow its other businesses such as fleet financing and multi-purpose financing. Key Risks: Tough competition in the new 4W segment. It could face tougher competition in the 4W segment, as other multi-finance companies also target Astra’s products. We believe MTF will likely to face stiff competition from BCA Finance, Astra Sedaya, and Adira Finance.
MTF: Funding source in FY16
Source: Company, DBSVI
MTF: Gearing and ROE
Source: Company, DBSVI
MTF: Shareholding structure
Source: Company
Borrowings63%
Bonds37%
6.50 6.45
6.41
6.25
6.05
25%
29%30% 30%
25%
22%
23%
24%
25%
26%
27%
28%
29%
30%
31%
5.80
5.90
6.00
6.10
6.20
6.30
6.40
6.50
6.60
2012 2013 2014 2015 2016
Gearing ROE - RHS

At
ASIAN INSIGHTS VICKERS SECURITIES Page 68
Company Focus
Mandiri Tunas Finance
Key Assumptions
FY Dec 2012 2013 2014 2015 2016
Consumer Financing Gth 17.2 22.0 31.1 33.9 22.2 Leasing Gth 745.1 88.1 26.5 (22.9) 38.1 Yld. On Earnings Assets 16.9 19.0 18.6 19.2 18.8 Avg Cost Of Funds 9.9 11.3 10.8 10.8 11.3
IncomeStatement (Rpbn)
FYDec 2012 2013 2014 2015 2016
Net Interest Income 348 483 622 827 953 Non-Interest Income 180 239 343 457 575 Operating Income 528 723 965 1,284 1,528 Operating Expenses (251) (329) (433) (584) (652) Pre-provision Profit 277 394 532 700 876 Provisions (121) (157) (220) (289) (427)
Associates - 1 2 3 3 Exceptionals - 1 2 3 3 Pre-tax Profit 156 239 316 417 455 Taxation (39) (61) (78) (104) (114) Minority Interests - 1 2 3 3 Preference Dividend - 1 2 3 3 Net Profit 117 180 242 319 347 Net Profit bef Except 117 180 242 319 347 Growth (%)
Net Interest Income Gth 36.8 38.9 28.7 33.0 15.2 Net Profit Gth 77.2 51.3 32.7 31.1 9.3 Margins, Costs & Efficiency (%)
Spread 7.0 7.8 7.8 8.4 7.5 Net Interest Margin 8.9 9.9 9.9 10.4 9.6 Cost-to-Income Ratio 47.6 45.5 44.8 45.5 42.7 Business Mix (%)
Net Int.Inc/Opg Inc. 65.9 66.9 64.5 64.4 62.4 Non-Int. Inc/Opg inc. 34.1 33.1 35.5 35.6 37.6 Oth Non-Int Inc/Opg Inc 34.1 33.1 35.5 35.6 37.6 Profitability (%)
ROAE PreEx. 24.8 29.0 29.6 29.7 25.3 ROAE 24.8 29.0 29.6 29.7 25.3 ROA PreEx. 2.7 3.1 3.2 3.3 2.9 ROA 2.7 3.1 3.2 3.3 2.9
Source: Company, DBSVI
Provisions were kept in check despite the automatic 100% provisioning after 180 days overdue
Strong financing growth in the past five years has made MTF as one of the biggest players in the new 4W financing space

ASIAN INSIGHTS VICKERS SECURITIES Page 69
Company Focus
Mandiri Tunas Finance
Balance Sheet (Rpbn)
FYDec 2012 2013 2014 2015 2016 Cash/Bank Balance 166 191 273 92 258 Government Securities - 1 2 3 3 Interbank Assets - 1 2 3 3 Total Net Loans & Advs. 4,045 5,124 6,660 8,482 10,499 Investment - 1 2 3 3 Associates - 1 2 3 3 Fixed Assets 28 44 75 103 141 Goodwill - 1 2 3 3 Other Assets 149 281 414 526 506 Total Assets 4,388 5,644 7,432 9,218 11,419 Customer Deposits - 1 2 3 3 Interbank Deposits - 1 2 3 3 Debts/Borrowings 3,440 4,438 5,739 7,332 8,925 Others 419 514 789 698 1,005 Minorities - 1 2 3 3 Shareholders ‘Funds 529 688 895 1,173 1,474 Total Liab & S/H’s Funds 4,388 5,642 7,428 9,212 11,413
Financial Stability Measures(%)
FYDec 2012 2013 2014 2015 2016
Balance Sheet Structure
Consumer Financing/Tota lAsset 92.2 90.9 89.7 92.2 92.1 Debt/Total Liability 89.1 89.6 87.9 91.3 89.9 Borrowings/Int. Bear. Liab. 78.2 73.0 74.8 74.8 62.8 Bonds/Int. Bear. Liab. 21.8 27.0 25.2 25.2 37.2 Asset Quality NPL/Total Gross Loans 1.19 1.13 1.10 1.17 1.49 NPL/Total Assets 3.67 3.71 3.80 4.15 4.97 NPL(absolute) 161.0 209.0 281.9 382.3 567.3 Provision Coverage Ratio 18.2 37.2 52.8 55.7 43.0 Liabilities Measure Gearing Ratio 6.50 6.45 6.41 6.25 6.05 Liability/Equity 7.30 7.20 7.30 6.85 6.74
Source: Company, DBSVI
NPL remained low despite the absence of automatic write- off policy

Industry Focus
Page 70
DBS Bank, DBSVI recommendations are based an Absolute Total Return* Rating system, defined as follows:
STRONG BUY (>20% total return over the next 3 months, with identifiable share price catalysts within this time frame)
BUY (>15% total return over the next 12 months for small caps, >10% for large caps)
HOLD (-10% to +15% total return over the next 12 months for small caps, -10% to +10% for large caps)
FULLY VALUED (negative total return i.e. > -10% over the next 12 months)
SELL (negative total return of > -20% over the next 3 months, with identifiable catalysts within this time frame)
Share price appreciation + dividends
Completed Date: 12 Apr 2017 18:10:03 (WIB) Dissemination Date: 17 Apr 2017 17:49:52 (WIB)
GENERAL DISCLOSURE/DISCLAIMER
This report is prepared by DBS Bank Ltd, PT DBS Vickers Sekuritas Indonesia (''DBSVI''). This report is solely intended for the clients of DBS Bank
Ltd, its respective connected and associated corporations and affiliates only and no part of this document may be (i) copied, photocopied or
duplicated in any form or by any means or (ii) redistributed without the prior written consent of DBS Bank Ltd, PT DBS Vickers Sekuritas Indonesia
(''DBSVI'').
The research set out in this report is based on information obtained from sources believed to be reliable, but we (which collectively refers to DBS
Bank Ltd, its respective connected and associated corporations, affiliates and their respective directors, officers, employees and agents (collectively,
the “DBS Group”) have not conducted due diligence on any of the companies, verified any information or sources or taken into account any other
factors which we may consider to be relevant or appropriate in preparing the research. Accordingly, we do not make any representation or
warranty as to the accuracy, completeness or correctness of the research set out in this report. Opinions expressed are subject to change without
notice. This research is prepared for general circulation. Any recommendation contained in this document does not have regard to the specific
investment objectives, financial situation and the particular needs of any specific addressee. This document is for the information of addressees
only and is not to be taken in substitution for the exercise of judgement by addressees, who should obtain separate independent legal or financial
advice. The DBS Group accepts no liability whatsoever for any direct, indirect and/or consequential loss (including any claims for loss of profit)
arising from any use of and/or reliance upon this document and/or further communication given in relation to this document. This document is not
to be construed as an offer or a solicitation of an offer to buy or sell any securities. The DBS Group, along with its affiliates and/or persons
associated with any of them may from time to time have interests in the securities mentioned in this document. The DBS Group, may have
positions in, and may effect transactions in securities mentioned herein and may also perform or seek to perform broking, investment banking and
other banking services for these companies.
Any valuations, opinions, estimates, forecasts, ratings or risk assessments herein constitutes a judgment as of the date of this report, and there can
be no assurance that future results or events will be consistent with any such valuations, opinions, estimates, forecasts, ratings or risk assessments.
The information in this document is subject to change without notice, its accuracy is not guaranteed, it may be incomplete or condensed, it may
not contain all material information concerning the company (or companies) referred to in this report and the DBS Group is under no obligation to
update the information in this report.
This publication has not been reviewed or authorized by any regulatory authority in Singapore, Hong Kong or elsewhere. There is no planned
schedule or frequency for updating research publication relating to any issuer.
The valuations, opinions, estimates, forecasts, ratings or risk assessments described in this report were based upon a number of estimates and
assumptions and are inherently subject to significant uncertainties and contingencies. It can be expected that one or more of the estimates on
which the valuations, opinions, estimates, forecasts, ratings or risk assessments were based will not materialize or will vary significantly from actual
results. Therefore, the inclusion of the valuations, opinions, estimates, forecasts, ratings or risk assessments described herein IS NOT TO BE RELIED
UPON as a representation and/or warranty by the DBS Group (and/or any persons associated with the aforesaid entities), that:
(a) such valuations, opinions, estimates, forecasts, ratings or risk assessments or their underlying assumptions will be achieved, and
(b) there is any assurance that future results or events will be consistent with any such valuations, opinions, estimates, forecasts, ratings or risk
assessments stated therein.
Please contact the primary analyst for valuation methodologies and assumptions associated with the covered companies or price targets.
Any assumptions made in this report that refers to commodities, are for the purposes of making forecasts for the company (or companies)
mentioned herein. They are not to be construed as recommendations to trade in the physical commodity or in the futures contract relating to the
commodity referred to in this report.
Industry Focus
Page 71
DBSVUSA, a US-registered broker-dealer, does not have its own investment banking or research department, has not participated in any public
offering of securities as a manager or co-manager or in any other investment banking transaction in the past twelve months and does not engage
in market-making.
ANALYST CERTIFICATION
The research analyst(s) primarily responsible for the content of this research report, in part or in whole, certifies that the views about the
companies and their securities expressed in this report accurately reflect his/her personal views. The analyst(s) also certifies that no part of his/her
compensation was, is, or will be, directly or indirectly, related to specific recommendations or views expressed in the report. The research analyst (s)
primarily responsible for the content of this research report, in part or in whole, certifies that he or his associate1 does not serve as an officer of the
issuer or the new listing applicant (which includes in the case of a real estate investment trust, an officer of the management company of the real
estate investment trust; and in the case of any other entity, an officer or its equivalent counterparty of the entity who is responsible for the
management of the issuer or the new listing applicant) and the research analyst(s) primarily responsible for the content of this research report or
his associate does not have financial interests2 in relation to an issuer or a new listing applicant that the analyst reviews. DBS Group has
procedures in place to eliminate, avoid and manage any potential conflicts of interests that may arise in connection with the production of
research reports. The research analyst(s) responsible for this report operates as part of a separate and independent team to the investment
banking function of the DBS Group and procedures are in place to ensure that confidential information held by either the research or investment
banking function is handled appropriately. There is no direct link of DBS Group's compensation to any specific investment banking function of the
DBS Group.
COMPANY-SPECIFIC / REGULATORY DISCLOSURES
1. DBS Bank Ltd, DBS Vickers Securities (Singapore) Pte Ltd (''DBSVS''), their subsidiaries and/or other affiliates do not have a proprietary
position in the securities recommended in this report as of 31 Mar 2017.
2. PT DBS Vickers Sekuritas Indonesia (''DBSVI'') have a proprietary position in Bank Central Asia, Bank Negara Indonesia, Bank Rakyat
Indonesia, Bank Tabungan Negara, Bank Danamon, BFI Finance, Bank Mandiri, Panin Bank, recommended in this report as of 13 April 2017.
3. Neither DBS Bank Ltd, DBS HK nor DBSV HK market makes in equity securities of the issuer(s) or company(ies) mentioned in this Research
Report.
Compensation for investment banking services:
4. DBS Bank Ltd, DBSVS, their subsidiaries and/or other affiliates of DBSVUSA have received compensation, within the past 12 months for
investment banking services from Bank Central Asia, Bank Tabungan Negara, BFI Finance Indonesia, Bank Rakyat Indonesia, Adira Dinamika
Multifinance, BCA Finance and Astra Sedaya Finance as of 31 Mar 2017.
5. DBS Bank Ltd., DBSVS, their subsidiaries and/or other affiliates of DBSVUSA, within the next 3 months, will receive or intend to seek
compensation for investment banking services from Bank Rakyat Indonesia as of 31 Mar 2017.
6. DBS Bank Ltd., DBSVS, their subsidiaries and/or other affiliates of DBSVUSA have managed or co-managed a public offering of securities for
Bank Tabungan Negara, Bank Rakyat Indonesia, BFI Finance, BCA Finance, Adira Dinamika Multifinance in the past 12 months, as of 31 Mar
2017.
7. DBSVUSA does not have its own investment banking or research department, nor has it participated in any public offering of securities as a
manager or co-manager or in any other investment banking transaction in the past twelve months. Any US persons wishing to obtain further
information, including any clarification on disclosures in this disclaimer, or to effect a transaction in any security discussed in this document
should contact DBSVUSA exclusively.
Disclosure of previous investment recommendation produced:
8. DBS Bank Ltd, DBS Vickers Securities (Singapore) Pte Ltd (''DBSVS''), their subsidiaries and/or other affiliates may have published other
investment recommendations in respect of the same securities / instruments recommended in this research report during the preceding 12
months. Please contact the primary analyst listed in the first page of this report to view previous investment recommendations published by
DBS Bank Ltd, DBS Vickers Securities (Singapore) Pte Ltd (''DBSVS''), their subsidiaries and/or other affiliates in the preceding 12 months.
1 An associate is defined as (i) the spouse, or any minor child (natural or adopted) or minor step-child, of the analyst; (ii) the trustee of a trust of which the analyst, his
spouse, minor child (natural or adopted) or minor step-child, is a beneficiary or discretionary object; or (iii) another person accustomed or obliged to act in accordance with the directions or instructions of the analyst.
2 Financial interest is defined as interests that are commonly known financial interest, such as investment in the securities in respect of an issuer or a new listing applicant, or financial accommodation arrangement between the issuer or the new listing applicant and the firm or analysis. This term does not include commercial lending conducted at arm's length, or investments in any collective investment scheme other than an issuer or new listing applicant notwithstanding the fact that the scheme has investments in securities in respect of an issuer or a new listing applicant.

Industry Focus
Page 72
RESTRICTIONS ON DISTRIBUTION
General This report is not directed to, or intended for distribution to or use by, any person or entity who is a citizen or resident of or located in any locality, state, country or other jurisdiction where such distribution, publication, availability or use would be contrary to law or regulation.
Australia This report is being distributed in Australia by DBS Bank Ltd. (“DBS”) or DBS Vickers Securities (Singapore) Pte Ltd (“DBSVS”), both of which are exempted from the requirement to hold an Australian Financial Services Licence under the Corporation Act 2001 (“CA”) in respect of financial services provided to the recipients. Both DBS and DBSVS are regulated by the Monetary Authority of Singapore under the laws of Singapore, which differ from Australian laws. Distribution of this report is intended only for “wholesale investors” within the meaning of the CA.
Hong Kong This report has been prepared by a person(s) who is not licensed by the Hong Kong Securities and Futures Commission to carry on the regulated activity of advising on securities in Hong Kong pursuant to the Securities and Futures Ordinance (Chapter 571 of the Laws of Hong Kong). This report is being distributed in Hong Kong and is attributable to DBS Vickers Hong Kong Limited, a licensed corporation licensed by the Hong Kong Securities and Futures Commission to carry on the regulated activity of advising on securities pursuant to the Securities and Futures Ordinance (Chapter 571 of the Laws of Hong Kong).
This report has been prepared by an entity(ies) which is not licensed by the Hong Kong Securities and Futures Commission to carry on the regulated activity of advising on securities pursuant to the Securities and Futures Ordinance (Chapter 571 of the Laws of Hong Kong). This report is being distributed in Hong Kong and is attributable to DBS Vickers Hong Kong Limited, a licensed corporation licensed by the Hong Kong Securities and Futures Commission to carry on the regulated activity of advising on securities pursuant to the Securities and Futures Ordinance (Chapter 571 of the Laws of Hong Kong).
For any query regarding the materials herein, please contact Paul Yong (CE. No. ASE988) at [email protected].
Indonesia This report is being distributed in Indonesia by PT DBS Vickers Sekuritas Indonesia.
Malaysia This report is distributed in Malaysia by AllianceDBS Research Sdn Bhd ("ADBSR"). Recipients of this report, received from ADBSR are to contact the undersigned at 603-2604 3333 in respect of any matters arising from or in connection with this report. In addition to the General Disclosure/Disclaimer found at the preceding page, recipients of this report are advised that ADBSR (the preparer of this report), its holding company Alliance Investment Bank Berhad, their respective connected and associated corporations, affiliates, their directors, officers, employees, agents and parties related or associated with any of them may have positions in, and may effect transactions in the securities mentioned herein and may also perform or seek to perform broking, investment banking/corporate advisory and other services for the subject companies. They may also have received compensation and/or seek to obtain compensation for broking, investment banking/corporate advisory and other services from the subject companies.
Wong Ming Tek, Executive Director, ADBSR
Singapore This report is distributed in Singapore by DBS Bank Ltd (Company Regn. No. 196800306E) or DBSVS (Company Regn No.
198600294G), both of which are Exempt Financial Advisers as defined in the Financial Advisers Act and regulated by the Monetary Authority of Singapore. DBS Bank Ltd and/or DBSVS, may distribute reports produced by its respective foreign entities, affiliates or other foreign research houses pursuant to an arrangement under Regulation 32C of the Financial Advisers Regulations. Where the report is distributed in Singapore to a person who is not an Accredited Investor, Expert Investor or an Institutional Investor, DBS Bank Ltd accepts legal responsibility for the contents of the report to such persons only to the extent required by law. Singapore recipients should contact DBS Bank Ltd at 6327 2288 for matters arising from, or in connection with the report.
Thailand This report is being distributed in Thailand by DBS Vickers Securities (Thailand) Co Ltd. Research reports distributed are only intended for institutional clients only and no other person may act upon it.
United Kingdom
This report is produced by DBS Bank Ltd which is regulated by the Monetary Authority of Singapore. This report is disseminated in the United Kingdom by DBS Vickers Securities (UK) Ltd, ("DBSVUK"). DBSVUK is authorised and regulated by the Financial Conduct Authority in the United Kingdom. In respect of the United Kingdom, this report is solely intended for the clients of DBSVUK, its respective connected and associated corporations and affiliates only and no part of this document may be (i) copied, photocopied or duplicated in any form or by any means or (ii) redistributed without the prior written consent of DBSVUK. This communication is directed at persons having professional experience in matters relating to investments. Any investment activity following from this communication will only be engaged in with such persons. Persons who do not have professional experience in matters relating to investments should not rely on this communication.

Industry Focus
Page 73
Dubai
This research report is being distributed by DBS Bank Ltd., (DIFC Branch) having its office at PO Box 506538, 3rd Floor, Building 3, East Wing, Gate Precinct, Dubai International Financial Centre (DIFC), Dubai, United Arab Emirates. DBS Bank Ltd., (DIFC Branch) is regulated by The Dubai Financial Services Authority. This research report is intended only for professional clients (as defined in the DFSA rulebook) and no other person may act upon it.
United States This report was prepared by DBS Bank Ltd. DBSVUSA did not participate in its preparation. The research analyst(s) named on this report are not registered as research analysts with FINRA and are not associated persons of DBSVUSA. The research analyst(s) are not subject to FINRA Rule 2241 restrictions on analyst compensation, communications with a subject company, public appearances and trading securities held by a research analyst. This report is being distributed in the United States by DBSVUSA, which accepts responsibility for its contents. This report may only be distributed to Major U.S. Institutional Investors (as defined in SEC Rule 15a-6) and to such other institutional investors and qualified persons as DBSVUSA may authorize. Any U.S. person receiving this report who wishes to effect transactions in any securities referred to herein should contact DBSVUSA directly and not its affiliate.
Other jurisdictions
In any other jurisdictions, except if otherwise restricted by laws or regulations, this report is intended only for qualified, professional, institutional or sophisticated investors as defined in the laws and regulations of such jurisdictions.
DBS Bank Ltd
12 Marina Boulevard, Marina Bay Financial Centre Tower 3 Singapore 018982 Tel. 65-6878 8888
e-mail: [email protected] Company Regn. No. 196800306E