indonesia recent economic development, challenges and
TRANSCRIPT
Indonesia Recent Economic Development,
Challenges and Policy Response
Mirza Adityaswara
Senior Deputy Governor
April 4th 2018

#
2
‘17 ‘18 ‘19 ‘17 ‘18 ‘19 ‘17 ‘18 ‘19
WORLD 3.2 3.7 3.8 3.8 3.8 3.9 3.7 3.7 3.9 3.9
AE 1.7 2.4 2.3 2.1 2.3 2.3 2 2.3 2.3 2.2
US 1.5 2.3 2.6 2.4 2.3 2.6 2.2 2.3 2.7 2.5
Euro 1.8 2.5 2.3 2.0 2.4 2.1 1.8 2.4 2.2 2.0
Japan 1 1.8 1.2 0.9 1.7 1.3 1.1 1.8 1.2 0.9
EM 4.3 4.6 4.8 5.0 5.2 5.3 5.2 4.7 4.9 5.0
China 6.7 6.9 6.7 6.5 6.8 6.5 6.3 6.8 6.6 6.4
India 7.1 6.4 7.2 7.5 6.4 7.4 7.4 6.7 7.4 7.8
WTV 1.4 4.5 4.5 4.5 4.7 4.6 4.4
Oil (USD per barel)* 41 52 60 57 52.7 59.9 56.4
IHex 5.4 21.7 2.8 -2.9
LIBOR 3 month 0.7 1.26 2.33 2.72
Jan'182016
Bank Indonesia CF WEO
Feb ‘18 Jan ‘17
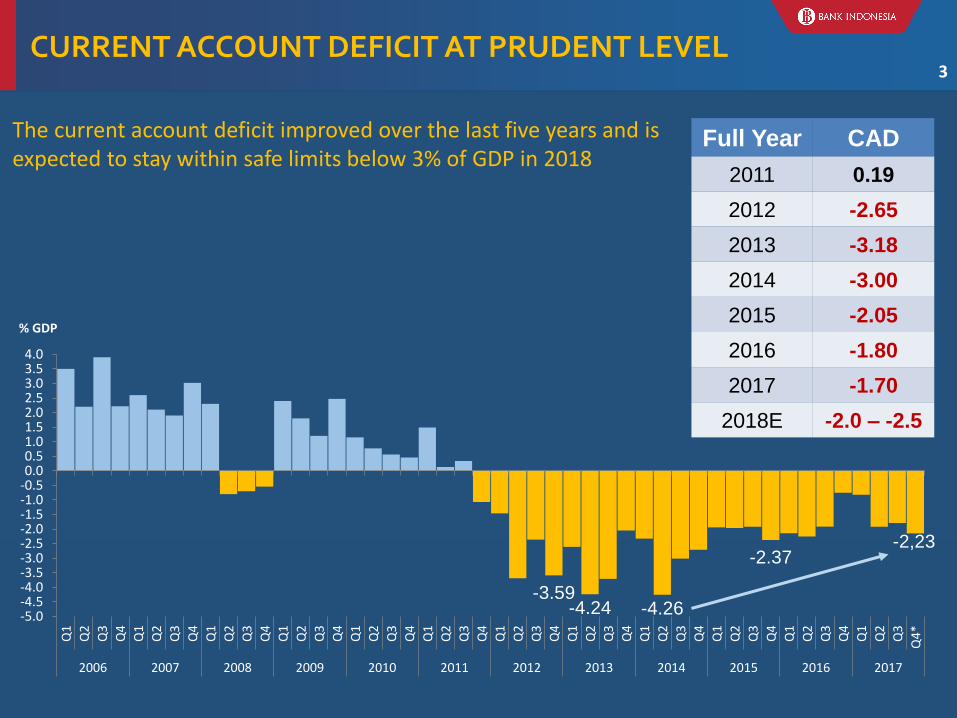
-3.59-4.24 -4.26
-2.37-2,23
-5.0-4.5-4.0-3.5-3.0-2.5-2.0-1.5-1.0-0.50.00.51.01.52.02.53.03.54.0
Q1
Q2
Q3
Q4
Q1
Q2
Q3
Q4
Q1
Q2
Q3
Q4
Q1
Q2
Q3
Q4
Q1
Q2
Q3
Q4
Q1
Q2
Q3
Q4
Q1
Q2
Q3
Q4
Q1
Q2
Q3
Q4
Q1
Q2
Q3
Q4
Q1
Q2
Q3
Q4
Q1
Q2
Q3
Q4
Q1
Q2
Q3
Q4
*
2006 2007 2008 2009 2010 2011 2012 2013 2014 2015 2016 2017
% GDP
Full Year CAD
2011 0.19
2012 -2.65
2013 -3.18
2014 -3.00
2015 -2.05
2016 -1.80
2017 -1.70
2018E -2.0 – -2.5
The current account deficit improved over the last five years and is expected to stay within safe limits below 3% of GDP in 2018
CURRENT ACCOUNT DEFICIT AT PRUDENT LEVEL3

CURRENT ACCOUNT DEFICIT COMPARISON4
3.01.0
5.7
25.0
16.1
-5.7
0.22.6 2.5
23.0
11.2
-9.0
-1.7
11.7
-0.1
19.3
3.0
-3.8
-15.0
-10.0
-5.0
0.0
5.0
10.0
15.0
20.0
25.0
30.0
ID TH PH SG MA TR
2006 2011 2017 Source: bloomberg
% GDP
5
* Provisional figure, ** very provisional figure, ***(e) forecast
(10.00)
-
10.00
20.00
30.00
40.00
50.00
1 3 5 7 9111 3 5 7 9111 3 5 7 9111 3 5 7 9111 3 5 7 9111 3 5 7 9111 3 5 7 9111 3 5 7 9111 3 5 7 9111 3 5 7 9111 3 5 7 9111 3 5 7 9111 3 5 7 9111
2005 2006 2007 2008 2009 2010 2011 2012 2013 2014 2015 2016 2017 2018
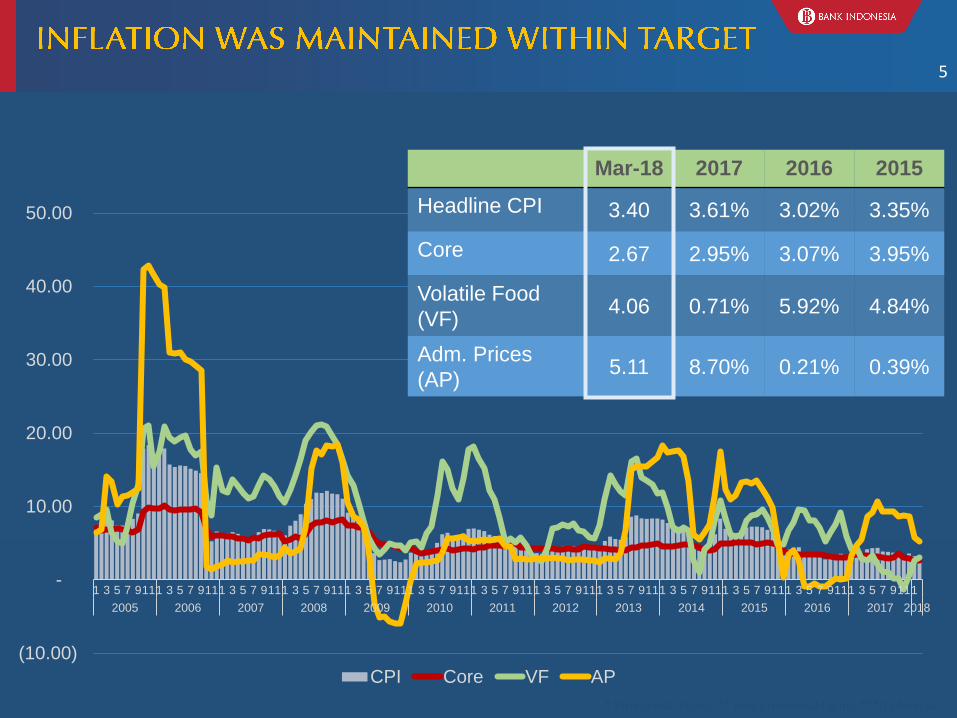
CPI Core VF AP
Mar-18 2017 2016 2015
Headline CPI 3.40 3.61% 3.02% 3.35%
Core 2.67 2.95% 3.07% 3.95%
Volatile Food
(VF)4.06 0.71% 5.92% 4.84%
Adm. Prices
(AP)5.11 8.70% 0.21% 0.39%

29
PDRB ≥ 7,0% 5,0% ≤ PDRB < 6,0% 4,0% ≤ PDRB < 5,0% PDRB < 0%6,0% ≤ PDRB < 7,0% 0% ≤ PDRB < 4,0%
KALTARA6,17
Source: BPS
KALTARA6,46
4
ACEH4,19
SUMUT5,12
RIAU2,71
SUMBAR5,29 JAMBI
4,64
BENGKULU4,99
SUMSEL5,51
LAMPUNG5,17
KEP. RIAU2,01
KEP. BABEL4,51
KALBAR5,17
KALTENG6,74
KALSEL5,29
BANTEN5,71 JABAR
5,29
DKI6,22
JATENG5,27 JATIM
5,45
BALI5,59
NTB0,11
NTT5,16
SULUT6,32GORONTALO
6,74
SULTENG7,14
SULBAR6,67
SULSEL7,23
SULTRA6,81
MALUKU5,81
MALUT7,67 PAPBAR
4,01
PAPUA4,64
KALTIM3,13
DIY5,26
#
7
-10.0
-9.0
-8.0
-7.0
-6.0
-5.0
-4.0
-3.0
-2.0
-1.0
0.0
%
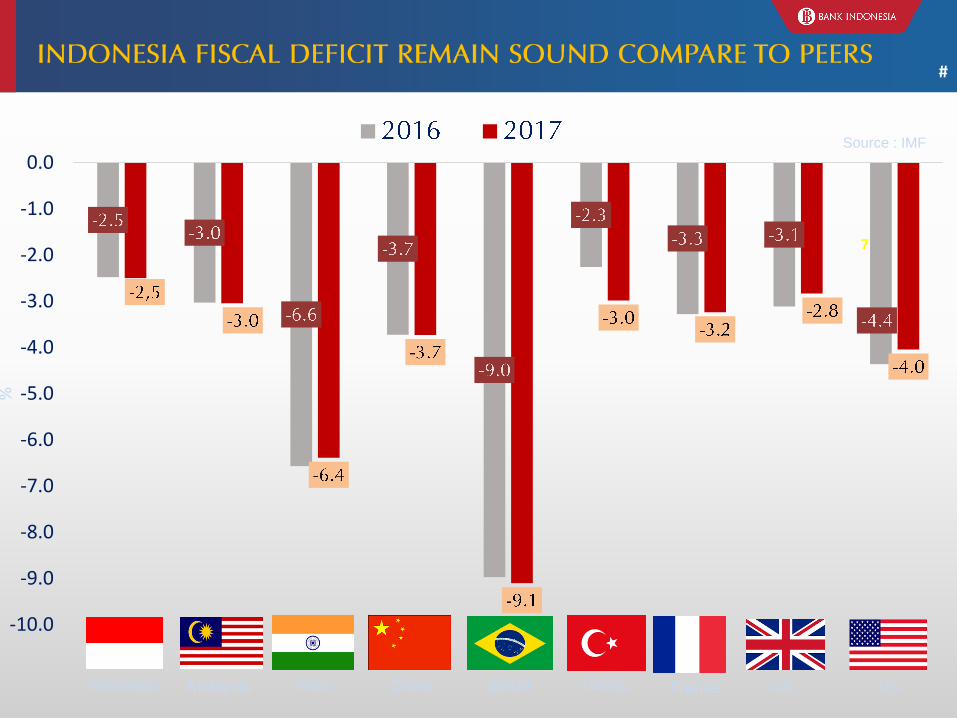
Indonesia Malaysia USIndia China Brazil Turkey
Source : IMF
UKFrance

8
8
Loan to Deposit Ratio (%)Liquidity Ratio
Capital Adequacy Ratio (%)NPL Gross & Coverage Ratio
As of Jan’18
111.12%
45.84%
88.72%
40%
50%
60%
70%
80%
90%
100%
110%
120%
19
96
19
98
20
00
20
02
20
04
20
06
20
08
20
10
20
12
20
14
20
16
Feb
'18
23.71
16.0
23.25
15
16
17
18
19
20
21
22
23
24
Jan-04
Jul-04
Jan-05
Jul-05
Jan-06
Jul-06
Jan-07
Jul-07
Jan-08
Jul-08
Jan-09
Jul-09
Jan-10
Jul-10
Jan-11
Jul-11
Jan-12
Jul-12
Jan-13
Jul-13
Jan-14
Jul-14
Jan-15
Jul-15
Jan-16
Jul-16
Jan-17
Jul-17
Jan-18
109
50
23
8.5
0
5
10
15
20
25
30
35
40
45
0
20
40
60
80
100
120
140
160
180
200AL/NCD AL/DPK (RHS)
2.88
116
0
20
40
60
80
100
120
140
160
1.5
2.0
2.5
3.0
3.5
4.0
4.5
5.0
Jan
-10
Jul-
10
Jan
-11
Jul-
11
Jan
-12
Jul-
12
Jan
-13
Jul-
13
Jan
-14
Jul-
14
Jan
-15
Jul-
15
Jan
-16
Jul-
16
Jan
-17
Jul-
17
Jan
-18
NPL (%) Coverage Ratio% (rhs)

Further relaxation of LTV for property loans (Sept)
Strengthening systemic surveillance & Crisis Management Protocol (April)
E-money for social transfer (Nov)
Financial Technology (FinTech) Office (Nov)
New Rupiah issuance (Dec)
Obligation to use IDR in domestic transaction (March)
Non-cash movement (GNNT)
Market-based exchange rate stability consistent with fundamental Dual intervention in the FX market and purchases of government bonds
from secondary market in time of distress (capital reversal) or large mis-alignment
• BI 7-day RR Rate cut of 25bps to 4.50% (Aug)
• Further BI 7-day RR Rate cut of 25 bps to 4.25% (Sept)
• Further lowering RR by 100bps to 6.5% (Feb)
• Lowering RR by 50bps to 7.5% (Nov)
Policy Rate cuts of 150bps
Moving from BI Rate (12 month) to BI 7-day Reverse Repo Rate (Aug)
1. Monetary Policy
Policy Rate
Reserve Requirement
2. Exchange Rate Policy
3. Macroprudential Policy
• Relaxation of LTV for property and automotive loans (June)
• BI Rate cut of 25bps (Feb)
• Implementation of RR Averaging (Aug): RR fixed 5%; RR Averaging 1.5%
Initiative to issue macroprudentialregulation on Financing to Funding Ratio (FFR)
4. Payment System Policy
National Payment Gateway (June)
Modernized cash management underway
2015 2016 2017
Impacts of LTV Relaxation
Monetary Transmission
Policy Rate↓ 200 bps
(Jan‘16 – Sept’17)
RR↓ 150 bps
(Dec’15 –Mar’16)
Deposit Rate(Jan’16 – Jan’18)
↓ 196 bps (5.98%)
Lending Rate(Jan’16 – Jan’18)
↓151 bps (11.32%)
Deposit(Jan’17 – Jan’18 (LBU)
Total ↑ Rp403 T (8.36% yoy)
Lending
(Jan’17 – Jan’18 (LBU)Total ↑ Rp319 T (7.40% yoy)
Des-16 Des-17
Construction 20.33 15.48
Real Estate 22.22 5.67
Housing 7.67 10.53
Total 7.86 8.24
LoanGrowth % (yoy)
9
#
11
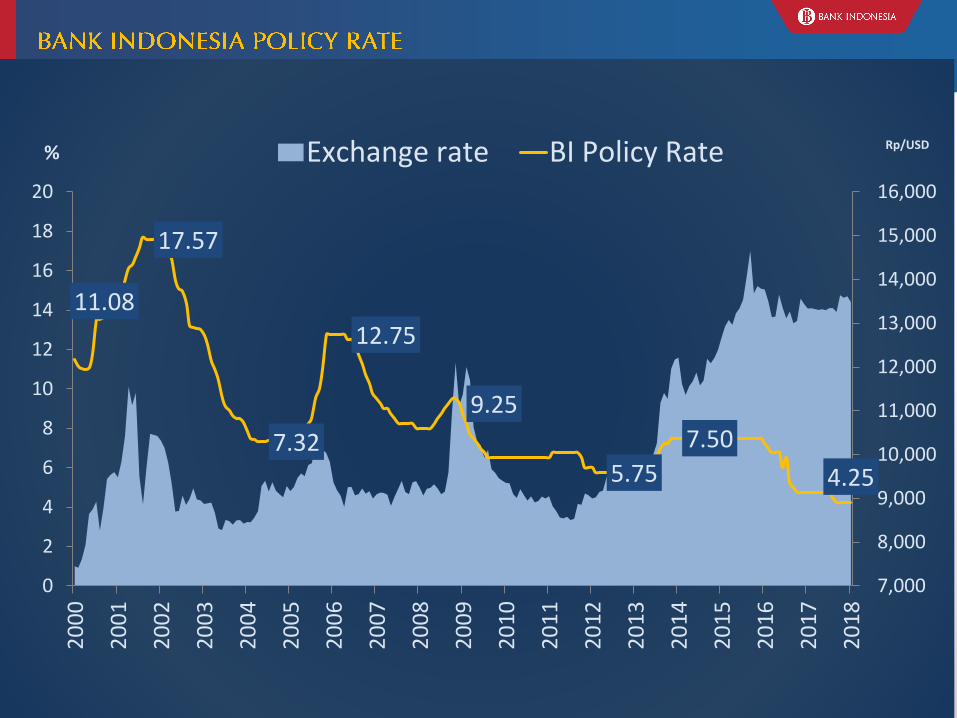
11.08
17.57
7.32
12.75
9.25
5.75
7.50
4.25
7,000
8,000
9,000
10,000
11,000
12,000
13,000
14,000
15,000
16,000
0
2
4
6
8
10
12
14
16
18
20
20
00
20
01
20
02
20
03
20
04
20
05
20
06
20
07
20
08
20
09
20
10
20
11
20
12
20
13
20
14
20
15
20
16
20
17
20
18
Rp/USD% Exchange rate BI Policy Rate

12
21.6 B
2018
18.6 B2017
99% are related to digital payment, 0.11% to
personal finance and 0.08% to Business FinanceProjection of transaction value (statista, 2018)
*Transaction Value
Forecasted
Transaction value
(Increasing by 16.13%)*
Actor
(Growing by 34.29%)**
1882017
1402016
Source: Data Statista
INTERNETuser ratio to
adult population
(Nov‘16) 2
51,8%
MOBILE PHONERatio to adult
population (Jan'16)1
YOUNG GENERATION (10-29 year)3
26,4% (2010)
24,9% (2016) (estimation)
59,2 million unitTotal
60,34% Total PDB
Share
20164SME126%
Source: 1 Kominfo, 2016; 2 APJII, 2016; 3BPS, 2013; 4Kementerian KUKM, 2016 dan BI, CNN
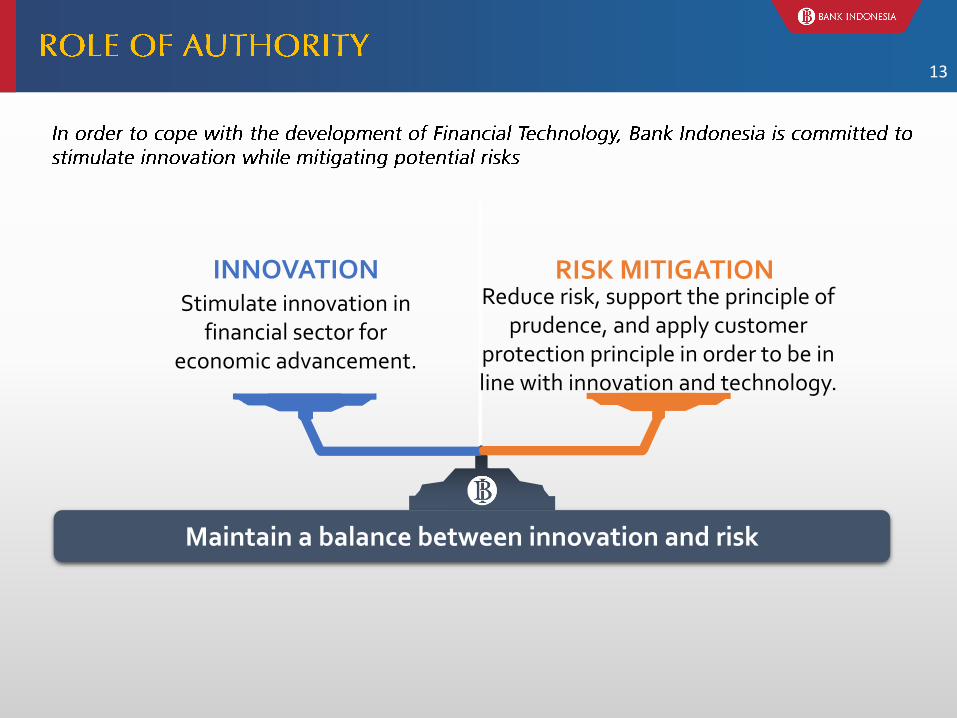
13
Reduce risk, support the principle of prudence, and apply customer
protection principle in order to be in line with innovation and technology.
RISK MITIGATIONStimulate innovation in
financial sector for economic advancement.
INNOVATION
Maintain a balance between innovation and risk

14
Regulation on
National Payment
Gateway
Nov 2016
Financial
Technology
Office
Jul 2017
Regulation on
Payment Transaction
Processing
Sept 2017Des 2016 Nov 2017
Regulation on
AML/CFT for
Non-Bank FI
Regulation on
Financial
Technology
Nov 2017
Regulatory
Sandbox

#
Family Hope Program(Program Keluarga Harapan -
PKH)
Non Cash Food Assistance (Bantuan Pangan Non Tunai -
BPNT)
• The Family Hope Program (PKH) is a program that provides cash to very poor households. Rp 1,89 million /year will be granted for each household. PKH will be granted every February, May, August, and November.
• As of December 2017, PKH is distributed to6,0 million households on non-cash basis.
• PKH will be expanded to 10 millionhouseholds in 514 regencies/cities in 2018.
• BPNT is a poverty alleviation and socialprotection program that is managed by thecentral government. It provides subsidized riceand eggs to low-income households. Rp 110thousand/month will be granted for eachhousehold as BPNT that can be used incertain stores which called e-warong.
• As of December 2017, BPNT was distributed to1,2 million households in 44 cities.
• BPNT will be expanded to 10 millionhouseholds in 217 regencies/cities on the25th of each month in 2018.

#
•
•

Thank You
17