indonesia woodfiber supply: growth model...
TRANSCRIPT
Indonesia Woodfiber Supply:Growth Model Approach
Andi RosilalaAgra Bareksa Indonesia
Universitas Gadjah Mada

ANDI ROSILALA
• Introduction
• Indonesia Fact sheet
• System Dynamic Model
• Assumptions and Scenario
• Scenario 1,2,3,4
• Analysis
• Conclusions
OUTLINE

ANDI ROSILALA
INDONESIA FACT SHEET
• Land Area 1,900,000 sq km (1)
• GDP: 861 Billions USD; 3370 USD per capita (2014) (1)
• Economic growth: 5.5 % (2014) (1)
• Forest: up to 30 m Indonesians depends on Forest
– Total Forest Area : 91 to 98 Mha (CIFOR, 2012)
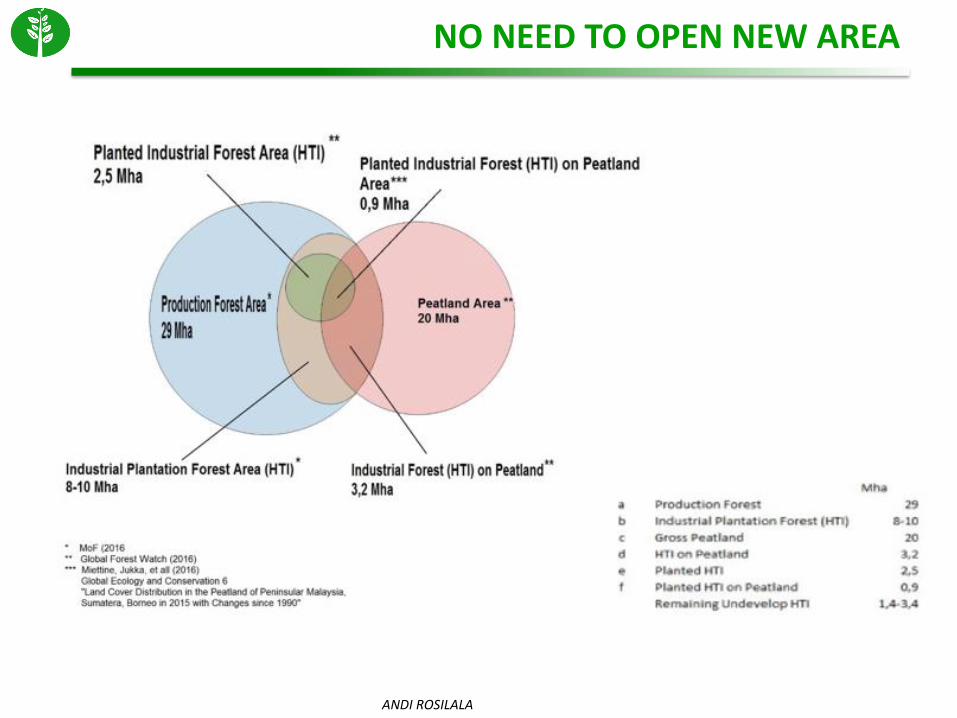
– Production Forest Area : 29 Mha (MoF, 2016)
– Industrial Plantation Forest Area : 8 to 10 Mha (various sources)
– Peat Land : 20 Mha (MoF, 2016)
(1) The Economist eiu at http://country.eiu.com.ezproxy.library.tufts.edu/article.aspx?a...=614994445&Country=Indonesia&topic=Summary&subtopic=Fact+sheet#
Note: Singapore land area is 716 sq km (37% of Indonesia)
1% of it’s growth is coming from forestry sector

10th in the World4th in Asia
1st in Southeast Asia

• The pulp and paper industry is considered as one of the biggest drivers of deforestation in Indonesia, accounting for roughly 20 percent of deforestation in the 2000s (Baccini et al. 2012, Harris et al. 2012)
• On 2013, Indonesia announced “no deforestation” pledge and other sustainability commitments to ….“end the clearing of natural forest across its entire supply chain in Indonesia, with immediate effect.”
• The newly signed trade agreement with the European Union, the Voluntary Partnership Agreement (VPA), as well as its own Timber Legality Assurance system.
PROBLEM IDENTIFICATION
ANDI ROSILALA
PROBLEM IDENTIFICATION
• Industrial Plantation Forest area (CIFOR, 2015):
– 1995 : 9 licenses and 1.13 Mha
– 2013 : 252 licenses and 10 Mha
• Wood Production of Industrial Plantation Forest (MoI, 2016):
– 2008 : 20 Mm3
– 2013 : 29.8 Mm3
• If indeed the area of productive timber plantations reached 10 million hectares in 2013 with a conservative Mean Annual Increment of 15 m3 per hectare per year, this means that Indonesia should have mature standing stock of about 150 million m3 of timber that year. The reported production is significantly lower and calls into question the veracity of forestry statistics
ANDI ROSILALA
PROBLEM IDENTIFICATION
• Indonesia’s pulp production capacity (CIFOR, 2015):– 1988 : 606.000 metric tons per year
– 2015 : 9 million metric tons per year
• If the all mills operate at full capacity, this implies they will consume max 42.3 Mm3 of wood annually.
• The current wood production is 29.8 Mm3. So, the shortfall is about 12.5 Mm3.
• Indonesia’s National Long Term Forestry Plan envisages that by 2025 timber plantations will cover 14.5 Mha. Means that until 2025, the additional new area will be 4.5 Mha.
• Whereas, in conservative assumption, to fulfill the gap of 12.5 Mm3, it only needs 1.3 Mha.
• How to modelize Indonesia woodfiber supply for pulp and paper industry dynamically compared to demand side over some decades?
• What are scenarios and policy recommendations can be proposed to close the gap of supply-demand imbalance?
RESEARCH QUESTIONS

ANDI ROSILALA
ZOOM OUT OF LAND AREA
Source : Global Forest Watch 2016 using GIS

ANDI ROSILALA
ZOOM OUT OF SPESIFIC PLANTATION AREA
Source : Global Forest Watch 2016 using GIS
ANDI ROSILALA
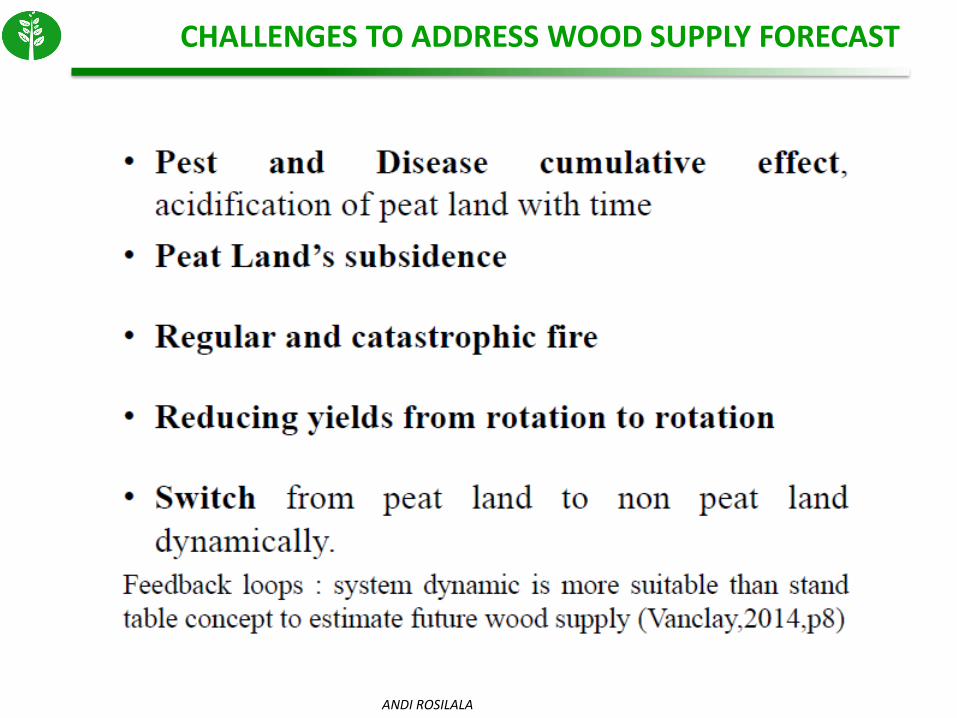
CHALLENGES TO ADDRESS WOOD SUPPLY FORECAST

ANDI ROSILALA
SIMPLIFIED INFLUENCE DIAGRAM FOR FORESTRY MODEL
Source : System Dynamics Modelling: A Practical Approach", cited from Robert Geoffrey Coyle, 1996.
ANDI ROSILALA
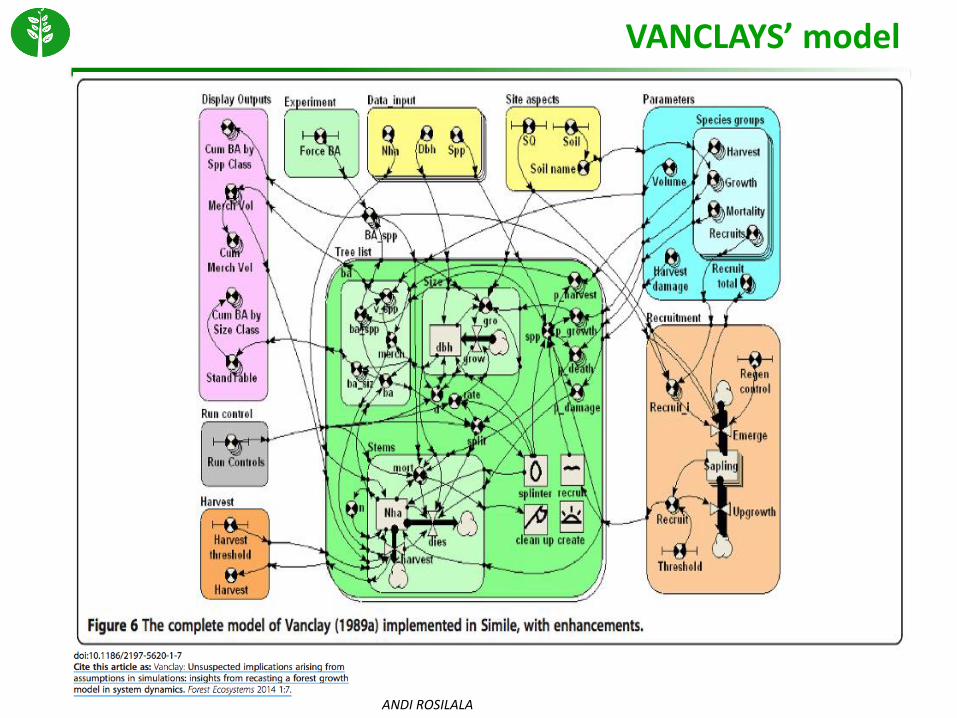
VANCLAYS’ model
• XXXXX

ANDI ROSILALA
AUTHOR FOREST MODEL on STELLA

ANDI ROSILALA
ASSUMPTIONS & SCENARIOS

ANDI ROSILALA
VARIABLES AND PARAMETERS (1)
ANDI ROSILALA
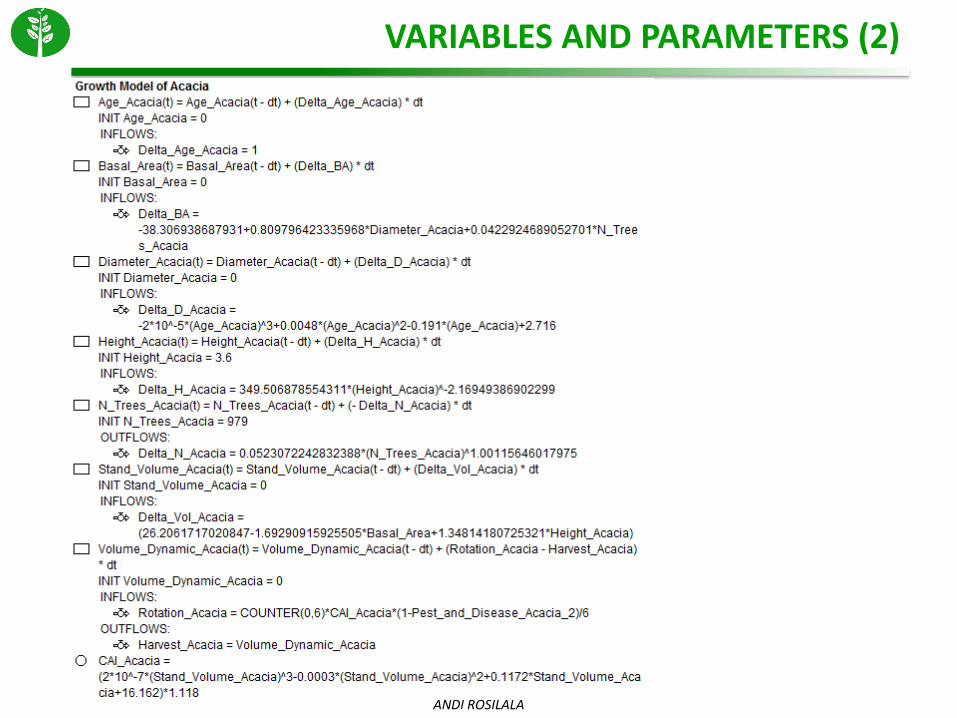
VARIABLES AND PARAMETERS (2)

VOLUME DYNAMIC PER HA PER ROTATION
12:50 AM Tue, Feb 21, 2017Page 1
0.00 10.75 21.50 32.25 43.00
Years
1:
1:
1:
2:
2:
2:
0
15
30
1: Volume Dy namic Acacia 2: Volume Dy namic Eucaly pt
1
1
1
12
2
2
2

12:54 AM Tue, Feb 21, 2017Page 1
0.00 10.75 21.50 32.25 43.00
Years
1:
1:
1:
2:
2:
2:
3:
3:
3:
0
20000000
40000000
1: Wood Production Acacia 2: Wood Production euca 3: Total Wood Production
1 1 1 12 2
2
23 3 3
3
TOTAL VOLUME DYNAMIC PER ROTATIONSCENARIO 1: BUSINESS AS USUAL


1:05 AM Tue, Feb 21, 2017Page 1
0.00 10.75 21.50 32.25 43.00
Years
1:
1:
1:
2:
2:
2:
3:
3:
3:
0
20000000
40000000
1: Wood Production Acacia 2: Wood Production euca 3: Total Wood Production
1 1 1 12 2
2
23 3 3
3
TOTAL VOLUME DYNAMIC PER ROTATIONSCENARIO 2: PEATLAND RESTORATION

10:49 AM Tue, Feb 21, 2017Page 1
0.00 10.75 21.50 32.25 43.00
Years
1:
1:
1:
2:
2:
2:
3:
3:
3:
0
20000000
40000000
0
15000000
30000000
0
20000000
40000000
1: Wood Prod of Acacia 2: Wood Prod of Euca 3: Total Wood Prod
1
1
1 12 2
2
2
3
3 3 3
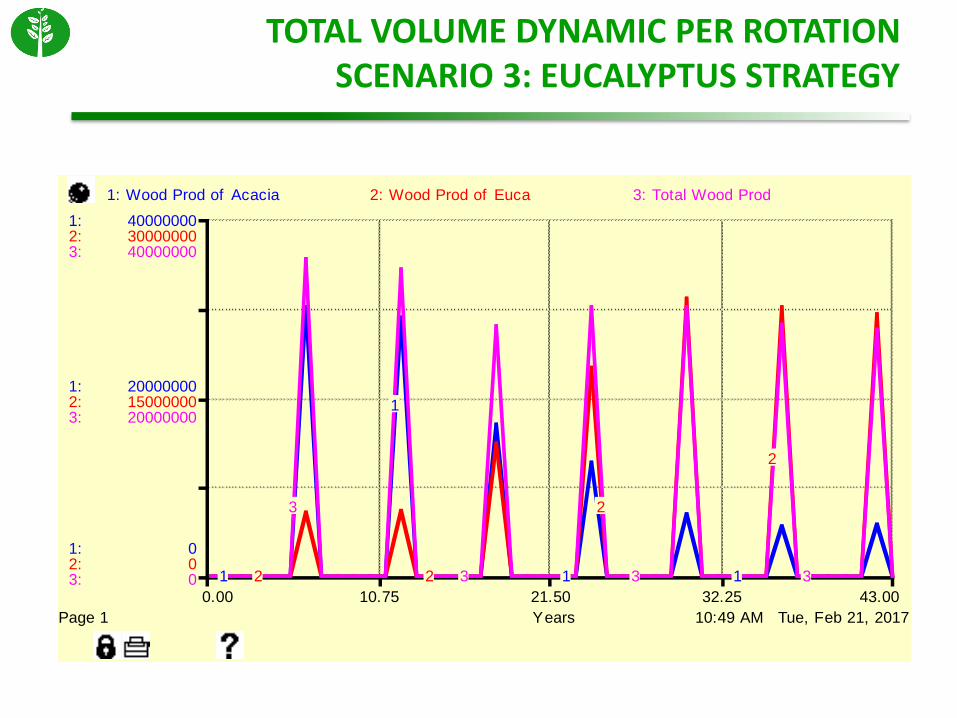
TOTAL VOLUME DYNAMIC PER ROTATIONSCENARIO 3: EUCALYPTUS STRATEGY

TOTAL VOLUME DYNAMIC PER ROTATIONSCENARIO 3: EUCALYPTUS STRATEGY
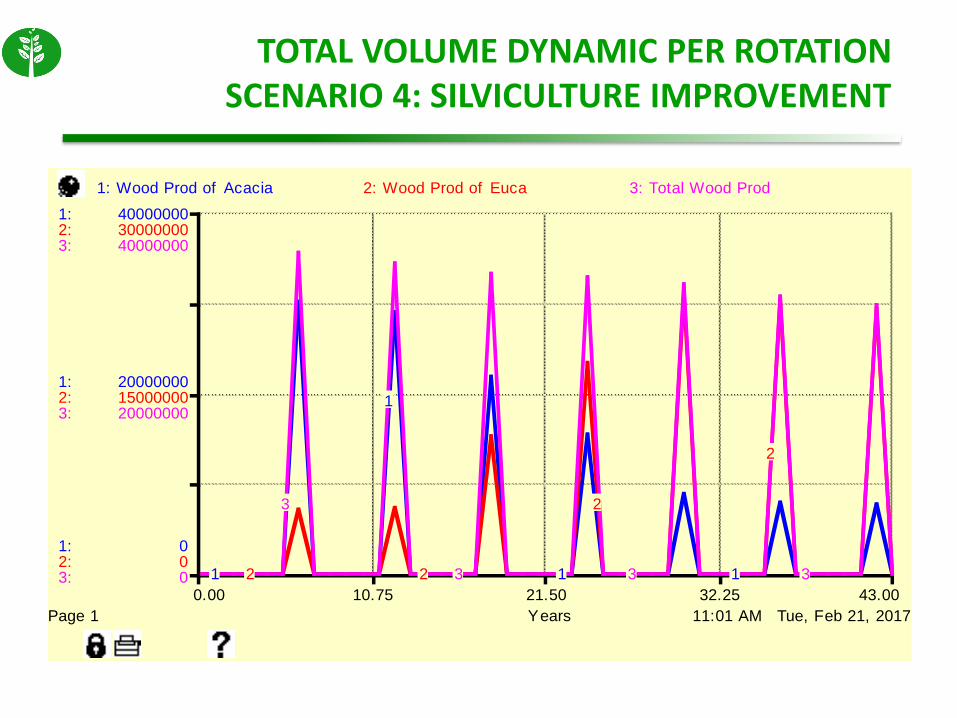
11:01 AM Tue, Feb 21, 2017Page 1
0.00 10.75 21.50 32.25 43.00
Years
1:
1:
1:
2:
2:
2:
3:
3:
3:
0
20000000
40000000
0
15000000
30000000
0
20000000
40000000
1: Wood Prod of Acacia 2: Wood Prod of Euca 3: Total Wood Prod
1
1
1 12 2
2
2
3
3 3 3
TOTAL VOLUME DYNAMIC PER ROTATIONSCENARIO 4: SILVICULTURE IMPROVEMENT
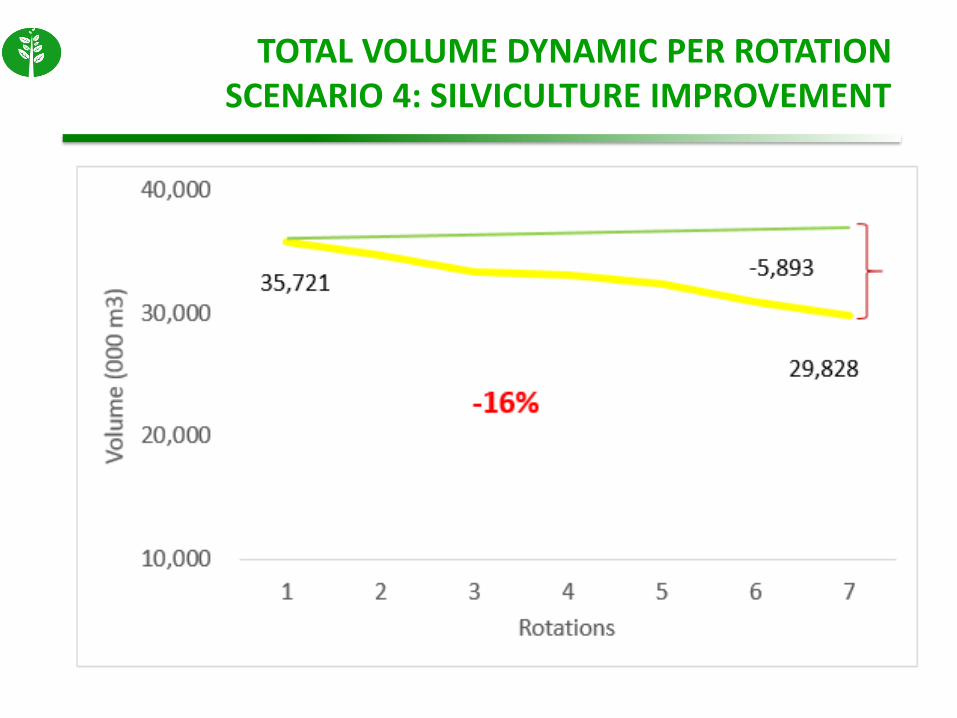
TOTAL VOLUME DYNAMIC PER ROTATIONSCENARIO 4: SILVICULTURE IMPROVEMENT

ALL SCENARIOS AND DEMAND

ANDI ROSILALA
Scenario 5 – converting 1.3 Mha additional land
ANDI ROSILALA
NO NEED TO OPEN NEW AREA


Questions ?
ANDI ROSILALA