indonesian agricultural development in comparative perspective
TRANSCRIPT

World Development, Vol. 17, No. 8, pp. 1235-1254, 1989. 0305-750X/89 $3.00 + 0.00 Printed in Great Britain. © 1989 Pergamon Press plc
Indonesian Agricultural Development in Comparative Perspective
ANNE BOOTH The Australian National University, Canberra
Summary. - - In both the late colonial and the early post-independence periods, most observers of the Indonesian economy were pessimistic about the prospects for agricultural, and especially foodcrop, growth. But over the last 15 years, food production growth in Indonesia has been among the fastest in the world. This paper examines the reasons for the accelerated growth and reviews some of the literature on its distributive consequences. Comparisons are made with other episodes of accelerated agricultural growth in recent Asian history, especially that of Meiji Japan. It is shown that there are remarkable similarities between agricultural development indicators in Indonesia in the 1960s and 1970s and those in Meiji Japan. The challenge for Indonesian policy makers in the future will be to build on the agricultural successes of the past two decades in order to create a more diversified economy and ensure sustained economic development.
1. DEVELOPMENTS BEFORE THE 1960s
From late in the 19th century until the early 1970s, the prevailing impression of the Indone- sian agricultural economy was one of pessimism. The subject was dominated by writers such as Boeke and Geertz, who stressed the inability of Indonesian cultivators to absorb modern produc- tion techniques, especially those involving inputs purchased from other sectors such as chemical fertilizers.1 Much of this pessimism was based on comparisons between Indonesian development and that of Europe and Japan. Both Boeke, in his work on economic dualism, and Geertz felt that the prospects for rapid production growth in Javanese foodcrop agriculture were extremely dim, and this view was held by other foreign economists in the 1960s. Geertz went so far as to argue that "pouring fertiliser onto Java's Lilli- putian fields is likely, as modern irrigation, labour-intensive cultivation and crop diversifica- tion before it, to make only one thing grow - - paralysis.'2
Geertz used the phrase "involution" to des- cribe the process in which the rural population reacted to stagnant production by evolving social devices for sharing their poverty rather than by increasing output through technological change. Geertz's work in particular suggested that, while relatively unsuccessful from a production point of view, Javanese agriculture has devised quite successful mechanisms for sharing stagnant or
slowly growing production among an ever grow- ing number of claimants. He emphasized such practices as the open bawon method of harvest- ing rice, which allowed everyone who wished to participate in the harvest to do so, and to receive as payment a certain percentage of the paddy she had harvested. Harvesters were only permitted to use a small knife and cut each stalk separately, which greatly increased labor input per unit of paddy harvested, compared with alternative har- vesting methods such as the sickle.. Because of the apparently widespread use of such practices, Geertz implied that rice cultivation in Java had, by the early years of the 20th century, become abnormally labor-intensive; he spoke of "labour- stuffing," and of "tremendous populations absorbed on minuscule rice farms."
When we examine the growth record of the Indonesian agricultural sector from the early 19th century to the 1960s, we see that growth rates varied widely over time, and between crops (Tables 1 and 2). But the overall performance was rather better than the impression conveyed by late colonial writers such as Boeke, and certainly better than, for example, the South Asian performance as estimated by writers such as Blyn. 3 It seems that rice production in Java roughly kept up with the quite rapid population growth until the outbreak of World War I; rising domestic production, combined with growing imports meant that per capita consumption in 1915 was about where it had been in 1875, in
1235

1236 WORLD DEVELOPMENT
Table 1. Annual average growth* in foodcrop produc- tion in Java and Indonesia
Table 2. Annual average rates of growth of output of smallholder and estate crops: IYOCM.?
Java Indonesia Ricet Foodcrops$ Ricet Foodcrops$
Period Estate crops* Smallholder crops*
1841-50 1.5 185 l-70 2.4 1871-85 2.3 1886-1900 0.5 1901-13 2.3 1918-30 1.4 1.68 1931-40 2.2 2.8 194147 -4.8 -5.1 1948-61 2.6 2.8 2.211 3.211 1962-70 4.2 1.4 3.7 1.6 1971-83 5.2 4.2 5.2 4.4
1901-14 3.9 8.4 1920-30 7.0 10.6 1931-40 -0.2 5.6
19.52-66 -0.8 1.9 1967-73 5.9 2.5 1974-83 4.5 7.0
Sources: 1836-69: Koloniale Verslag (1870), Appendix EE; 1870-1915: Jaarcijfers (various issues); 191wl: S/O and Indisch Verslag (various issues), 194149; Metcalf (1952), p. 38. 1950-70; Statistical Pocketbook of Indonesia (various issues), 1971-80; Statistical Year- book of Indonesia (various issues), 1981-85; Euletin Ringkas (various issues). *Growth rates calculated by fitting an exponential function to five-year moving averages of production data centered on years shown. tBefore 1915, data exclude the native states and private lands. Data refer to padi sawah and padi gogo. $Weighted by calorie equivalents. BData refer to 1922-30. l[Data refer to 1952-61.
Sources: Creutzberg (1975); Statistical Year- books and Statistical Pocketbooks of Indonesra (various issues). *Up to 1940. rates of growth were calculated by fitting an exponential trend to an index of estate production of coffee, sugar, tobacco, tea, cin- chona, rubber, and palm oil. weighted by 1928 unit export values. After 1952, rates of growth were calculated by fitting an exponential trend to a Divisia index of production of rubber, palm oil. coffee, tea and sugar. Price data for the Divisia index were US $ prices reported in World Bank (1985). tUp to 1940. rates of growth were calculated by fitting an exponential trend to an index of smallholder production of rubber, coffee, tea, copra and tobacco weighted by 1928 unit export values. After 1952 rates of growth were calcu- lated by fitting an exponential trend to a Divisia index of production of rubber, copra, coffee, tea, cloves, pepper, tobacco and sugar. Price data for the Divisia index were US $ prices in World Bank (1985).
spite of the fact that the population grew by more than 70% in these 40 years, according to the official figures.4 If we decompose output growth into area expansion, cropping intensity and yields growth, according to the formula
0 = NA HA 0 . -.- NA HA
we find that the growth in foodcrop production in Java before 1913 was mainly due to area expan- sion (Table 3).
faster population growth in those areas where land area was growing more rapidly was en- dogenous. in the sense that the more abundant land situation encouraged higher fertility rates (perhaps by lowering the age of marriage) or lower death rates (by improving nutrition), this would support the Malthusian position. On the other hand, if the growth in population was exogenous, and in turn induced the rapid expan- sion in land area, then this would sup ort the position advanced by Boserup (1965). R
In fact, at least part of the population growth There was a strong positive correlation be- which occurred in the land abundant areas of
tween growth of sawah area and growth of Java was due to in-migration. During the late population by residency in Java between the 1880s and the 192Os.s This gives rise to intriguing
19th and early 20th centuries, there were con- siderable movements of population from the
questions of causation. Did the growth in popula- densely settled inner core of Central Java, and tion cause the growth in sawah hectarage or vice from Madura, to the relatively underpopulated versa? The answer to this question throws some areas of West and East Java. It is probable that light on whether the Malthusian or the Boseru- the agrarian legislation of 1870 encouraged mig- pian theory of the interaction between popula- rants to open up new land by giving them more tion growth and agricultural expansion better fits security of tenure than had hitherto been the the facts of Javanese agricultural history. If the case. Certainly the fastest growth in land area

INDONESIAN AGRICULTURAL DEVELOPMENT 1237
Table 3. Factors influencing changes in production of padi sawah in Java*
Growth in Percentage of growth in production due to outpurt Cropping Sawah
(000 tons) Yields ratio area
1876-80 to 1906-lO$ 1,378 3.0 - - - - - - 97.0 - - - - - - 1916-20 to 1936-40 1,728 2.2 51.0 46.8 1936-40 to 1956-60 1,297 18.8 60.3 20.8 1968-72 to 1981-85 13.184 73.6 26.4 0
Sources: Koloniale Versiag (various issues); Indisch Versing (various issues): Statistical Pocketbook of Indonesia (various issues); Statistical Yearbook of Indonesia (various issues); B&tin Ringkas (various issues). *Contribution of area to the increment in output calculated according to the formula:
(A, - A,) (Yr + Y,).
Similarly for yields. tDry stalk paddy (padi gagang). $Excludes the private lands and the
occurred in regions such as Besuki where much of the land was under individual ownership. It is thus possible to argue that the causation ran from population growth to agricultural land expansion in the manner suggested by Boserup, but at the same time concede that the population growth may not have been strictly exogenous. Rather it was due to in-migration, which was itself a function of the perceived agricultural potential of the particular district. The agricultural potential in turn depended on both smallholder and estate agriculture; Wander has drawn attention to the very high positive correlation between in- migrants as a proportion of the population and estate area per capita in 1930, both in Java and elsewhere.7
The growth in arable area which occurred in colonial Indonesia was not just for foodcrop cultivation. There was also a very rapid growth in land area under production of commodities such as rubber. copra, and coffee which were sold on international markets. It is not widely appreci- ated that smallholder production of cashcrops in fact grew more rapidly in colonial Indonesia than production by the large estates, in spite of the fact that smallholders were not given any assis- tance and, in the case of rubber in the 193Os, discriminated against through punitive export taxes (Table 2). This growth is best explained by the vent for surplus model; Indoneiia is in fact one of the most dramatic examples anywhere in the world of smallholder response to the oppor- tunities offered by international trade. But by and large the growth took place outside Java. This does not necessarily mean that Javanese
native states.
cultivators were less responsive to the opportuni- ties provided by the international market. But it does reflect the fact that by the early 20th century, when world markets for tropical pro- ducts were growing rapidly, there was less sur- plus land for the cultivation of cashcrops in Java than elsewhere. Most was used for foodcrop production, or sugar production by large estates.
In the interwar years, it was increasingly difficult to expand the cultivation frontier in Java, particularly for sawah. The rate of growth of rice production slowed, and most of the growth which did occur was due to increases in the cropping ratio, in turn facilitated by consider- able government expenditure on irrigation. But in spite of government effort not just on expand- ing irrigation, but also on research and extension services, there was no breakthrough in foodcrop yields per harvested hectare. Yields remained virtually constant everywhere in Java until the 1960~.~ As the agricultural labor force was growing more rapidly than arable land, the failure to increase yields meant that output per worker fell from the 1920s onward. It is possible to argue that the rural development policies of the interwar years in Java were “induced” by growing population pressure, and official anxiety over food supply. But the Javanese experience contrasts with that of Northeast Asia. as dis-
cussed by Kikuchi and Hayami (1978), where increased irrigation investment led fairly quickly to yield increases. The disappointing perform- ance in Java was due mainly to a failure to accelerate use of chemical fertilizers. They were too expensive relative to output to make their use

1238 WORLD DEVELOPMENT
profitable by small cultivators, and in spite of the effort to expand rural credit services, little progress was achieved in fertilizer adoption.’
Although the Dutch colonial authorities spent much of the last four decades of their rule worrying about Java’s problem of “too many people and not enough land,” it is important to set the Javanese data in a comparative perspec- tive. In fact, the amount of agricultural land per male agricultural worker in Japan and Taiwan was lower than in Java in the early decades of this century (Table 4). We have noted that the argument that, as a consequence of growing population pressure on land, production pro- cesses in Javanese rice agriculture had become abnormally labor-intensive was central to Geertz’s concept of the process of agricultural involution. But per hectare labor input into the rice production cycle was almost certainly higher in Japan in the late 19th century than in Java in the 192Os, although labor input in Java does appear to have been higher than in Taiwan (Table 5). The average farm size in Japan was almost as minuscule, although Java had a higher proportion of total holdings under 0.5 hectares (Table 6). Thus it could be argued that, far from being a pathological case, the Javanese agricul- tural economy in the early part of this century was simply following the trajectory already traced out by other Asian rice economies. The most important difference between what may be termed the Northeast Asian model and Java by the 1920s was that, whereas in Northeast Asia tenancy appears to have been the mechanism
through which access to land was shared among all those wishing to cultivate, in Java (as in many parts of South Asia) a growing proportion of the agricultural labor force had little or no land. and were mainly employed as wage laborers.
The involution concept did not. however. simply refer to the allegedly “labor-stuffed” nature of the production process in Javanese sawah cultivation. It also referred to mechanisms of distribution. Geertz developed his concept of “shared poverty” to explain how, in an agricul- tural economy such as Java’s in the interwar and early post-independence years, rights to employ- ment were shared among an ever-growing num- ber of claimants. The model of the labor market which is implicit in this concept is rather different from the neoclassical one. Geertz rejected the idea that agricultural workers compete with one another to drive the wage rate down to the level which clears the market, and suggested that in fact many wage workers were absorbed in Javanese agriculture through a process of work- sharing, which was intended to spread a given amount of work among ever-growing numbers of workers, so that each was putting in only a fraction of the effort he or she was capable of, or would wish to put in at the prevailing wage. Thus each task in the rice production cycle was performed in as labor-intensive a way as possible, in many cases by hired labor, in spite of the fact that family labor was available to do the job, perhaps in a less labor-intensive way. According to this model, employers were influenced not only by an economic compulsion to maximize
Table 4. Cullivared land per male agricultural worker
(hectares)
Japan Bengal* Javat Taiwan+ ThailandS
1901 0.62 1.05 0.72 n.a. 1911 0.66 1.04 n.a. 0.78 1931 0.78 1.02 0.95 0.84 1951 0.79 n.a. n.a. n.a. 1961 1.02 1.14 0.73 0.69 1971 1.44 0.65 0.64 0.63
n.a. 1.21 1.12 l.Sl 1.36 n.a.
Sources: Japan: Yamada and Hayami (1979), Table 54; Java and Bengal: Booth and Sundrum (1985). p. 210; Taiwan: Kikuchi and Hayami (1978). p. 842; Hayami and Ruttan (1985). pp. 457-458; Thailand: Feeny (1983), Table 1. *Up to 1930. data refer lo undivided Bengal. For 1951 and afterward, data refer 10 West Bengal, Bihar and Orissa. tData refer to 1905 and 1930; 1905 data exclude native states. SData refer to 1913 and 1937. BData refer to 1913, 1937, 1952 and 1962.

INDONESIAN AGRICULTURAL DEVELOPMENT 1239
Table 5. Labor input and productivity in rice agriculture: Java, Japan and Taiwan
Period
Percentage of labor used for
Labor input Productivity harvest and (person hours Yields (quintals (kg per post-harvest per hectare) per hectare) worker-hour) operations
East Java 1920s
Java 1976 1977 1978
Japan 1890 1952 1970
Taiwan 1926-27 193637 1967
1,465 34.7 2.4 43
1,590 42.6 2.7 28 1,494 42.3 2.8 28 1,476 44.4 3.0 28
2,136 39.5 1.8 27 1,960 56.7 2.9 34 1.176 80.0 6.8 35
771 29.9 3.9 26 934 37.1 4.0 23 859 55.5 6.8 26
Sources: East Java: 1920s: average of 16 observations reported by Vink (1941). p. 186; Java: Handoko, Hart, Papanek and Partadireja (1982), p. 117. Data converted to hours using a six-hour day; Japan: Labor input data: Hara (1980). Tables 4 and 6. Converted to hours assuming an eight-hour day. Yields data are taken from Yamada and Hayami (1979), Table J-l. A paddy/brown rice ratio of 0.55 is used; Taiwan: Labor input data taken from Lee. Chen and Chen (1980), Table 3, converted to hours assuming an eight-hour day. Yields data from Lee and Chen (1979), Table T-1A. A paddy/brown rice conversion ratio of 0.55 is used.
profits, but also by a moral compulsion to provide work and a minimum income to all who needed it. Workers were willing to abide by certain accepted procedures for rationing the available work among all those wanting to take it at the accepted wage, and did not try to compete for additional employment at a lower wage.
Models of this kind have in fact been de- veloped in the context of other Asian agricultural economies as well. Indeed the apparent preva- lence in many parts of Asia of social arrange- ments designed to share finite amounts of work and output among all members of the agricultural economy, regardless of asset holding, particu- larly in the most densely settled areas, has given rise to several theories which seek to explain employment and wage determination in peasant societies in terms of specifically “noneconomic” factors such as social norms of behavior and morality. Thus Ishikawa (1975) has argued that the “community principle of employment” oper- ates in those societies (of which pre-Meiji Japan was perhaps the best example) where traditional landowners feel a responsiblity to guarantee all
available workers an income which gives them a “minimum standard of living” set in terms of prevailing social convention. This behavior may be partially based on rational economic motives such as the desire to secure a labor force at peak periods, or to minimize the risk of social unrest, which could lead to dispossession of assets. But it seems also to be based on the desire to achieve social prestige rather than economic gain.
But it is important to remember that the “shared poverty” notion was just that - an explanation of how, under conditions of inten- sifying population pressure, more and more labor was permitted to share a very slowly growing pie. In contrast to Ishikawa’s community principle of employment, which did assume that workers would be guaranteed some minimum level of income, the sharing of poverty through various work-spreading arrangements could presumably go hand in hand with steadily declining incomes for the great majority, and a growing gap between rich and poor. This would be particu- larly likely if access to land were denied those with the labor available to cultivate it. In fact the

1240 WORLD DEVELOPMENT
Table 6. Changes in size distribution of landholdings and employees as a percentage of the agricultural labor force: 1903-73
Percentage distribution of holdings according to size Holding size (ha) Java 1903* Japan 1908 Java 1973 Other islands, 1973
Under 0.2, 15.8 21.1 6.4 0.2 to OX 31.4 37.3 36.3 19.9 0.5 to 1.0 41.9 32.6 24.8 24.6 1.0 to 1.51 1.5 to 3.011 7.0 25.9 16.0 36.1
Over 3.0 3.9 4.2 1.X 11.5 Gini Coefficient 0.51 n.a. 0.49 0.57
Agricultural employees as a percentage of the agricultural labor force male 29 very 30 (52)7 13 (32)l female 75 small 34 (77)s 8 (74)%
Sources: Java 1903: Hasselman (1914). Appendices Rand S; Japan 1908: Institute of Developing Economies (1969). p. 116; Java and Other Islands 1973: Agricultural Census. Data on the agricultural labor force taken from 1905 Population Enumera- tion as reported in Hasselman (1914). Appendix E and 1971 Population Census (Series E). *Data exclude Surakarta and Yogyakarta. to.18 ha in 1903. $0.53 ha in 1903. 81.42 ha in 1903. 112.84 ha in 1903. IFigures in parentheses include unpaid family workers. Data refer to 1971.
proportion of the agricultural labor force em- ployed as wage workers probably did grow in Java in the first half of the century, and many of these people would have found it difficult to secure employment throughout the year. Grow- ing underemployment combined with declining per capita output led to more and more people falling below the poverty line. By the mid-196Os, almost 30% of the agricultural labor force was classified as “employees.“‘” Over 60% of the rural population fell below a very modest poverty line (Table 7). Tensions between landed and landless grew after passage of the Basic Agrarian Law (BAL) in 1960, and erupted into open violence in many parts of Java.”
2. THE NEW ORDER PERIOD AND RAPID YIELDS GROWTH IN FOODCROP
AGRICULTURE
Over the past 15 years, the “orthodox view” of the production performance of Indonesian food- crop agriculture has undergone substantial change, to the point where Indonesia is now regarded as one of the more successful Asian
economies as far as foodcrop production growth, and especially rice production growth. is con- cerned. This success was recognized in 1985 when President Suharto was invited to address the annual meeting of the Food and Agriculture Organization (FAO) in Rome as the representa- tive of the developing nations. Of the major Asian rice producing countries, only Burma’s rice production grew more rapidly from the mid- 1970s to the early 198Os, according to FAO data. Much of the growth in rice production has been due to growth in yields. especially in Java, where adoption of new seed var?eties and chemical fertilizer by millions of cultivators has been very rapid. This experience would seem to effectively contradict the growth pessimism of Boeke, Geertz and others.
But if the experience of the last 15 years or so has cast severe doubts on “growth pessimism,” it has given rise instead to “distributional pes- simism.” In recent years, the work of Geertz in particular has come in for much criticism from many social scientists with field experience in Indonesia, especially Java. They argue that rural Javanese society was far more stratified than Geertz allowed and that the gap between rich

INDONESIAN AGRICULTURAL DEVELOPMENT 1241
Table I. Percentage of the rural population classified as very poor, poor, almost self-sufficient. and self-sufficient. 1963-64 to 1984*
Almost Very poor+ Poor* self-sufficient5 Self-sufficient11
Java 1963-64 1964-65 1967 1969-70 1976 1978 1980 1981 1984
Outer Islands 1964-65 1969-70 1976 1978 1980 1981 1984
60.9 16.7 61.3 17.1 67.4 12.6 51.2 20.1 43.2 21.3 44.6 20.6 32.2 22.7 17.8 21.3 23.0 22.6
52.3 17.0 25.8 16.5 25.7 18.7 18.2 17.5 14.5 16.2 10.0 15.6 10.4 12.7
14.7 13.5 14.6 17.5 22.5 20.4 28.6 32.1 31.0
20.7 10.0 27.3 30.4 28.3 27.3 29.0 35.3 30.0 39.3 33.9 40.5 29.2 47.7
7.7 8.1 5.4
11.2 13.0 14.4 16.5 28.8 23.4
Sources: Susenas: Pengeluaran untuk Konsumsi Penduduk (196.3-64 to 1980); Statistical Yearbook of Indonesia (1984), pp. 758-759; (1985). pp. 596597. *Reference months as follows: 1963-64 December-January; 1964-65 November-February; 1967 September-October; 1969-70 October-April; 1976 Annual; 1978 Annual; 1980 February; 1981 Annual; 1984 February. tVery poor defined as having per capita monthly expenditure below cash equivalent of 20 kg rice per month. Rice prices used were as follows: 1963- 64 calculated from data given in the Susenas report 1964-65. Surabaya prices used for Java and average of Medan. Palembang, Pontianak and Makassar used for Outer Islands; all prices as reported in Bank Indonesia (1968). p. 130, 1967; Surabaya prices as reported in Laporan Mingguan. January 1968. 1969-70; rural Java 12 food commodity index used for Java; average of Medan, Palembang, Jambi, Banjarmasin, Makassar. Menado, and Denpasar prices used for the Outer Islands, as reported in fndikator Ekonomi. 1976-84; rural Java nine commodity index used for Java; Outer Islands same as for 1969-70. tPoor defined as having per capita montly expenditure between cash equivalent of 20 and 26.67 kg rice per month. Rice prices as above. BAlmost self-sufficient defined as having per capita monthly expenditure between cash equivalent of 26.67 and 40 kg rice per month. Rice prices as above. IISelf-sufficient defined as having per capita monthly expenditure above cash equivalent of 40 kg rice per month. Rice prices as above.
and poor, far from being “delicately muted,” as Geertz has suggested. was already wide in the late colonial era, and became wider as a result of the technological innovations of the last two decades.12 Some would go so far as to argue that the new technologies have actually made the poor poorer.
At the same time, the growth pessimism has not been completely exorcised. The same
scholars who criticize the distributional effects of the agricultural growth of the last two decades also tend to argue that the growth is exceptional and unlikely to be sustained.” They would argue that the growth in rice production in particular has been due to the provision of subsidized inputs, particularly fertilizer, and that this provi- sion was made possible by the great increase in government revenues from the oil company tax.

1242 WORLD DEVELOPMENT
In the more stringent economic climate of the late 1980s. the government can no longer afford to continue a policy of lavish subsidies to agri- culture, or indeed to any other sector. Thus, according to the pessimists. the inevitable result of reduced subsidies will be reduced rates of agricultural growth, which combined with the decline in employment opportunities in other sectors of the economy will have a severe impact on living standards in rural areas.
We examine the prospects for further increases in agricultural, and especially foodcrop. produc- tion growth in the final section. Here we will note that the argument that the rapid agricultural growth of the 1970s and the early 1980s was “due to the oil boom.” and is unlikely to be sustained in the post-oil-boom era is in one sense rather surprising. Neoclassical models of resource booms (or the Dutch Disease) predict a shift of resources out of the sectors producing traditional tradable goods, and into sectors producing non- traded goods and services. In the context of an economy such as Indonesia, where most non-oil exports are agricultural in origin, the booming sector theory would seem to predict a decline in the share of agriculture in GDP, and possibly a contraction in the absolute size of the agricultural sector, as indeed happened in an economy such as Nigeria.”
As is well known, the New Order government which came to power after the abortive coup of 1965 placed primary emphasis on reducing the rate of inflation and increasing real rates of economic growth. As a proportion of GDP, both government revenues (including those from foreign aid and borrowing) and expenditures by the early 1970s had exceeded the levels achieved in the late colonial era. Is Much of this expendi- ture was devoted to rehabilitation and extension of rural infrastructure, especially irrigation and roads. After 1973. the dramatic rise in the world price of oil led to a rapid increase in revenues accruing to the budget through the oil company tax. The Indonesian government, unlike those in most of the other OPEC economies with signifi- cant agricultural sectors, channeled part of the increased resources available to government from the oil boom into subsidizing the provision of inputs such as irrigation, fertilizer, agricul- tural credit. and extension services. In addition, large sums were spent on improving rural roads, and there was an enormous improvement in rural public transport. Further, the government agency, Bulog. used its monopoly over rice imports to keep local prices above world ones in times when the latter were depressed; this policy combined with the fertilizer subsidy led to a steady improvement in the paddy/urea price ratio
from the mid/1970s to 1984 (Table 8). More recently. nominal protection has been increasing for other foodcrops. including sugar. corn and soybeans. The consequent growth in foodcrop production. together with the improved perform- ance of the cashcrop sector. led to a rapid growth in total agricultural production.
The policies of the last two decades have been depicted as an attempt on the part of the gov- ernment to use the oil revenues to coopt the rural landowning elite through lavish provision of subsidized inputs.ih But in fact fertilizer subsidies have been a very small proportion of the de- velopment budget in recent years. and govern- ment subsidized credit programs to smallholder foodcrop agriculture have been reduced with the termination of the Bimas program. and its replacement with the unsubsidized Kupedes scheme.” To the extent that the New Order government has been using the oil revenues to subsidize favored sectors and social classes, agricultural producers have almost certainly been treated less favorably than most manufacturers. civil servants and the modern service sector.
It has also been argued that the gains accruing to the wealthier members of rural society have been at the expense of those owning little or no land. Those who rely on only their labor to sell have been penalized through declining employ- ment opportunities in agriculture and have been forced to seek less remunerative employment in other parts of the economy.” But it is difficult to reconcile this argument with evidence of dechn- ing numbers in poverty, rising per capita avail- ability of rice and falling inequalities in food expenditures. The decline in numbers in extreme poverty in rural Java in the latter part of the 1970s has been quite dramatic (Table 7). But although the new technologies in rice production have probably created more jobs than they have destroyed (even if labor input per unit of output has fallen, output has grown sufficiently rapidly to increase total employment), at least part of the growing rural prosperity of the 1970s has been due to growth in nonag.icultural employment opportunities in sectors such as construction and trade.” These sectors are unlikely to grow as rapidly in the 198Os, because of the impact of lower oil prices on the government budget and thus on the domestic economy. We return to this point in the final section.
3. INDONESIAN AGRICULTURE IN THE NEW ORDER PERIOD: A COMPARISON
WITH MEIJI JAPAN
To appreciate the achievements of Indonesian

INDONESIAN AGRICULTURAL DEVELOPMENT 1243
Table 8. Fertilizer use, production and subsidies, 1%9-8S
Fertiliser* use (kg) per hectare of
padi sawah, Outside
Java Java
Domestic production of ureat
(000 tons)
Fertilizer subsidy as a percentage
of the development Gabah/urea budgett price ratiot
1969 n.a. n.a. 85 n.a. 0.79 1970 101 15 103 n.a. 0.79 1971 108 39 108 n.a. 0.79 1972 129 31 120 n.a. 0.79 1973 121 38 116 7.3 0.76 1974 122 46 209 23.6 1.05 1975 103 36 387 9.5 0.98 1976 126 45 406 5.2 0.98 1977 194 68 990 1.5 1.01 1978 228 77 1,427 3.2 1.07 1979 224 73 1,827 3.1 1.36 1980 277 104 1,985 4.8 1.50 1981 302 134 2,007 5.3 1.71 1982 312 147 1,961 5.7 1.93 1983 345 174 2,255 3.3 1.61 1984 346 160 2,910 7.3 1.83 1985 343 157 3,589 4.4 1.75
Sources: Fertilizer use on padi sawah: Survey Pertanian (various years); Domestic production of urea, and fertilizer subsidies as a percentage of the development budget: Indonesian Financial Statistics; Urealgabah price ratio: Bulog (1986), p. 34. *Urea, TSP and other chemical fertilizers in material terms. tData refer to fiscal years. The gabahlurea price ratio refers to the ratio of the official floor price of gabah to the official price of fertilizer.
agriculture since the 196Os, it is useful to further press the comparison between Indonesia and Japan. In his well-known comparison between agricultural development in Japan in the Meiji era (1868-1912), and that of Indonesia, and especially Java, at the same time, Geertz found striking differences in the pace and direction of economic change in the two countries.‘” He stressed the technological advances which oc- curred in Japanese foodcrop agriculture from 1880 onward, compared with the apparent stag- nation in Java, and the slow decline in the numbers employed in Japanese agriculture com- pared with the steady increase in Java. This meant that while productivity of both land and labor was increasing in Japan, it was at best stagnating in Java; indeed as we have seen in the interwar years and the early post-independence period. foodcrop production failed to keep up with population and agricultural labor force growth.
Geertz argued that the type of “dynamic interaction” between agriculture and industry that increasingly characterized Japanese develop- ment after 1880 could not have been achieved in
Indonesia at that time because of the colonial political and economic system. Whereas in Japan resource flows from agriculture helped to stimu- late industrial development in the early decades of the Meiji era, and the subsequent industrial growth in turn benefited agriculture through the provision of inputs such as fertilizer, in Indonesia much of the benefit of cashcrop agricultural development was either remitted to the Nether- lands or devoted to private and government consumption within the colony. Very little in- dustrial development took place beyond the processing of agricultural exports, and the colony remained underdeveloped right up to 1942.
Geertz’s reasons for the continued backward- ness of colonial Indonesia compared to the dynamic transformation of early 20th century Japan undoubtedly have validity. although they led him to make an unduly pessimistic prognosis concerning Indonesia’s future development pros- pects. But to appreciate the extent of the change which has occurred in Indonesia in recent years, it is instructive to pursue Geertz’s parallel be- tween the development experiences of Japan and Indonesia in a rather altered time perspective.

1244 WORLD DEVELOPMENT
Instead of comparing the changes which occurred in Meiji Japan with Indonesia. or Java, in those same decades, the real similarity is between Japan in the last decades of the 19th century and the early decades of this century and Indonesia between the 1960s and the 1980s. But just as the preconditions for the accelerated growth which occurred in Japan in the Meiji years were laid in the Tokugawa era. so it can be argued that the development which has taken place in the Indonesian economy, and particularly the agri- cultural sector, since the 1960s was made possible by the changes which took place over the preceding century.
Let us consider the “Tokugawa heritage” as it has been described by economic historians of Japan. We have already noted that Japanese rice agriculture was extremely labor-intensive in terms of labor inputs per hectare in the late 19th century, and very productive in terms of yields per hectare (Table 5). This intensive use of labor was both a cause and a consequence of the unusually well-developed irrigation systems found in most parts of Japan, emphasized by scholars of Japan’s agricultural development.2’ These irrigation systems used considerable amounts of labor to construct, operate and maintain but once in place, they facilitated the growing of more labor-intensive crops, and also multiple cropping, which in turn led to more intensive use of labor for current production. Because of the intensive nature of the cultivation there was an obvious limit to the amount of land which one family could cultivate, and most scholars consider that the average holding size was already well under one hectare in many parts of Japan in the late Tokugawa era.”
But in many cases. these farms were too small to provide continual employment for all family members throughout the year, and there can be little doubt that, by the late Tokugawa era. most households derived considerable income from activities other than foodcrop agriculture. Saito suggests that three main types of non-foodcrop employment were important.” First, there was employment which was both nonagricultural and residential, and typically involved traditional handicraft activities often dominated by female and child labor. Second, there was employment which involved the cultivation of industrial crops such as cotton, indigo and rapeseed, and sericul- ture. Activities such as fishing and salt-making, which Smith (1969) found to be important sources of income. could also be included here. Lastly there was wage employment. Again the form this took could vary considerably; some involved working for other villagers on either agricultural or nonagricultural activities while
other types of wage work involved migration for varying lengths of time to other locations. in both urban and rural areas.
It is clear that some of the agricultural “by- employment” discussed by Japanese scholars was agricultural or at least primary in nature. and that much of it involved household work which could easily be fitted in with other household duties. But what all these activities had in common. which separated them from foodcrop farming. was their orientation to the market. Although Crawcour has suggested that up to 30% of rice production was being marketed by the 1860s and a lower percentage of coarse grains, beans and potatoes. it seems reasonable to argue that foodcrop farming was carried out primarily for family subsistence.‘” But production from other agricultural activities, including the cultivation of crops such as cotton. oilseeds. and vegetables was in large part sold on the market. When we add the proceeds from these activities to those from handicraft activity, and from wage employ- ment, it is probable that well over half the income of most households was derived from goods and services sold through the market.‘s
While there can be little doubt that Indonesia in the 1860s had little of the infrastructure and few of the institutions which were the precondi- tions for accelerated economic development in Japan. much had changed by the final decade of the colonial era. Sources of income for rural households had become more diversified; even as early as 1905. almost 30% of the labor force was employed in nonagricultural occupations. and of those employed in agriculture almost one-fifth had supplementary sources of income. By 1930. one-third of the male labor force and over half the female labor force was employed outside the indigenous agricultural sector: almost all their activities would have been oriented toward the market. Indeed. many colonial economists con- sidered that, on average, at least half the pro- duction of indigenous households was marketed in the interwar period, which suggests the same degree of commercialifition as had been achieved in Japan by the 1860s.“’ Obviously in the millions of households which grew cashcrops. or which sold their labor to the large estates and other large companies, the proportion would have been higher.
In addition substantial investment, both pri- vate and government. had occurred in irrigation and transport infrastructure. although it was largely confined to Java and the estate areas of North Sumatra. The increased government ex- penditures on infrastructure development which took place over the last seven decades of the colonial period, and especially between 1900 and

INDONESIAN AGRICULTURAL DEVELOPMENT 1245
1930. were an indication of the growing fiscal powers of the state. Not only did tax revenues grow and diversify, but the government began to borrow abroad to finance an increasingly am- bitious program of government expenditure. Furthermore the late colonial state began to intervene in markets for key commodities such as rice in order to stabilize domestic prices. and to protect domestic producers.” This growing eco- nomic power of the state, which was a prominent feature of late colonial Indonesia. also finds a parallel in Tokugawa Japan. Crawcour has stressed the “well developed system of taxation which placed in the hands of the State the means of playing a major part in investment” and the “degree of control over almost every aspect of economic life.“ZX Only in education did late colonial society in Indonesia lag significantly behind what Japan had achieved by the middle of the 19th century. Whereas, according to Craw- tour, the rate of male literacy was as high as 30% in the 186Os, the 1930 Population Census in Indonesia found that only about three million males, less than 20% of the adult population, were literate. Only with the expansion of ac- cess to education after independence did literacy rates increase to more than 50% of the total population.
Crawcour claims that ‘*the Japanese economy on the eve of modernization was reasonably, but not outstandingly productive for a traditional economy. “2y The figures provided by Hayami and Ruttan on agricultural production per male agricultural worker in wheat equivalents show that Japanese agriculture in 1880 was only slightly more productive than that of India and Bangladesh in more recent times, and the same as Indonesia in 1960 (Table 9). The Indonesian figure for 1960 was, in turn, probably slightly lower than that for 1930. Foodcrop production per capita in Java fell in the early post- independence era compared with the interwar years, and although we have no data on pre-war foodcrop production outside Java, Bali and Lombok. it seems probable that per capita production was at best constant between the 1930s and the 195Os, and perhaps fell, as in Java. Of the major cashcrops, only rubber and copra production exceeded pre-war levels. It is there- fore probable that per capita agricultural output in Indonesia in the late colonial era was in fact higher than in 1960. and therefore higher than in Japan at the beginning of the Meiji era.30
It is thus plausible to argue that in terms of key indicators such as agricultural productivity, diversification of the economy and orientation to the market, provision of infrastructure and edu- cation. and economic strength of government,
Table 9. Agricultural outpur in whear unia’ per male agriculrural worker: Selecred
Asian countries
1960 1970 19x0 Bangladesh 2.0 1.0 1.8 India 1.2 2.6 3.1 Indonesia+ 2.4 3.0 4.0 Philiooines 3.3 4.6 5.9 Sri Gnka 3.6 4.1 4.s
1880 1910 1940 Japan 1.3 3.9 7.2
1913 1937 1960 Taiwan 2.8 5.7 7.1
Sources: Indonesia - Production data: Slarisrical Pocketbook of Indonesia (1963); Male agricultural workers: Keadaan Angkaran Keria 1961-80 (1980). Other Countries: Ha$ami and Ruttan (1985). p. 455, p. 468: Kikuchi and Hayami (1978). p. 842. *For details of ihe weighting procedures see Hayami and Ruttan (1985). pp. 45% 454. t&ures for 1970 and 1980 derived by increasing the 1960 figures by the index of agricultural production given in succes- sive editions of the FAO Production Yearbook.
Indonesia at the end of the Dutch colonial era was in a similar position to Japan on the eve of the Meiji Restoration. What was obviouslv lack- ing was political independence. When this was finally achieved at the end of the 1940s. Indone- sia’s position in terms of at least some of these indicators was rather less favorable than it had been a decade previously. The prolonged struggle against the Japanese and the Dutch. and the subsequent regional rebellions of the 1950s had destroyed or damaged much infrastructure, and the much weaker fiscal position of the state meant that rehabilitation and extension were at best slow. Although impressive advances were made in education, poor overall economic per- formance in the late 1950s and early 1960s meant that real per capita incomes in 1965 were lower than they had been in 1938.” This retrogression was almost certainly accompanied by a decline in wage labor opportunities, and also in many types of nonagricultural self-employment which had provided extra income for many workers, espe- cially women.
By 1980, agricultural production per male agricultural worker in Indonesia had risen to 4.0 wheat units; this increase was almost exactly that which occurred in Japan between 1880 and

1246 WORLD DEVELOPMENT
1910, according to the estimates of Hayami and
Ruttan.3’ Increases in rice yields in Java in the 1970s were in fact more rapid than those which had been achieved in either Japan or Taiwan over any comparable period; indeed the growth in Javanese yields between 1970 and 1983 was as great as that which occurred in Japan between 1880 and 1948, and in Taiwan between 1913 and 1955 (Table 10).
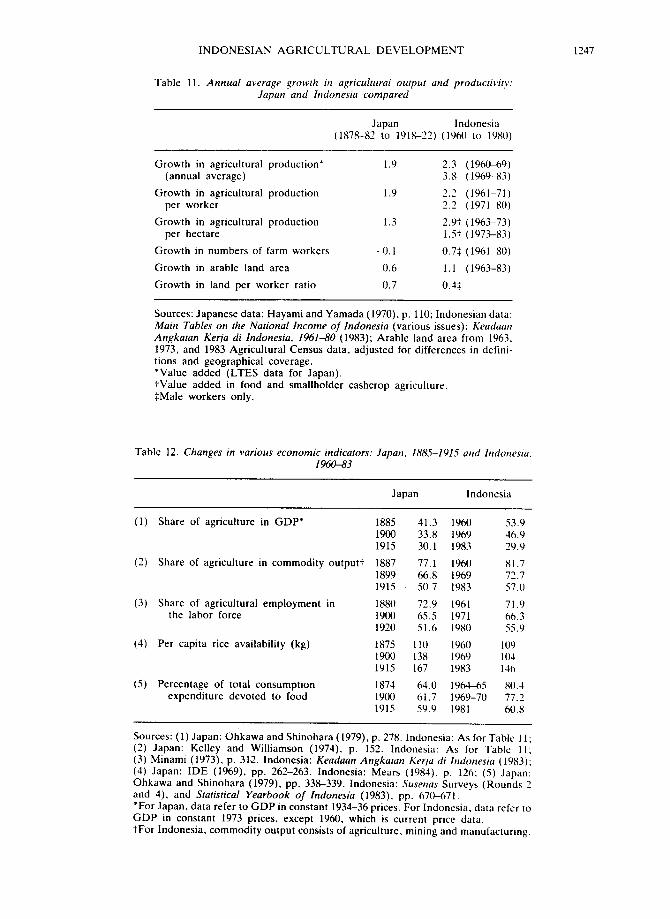
A comparison of the data assembled by Hayami and Yamada on changes in agricultural productivity in Japan between 1880 and 1920 with those from Indonesia in the 1960s and 1970s shows further similarities (Table 11). Perhaps the most striking is that the rates of growth of agricultural labor productivity. as measured by GDP data, in Japan between 1880 and 1920 and in Indonesia between 1961 and 1980 have been broadly similar, which confirms the trends shown
Table 10. Growth of rice producrion and yields in Java in the 1970s (production: 000 tons milled rice: yields:
fans per hectare)
Year Production* Yields* Index of yields
1970 7,805 1971 8,163 1972 8,549 1973 8,837 1974 9.061 1975 9,306 1976 9,654 1977 9,902 1978 10,541 1979 11,421 1980 12.390 1981 13,211 1982 14,298 1983 15.105
Japant 1880 1910 1948 1969
Taiwant 1913 1955 1970
1.81 100 1.86 103 1.91 106 1.95 108 1.99 110 2.04 113 2.10 116 2.16 119 2.29 127 2.42 134 2.59 143 2.75 152 2.91 161 3.01 166
2.00 100 2.62 131 3.28 164 4.38 219
1.35 100 2.22 165 3.14 233
Sources: Indonesia: Statisrical Pocketbook and Stati. cal Yeorbook (various issues); Japan: Yamada and Haymai (1979). Table J-l; Taiwan: Lee and Chen (1979). Table T-la. *Five-year averages centered on the year shown. Data refer to both irrigated and upland rice. tFive-year averages centered on the year shown; production data refer to brown rice and area to planted area.
in Table 9. This is true in spite of the faster growth of the agricultural labor force in Indone- sia over this period: this was more than compen- sated for by the faster growth in agricultural value added. Land productivity also appears to have grown more rapidly over these two decades in Indonesia than in Japan in the four decades up to 1920. at least according to the +icultural Census data, but given the unreliablhty of the land area statistics. too much should not be made of this. Further comparisons between Meiji Japan and Indonesia in the period from 1961 to 1983 are given in Table 12. We observe quite close similarities between the declines in the percentage share of agriculture in GDP and in total commodity output. and in the percentage share of agriculture in the labor force. In 1981, the percentage of household consumption ex- penditure being devoted to food in Indonesia was almost identical to that in Japan in 1915. although per capita rice availability rose more rapidly in Japan from similar levels in 1875 and 1960 respectively.
Although growth of agricultural output accel- erated in both Japan after 1870. and in Indonesia after 1965. the other productive sectors grew even faster. But because the agricultural sector in both economies contributed such a high propor- tion of total GDP to begin with, the agricultural sector accounted for a substantial part of the total growth in real GDP. Minami has shown that in Japan between 1889 and 1910 agriculture accounted for l&-21% of total GDP growth. in spite of the fact that the nonagricultural sectors of the economy were growing more rapidly. The disparity in growth rates was particularly marked between the agricultural sector and secondary industry (including mining, construction and transport), but even so growth in agricultural output (as shown by the GDP data) was almost half that of the secondary sector in Japan. The proportions were broadly similar in Indonesia between 1969 and 1985. in spite of the fact that the mining sector was much more important in Indonesia than in Japan (Table 13).
As in Indonesia in the New Order period. there was, and continues to be, much debate among scholars of the Meiji economy concerning the effect of accelerated economic growth on the distribution of income and assets and living standards in rural society. It has been argued in the Meiji context that the land tax reform forced farmers much further into the monetized eco- nomy, and especially during the deflation of the mid-1880s. greatly reduced their real incomes. Ensuing bankruptcies and forced sales of land led to a rapid growth in tenancy. which in turn led to an increased polarization of rural society into rich
INDONESIAN AGRICULTURAL DEVELOPMENT 1247
Table 11. Annual average growth in agricultural output and productivity: Japan and Indonesia compared
Japan Indonesia (1878-82 to 1918-Z) (1960 to 1980)
Growth in agricultural production* 1.9 2.3 (196&69)
(annual average) 3.8 (196Y-X3)
Growth in agricultural production 1.9 2.2 (1961-71) per worker 2.2 (1971-80)
Growth in agricultural production 1.3 2.9: (196.%73) per hectare l.St (197.3-83)
Growth in numbers of farm workers -0.1 0.7; (1961-80)
Growth in arable land area 0.6 1.1 (1963-83)
Growth in land per worker ratio 0.7 0.4;
Sources: Japanese data: Hayami and Yamada (1970). p. 110; Indonesian data: Main Tables on the National Income of Indonesia (various issues); Keadaan Angkatan Kerja di Indonesia, 1961-80 (1983); Arable land area from 1963. 1973. and 1983 Agricultural Census data, adjusted for differences in defini- tions and geographical coverage. *Value added (LTES data for Japan). tValue added in food and smallholder cashcrop agriculture. *Male workers only.
Table 12. Changes in various economic indicators: Japan. 1885-1915 and Indonesia, 1960-83
Japan Indonesia
(1)
(2)
(3)
(4)
(5)
Share of agriculture in GDP* 1885 1900 1915
Share of agriculture in commodity outputt 1887 1899 1915
Share of agricultural employment in the labor force
Per capita rice availability (kg)
Percentage of total consumption expenditure devoted to food
1880 1900 1920
1875 1900 1915
1874 1900 1915
41.3 1960 53.9 33.8 1969 46.9 30.1 1983 29.9
77.1 1960 81.7 66.8 1969 72.7 so.7 1983 57.0
72.9 1961 71.9 65.5 1971 66.3 51.6 19x0 55.0
110 1960 109 138 1969 10-l 167 1983 146
64.0 1964-6s x0.1 61.7 1 Y69-70 77.2 s9.9 1981 60.X
Sources: (1) Japan: Ohkawa and Shinohara (1979). p. 278. Indonesia: As for Table 11; (2) Japan: Kelley and Williamson (1974). p. 152. Indonesia: As for Table 11: (3) Minami (1973). p. 312. Indonesia: Keadaan Angkaran Kerja di Indonesia (19X3): (4) Japan: IDE (1969). pp. 262-263. Indonesia: Mears (1984). p. 126; (5) Japan: Ohkawa and Shinohara (1979). pp. 338-339. Indonesia: Susenas Surveys (Rounds 2 and 4), and Statistical Yearbook of Indonesia (1983). pp. 670-671. *For Japan. data refer to GDP in constant 1934-36 prices. For Indonesia. data refer to GDP in constant 1973 prices, except 1960, which is current price data. tFor Indonesia, commodity output consists of agriculture, mining and manufacturing.

1248 WORLD DEVELOPMEN-I
Table 13. It~reusr in GDP of the apnculrml scc~or II., N
percetira~e v/‘ rncrease in orl7er sccror~
Increase in agricultural GDP ah a percentage of increase in GDP from
M* M + S: Ai + M + S
Japan 1 X89- 19w 1901-10 191 l-20 1921-30
Indonesia 1969-75 1976-F-83
56.3 21.7 17.8 39.7 26.3 20.X 24.4 12.1 11.0
8.3 7.6 7.1
43.‘) 24.1 19.4 47.2 23.0 19.2
Sources: Japan: Minami (1986): p. X6: Indonesia: Central Bureau of Statistics (1973 constant price data). ‘M = mining. manufacturing. construction. transport and commumcations and utilities. tS = other services including government services. $A = agriculture. forestry and fisheries.
landlords and impoverished tenant farmers. As Smethurst has argued, however. there is much evidence to support the proposition that. in spite of increasing inequalities, living standards did improve in many parts of the country.3’ Rural disposable income in real terms increased and there was an increase in per capita rice availabil- ity. in ownership of modern conveniences such as bicycles and other consumer durables and in use of modern transport, postal, medical and educa- tional services. Many of these indicators are in fact precisely those which have been used to show an improvement in living standards in rural Indonesia since the mid-1960s. In particular. the dramatic improvement in school enrollment ratios, to the point where in the early lY8Os over 90% of children in the 7-13 age group were enrolled in school. and the decline in infant mortality rates in most parts of the country point to social changes of the same order of magnitude as those which occurred in Japan between the 1870s and 1920.3’
We cannot however argue. simply on the basis of the similarity between Indonesia’s per- formance since 1Y60 and that of Meiji Japan. that Indonesia is now firmlv on a development trajectory that will lead inexorably to the goal of a mature industrial economy. In spite of the progress of the last two decades. Indonesia remains a poor country, with the bulk of the labor force still employed in low-productivity occupations and receiving low incomes. This of course was equally true of Japan in 1920: it took another four decades for Japan to reach the ranks
of the developed countries. There has been much debate on when exactly Japan reached the “turning point” in the various senses in which this concept has been used in the development literature? Following the arguments of Kindle- berger (1967) and Cornwall (1977). Minami argues that Japan’s rapid growth in the 1950s and 1960s was due to the existence of large pools of surplus labor in rural areas. which were rapid11 drawn down in these decades. He suggests that the wage differential between agricultural and other workers in Japan began to narrow only in the mid-1950s.”
In the Indonesian context. the frapmentar! and unreliable nature of the data on wages make5 it impossible to judge whether the difference in wages between the agricultural and other sector>. especially modern manufacturing and scrvicrs. is in fact narrowing. but if the European and Japanese experiences are any guide. WC’ would not expect this to be the’tase. Even if real wages in both the urban and the rural sectors are moving upward, and there is little evidence that they are, it may be many decades before there is any appreciable narrowing of the differential.‘” This also implies that those sectors of the Indonesian economy which pay wages equal to the worker’s marginal product may continue to expand by drawing labor from farms. cottage industry and small-scale service enterprises for some decades to come.
But there is another sense in which the “historical mission” of the agricultural sector in Indonesian development may be nearer to fulfill-

INDONESIAN AGRICULTURAL DEVELOPMENT 1249
ment. This is the sense in which Sundrum has used the term, to indicate the role of the agricultural sector in producing sufficient food to satiate demand, thus channeling further incre- ments in income and expenditure to other goods and services, higher in what Pasinetti has cahed the “hierarchy of needs.“‘Y The 1970s have seen a fall in the concentration ratios for cereals in Indonesia (Table 14); this has been accompanied bv a corresponding decline in expenditure elasti- cities of demand. Income elasticities of demand for rice may now be as low as 0.25.“’ Here again a parallel can be drawn with the experience of Meiji Japan. where the available evidence indi- cates rather low income elasticities of demand for basic foodstuffs.‘” Indeed Kelley and Williamson (1974, p. 160) suggest that these relatively low elasticities may have been one reason for the rapid growth of industrial output in Meiji Japan, in that they implied a high proportion of any given increment in income would be spent on nonfood items. including industrial output. They also argue that the shift of preferences out of foodstuffs and into manufactured consumer goods could have redistributed income in a direction which would have stimulated savings. capital accumulation and thus faster industriali- zation. To the extent that income elasticities for food are also falling in Indonesia, these argu- ments could apply there as well.
4. CHALLENGES FOR THE FUTURE
The most recent data on rice production in
Indonesia appear to confirm the pessimistic view that a slowdown in production growth is inevit- able in the more straitened economic circum- stances of the mid-1980s. Total production grew by little more than 5% in the three years from 1984 to 19X7. As imports have been almost zero over these three years. there has been some decline in per capita availability. and in the two years from September 1986 domestic demand was restrained through a very substantial in- crease in prices.” Production growth of palaivijn crops also slowed after 1983. and there can be little doubt that total foodcrop production growth in the later part of the 1980s will be slower than in the years from 1979 to lY85. This slowdown in production growth would probably have been inevitable even if budgetary strin- gency had not forced a reduction in ferti- lizer subsidies.‘” Many paddy farmers. especially those operating well-irrigated land. are now applying the maximum amount of fertilizer and it is unlikely that substantial further yield increases can be obtained with current varieties. There is probably some scope for increasing sarvah crop- ping ratios in the more densely settled parts of the country through better maintenance of irri- gation but gains here have to be set against continued loss of agricultural land to urban development. As the official transmi- gration program slows down, so may the expan- sion of foodcrop land in Sumatra. Sulawesi and Kalimantan.”
Given that population will continue to grow at just under 2% per annum until the end of the
Table 14. Concentration ratios ofper capita expenditure in Indonesia by category. IRS-84
1969* 1970t 1976$ 19802 1981$ 19X4$
Urban
Cereals Cereals (0) All food Nonfood Total
0.14 0.15 0.09 0.07 0.08 0.06 0.11 0.10 0.07 0.04 0.02 0.03 0.31 0.30 0.28 0.27 0.24 0.24 0.41 0.40 0.46 0.48 0.47 0.42 0.33 0.34 0.35 0.36 0.33 0.32
Rural
Cereals 0.22 0.23 0.18 0.16 0.12 0.13 Cereals (Q) 0.17 0.13 0.15 0.10 0.07 0.06 All food 0.32 0.34 0.28 0.28 0.22 0.25 Nonfood 0.38 0.38 0.41 0.40 0.42 0.35 Total 0.33 0.35 0.31 0.31 0.29 0.2x
Source: Susenas (various rounds). *October-December. tJanuary-April. $Annual data. BFebruary.

12.50 WORLD DEVELOPMENT
century, that per capita disposable incomes will probably grow at about 3% per annum. and that the income elasticity of demand for rice is estimated to be around 0.25. domestic rice production will have to grow at around 2.5% per annum to maintain self-sufficiency. Depending on developments in world foodgram markets. it may well be more economic to rely on imports rather than invest in expensive programs of infra- structure development outside Java to increase domestic output.‘i Depending on the rate at which cashcrop production can expand, which in turn depends on world market conditions. and the pace of technological progress. the agricul- tural sector as a whole is unlikely to grow at much more than 3% per annum over the next decade. Given that the agricultural sector was in 1985 only about 24% of GDP, it is clear that if sustained growth of GDP of at least 5% per annum is to be achieved, much of the growth will have to come from nonagricultural sources. and especially from manufacturing and services. This of course was what happened in Japan from 1YlO onward, as the data in Table 13 make clear.
Using the simple rule of thumb of Dovring, and given the decline in the agricultural share of the labor force which occurred in the 1970s. for the agricultural labor force to remain constant over the next decade or so the nonagricultural labor force will have to grow at an annual rate of close to 7X, which is indeed faster than its growth rate in the boom years of the 1970s.‘“’ If nonagricultural employment opportunities do not grow at this rate. because of continued sluggish growth in the economy outside agricul- ture. then agriculture (together with acttvities such as petty trade) will have to continue to be the employment sector of last resort. There is likely to be a decline in productivity. incomes and living standards in rural areas. unless agricultural growth is sufficiently rapid to take up the slack.
A crucial factor determining the rate of growth of productive employment opportunities in both agriculture and the other sectors of the economy will be the performance of non-oil exports. Rapid growth of these exports will have a considerable
direct impact on employment opportunities, and it will also ease the pressure on the balance of payments and the government budget caused by Indonesia’s substantial foreign debt servicing obligations. This in turn will allow the govern- ment to increase budgetary expenditures on programs such as labor-intensive public works with less fear of the adverse impact on import demand. The very rapid response of non-oil exports to the deregulation measures adopted in 1986 and lY87. including a large devaluation of the rupiah and considerable liberalization of the regulatory regime facing ex for optimism on this front. r-
orters. gives cause But much of this
increase was in manufactured products. In a very uncertain world trading environment for tropical agricultural products. it is unlikely that growth of traditional unprocessed agricultural exports will be as rapid as that of processed primary commod- ities. such as wood products. manufactures such as textiles and garments. and services such as tourism. By the end of the century it is indeed possible that manufactured exports could account for well over half of Indonesia’s total commodity exports. as was the case in Japan by the closing decades of the 19th century.‘s
The challenge for Indonesian policy makers over the next decade will thus be to provide an open and deregulated trading environment which encourages all producers in Indonesia to use the resources at their disposal to expand and diver- sify output of goods and services for both domestic and international markets. This will almost certainly involve the gradual modification of some cherished policy goals, of which ‘.food self-sufficiency” may have to be one. But such a conclusion should not be viewed as pessimistic or tantamount to an admission of agricultural policy failure. On the contrary. it is precisely because agricultural policy and food policy in particular has been so successful in Indonesia over the past two decades that the agricultural sector can now decline in relative importance. allowing other sectors to assume the role of “growth engine” in the ongoing process of economic development and structural change.
NOTES
1. The most influential writings by these authors arc foodgrain output per capita in British India dcclincd in Geertz (lY63) and Boeke (lY53). the three decades from lY11 to 1941. as in Java.
production growth of the major non-foodgrain crops 2. Geertz (1963). p. 136. was far more modest in Brittsh India. and according IO
Blyn (lYh6. p. 116) only averaged 1.6% per annum for 3. See Blyn (1966). pp. Y.%126. The diffcrcncc in the years 1X90-1Y47.
growth rates between British India and Indonesia was much more marked for non-foodgrain agrtcuhurs than for foodgrains. While according to Blyn (1Yhh. p. 102). 4. Scheltcma (lY36). p. 13.

INDONESIAN AGRICULTURAL DEVELOPMENT 1251
5. See Booth (1985). p. 124. The correlation be- tween area growth and population growth was also noted by Wander (1965), p. 262. Suwah refers to a bunded field used for growing paddy. It can be either irrigated or rainfed.
6. The term “Malthusian” is here used to describe any theory of endogenous population response. regard- less of the actual mechanism. although scholars argue that Malthus and Ricardo envisaged the response to be through mortality, as population ran ahead of sub- sistence (O’Brien. 1975. pp. 58ff). In the literature on population growth in 19th century Java. a rather different endogenous population response mechanism has been put forward: this is the theory that as demand for labor services under the cultivation system intensi- fied in the 1830s peasant households reacted by increasing their fertility (White. 1973: Alexander and Alexander, 1979). Although among modern writers Boserup is usually given the credit for “turning Malthus on his head,” and claiming that it was population growth which influenced agricultural development rather than vice versa, it should not be forgotten that some 19th century critics of Malthus and Ricardo used arguments similar to those advanced by Boserup. For a discussion of the important contribution of G. P. Scrape, see O’Brien (1975), pp. 64-65.
7. Wander (1965), p. 271.
8. A useful recent survey of initiatives taken by the colonial authorities to improve productivity in foodcrop agriculture in Java in the years from 1900 to 1940 is given in Boomgaard (1986).
9. The ratio of the price of N (calculated from the cif price of ammonium sulphate) to the price of rice was over twice as high in Java in the 1930s as in Japan. In addition. the long-stemmed varieties then in use were not very responsive to nitrogen. The Dutch placed more emphasis on phosphates as a means of increasing yields, but even here the adoption rate was disappoint- ing.
10. This figure is taken from the labor force data published in the 1964-65 National Socioeconomic Survey (Susenas). Much the same figure is reported in the 1971 Population Census.
11. For a discussion of the increasingly violent nature of the disputes over land in rural Java in the early 1960s see Mortimer (1974), especially Chapter 7.
12. For a summary of this literature see in particular White (1983).
13. A recent statement of this point of view is given Hart (1986). pp. 208ff.
14. For a discussion of the Dutch Disease literature in the Indonesian context see Corden and Warr (1982). For a discussion of the impact of the oil boom on Nigeria agriculture, with Indonesian comparisons see Pinto (1987). p. 431ff.
15. See Booth (1986). Table 1.
16. See Hart (1986). pp. 198ff.
17. Glassburner (1986). pp. 29-32 discusses the new rural credit policy.
18. A vigorous debate along these lines was con- ducted in the early 1970s on the consequences of the replacement of hand pounding of rice by small. diesel- driven hullers. Although the use of these hullers could be justified on cost-benefit grounds. the critics argued that their introduction led to a massive loss of income for poor women in rural areas who would not easily find other employment, thus leading to increased polarization of incomes and increased poverty. For the main contributions. see Timmer (1973). Collier. Col- ter, Sinarhadi and Shaw (1974) and Timmer (1974).
19. Manning (1987) discusses evidence from six West Java villages on nonagricultural employment oppor- tunities for rural workers in urban areas, and the associated migration trends.
20. Geertz (1963). pp. 130-143.
21. See Hayami (1975). Chapter 7. and Kikuchi and Hayami (1978). p. 842.
22. Saito (1986). p. 405.
23. Saito (1986). p. 406.
24. Crawcour (1965). pp. 38ff.
25. Smith (1969) p. 687: Crawcour (1965). p. 41.
26. For a discussion of this point, see Van Laanen (1983).
27. Booth (1983) discusses the growing role of government in the economy in the late colonial period. Boeke (1953). Chapters 20-24. gives a useful summary of the growth of government regulation of markets in the 1930s.
28. Crawcour (1965). p. 42.
29. Crawcour (1965). p. 44.
30. If we assume that foodcrop output per male worker was the same in 1930 as in 1960. and calculate non-foodcrop production in wheat equivalents for the years 1928-32 using the Hayami-Ruttan weights. we find that total agricultural output per male worker was about 2.7 wheat units. compared with the 2.4 wheat units estimated for 1960. Given that food output per capita was almost certainly higher in 1930 than in 1960. the figure of 2.7 must be considered an underestimate.
31. Per capita income in Indonesia is estimated by Muljatno (1960) to have returned to prewar levels in 1957. But between 195X and 1965. real growth in national income was slower than population growth. It

1252 WORLD DEVELOPMENT
was not until 196X that real per capita incomes returned to the 193X level.
32. Hayami and Ruttan (19X5). p. 46X
33. Hayami and Yamada (1970). pp. 1lOff
34. Smethurst (1986). pp. 743ff.
35. The results of the 1980 Population Census indi- cated a fall in the infant mortality rate between 1971 and IY80 from 152 to 117 per thousand births for males and from 129 to 98 for females. The 1985 Intercensal Survey revealed that 94% of both boys and girls in the 7-12 age group were attending school. In the 13-15 age group. 76% of boys and 70% of girls were still in school; the corresponding figures for the 16-18 year olds were 53 and 41%.
36. A summary and critique of this discussion IS given in Minami (1986). pp. 298ff.
37. Minami (1986). p. 300.
3X. The most reliable data on agricultural wages are derived from the Farmer’s Terms of Trade Index. published by the Central Bureau of Statistics. These data suggest that there was some improvement in wages up until the early 1980s. and some decline thereafter so that real wages m mid-1988 were little different from those in 1976.
39. Sundrum (1983). p. 185; Pasinetti (1982). p. 71.
40. Personal communication from Dr. Frank Ellis.
41. See in particular Kaneda (1970). pp. 404ff; and Kelley and Williamson (1974), pp. 156ff.
42. Prices of medium grade rice increased by 74% in Jakarta in the two years from September 1986 to September 1988.
43. By early 19X9 the g&r/r/urea ratio had tallen to I:51 compared with the peak of 1:X3 reached in 19S-l. But this ratio is still higher than in 19X&X7 or at an! ttme prior to 1981.
4-l. The transmtgration program has suffered parttcu- larly heavy cuts in the lYX&X7 and 19S7-XX budgets. Useful discusstons of the program and its problems arc to be found in Hardjono (19X6) and Babcoch (IYX6). Babcock points out that the total impact of the transmigration program on expansion of rice produc- tion has been very limited. He also warns that foodcrop production in many of the project sites may decline over time because of the poor quality of the sods.
45. Japan became a net importer of rtcc after 1900: in the interwar years rice imports from Japanese colonies accounted for an increasmg share of total consumption. See Minami (1986). pp. hhff.
46. Dovring (1964) pointed out that for the agricul- tural labor force to remain constant. the nonagricul- tural labor force would have to grow at a rate equal to the total projected growth of the labor force divided by the nonagricultural share of the labor force in the base period. The Indonesian labor force is projected to grow at about 3.0% over the next decade. and the nonagri- cultural share was 44% in 19X0.
47. For a discussion of the restructuring measures taken in the wake of the oil price fall m early 1986 see the Surveys of Recent Developments” in the Btrllrrirt of lndonesran Economic Studies. Volumes 22. 23 and 24. In the first six months of IYXX. oil and pas exports had fallen to about JS”% of total commodity export earnings, compared with over X0% at the height of the oil boom in 1981.
48. Minami (lYX6). Table 7.6. By 1900 the share of unprocessed primary products in total Japanese exports had fallen to 22”/“.
REFERENCES
Alexander. Jennifer. and Paul Alexander. “Labour 1900-42.” Irirtcrrrno. Vol. 10. No. I (19X6). pp. 57- demand and mvolution of Javanese agriculture.” 82. Social An&six. No. 3 (December 1979). pp. 22-44. Booth, Anne, “The colonial legacy and its impact on
Babcock. Timothy. “Transmigration: The regional post-independence planning in India and Indonesia,” impact of a miracle cure.” in Cohn McAndrews Ifinerurio, Vol. 10. No. I (19X6). pp. I-30. (Ed.). Central Governmenr and Local Development Booth. Anne. “Accommodating a growing population in lndonesiu (Singapore: Oxford University Press, in Javanese agriculture,” Bulletitt of Indonesian 19X6). Economrc Sutdies. Vol. 21. No. 2 (August 19X.5).
Bank Indonesia. Annual Report (Jakarta: Bank pp. 115-145. Indonesia. 1968). Booth. Anne. “The evolution of fiscal policy and the
Blyn. George, Agricukurui Trends in India, 18Yl-1947. role of government in the colonial economy.” Paper Oufpur, Availabilify and Producriviry (Philadelphia. presented to the Conference on Indonesian Eco- PA: University of Pennsylvania Press. 1966). nomic History in the Dutch Colonial Era (Canberra:
Boeke. Jan. Economics and Ecnomic Policy of Dual Australian National University, December 19X3). Socieries as Exemplified by lndonesia (Haarlem: Booth. Anne. and R. M. Sundrum. Labour Absorption Tjeenk Willink. 1953). in Agricuhre (Oxford : Oxford University Press,
Boomgaard. Peter. “The welfare services in Indonesia. 1YXS).

INDONESIAN AGRICULTURAL DEVELOPMENT 1253
Booth. Anne. W. J. O’Malley. and Anna Weidemann (Eds.). Indonesian Economic History in the Durch Colonial Era (New Haven, CT: Yale Southeast Asia Studies Monograph Series, forthcoming).
Boserup. Ester. The Conditions of Agricultural Growth (London: Allen and Unwin. 1965).
Bulerin Ringkas (Jakarta: Central Bureau of Statistics, monthly. 1982-current).
Bulog, Food/Rice Price Srabilisarion in Indonesia: Annual Report, 1986 (Jakarta: The National Logis- tics Agency (Bulog). 1986).
Collier. William A.. Jusuf Colter, Sinarhadi. and R. Shaw. “Choice of technique in rice milling in Java: Comment,” Bulletin of Indonesia Economic Studies. Vol. 10. No. 1 (1974). UP. 106120.
Corden, W. M., and Pete; W&r: ‘“The petroleum boom and exchange rate policy in Indonesia.” Ekonomi dan Keuangan Indonesia. Vol. 29. No. 3 (1982), pp. 335-359.
Cornwall, John. Modern Capitalism: Irs Growrh and Transformarion (London: Martin Robertson, 1977).
Crawcour, Sydney. “The Tokugawa heritage.” in W. W. Lockwood (Ed.), The Slate and Economic Enrerprise in Japan (Princeton, NJ: Princeton University Press. 1965).
Creutzberg, P. (Ed.). Changing Economy of Indonesia: - - A Selechon of Source Material from ihh Early 19rh Cenrurv UD to 1940: Vol. 1, Indonesia’s Export Crous 181&1b4i) (The Hague: Martinus Nijho’ff. 1975)‘.
Dixon. John, Food Consumprion Patterns and Related Demand Parameters in Indonesia: A Review of Available Evidence (Washington, DC: International Food Policy Research Institute, 1982).
Dovring, Folke. “The share of agriculture in a growing population,” as reprinted in Carl Either anh Law- rence Witt (Eds.). Aariculture in Economic Develoo- ment (New’ York: McGraw Hill, 1964). .
Feeny. David. “Extensive versus intensive agricultural development: induced public investment in South- east A’sia. 1900-40.” Journal of Economic Hisrory. Vol. 42. No. 3 (Seotember 1983). DD. 687-704.
Food and Agricultuie i)rganization (kA.6). Pronucrion Yearbook (Rome: FAO, various years).
Geertz. Clifford. Agricultural Involurion: The Process of Ecological Change in Indonesia (Berkeley, CA: University of California Press, 1963).
Glassburner, Bruce. “Survey of recent developments,” Bulletin of Indonesian Economic Smdies, Vol. 22. No. l (1986). pp. l-33.
Handoko. Budiono Sri. Gillian Hart, Gustav F. Papa- nek. and Ace Partadiredja. “Technological change. productivity and employment in Indonesian agricul- ture.” mimeo (Boston, MA: Boston University, 1982).
Hara. Yonosuke. “Labour absorption in Asian agricul- ture: The Japanese experience.” in Labour Absorp- rion in Agriculfure: The Easr Asian Experience (Bangkok: ILO-ARTEP, 1980).
Hardjono, Joan, “Transmigration: Looking to the Future,” Bulletin of Indonesian Economic Studies, Vol. 22, No. 2 (August 1986), pp. 28-53.
Hart. Gillian P., Power, Labour and Livelihood: Processes of Change in Rural Java (Berkeley, CA: University of California Press, 1986).
Hart, Gillian P.. Power, Labour and Livelihood: Processes of Change in Rural Java (Berkeley. CA: University of California Press. 1986).
Hasselman. C. J _. Algemeen Overzichr van de Uirkom- slen van bet Welwaarr-Onderzoek Gehouden op Java an Madura in 1’904-5 (S’Gravenhage: Martinus Nijhoff. 1914).
Hayami. Yujiro. A Cenntry of Agricuhural Growrh in Japan: Its Relevance 10 Asran Development (Min- neapolis. MN: University of Minnesota Press. 1975).
Hayami, Yujiro. and Saburo Yamada, “Agricultural productivity at the beginning of industrialisation.” in K. Ohkawa. B. F. Johnston. and H. Kaneda (Eds.). Agriculture and Economic Growrh: Japan’s Experi- ence (Princeton. NJ: Princeton University Press. 1970).
Havami, Y.. and Vernon W. Ruttan, Agriculrural fievelopment: An Ituernarional Perspective (Balti- more. MD: Johns Hopkins University Press 1985).
Hayami, Yujiro. Vernon’ W. Ruttan. and Herman M. Southworth (Eds.). Agriculrural Growrh in Japan, Taiwan, Korea and rhe Philippines (Honolulu. HI: The University Press of Hawaii. 1979).
Institute of Developing Economies (IDE). One Hundred Years of Anriculrural SIarisrics in Japan (Tokyo: IDE. 1969).
Ishikawa. Shieeru. “Peasant families and the agrarian community-in the process of economic develop- ment,” in L. G. Reynolds (Ed.). Agriculture in Development Theory (New Haven. CT: Yale Univer- sity Press, 1975).
Jaarcijfers voor her Koninkrijk der Nederlanden: Kolo- nien [Annual Statistical Digest for the Kingdom of the Netherlands and Colonies] (The Netherlands: Dutch Statistical Association, 18X7-1921; after 1897 published by the Central Statistical Office).
Kaneda, H.. “Longterm changes in food consumption patterns in Japan.” in K. Ohkawa. B. F. Johnston, and H. Kaneda (Eds.). Agricuhure and Economic Growth: Japan’s Experience (Princeton. NJ: Prince- ton University Press. 1970).
Keadaan Angkaran Kerja 1961-80 (Labour Force Situ- ation, 1961-801 (Jakarta: Central Bureau of Statis- tics, 1983).
Kelley, Allen G.. and Jeffrey G. Williamson. Lessons front Japanese Development: An Analyrrcal Eco- nomic History (Chicago: The University of Chicago Press. 1974).
Keyfitz. Nathan. “Indonesian population and the European industrial revolution,” Asian Survey. Vol. 10 (October 1965). pp. 50_%514.
Kikuchi. M.. and Y. Hayami. “Agricultural growth against a land resource constraint: A comparative history of Japan. Taiwan. Korea and the Philip pines,” Journal of Economic Hisfor!. Vol. 38. No. 4 (1978). pp. 839-864.
Kindleberger, Charles P.. Europe’s Postwar Growth: The Role of Labour Supply (Cambridge. MA: Harvard University Press, 1967).
Koloniale Verslag [Colonial Report] (The Hague: Department of Colonies, 1X49-1930).
Lee, Teng-hui. and Chen Yueh-eh. “Agricultural growth in Taiwan. 1911-1972.” in Yujiro Hayami. Vernon W. Ruttan. and Herman M. Southworth

1254 WORLD DEVELOPMENT
(Eds.), Agricultural Growth in Japan. Taiwan. Korea and rhe Philippines (Honolulu. HI: The University Press of Hawaii. 1979).
Lee, Teng-hui. Chen Hsi-huang, and Chen Yueh-eh, “Labour absorption in Taiwan agriculture,” in Labour Absorption in Agriculture: The East Asian Experience (Bangkok: ILO-ARTEP, 1980).
Main Tables on National Income of Indonesia (Jakarta: Central Bureau of Statistics. annual. various years).
Manning, Chris, “Rural economic change and labour mobility: A case study from West Java,” Bulletin of Indonesian Economic Studies, Vol. 23. No. 3 (December 1987), pp. 52-79.
Mears, Leon A.. “Rice and food self-sufficiency in Indonesia.” Bulletin of Indonesian Economic Studies, Vol. 20, No. 2 (1984). pp. 122-138.
Metcalf, John E., The Agricultural Economy of Indonesia. Monograph No. 15 (Washington, DC: US Department of Agriculture, Office of Foreign Agri- cultural Relations, 1952).
Minami, R., The Economic Development of Japan: A Quantitative Studv (London: Macmillan, 1986).
Minami, R.. The Turning Point in Economic Develop- ment: Japan’s Experience (Tokyo: Kinokuniya Book- store. 1973).
Mortimer. Rex. Indonesian Communism Under Soekarno (Ithaca. NY: Cornell University Press, 1974).
Muljatno, “Perhitungan Pendapatan Nasional Indone- sia untuk Tahun 1953-2,” Ekonomi dan Keuangan Indonesia. Vol. 13, Nos. 3-4 (March-April, 1960). pp. 162-216.
O’Brien. D. P.. The Classical Economists (Oxford: Clarendon Press, 1975).
Ohkawa, Kazushi. and Miyohei Shinohara (Eds.). Patterns of Japanese Economic Development (New Haven. CT: Yale University Press, 1979).
Pasinetti, L.. Srructural Change and Economic Growth (Cambridge: Cambridge University Press, 1982).
Pinto. Brian. “Nigeria during and afier the oil boom: A oolicv comparison with Indonesia.” The World Bank E;onom;c Review. Vol. 1, No. 3 (May 1987), pp. 419-446.
Saito. Osamu. “The rural economy: Commercial agri- culture, by-employment and _ wage work,” - in M. B. Jansen and Gilbert Rozman (Eds.). Japan in Transition: From Tokugawa to Meiji (Princeton. NJ: Princeton University Press, 1986).
Scheltema, A. M. P. A.. The Food Consumption of the Native inhabitants of Java and Madura (Batavia: Institute of Pacific Relations, 1936).
Smethurst. Richard J., Agricultural Development and Tenancv Disputes in Japan. 187t%1940 (Princeton, NJ: Princeton University Press. 1986).
Smith, T. H.. “Farm family by-employment in pre- industrial Japan.” Journal of Economic History, Vol. 29 (1969). pp. 687-715.
Statistical Pocketbook of Indonesia (Jakarta: Central Bureau of Statistics. annual or biennial. 1957-87).
Statistical Yearbook of Indonesia (Jakarta: Central Bureau of Statistics. annual, 1976-87).
Statistisch Jaaroverzicht van Nedcrlandsch-lndie (SJO) [Statistical Yearbook of the Netherlands Indies] (Batavia: Central Statistical Office of the Depart- ment of Economic Affairs. 1922-40). From 1931, the SJO was published as Vol. II of the fndisch Verslag. which in turn superceded the Koloniale Verslag.
Sundrum, R. M.. Development Economics: A Frame- work for Analysis and Policy (Chichester: John Wiley. 1983).
Survey Pertanian [Agricultural Survey] (Jakarta: Central Bureau of Statistics. annual since 1971). Since 1980. title changed to Struktur’Ongkos Usaha Tuni Padi dan Palawija [Cost Structure of Foodcrop Farms].
Susenas: Pengeluaran untuk Konsumsi Penduduk [National Socioeconomic Surveys: Expenditure on Household Consumption] (Jakarta: Central Bureau of Statistics, various years).
Timmer. C. Peter, “Choice of technique in rich milling in Java: A reply.” Bulletin of Indonesian Economic Studies, Vol. 10, No. 1 (March 1974). pp. 121-126.
Timmer. C. Peter. “Choice of technique in rice milling in Java,” Bulletin of Indonesian Economic Studies. Vol. 9. No. 2 (July 1973).
Van Laanen, J. T. M., “Between the Java Bank and the Chinese moneylender: Banking and credit in colonial Indonesia,” Paper presented to the Confer- ence on Indonesian Economic History in the Dutch Colonial Era (Canberra: Australian National Uni- versity, December 1983).
Vink, G. J.. De Gromislugen Van Her Indonesisch Landbouwbedrijf (Wageningen: H. Veenman and Zonen. 1941).
Wander, Hilde, Die Beziehungrrr zwischen Bevolke- rungs und Wirtschaftsentwicklung. Dargestellr am Beispiel Indonesiens (Tubingen: J. C. B. Mohr. 1963).
_
White, Benjamin, “Agricultural involution and its critics: Twenty years after.” Bulletin of Concerned Asian Scholars. Vol. 15. No. 2 (1983). pp. l&31.
White. Benjamin. “Demand for labour and population growth in colonial Java.” Human Ecology. Vol. 1. No. 3 (1973), pp. 217-236.
Yamada, Saburo, and Yuiiro Hayami. “Agricultural growth in Japan, 188c1970.” ;n Yujird Hayami. Vernon W. Ruttan. and Herman M. Southworth (Eds.), Agricultural Growth in Japan, Taiwan. Korea and the Philippines (Honolulu. HI: The University Press of Hawaii, 1979).
World Bank, Commodity Trade and Price Trends Washington DC, The World Bank. 1985).
Yamada, >aburo. and Yujiro Hayami. “Agricultural growth in Japan, 1880-1970,“ in Yujiro Havami. Vernon W. Ruttan, and Herman M. Southworth (Eds.), Agricultural Growth in Jupan. Taiwan. Korea and the Philippines (Honolulu, HI: The University Press of Hawaii, 1979).