indraprastha gas limited · indraprastha gas limited corporate presentation ... • reliance...
TRANSCRIPT
CNG for Clean & Green EnvironmentCNG for Clean & Green Environment
Indraprastha Gas Limited
Corporate PresentationJanuary 2005
CNG for Clean & Green EnvironmentCNG for Clean & Green Environment
Agenda
• Overview of Indian Oil & Gas sector• Overview of Gas sector• CNG and PNG business in India• Indraprastha Gas• Critical Success Factors• Opportunity• Growth Strategy• Financial Overview• Risks

CNG for Clean & Green EnvironmentCNG for Clean & Green Environment
Overview of Indian Oil & Gas sector

CNG for Clean & Green EnvironmentCNG for Clean & Green Environment
Structure of the sector
• Aggregate consumption of petroleum products107 MMTPA, Gas demand is 120 mmscmd, supply of 80 mmscmd.
• Sector dominated by Public Sector Undertakings: ONGC, IOCL, GAIL, HPCL & BPCL.
• Reliance Industries (RIL) a formidable private sector player.
• Cairn Energy, British Gas, NIKO, Hardy, UNACOL & SHELL have domestic presence & plan to increase investments.
• Government walks on a tight rope while maintaining balance between economics & politics in the sector.
• Present Government Committed to sectoral reforms.

CNG for Clean & Green EnvironmentCNG for Clean & Green Environment
Gas sectorDemand Supply Scenario*
• Demand (120 mmscmd) outstrips the supply (80 mmscmd)
• ONGC and OIL combined produce 90% of gas.
• Gas from APM fields subsidized to the extent of 50% of the price, Non-APMgas sold at market rate.
mmscmd FY04
Demand 120Supply 80Gap 40
Power42%
Spong Iron4%
Shrinkage9%
Fertilizer32%
Others13%
Natural Gas User Profile*
*Source: Industry

CNG for Clean & Green EnvironmentCNG for Clean & Green Environment
Sector in phase of “Market Development” characterized by:• Strong Volume growth
•Gradual buildup in competition.
CNG for Clean & Green EnvironmentCNG for Clean & Green Environment
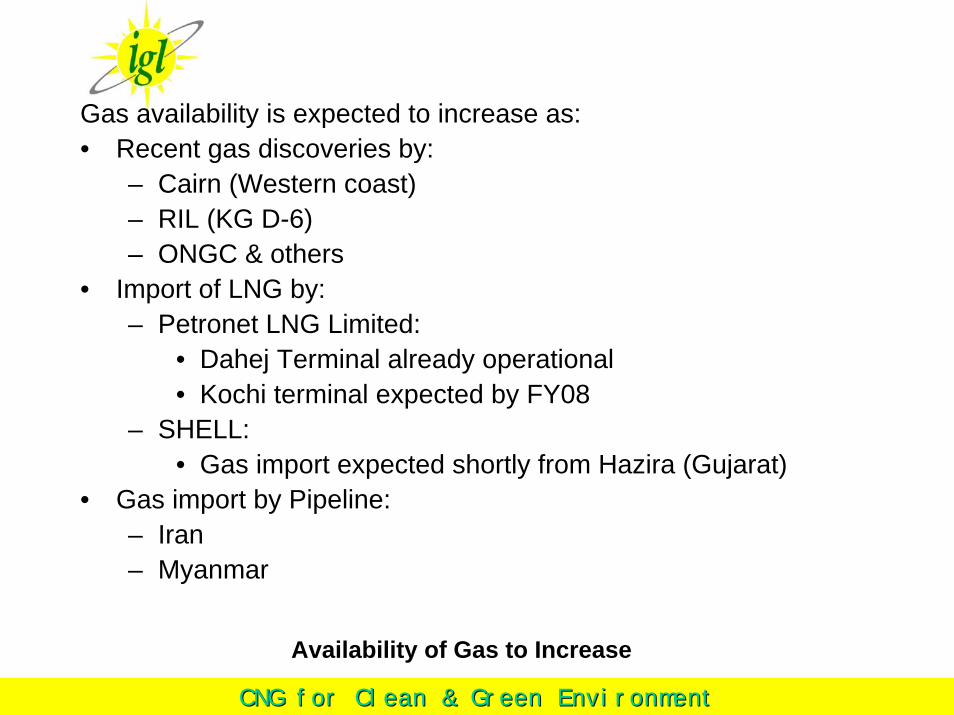
Gas availability is expected to increase as:• Recent gas discoveries by:
– Cairn (Western coast)– RIL (KG D-6)– ONGC & others
• Import of LNG by: – Petronet LNG Limited:
• Dahej Terminal already operational • Kochi terminal expected by FY08
– SHELL:• Gas import expected shortly from Hazira (Gujarat)
• Gas import by Pipeline:– Iran– Myanmar
Availability of Gas to Increase

CNG for Clean & Green EnvironmentCNG for Clean & Green Environment
Gas Pipeline Policy likely to be finalized:• Draft gas transmission pipeline policy issued:
– Issues of “Open Access” and “Common Carrier” discussed– Final policy expected shortly
National transportation Network to expand:• GAIL plans to roll out National Gas Grid
• RIL has proposed pipeline connecting East and West coast.
• Participation of Regional players (like GSPC) also expected to increase.
Policy initiatives & additional supply to increase gas penetration in India.

CNG for Clean & Green EnvironmentCNG for Clean & Green Environment
CNG & PNG Business In India

CNG for Clean & Green EnvironmentCNG for Clean & Green Environment
CNG & PNG Activity in India
• Compressed Natural Gas (CNG) & Piped Natural Gas (PNG) usage in India is limited.
• Consumption of CNG estimated at 1.3 mn kg/day while PNG at 2 mmscmd with usage limited to select markets (eg: Delhi, Surat, Bharuch, Vadodara, Mumbai).
• IGL (Delhi), MGL (Mumbai), GGCL, GSPC, GAIL & Adani Energy (Gujarat) operate in India.
• Usage of CNG & PNG is bound to increase given the environmental & economic benefits and expected supply in future.

CNG for Clean & Green EnvironmentCNG for Clean & Green Environment
CNG & PNG Activity in India
CNG Sales mn kg/day Annualized CNG stations Vehicles servicedIGL 0.82 299 128 90591MGL* 0.48 175 90 141050GAIL 0 0 2 466Gujarat Gas 0.01 5 5 5000Total 1.31 479 225 237107
PNG Sales mmscmd Annualized Number of consumersIGL 0.1 17 19000MGL 0.5 172 195054Gujarat Gas & GSPC* 1.5 548 147500Total 2.0 736 361554
*: Not Listed; Source: Company
IGL is leader in CNG

CNG for Clean & Green EnvironmentCNG for Clean & Green Environment
Indraprastha Gas Limited

CNG for Clean & Green EnvironmentCNG for Clean & Green Environment
Brief History
• A JV between GAIL & BPCL. Government of National Capital Territory of Delhi also a shareholder.
• Incorporated to implement CNG & PNG expansion programme for commercial and domestic use.
• Got an impetus when Supreme Court directed all public transportation vehicles in Delhi to switch to CNG.
• Capitalizing on the opportunity, IGL rolled out the CNG requiredinfrastructure.
• With this IGL has created strong entry barriers in Delhi virtualmonopoly in Delhi and has fortified its bastion.

CNG for Clean & Green EnvironmentCNG for Clean & Green Environment
DADRI
VIJAIPUR
BORERI
ANTA
TCL-BABRALA
MATHURA
AGRA/FEROZ
DESU/Delhi
FARIDABAD
MARUTI
CFCL
GAS PIPELINE NETWORK TO DELHI
EXISTING LINE
NTPC AUR
36”*640 km HBJVAGHODIA JHABUA
KHERA
42”*610 km
CHAINSA
CNG NCTNETWORK
DAHEJ
Hazira
Gas received from GAIL via HVJ pipeline
CNG and PNG sales through owned infrastructure

CNG for Clean & Green EnvironmentCNG for Clean & Green Environment
Value Chain of CNG
CNG Compressor
Storage Cascade
Dispenser
CNG Vehicle
Mobile Cascade
Mobile Cascade
Mobile Cascade
Booster
Dispenser
CNG Vehicle
Mobile Cascade
Dispenser
CNG Vehicle
CNG Compressor
Storage Cascade
Dispenser
CNG Vehicle
19-22 Kg/cm2g
250 Kg/cm2g
<=200 Kg/cm2g <=200 Kg/cm2g
<=200 Kg/cm2g
19-22 Kg/cm2g
250 Kg/cm2g
<=200 Kg/cm2g
STEEL PIPELINE – NATURAL GAS CARRIER
MOTHER STATION
DAUGHTER STATION
ONLINE STATION
DAUGHTER BOOSTER STATION

CNG for Clean & Green EnvironmentCNG for Clean & Green Environment
CNG Business
-
0.10
0.20
0.30
0.40
0.50
0.60
0.70
0.80
FY00 FY01 FY02 FY03 FY04
mn
kg/d
ay
-
10
20
30
40
50
60
70
80
90
100
000
nos
mn kg/day Vehicles
• CNG business has shown robust growth since FY00.
• Sales have grown at 200% CAGR over past 4 years.
• Increased CNG dispensing stations from meagre 30 to over 128 in 4 years.
• Presently caters close to 0.1 mn vehicles in Delhi with sales of 0.8 mn kg/day.
• Contributes 97% to turnover.
IGL DTC OMC Total
Mother 37 20 0 57
On line 12 0 20 32
Daughter 0 0 4 4
Daughter Booster 10 0 25 35
Total 59 20 49 128

CNG for Clean & Green EnvironmentCNG for Clean & Green Environment
PNG Business
-
2
4
6
8
10
12
FY01 FY02 FY03 FY040
2000
4000
6000
8000
10000
12000
14000Sales Consumers
Sales (scmd) No of ConsumersDomestic 0.65 20000Large Commercial 1500 23Small Commercial 30 122Total 1531 20145
• AT present PNG penetration in Delhi is low (< 1%).
• Business contributes 3% to turnover.
• Daily sales of 50K scmd, largely contributed by commercial segment.
• Management is committed to grow the business as potential is huge.
PNG Volumes Breakup
CNG for Clean & Green EnvironmentCNG for Clean & Green Environment
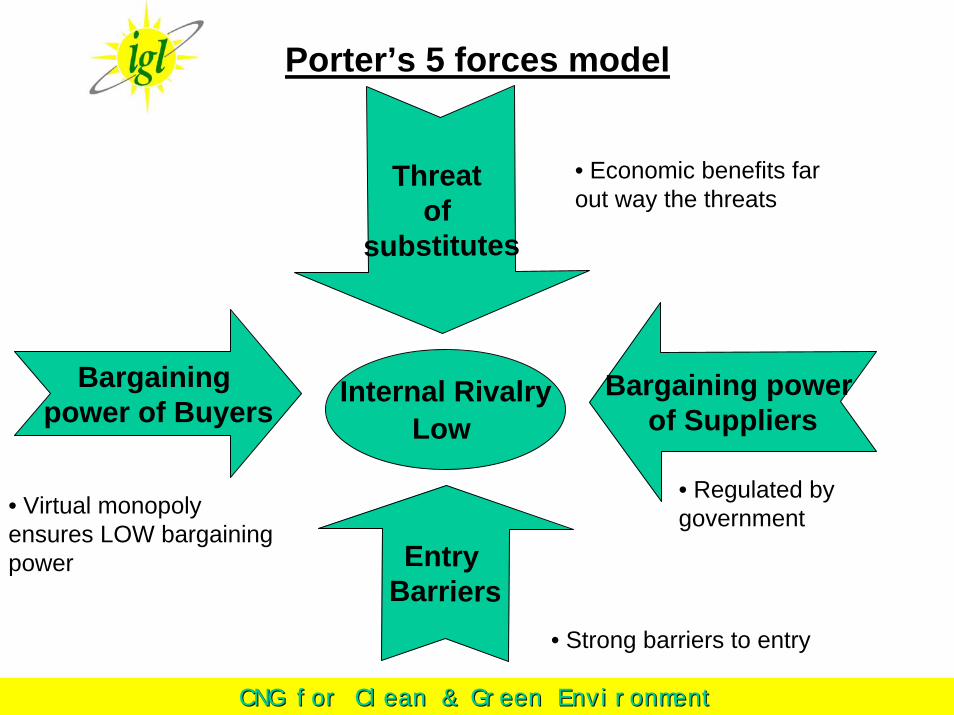
Porter’s 5 forces model
Bargaining power of Buyers
Entry Barriers
Threat of
substitutes
Bargaining power of Suppliers
• Regulated by government
• Economic benefits far out way the threats
• Virtual monopoly ensures LOW bargaining power
Internal RivalryLow
• Strong barriers to entry

CNG for Clean & Green EnvironmentCNG for Clean & Green Environment
Critical Success Factors
It is the skill, not strength that governs the ship! (*)
*- Fuller Thomas

CNG for Clean & Green EnvironmentCNG for Clean & Green Environment
Critical Success Factors
Macro: Industry Level• Supply- Demand• Regulatory Issues• Political interference
Micro: Company Level• Distribution network• Entry Barriers• Balance Sheet Strength• Pricing Power

CNG for Clean & Green EnvironmentCNG for Clean & Green Environment
Critical Success Factors: Macro
Macro: Industry Specific
• Supply- Demand: Demand far out ways supply
• Political interference: Concern exists till appointment of regulator
• Regulatory Issues: Regulator to address micro issues
Impact common for the industry

CNG for Clean & Green EnvironmentCNG for Clean & Green Environment
Critical Success Factors: Micro
Micro: Company Specific• Distribution network: IGL has wide penetration of network• Entry Barriers: Strong barriers to entry as:
– Assured supply of gas– Deep penetration of network
• Balance Sheet Strength:– Size of Rs 4 bn, with Debt Equity Ratio 0.2.– Under leveraged Balance sheet
• Pricing Power:– Economic benefits and entry barriers ensure high Pricing
Power
IGL placed favorably on the CSF matrix

CNG for Clean & Green EnvironmentCNG for Clean & Green Environment
Opportunity for IGL
“Small opportunities are often the beginning of great enterprises!”-Demosthenes (384 BC - 322 BC)

CNG for Clean & Green EnvironmentCNG for Clean & Green Environment
CNG sales in Delhi can expand significantly
• At present, 90,000 vehicles consume 0.8 mn kg/day of CNG in Delhi.
• Consumption growth from existing fleet of vehicles can be pegged to economic growth.
• Boost in CNG sales likely as:– Most of the existing LCVs run on HSD. Delhi Government is
likely to ask existing LCVs to run on CNG.– Estimated size of the incremental market is close to 0.9 mn
kg/day.– After complete conversion of vehicles, CNG sales can
double.
• Leading passenger car manufacturers likely to introduce CNG variants.
• Use of CNG for Locomotives also possible.

CNG for Clean & Green EnvironmentCNG for Clean & Green Environment
Potential of new geographies lucrative
• New geographies also offer lucrative market.
• Local governments of adjoining regions are likely to follow Delhi model considering its success.
• Existing fleet of vehicles in new geographies close to Delhi.
-5
101520253035404550
Faridabad Gurgaon Noida Gr. Noida Gaziabad
000
nos
Autos Taxis Buses Cars
At least Public mode of transportation can run on CNG in near future.

CNG for Clean & Green EnvironmentCNG for Clean & Green Environment
Untapped PNG market
• Due to regulatory compliance, preference was given to CNG business over PNG.
• With successful roll out of CNG infrastructure, management is now committed to grow PNG business.
• Present PNG penetration in Delhi is <1% on base of 3.5 mn users.
• Marginal 1% y-o-y shift from LPG to PNG results addition of 35000 consumers every year.
• LPG user base in new geographies is equivalent to Delhi.
• Could create market equivalent to Delhi over 10 years.
If PNG substitutes electricity in home appliances, sales to go in new orbit.

CNG for Clean & Green EnvironmentCNG for Clean & Green Environment
Growth Strategy of IGL
“Strategy is buying bottle of fine wine when you take a lady out for dinner. Tactics is getting her to drink it!” -- Frank Muir

CNG for Clean & Green EnvironmentCNG for Clean & Green Environment
Growth Strategy of IGL
• Stress is to improve asset turnover in Delhi
• IGL’s strategy centered around improving the asset turnover rather than aggressive expansion of network.
• Plans are to:– Capitalize on the future regulatory initiatives for CNG
business– Improve penetration of PNG business:
• Focus on area surrounding existing CNG infrastructure• Target large consumers (Residential complex, industrial
estate).• Penetration of network at marginal capital outlay.
Economic benefits & low penetration ensure high growth potential.

CNG for Clean & Green EnvironmentCNG for Clean & Green Environment
Growth Strategy of IGL
– Expand in new geographies:
• Tap geographies where gas supply not an issue: Gaziabad, Faridabad, Noida, Gr. Noida and Gurgaon.
• Planned capital outlay of Rs 2 bn over next 4 years for rolling out infrastructure.
• Already 2 CNG dispensing stations operational at Noida.

CNG for Clean & Green EnvironmentCNG for Clean & Green Environment
Strong Financials

CNG for Clean & Green EnvironmentCNG for Clean & Green Environment
Snapshot of Profit & Loss A/C
Rs mn FY02 FY03 FY04 H1FY05 H1FY04
Net Sales 1187.7 3069.1 4262.1 2209.3 2020.0% Growth 158.4 38.9EBIDTA 297.7 1191.9 1695.5 909.6 810.4% Growth 300.3 42.2PBT 120.2 870.2 1286.0 661.6 580.5% Growth 623.9 47.8Tax 59.0 320.6 464.1 253.9 210.4PAT 61.2 539.8 821.9 408.0 370.2% Growth 781.6 52.3

CNG for Clean & Green EnvironmentCNG for Clean & Green Environment
Snapshot of Balance Sheet
Rs mn FY02 FY03 FY04Equity 1400.0 1400.0 1400.0Reserves 28.6 532.6 1076.5Networth 1428.6 1932.6 2476.5Debt 570.0 798.8 600.0Capital Employed 2114.3 2957.7 3508.5Net Fixed Assets 2282.3 3445.7 3769.4Working Capital (169.7) (488.0) (260.9)Capital Deployed 2114.3 2957.7 3508.5

CNG for Clean & Green EnvironmentCNG for Clean & Green Environment
Key Ratios
Key Ratios FY02 FY03 FY04 H1FY05 H1FY04EPS 0.4 3.9 5.9 2.9 2.6OPM (%) 25 39 40 41 40NPM (%) 5 18 19 18 18RoCE (%) 16 32 39RoE(%) 4 28 33Book Value 10 14 18

CNG for Clean & Green EnvironmentCNG for Clean & Green Environment
Risks
• Adverse Regulatory Intervention : Unlikely
• Acute shortage of gas in India: Unlikely

CNG for Clean & Green EnvironmentCNG for Clean & Green Environment
DISCLAIMER: This presentation contains forward-looking statements which may be identified by their use of words like “plans,” “expects,” “will,” “anticipates,” “believes,” “intends,” “projects,” “estimates” or other words of similar meaning. All statements that address expectations or projections about the future, including, but not limited to, statements about the strategy for growth, product development, market position, expenditures, and financial results, are forward-looking statements. Forward-looking statements are based on certain assumptions and expectations of future events. The companies referred to in this presentation cannot guarantee that these assumptions and expectations are accurate or will be realised. The actual results, performance or achievements, could thus differ materially from those projected in any such forward-looking statements. These companies assume no responsibility to publicly amend, modify or revise any forward looking statements, on the basis of any subsequent developments, information or events, or otherwise.
Thank You!