induction of murine erythroleukemia cell differentiation ... · biochimica et biophysics acta 13 12...
TRANSCRIPT

Biochimica et Biophysics Acta 13 12 (1996) 8-20 et Biophysics kcta
Induction of murine erythroleukemia cell differentiation is associated with methylation and differential stability of poly( A) + RNA transcripts
Ioannis S. Vizirianakis, Asterios S. Tsiftsoglou *
Laboratory of Pharmacology, Department of Pharmaceutical Sciences, Aristotle University of Thessaloniki, Thessaloniki 540 06, Greece
Received 22 September 1995; revised 22 January 1996; accepted 22 January 1996
Abstract
Murine erythroleukemia (MEL) cells exposed to DMSO were assessed for their ability to methylate poly(A)+ RNA and accumulate RNA transcripts of globin and nonglobin genes (c-myc, p-a&n and MERS). Cells were pulse-labeled with t.-[methyl-3H]methionine, cytoplasmic RNA was isolated, selected for poly(A)+ RNA and analyzed by HPLC chromatography for methylated nucleosides. When MEL cells were exposed to inhibitors of RNA methylation (neplanocin A, 3-deazaneplanocin A and cycloleucine) and assessed for their ability to differentiate by DMSO, accumulate RNA transcripts, produce hemoglobin, methylate poly(A)+ and poly(A)- RNA and synthesize S-adenosylmethionine (SAM) and S-adenosylhomocysteine @AH), we observed the following: (a) MEL cells treated with DMSO underwent hypermethylation in poly(A)+ RNA that preferentially occurred at the S-cap structures (7-methylguanosine and 2’Gmethylcytidine and 2’-O-methyluridine); (b) inducer-treated MEL cells exhibited a decrease in the intracellular level of SAH that led to a lower ratio of SAH/SAM, an event that favors methylation; and (c) treatment of MEL cells with inhibitors of RNA methylation suppressed methylation of poly(A)- and poly(A)+ RNA, reversed the ratio SAH/SAM seen in differentiated MEL cells and prevented differentiation to occur. Moreover, we observed that treatment of MEL cells with selective inhibitors of RNA methylation caused fragmentation of p major glohin and c-myc mRNAs, two RNA transcripts coded by developmentally regulated genes, while had no detectable effect on the structural integrity of poly(A)+ RNA transcripts transcribed by two housekeeping genes ( p-a&in and MERS). These data indicate that induction of erythroid cell differentiation of MEL cells is associated with changes in methylation of poly(A)+ RNA and selective differential stability of RNA transcripts, two events that might be related to each other.
Keywords: Cell differentiation; RNA transcript; Poly(A)+: (Murine erythroleukemia cell)
1. Introduction
Differentiation of murine erythroleukemia (MEL or
Friend) cells into mature hemoglobin producing cells is associated with a series of morphological and biochemical events reviewed elsewhere [l-3]. Among these, hypometh- ylation of DNA was observed in terminally differentiated MEL cells [4], an event that has attracted considerable attention in recent years in developmentally regulated cel- lular systems [5,6]. Biochemical studies with cordycepin
Abbreviations: DMSO, dimethyl-sulfoxide; HMBA, hexamethylene- bis-acetamide; UDP-4, 2-(3-ethylureido)-6-methylpyridine; SAM, S- adenosylmethionine; SAH, S-adenosylhomocysteine; MEL, murine ery- throleukemia.
* Corresponding author. Fax: + 30 31 997631; e-mail: [email protected].
0167-4889/96/$15.00 0 1996 Elsevier Science B.V. All rights reserved PII SO167-4889(96)00012-2
(Y-deoxyadenosine) (an inhibitor of polyadenylation and methylation of RNA) and more recently with N6-methyl- adenosine have suggested that initiation of commitment of inducer-treated MEL cells to terminal erythroid maturation may depends on both the synthesis and posttranscriptional modifications of RNA, such as methylation [7-l I].
During posttranscriptional methylation of RNA, methyl-groups are transferred from SAM into specific base residues of RNA via RNA methyltransferases. Mammalian cells contain several RNA species (snRNAs, tRNAs, rRNAs, mRNAs) most of which are methylated at base residues located at unique structures like the 5’-cap in mRNA and the S-end of snRNAs [ 12- 151. Unfortunately, little is known about the biological role of RNA methyla- tion in cell growth and differentiation [ 16-191.
In the present study, we extended our preliminary stud- ies [9,20] and explored the potential role of RNA methyla- tion in growth and differentiation of MEL cells. In particu-

IS. Vizirianakis, AS. Tsijtsoglou / Biochimrca et Biophvsica Acta 1312 (1996) 8-20 9
lar, we investigated the following questions: (a) Do differ- entiating MEL cells undergo alterations in the synthesis and methylation of RNA? (b) If yes, do these changes occur simultaneously or independently during growth and differentiation? (c) Do poly(A)+ RNA transcripts undergo changes in methylation, to what extend and at which base residues? (d) Do the changes in RNA methylation occur during differentiation as a result of alterations in the intracellular level of SAM and SAH? (e) Are the changes in RNA methylation causally related to induction of MEL cell differentiation and production of hemoglobin? and finally, (f) Does inhibition of RNA methylation affect stability of poly(A)+ RNA transcripts?
To approach these questions, MEL cells were treated in culture with and without DMSO and pulse-labeled with L-[methyl-‘Hlmethionine. The ability of control and differ- entiating cells to methylate their total cytoplasmic RNA as well as poly(A)+ RNAs was assessed at different times with the use of a modified reversed-phase HPLC chro- matographic method based on standard procedures [21-231. We analyzed [methyl-3H]-labeled poly(A)+ RNA fractions at the level of nucleosides and assessed the intracellular levels of SAM and SAH. two active intermediates in the methylation cycle. In a complementary series of experi- ments, MEL cells were exposed to both inducers of differ- entiation and inhibitors of RNA methylation and examined whether such MEL-treated cells mature, produce globin mRNA and hemoglobin and accumulate certain RNA tran- scripts and in particular those that play a critical role in growth and differentiation (e.g.. c-myc). Here, we wish to present evidence indicating that induction of hemoglobin synthesis and terminal erythroid maturation in MEL cells are associated with changes in methylation of cytoplasmic RNA as well as of poly(A)+ RNA. Moreover, we ob- served that suppression of RNA methylation led to block- ade of MEL cell differentiation and selective degradation of globin and c-myc RNA transcripts.
2. Materials and methods
2. I. Chemicals and biochemicals
Dimethylsulfoxide (DMSO) was purchased by Mallinckrodt, (St. Louis, MO, USA). SAM, SAH, cy- cloleucine, HMBA, hypoxanthine, methylated and unmeth- ylated base and nucleoside standards were obtained from Sigma Chemical Co. (St. Louis, MO, USA) and were of the highest grade available. Neplanocin A and 3- deazaneplanocin A were kindly donated by Dr. Victor E. Marquez (National Cancer Institute, USA). UDP-4, a po- tent inducer of hemoglobin synthesis in MEL cells, was synthesized in our laboratory 1241. Analytical-grade potas- sium dihydrogen phosphate was purchased from Merck (Darmstadt, Germany). L-[methyl-3H]Methionine (80.0 Ci/mmol) and [5,6-3H]uridine (39.6 Ci/mmol) were ob-
tained from NEN Research Products (Boston, MA, USA) and [ 35 Slmethionine (1000 Ci/mmol) from Amersham (UK). Pl nuclease was purchased from Boehringer Mannheim (Mannheim, Germany), calf intestine alkaline phosphatase from BDH (Poole, UK) and tobacco acid pyrophosphatase from Sigma Chemical Co. (St. Louis, MO, USA). Stock solutions (1 mM) of nucleoside stan- dards were prepared by dissolving appropriate amounts in 0.02 M KH,PO, solution (pH 5.6) and stored at -20°C. Standards of various concentrations were prepared by ap- propriate dilutions of the stock solutions.
2.2. Cell cultures
Cells employed throughout this study were MEL- 745PC-4A a clone of MEL-745 cells obtained after sub- cloning and subsequent testing of clones derived for high degree of inducibility. All cultures were maintained in Dulbecco’s modified Eagles medium (DMEM) containing 10% (v/v) fetal calf serum (Gibco, Long Island, NY) and antibiotics (penicillin and streptomycin 100 pg/ml). Cells were incubated at 37°C in a humidified atmosphere con- taining 5% CO2 and maintained at densities that permitted logarithmic growth (1 . lo5 to 1 . lo6 cells/ml). Cell via- bility was assessed as reported elsewhere [lo].
2.3. Induction and assessment of di@erentiation
Cells were incubated with no drug and the inducing agent in the absence or presence of an inhibitor as indi- cated in the text. At certain timed-intervals during incuba- tion, the proportion of differentiated (hemoglobin-produc- ing cells) was assessed cytochemically with benzidine- H,O, solution [25]. The number of committed cells was assessed by the plasma clot clonal assay as described by Gusella et al. [26].
2.4. Pulse labeling with L-[methyl- 3H]methionine and iso- lation qf [methyl- -‘HJpoly(A)’ RNA
MEL cells treated in culture under various conditions were removed from cultures (samples of 1.0-1.5 . 10’ cells) at different times and pulse-labeled in fresh methion- ine-free DMEM containing 10% v/v FCS for 3 h with L-[methyl- 3 Hlmethionine (44 pCi/ml, 80.0 Ci/mmol) in the presence of 20 PM adenosine, 20 PM guanosine and 20 mM sodium formate. These agents were added in order to diminish the incorporation of [methyl-“HI groups into purine ring via the de novo biosynthesis pathway and increased exclusive transmethylation of RNA [27]. This procedure however, was not used in early experiments shown in Fig. 2A, where pulse-labeling of cells was carried out in normal DMEM without the addition of adenosine, guanosine and sodium formate. The latter con- ditions were applied in order to record kinetic changes in the overall methylation of cytoplasmic RNA. Cells were

10 IS. Vizirianakis, A.S. Tsiftsoglou/Biochimica et Biophysics Acta 1312 (1996) 8-20
then collected, washed with PBS solution (3 x > and pro- cessed for isolation of total cytoplasmic RNA [28]. Dupli- cate aliquots of 10 ~1 of isolated cytoplasmic RNA were counted for radioactivity and the extent of RNA methyla- tion (cpm/lOO pg RNA per3 h) was assessed. Isolated [methyl- 3 HI-labeled cytoplasmic RNA was then separated into poly(A)+ RNA fraction by passing twice throughout an oligo(dT)-cellulose column according to Kingston [29]. The purity of poly(A)+ RNA fraction was checked by agarose gel electrophoresis.
2.5. Alkaline hydrolysis of [methyl- 3H]poly(A)i RNA
Samples of [methyl-3H]-labeled poly(A)+ RNA (5 pg or as otherwise is indicated) were dissolved in 50 ,ul of 0.3 M KOH and the mixture was incubated at 37°C for 19 h [30]. At the end of this period, 50 ~1 of 0.3 M HClO, solution were added and the resulting insoluble KClO, was removed by centrifugation (12 000 X g>. The supematant was collected, mixed with 50 ~1 of 0.2 M glycine buffer pH 9.2 containing 1.4 U of calf intestine alkaline phos- phatase and incubated at 37°C for 1 h [31,32]. The prod- ucts derived were lyophilized, dissolved in water and injected (20 ~1) into the HPLC column. This method yields nucleosides, 2’0methylated dinucleotides and in- tact 5’-end cap structures.
2.6. Enzymatic hydrolysis of [methyl- 3Hlpoly(Aj’ RNA
[Methyl-3H]-labeled poly(A)+ RNA (3 ,ug) dissolved in 50 ~1 solution containing 30 mM CH,COONa pH 5.3, 2 mM ZnCl, was first digested with 2.1 U of Pl nuclease at 37°C for 5 h and subsequently with acid pyrophos- phatase (0.8 U/ml> at 37°C for 1 h in a buffer solution containing 20 mM Tris . HCl, pH 7.5, and 2 mM MgCl, [32]. After addition of 50 ~1 buffer solution (0.2 M glycine, pH 9.2), incubation continued for an additional hour in the presence of 1.4 U of alkaline phosphatase. Finally, the reaction mixture was lyophilized, the residue was dissolved in 20 ~1 of water and analyzed by HPLC. This method yields methylated nucleosides originating from the 5’-cap structure as well as from other parts of the mRNA molecules.
2.7. HPLC separation of [methyl- ‘HI-labeled poly(A) ’ RNA digestion products
A Varian (Sugar Land, Texas, USA) HPLC gradient system consisted of two Model 2510 dual-piston pumps, a Model 2584 high pressure solvent mixer, a Rheodyne Model 7125 sample injector and a Model 2550 UV-visible spectrophotometric detector was used. The reversed-phase (C18, 10 pm) Techsil 10 C,, column (25 cm X 4.6 mm i.d.) was purchased from HPLC Technology (Macclesfield, UK). Integrations and retention times were obtained using
a Varian Model 4290 electronic integrator. Fractions of 0.5 ml/30 s of the effluent were collected with a LKB (Bromma, Sweden) 2 112 Redirac fraction collector and the radioactivity was measured with a Packard liquid scintilla- tion counter. Samples (20 ~1) of hydrolytic products of [methyl-3H]poly(A)t RNA were loaded on the reversed- phase column equilibrated at 1 ml/min with 0.02 M KH, PO,, pH 5.6. Chromatographic runs were performed at ambient temperature using a 3-step linear gradient sys- tem of 0.02 M KH,PO,, pH 5.6 and methanol as follows: (a) O-2% methanol, t = 10 min; (b) 2-5% methanol, t = 10 min; (c) 5-35% methanol, t = 20 min. The effluent was monitored at 254 nm and fractions of 0.5 ml/30 s were collected. Each fraction was then assessed for ra- dioactivity. The column was re-equilibrated for at least 15 min with the low-strength eluent between two different runs. Using this procedure, the retention times were repro- ducible.
2.8. Detection and quantitation of SAM and SAH levels in cellular extracts by HPLC analysis
Exponentially growing MEL cells (1 . lo5 cells/ml) were treated with one or more than one agents as indicated in the text. At different times, cells (2 . 106) were removed from cultures and labeled for 3 h at 37°C with 10 pCi/ml [ 35S]methionine (1000 Ci/mmol at reference date) in DMEM supplemented with 5% (v/v> FCS. By the end of this period, cells were resuspended in 1 M HClO, solution, sonicated for 10 s and centrifuged at 15 000 X g for 15 min at 4°C. The supematant was collected and analyzed by HPLC. Samples of 20 ~1 of acid-soluble cell extracts were loaded on the reversed-phase column (RP-18, 5 pm, 25 cm X 4.6 mm I.D.) and analyzed using a linear gradient system consisting of 0.02 M KH,PO,, pH 3.8 and methanol. Concentrations of methanol ranging from 0 to 35% were used for elution within 30 min. The flow rate was 1 ml/min and detection of SAM and SAH was carried out at 254 nm. Fractions collected were counted for radioactivity in a liquid scintillation counter.
2.9. Assessment of the steady-state level of RNA transcripts by Northern blot hybridization analysis
Cytoplasmic RNA prepared from control and MEL cells treated with agents at various timed-intervals, as indicated in the text, was assessed for the steady-state level of RNA transcripts coded by pmajor globin, c-myc, p-actin and MER5 genes, with the use of [32P]-labeled probes, as previously described [10,33]. The former two genes are regulated and expressed developmentally, while the latter two are considered house-keeping genes. The probes used were 7.0 kb for p major globin mRNA [lo], 1.7 kb for c-myc mRNA [34], 350 bp for @actin mRNA [35] and 1.4 kb for MER5 mRNA [36]. The MER5 probe was kindly

1.X Vizirianakis, AS. Tsiftsoglou / Biochimica et Biophysics Acta 1312 f 1996) 8-20 11
donated by Dr. M. Obinata of Dept. of Cell Biology, Tohoku University, Sendai, Japan.
3. Results
3.1. Growth and diflerentiation of MEL cells are associ- ated with alterations in synthesis and methylation of total cytoplasmic RNA as well as pa@(A)+ RNA
As shown in Fig. 1 continuous exposure of cells to DMSO (1.5% v/v) led to a gradual accumulation of committed cells, an early reduction in the synthesis of cytoplasmic RNA and a slightly lower rate of growth. MEL cells grown in culture from a relatively low (5 . lo4 cells/ml) to a high density of cells (l-2. lo6 cells/ml) exhibited growth phase dependent alterations in the rate of RNA synthesis (Fig. 1C). The rate of RNA synthesis in DMSO-treated cells was about 25-30% of that of control cells after 24 h incubation (Fig. 1C). Both control and DMSO-treated MEL cells exhibited changes in the state of methylation of total cytoplasmic RNA, as we observed from the results shown in Fig. 2A. The overall methylation increased between 12 to 36 h incubation and decreased at later times as cells entered the plateau phase of growth. In particular, DMSO-treated cells underwent hypermethyla- tion of RNA as compared to control untreated cells (Fig. 2A). However, the magnitude of methylation of total cyto- plasmic RNA (incorporated [methyl- 3H]-groups/ 100 pg per 3 h) decreased at later times but remained at levels substantially above those of control cells. Since control and DMSO-treated cells continue to cycle for 72 h, these data indicate that growth and differentiation of MEL cells are associated with alterations both in synthesis and meth- ylation of cytoplasmic RNA. The fact that DMSO-treated cells exhibited decreased RNA synthesis but higher level of methylation indicates that RNA is methylated at a greater extent in differentiating cells.
To increase the transmethylation of poly(A)+ RNA and to suppress any non-specific incorporation of [methyl- 3H]-groups into purine ring due to de novo purine biosyn- thesis, we employed medium containing adenosine, guano- sine and sodiun formate as routinely used by others [22,27,37]. Labeling of MEL cells with L-[methyl- 3H]methionine in methionine-free DMEM increased the incorporation of [methyl- ‘HI-groups into RNA fractions (transmethylation) by 4-fold as compared to RNA fractions prepared from MEL cells and labeled with t.-[methyl-3H]- methionine in regular DMEM. This allowed us to isolate more radioactive poly(A)+ RNAs and to study their pat- tern of methylation in both control and DMSO-treated MEL cells (see Fig. 2B). Induction of differentiation of cells by DMSO led to increased transmethylation (incorpo- rated [methyl-3H]-groups/ 100 pg per 3 h) of poly(A)+ RNAs after 36 h incubation as compared to untreated cells, as seen in Fig. 2B.
1 60 72
0- E 0 12 24 36 48 60 72
‘L C
Time (hrs)
Fig. 1. Cell growth, commitment and rate of RNA synthesis in control and DMSO-treated cells. MEL-745PC-4A cells were incubated in DMEM supplemented with 10% FCS in the presence (-0-l and absence (-0-l of DMSO (1.5% v/v). At times indicated, cell growth was determined (panel Al. In parallel, cells were removed from cultures and assessed for commitment by the plasma clot clonal assay (panel B) according to Gusella et al. [26]. The rate of RNA synthesis (panel Cl was also measured as follows: Cells (1. 106) were removed from cultures and pulse-labeled with 2 @/ml [5,6-3H]uridine (spec. act. 39.6 Ci/mmol) at 37°C for 90 min. By the end of this period, cells were precipitated with an ice-cold solution of TCA (10% w/v), the insoluble material was collected on filters (Whatman GF/B) and washed with 5% (w/v) TCA solution, The filters were washed thereafter with ethanol-ether (l:l), air-dried and counted for radioactivity in a scintillation counter. The values indicated are the mean value of two separate experiments.
3.2. Hypermethylation of poly(A)+ RNA occurs at specific base residues
The results described above imply that changes in trans- methylation of RNA species occur during MEL cell ery- throid maturation. An important question then to be asked

12 IS. Viziriunakis, AS. Tsifsoglou/Biochimica et Biophyicu Acta 1312 (1996) 8-20
lo- A
2-
01 0 12 24 26 48 00 72
01 I I I I 1 8
0 12 24 26 48 60 R
Time (hrs)
-I
Fig. 2. Kinetics of methylation of total cytoplasmic as well as poly(A)+ RNA in control and DMSO-treated MEL cells by pulse-labeling of cells with L-[methyl-‘Hlmethionine. Panel A: MEL-745PC-4A cells were incu- bated as indicated under Fig. 1. At time intervals indicated, samples of cells (3-7.10’) were removed from cultures and assayed for cytoplasmic RNA methylation as follows: Cells were washed out of any drug, resuspended in fresh normal DMEM supplemented with 10% (v/v) FCS (at density 8. lo6 to 1. 10’ cells/ml) and pulse-labeled with 30 wCi/ml of L-[methyl-3H]methionine (spec. act. 80.0 Ci/mmol) at 37°C for 3 h. By the end of this time, total [methyl-‘HI-cytoplasmic RNA was purified and counted for radioactivity in a liquid scintillation counter. Cytoplasmic RNA methylation was estimated by the incorporation of [methyl-“H]- groups per 100 pg RNA/3 h. The results presented are the average obtained from two separate experiments. Panel B: MEL-745PC-4A cells were incubated as indicated under Fig. 1. At time intervals indicated, cells were removed from culture and pulse-labeled in methionine-free DMEM with t_-[methyl-3H]-methionine (44 &i/ml, 8O.OCi/mmol) for 3 h in the presence of adenosine, guanosine and sodium formate. In order to select purified [methyl-3H]poly(A)+ RNA from isolated [methyl-‘Hlcy- toplasmic RNA we carried out two rounds of oligo(dT)-cellulose chro- matography, as described under Section 2. Poly(A)+ RNA methylation was estimated by the incorporation of [methyl-‘HI-groups per 100 pg of poly(A)+ RNA/3 h. The results presented are the average obtained from two separate experiments. Control C-O-) and DMSO-treated (-0-j MEL cells.
was where does this methylation occur in poly(A)+ RNA? Two different but complementary approaches were applied to detect qualitative and quantitative changes in highly purified methylated poly(A)+ RNA derived from control and differentiating MEL cells. Briefly, the first approach
involved alkaline hydrolysis of [methyl-3H]poly(A)+ RNA, dephosphorylation of the products and separation of the nucleosides derived by HPLC (Fig. 3). This approach yielded nucleosides, 2’-0-methylated dinucleotides and in- tact S-cap structures of mRNA (Fig. 4A) [30]. The second, involved enzymatic digestion of [methyl-“H]poly(A)+ RNA that also breaks down the 2’-0-methylated dinu- cleotides and the intact 5’-cap structures of mRNA to the level of nucleosides (Fig. 4B) 1321. So, the alkaline hydrol- ysis of [methyl-3H]-labeled poly(A)+ RNA allowed us to detect methylated nucleosides having 2’-OH free, while the enzymatic digestion methylated nucleosides derived from the S-cap structures and 2’-0-methylated dinucleotides as well as other methylated derivatives from elsewhere of the poly(A)+ RNA. Furthermore, the enzymatic hydrolysis of RNA allowed detection of methylated nucleosides that otherwise were unstable in alkaline conditions (e.g. 7-
h P
lo 20 30 40 d
r I B
L 20 30 40 M
Elution time ( min )
Fig. 3. HPLC elution pattern of known methylated and non-methylated nucleosides and bases. Panel A: A mixture of l-2 nmol of each substance indicated in a total volume of 20 ~1 was injected on a reversed-phase column (Techsil 10 C ,s, 25 cm X 4.6 mm) and chromatographed using a gradient system of two solvents as described under Section 2. Panels B and C: Cytoplasmic [methyl-sH]poly(A)- RNA was isolated from control MEL cells and hydrolyzed by alkali treatment as described under Section 2 for poly(A)+ RNA. The RNA hydrolysis products mixed (panel C) or not (panel B) with known internal standards and analyzed by the HPLC method (shown in panel A). The peak of absorbance of added known methylated and unmethylated nucleosides is indicated by the arrows. 5 pg of RNA was hydrolyzed for each run. Abbreviations: C, cytidine; mC,, 5-methylcytosine; U, uridine; m’I, 7-methylinosine; m5C, 5-meth- ylcytidine; C,, 2’Gmethylcytidine; m7G, 7-methylguanosine; G, guano- sine; U,, 2’.O-methyluridine; m’ I, 1-methylinosine; m’ G, 1 -methyl- guanosine; m*G, N,-methylguanosine; A, adenosine; A,, 2’-O-methyl- adenosine; m6A, N6-methyladenosine and rn: A, N’, N6-dimethyladeno- sine.
I.S. Vizirianakis, A.S. Tsifsoglou /Biochimica et Biophysics Acta 1312 (1996) S-20 13
c B’caps
500 ! Alkaline hydrolysis A
400 - m5C, i
mlG
I
300-
‘i
“i”” “i” ‘1” “1” “i m6A
200- c “i” ?‘i
, m6 *
T” 4” I2
50 60 70 60 90
Fraction number
I Enzymatic hydrolysis 61
m’G
I I
Fraction number
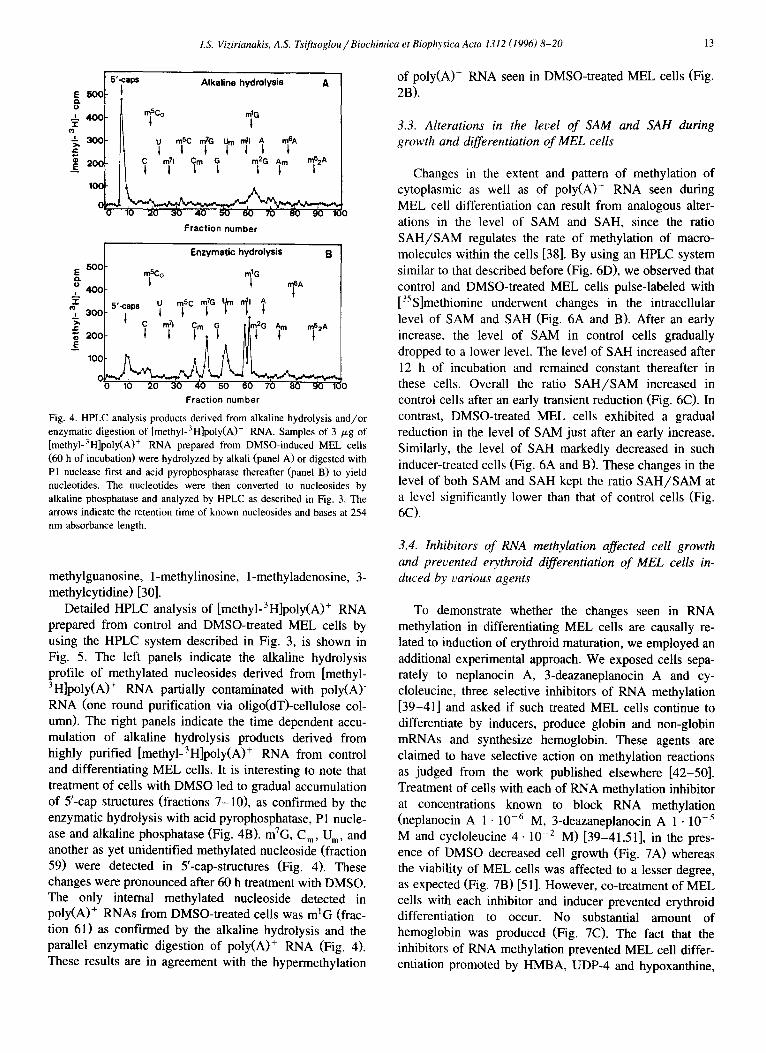
Fig. 4. HPLC analysis products derived from alkaline hydrolysis and/or enzymatic digestion of [methyl-‘H]poly(A)+ RNA. Samples of 3 pg of [methyl-3H]poly(A)+ RNA prepared from DMSO-induced MEL cells (60 h of incubation) were hydrolyzed by alkali (panel A) or digested with Pl nuclease first and acid pyrophosphatase thereafter (panel B) to yield nucleotides. The nucleotides were then converted to nucleosides by alkaline phosphatase and analyzed by HPLC as described in Fig. 3. The arrows indicate the retention time of known nucleosides and bases at 254 nm absorbance length.
methylguanosine, 1-methylinosine, 1-methyladenosine, 3- methylcytidine) [30].
3.4. Inhibitors of RNA methylation afSected cell growth and prevented erythroid differentiation of MEL cells in- duced by various agents
Detailed HPLC analysis of [methyl- 3H]poly(A)+ RNA To demonstrate whether the changes seen in RNA prepared from control and DMSO-treated MEL cells by methylation in differentiating MEL cells are causally re- using the HPLC system described in Fig. 3, is shown in lated to induction of erythroid maturation, we employed an Fig. 5. The left panels indicate the alkaline hydrolysis additional experimental approach. We exposed cells sepa- profile of methylated nucleosides derived from [methyl- ‘H]poly(A)” RNA partially contaminated with poly(A)-
rately to neplanocin A, 3-deazaneplanocin A and cy-
RNA (one round purification via oligo(dT)-cellulose col- cloleucine, three selective inhibitors of RNA methylation 139-411 and asked if such treated MEL cells continue to
umn). The right panels indicate the time dependent accu- differentiate by inducers, produce globin and non-globin mulation of alkaline hydrolysis products derived from highly purified [methyl- 3H]poly(A)+ RNA from control
mRNAs and synthesize hemoglobin. These agents are
and differentiating MEL cells. It is interesting to note that claimed to have selective action on methylation reactions as judged from the work published elsewhere [42-501.
treatment of cells with DMSO led to gradual accumulation of S-cap structures (fractions 7-101, as confirmed by the
Treatment of cells with each of RNA methylation inhibitor
enzymatic hydrolysis with acid pyrophosphatase, Pl nucle- at concentrations known to block RNA methylation
ase and alkaline phosphatase (Fig. 4B). m7G, C,, U,, and (neplanocin A 1 . 10m6 M, 3-deazaneplanocin A 1 . 10e5
another as yet unidentified methylated nucleoside (fraction M and cycloleucine 4. lo-* M) [39-41,511, in the pres-
59) were detected in 5’-cap-structures (Fig. 4). These ence of DMSO decreased cell growth (Fig. 7A) whereas
changes were pronounced after 60 h treatment with DMSO. the viability of MEL cells was affected to a lesser degree, as expected (Fig. 7B) [5 1 I. However, co-treatment of MEL
The only internal methylated nucleoside detected in poly(A)+ RNAs from DMSO-treated cells was m’G (frac-
cells with each inhibitor and inducer prevented erythroid differentiation to occur. No substantial amount of
tion 61) as confirmed by the alkaline hydrolysis and the parallel enzymatic digestion of poly(A)+ RNA (Fig. 4).
hemoglobin was produced (Fig. 70. The fact that the
These results are in agreement with the hypermethylation inhibitors of RNA methylation prevented MEL cell differ- entiation promoted by HMBA, UDP-4 and hypoxanthine,
of poly(A)+ RNA seen in DMSO-treated MEL cells (Fig. 2B).
3.3. Alterations in the level of SAM and SAH during growth and differentiation of MEL cells
Changes in the extent and pattern of methylation of cytoplasmic as well as of poly(A)+ RNA seen during MEL cell differentiation can result from analogous alter- ations in the level of SAM and SAH, since the ratio SAH/SAM regulates the rate of methylation of macro- molecules within the cells [38]. By using an HPLC system similar to that described before (Fig. 6D), we observed that control and DMSO-treated MEL cells pulse-labeled with [ 35 Slmethionine underwent changes in the intracellular level of SAM and SAH (Fig. 6A and B). After an early increase, the level of SAM in control cells gradually dropped to a lower level. The level of SAH increased after 12 h of incubation and remained constant thereafter in these cells. Overall the ratio SAH/SAM increased in control cells after an early transient reduction (Fig. 6C). In contrast, DMSO-treated MEL cells exhibited a gradual reduction in the level of SAM just after an early increase. Similarly, the level of SAH markedly decreased in such inducer-treated cells (Fig. 6A and B). These changes in the level of both SAM and SAH kept the ratio SAH/SAM at a level significantly lower than that of control cells (Fig. 60.
14 IS. Vizirianakis, A.S. Tsiftsoglou / Biochimica et Biophysics Acta 1312 (1996) 8-20
three other inducers in addition to DMSO (Table 1), caused a pronounced inhibition of methylation of poly(A)- suggests that RNA methylation may be part of the central and poly(A)+ RNA, both 3-deazaneplanocin A and cy- process leading to differentiation and not an isolated event cloleucine exerted a more selective inhibitory effect on specific to an inducer. Finally, all the inhibitors of RNA methylation of poly(A)+ RNA rather than of poly(A)- methylation prevented erythroid differentiation of MEL RNA (Table 2). This suggests that the inhibition effect of cells by sodium butyrate, another potent inducing agent latter agents on methylation of poly(A)+ RNA is more or (data not shown). less specific.
3.5. Treatment of MEL cells with RNA methylation in- hibitors reduced methylation of poly(A)’ and poly(A)+ RNA and increased the ratio SAH / SAM
To verify that treatment of MEL cells with each in- hibitor of RNA methylation in the absence and presence of inducer DMSO prevents RNA methylation at concentra- tions used, we measured methylated RNA fractions in control and DMSO-treated cells. While neplanocin A
As illustrated in Table 2, exposure of MEL cells to either neplanocin A or 3-deazaneplanocin A for even one hour led to rapid accumulation of SAH, whose level was hardly detectable prior treatment in both control and DMSO-treated cells (data not shown). Longer exposure (24 h) of DMSO-treated cells to neplanocin A and 3- deazaneplanocin A led to accumulation of SAH (Table 2) prior to commitment. In contrast to neplanocin A and 3-deazaneplanocin A treatment, exposure of cells to cy- cloleucine led to rapid depletion of SAM, without affecting
I. Alkaline hydrolysis of Imethyl-3Hl-polyA + RNA samples purified after o tin& mind of chromatography on oligoldlj-cellulose
0 20 40 60 80
6 B.-caps DMSO 48hr 1 l+G
II. Alkaline hydrolysis of [methyl-SHI-polyA+ RNA samples purified after am of chromatography on oligoktT)cellulose
6 Y-caps
! 1
4
m'G
: 0 20 40 60 80
0 0 W.(\* -- 20 40 60 80
Fraction number Fraction number
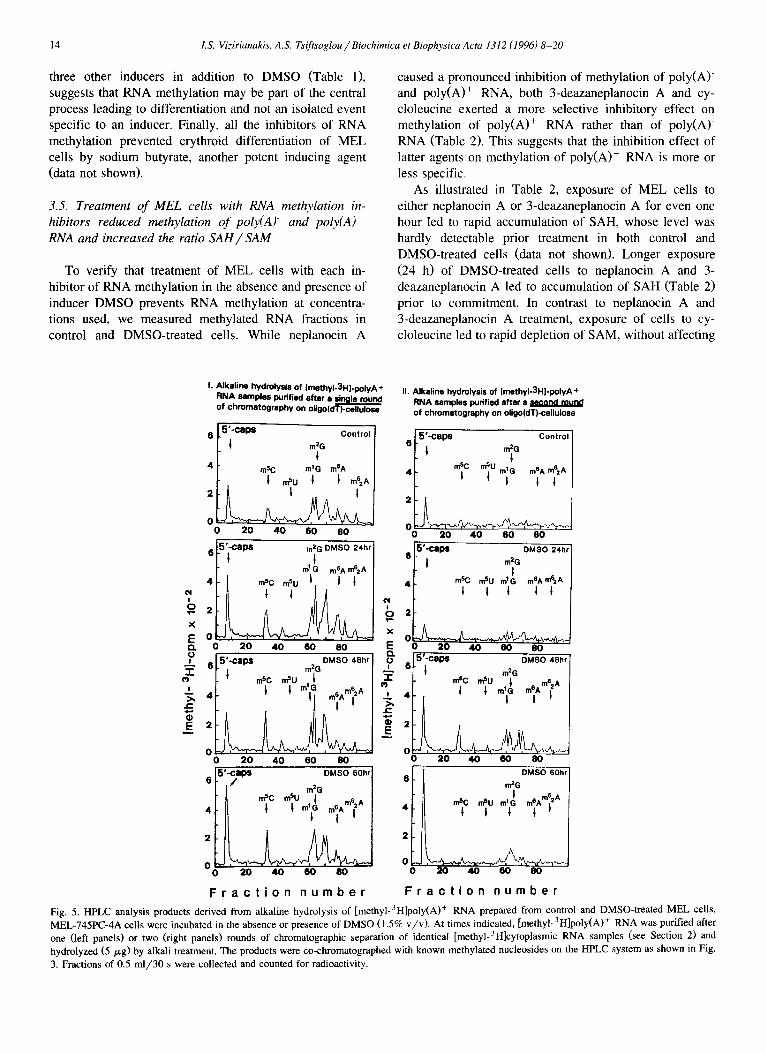
Fig. 5. HPLC analysis products derived from alkaline hydrolysis of [methyl-‘H]poly(A)+ RNA prepared from control and DMSO-treated MEL cells.
MEL-745PC-4A cells were incubated in the absence or presence of DMSO (1.5% v/v). At times indicated, [methyl-“H]poly(A)+ RNA was purified after one (left panels) or two (right panels) rounds of chromatographic separation of identical [methyl-‘Hlcytoplasmic RNA samples (see Section 2) and hydrolyzed (5 pg) by alkali treatment. The products were co-chromatographed with known methylated nucleosides on the HPLC system as shown in Fig. 3. Fractions of 0.5 ml/30 s were collected and counted for radioactivity.

I.S. Vizirianakis, A.5 Tsifsoglou/ Biochimica et Biophysics Acta 1312 (1996) 8-20 15
0 12 24 26 48 00 72
Time thrsl
*AM
I
A -
(0 a0 a Elution time (mid
Fig. 6. Alterations in the intracellular levels of SAM and SAH in control and DMSO-treated MEL cells. MEL-745PC-4A cells were incubated in the presence (-0-j or absence (-a-) of DMSO (1.5% v/v). At time intervals indicated, cells (2. 106) were removed from cultures, pulse- labeled with 10 pCi/ml [35S]methionine (spec. act. 1000 Ci/mmol) at 37°C for 3 h. Acid soluble cellular extracts were prepared and analyzed by HPLC, as shown in the right panel (D). (Panel D: A mixture consisted of 1-3 nmol of each of the compounds indicated above (20 ~1 total volume) was injected on a reversed-phase column (RF-l& 5 pm, 25 cmX4.6 mm) and chromatographed as described under Section 2). The level of SAM and SAH at each time point was estimated by the amount of radioactivity corresponding to SAM (panel A) or SAH (panel B) derived from each sample. The values of ratio SAH/SAM were also estimated and are shown in panel C. Abbreviations: SAM, S-adenosyl- methionine, SAH, S-adenosylhomocysteine, Ado, adenosine, N6-SAH, S-N6-methyladenosylhomocysteine and N6-mAdo, N6-methyladenosine. N6-SAH was prepared using known methods [11,75,76].
the level of SAH as expected. Overall, the reversion in the ratio SAH/SAM was less dramatic in DMSO-treated cells exposed to cycloleucine for 24 h than to neplanocin A and 3-deazaneplanocin A (Table 2). These data indicate that the blockade of MEL cell differentiation caused by these agents is associated with alterations in RNA methylation and changes in the intracellular level of SAM and SAH.
3.6. The inhibitors of RNA methylation caused differential stability of house- (@actin, MERS) and non-house-keeping genes ( p mojo r globin, c-myc)
To investigate whether inhibition of RNA methylation that leads to blockade of MEL cell differentiation also affects accumulation of RNA transcripts of various genes, some of which are house-keeping ( /?-actin, MERS) and others are developmentally regulated ( /3 major globin, c- myc), we carried out the following study: we exposed cells to each inhibitor in the presence and absence of the inducer DMSO for various times and then assessed the steady-state level of intact and degraded poly(A)+ RNA
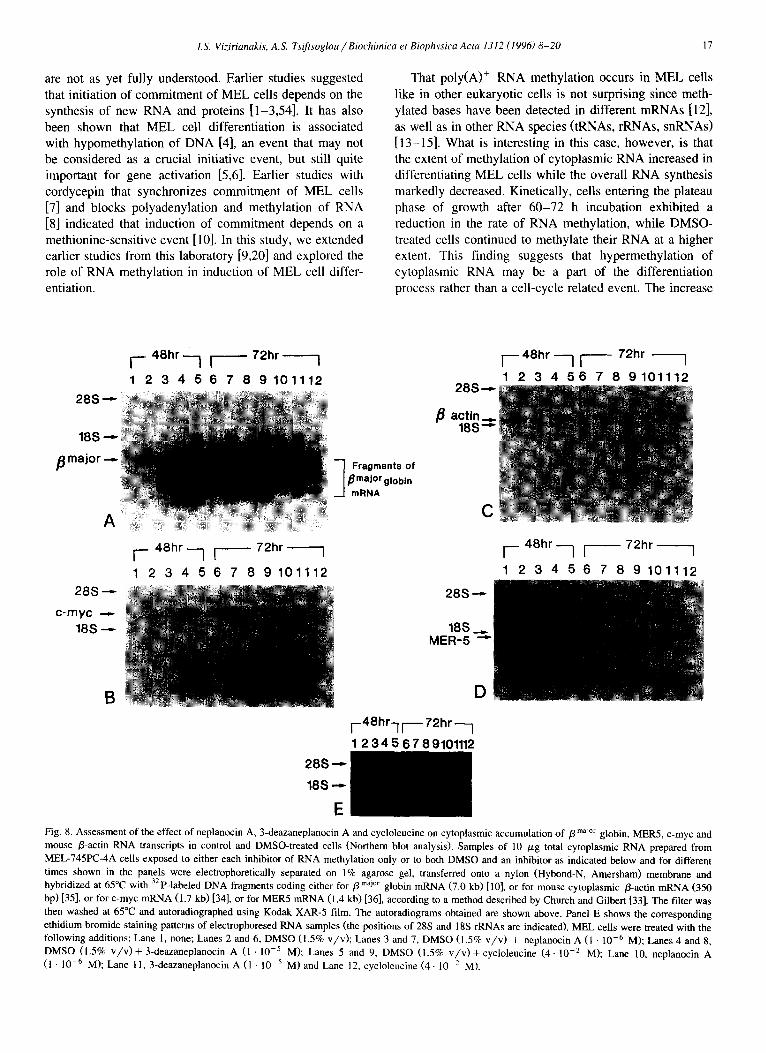
transcripts. This study has shown the following: (a) treat- ment of MEL cells with DMSO alone led to cytoplasmic accumulation of p major globin mRNA (Fig. 8A)., while caused marginal effect on RNA transcripts coded by two housekeeping genes ( p-actin, MERS) (Fig. 8C and D). However, exposure of cells to each inhibitor of RNA methylation in the presence or absence of inducer altered the pattern of accumulation of c-myc RNA transcripts and caused fragmentation of fimajor mRNA, an event previ- ously observed with N6-methyladenosine, another in- hibitor of MEL cell differentiation [lo]. In addition, expo- sure of MEL cells separately with each methylation in- hibitor alone led to relatively high levels of pmajor mRNA although fragmented, as compared to control untreated cells (Fig. 8A). Fragmentation was also observed in RNA transcripts coded by c-myc (Fig. 8B), a growth-gene in- volved in the regulation of commitment to maturation in MEL cells [52,53]; (b) Northern blot hybridization analysis for p-actin and MERS transcripts, indicated that the
z so ‘i; -
‘g aeso e- gy40 z 3” c” 20
d 0 0 24 48 72 %
Time (hrs)
1
Fig. 7. Effects of neplanocin A, 3-deazaneplanocin A and cycloleucine on cell growth, viability and DMSO-induced differentiation of MEL cells. Exponentially growing MEL-745PC-4A cells were treated in culture with the following additions: none f-0-1, DMSO (1.5% v/v) (-0-I. DMSO (1.5% v/v)+neplanocin A (1.10e6 M) (-A-), DMSO (1.5% v/v)+3- deazaneplanocin A (1. 10m5 M) (-m-l and DMSO (1.5% v/v)+ cycloleucine (4. 10m2 M) (-A -1. Cell growth (panel A) and viability (panel B) were determined 48 h later, while the proportion of differenti- ated cells (panel C) was scored after 96 h as described elsewhere [lo]. Each time point represents the mean value of two separate experiments.

16 IS. Vizirianakis, AS. Tsifttsoglou/ Biochimica et Biophysics Acta 1312 (1996) S-20
Table 1 Inhibition of MEL cell differentiation by neplanocin A, 3-deazaneplanocin A and cycloleucine in the presence of different inducing agents
Treatment Concn. (M) Cell growth Viability Benzidine-positive (% of control) (%o) cells (%)
none _ 100 98.8 <I DMSO 0.210 103 99.2 69.6 DMSO + neplanocin A 0.210 + 1 1o-6 50.6 97.0 1.9 DMSO + 3-deazaneplanocin A 0.210 + 1 10-s 39.3 97.0 1.8 DMSO + cycloleucine 0.210 + 4 10-Z 52.8 95.4 15.9 HMBA 5 10-j 34.8 96.8 76.4 HMBA + neplanocin A 5 lo-1+ 1’ 10-e 29.2 89.2 9.5 HMBA + 3-deazaneplanocin A 5~10-~+1~1o-s 24.7 87.6 10.2 HMBA + cycloleucine 5.10-‘+4.10-2 23.6 86.7 25.0 UDP-4 2.5 1O-4 53.9 98.1 74.0 UDP-4 + neplanocin A 2.5 1O-4 + 1 1O-6 47.2 97.6 6.0 UDP-4 + 3-deazaneplanocin A 2.5. 10-j + 1 lo-’ 39.3 97.0 4.1 UDP-4 + cycloleucine 2.5. IO-J +4. IO-* 32.5 97.5 14.0 Hypoxanthine 5.5 10-j 74.1 98.4 40.7 Hypoxanthine + neplanocin A 5.5 10-s + 1 lo-b 38.2 98.0 2.9
Hypoxanthine + 3-deazaneplanocin A 5.5 10-j + 1’ 10-s 37.1 98.3 2.8 Hypoxanthine + cycloleucine 5.5’ 10-‘+4’10-* 31.5 97.4 12.1
Exponentially growing MEL-745PC-4A cells were incubated with and without an inducing agent (DMSO, HMBA, UDP-4, hypoxanthine) at its optimum inducing concentration as well as with the inducer in the presence of neplanocin A, or 3-deazaneplanocin A and/or cycloleucine at concentrations indicated. Cell growth and viability were determined after 48 h whereas the proportion of differentiating cells after 96 h of incubation. Each value indicated is the mean value of two separate experiments.
steady-state level of both these RNA transcripts remained constant since no substantial degradation occurred (Fig. 8C and D). In addition, considering that the cytoplasmic RNA we prepared was intact as shown by the ethidium bromide staining pattern of the RNA samples (Fig. 8E), we con- clude that inhibition of RNA methylation in MEL cells selectively affects stability of RNA transcripts coded by
two developmentally regulated genes ( p major globin and c-myc) that play a critical role in MEL cell differentiation.
4. Discussion
The central mechanism(s) which govern the initiation of commitment of MEL cells to terminal erythroid maturation
Table 2 Effect of neplanocin A, 3-deazaneplanocin A and cycloleucine on RNA methylation of MEL cells grown in the presence and absence of DMSO
Treatment Concn. (M) Methylation of RNA a (spec. act. of [methyl-3HlRNA) Ratio
poly(A)- RNA
kpm/ 100 wg RNA)
poly(A)+ RNA
kpm/ 100 pg RNA)
SAH/SAM
A. Without DMSO None Neplanocin A 3-deazaneplanocin A Cycloleucine B. With DMSO DMSO DMSO + Neplanocin A DMSO + 3-deazaneplanocin A DMSO + Cycloleucine
_ 354761 (100) 127783 (100) 0.023 b 1 10-h 124834 (35.2) 18099 (14.2) 0.854 b 1’ 1o-5 302340 (85.2) 27931 (21.9) 1.185 b 4 lo-? 438080 (123.5) 70956 (55.5) 0.230 b
0.210 503551(141.9) 133071(104.1) 0.045 c 0.210 + 1 10-6 210042 (59.2) 18750 (14.7) 0.940 c 0.210 + 1 10-s 524732 (147.9) 16823 (13.2) 1.023 ’ 0.210 + 4 lo-* 649592 (183.1) 8482 (6.6) 0.097 c
For the measurement of RNA methylation MEL cells were incubated in culture with and without DMSO (1.5% v/v) as well as separately with neplanocin A, 3-deazaneplanocin A and/or cycloleucine at concentrations indicated in the presence and absence of DMSO. After 24 h incubation, cells were pulse-labeled with L-[methyl-sH]methionine as described in Section 2. By the end of this time, total cytoplasmic [methyl-sH]RNA was isolated and separated into poly(A)- and poly(A)+ fractions by oligddT)-cellulose chromatography. The specific activity of each RNA species was measured with the use of a liquid scintillation counter. The ratio SAH/SAM was calculated as reported elsewhere [74]. a Numbers in parentheses indicate the level of methylation as compared to that of control cells. b.c These numbers indicate the level of SAH/SAM ratio after: b 1 h and ’ after 24 h incubation of each methylation inhibitor indicated, as reported under Section 2.
I.S. Vi:iriunakis, AS. Tsiftsoglou/Biochirnica et Biophysics Acta 1312 (1996) 8-20 17
are not as yet fully understood. Earlier studies suggested that initiation of commitment of MEL cells depends on the synthesis of new RNA and proteins [l-3,54]. It has also been shown that MEL cell differentiation is associated with hypomethylation of DNA [4], an event that may not be considered as a crucial initiative event, but still quite important for gene activation [5,6]. Earlier studies with cordycepin that synchronizes commitment of MEL cells [7] and blocks polyadenylation and methylation of RNA [S] indicated that induction of commitment depends on a methionine-sensitive event [ 101. In this study, we extended earlier studies from this laboratory [9,20] and explored the role of RNA methylation in induction of MEL cell differ- entiation.
I- 48hr--, I 72hr.1
1 2 3 4 5 6 7 8 9 101112
That poly(A)’ RNA methylation occurs in MEL cells like in other eukaryotic cells is not surprising since meth- ylated bases have been detected in different mRNAs [12], as well as in other RNA species (tRNAs, rRNAs, snI2NAs) [ 13- 151. What is interesting in this case, however, is that the extent of methylation of cytoplasmic RNA increased in differentiating MEL cells while the overall RNA synthesis markedly decreased. Kinetically, cells entering the plateau phase of growth after 60-72 h incubation exhibited a reduction in the rate of RNA methylation, while DMSO- treated cells continued to methylate their RNA at a higher extent. This finding suggests that hypermethylation of cytoplasmic RNA may be a part of the differentiation process rather than a cell-cycle related event. The increase
r 48hrI ,--- 72hr -1
1 2 3 4 56 7 8 9101112 1-e
1
Fragments of
pmajorglobin mRNA
C
r 48hr--, ,- 72hr.-1 r 48hr ---, ,--- 72hr -,
1 2 3 4 5 6 7 8 9 101112 1 2 3 4 5 6 7 8 9 101112
28s - 28s -
c-myc - 18s - 18S,
MER-5 -
,--48hr,,----72hr---,
12345678910111
285 -
18s -
E Fig. 8. Assessment of the effect of neplanocin A, 3-deazaneplanocin A and cycloleucine on cytoplasmic accumulation of p maJo’ globin, MER.5, c-myc and mouse p-actin RNA transcripts in control and DMSO-treated cells (Northern blot analysis). Samples of 10 pg total cytoplasmic RNA prepared from MEL-745PC-4A cells exposed to either each inhibitor of RNA methylation only or to both DMSO and an inhibitor as indicated below and for different times shown in the panels were electrophoretically separated on 1% agarose gel, transferred onto a nylon (Hybond-N, Amersham) membrane and hybridized at 65°C with 32P-labeled DNA fragments coding either for p maJar globin mRNA (7.0 kb) [lo], or for mouse cytoplasmic p-actin mRNA (350 bp) [35], or for c-myc mRNA (1.7 kb) 1341, or for MERS mRNA (1.4 kb) [36], according to a method described by Church and Gilbert [33]. The filter was then washed at 65°C and autoradiographed using Kodak XAR-5 film. The autoradiograms obtained are shown above. Panel E shows the corresponding ethidium bromide staining patterns of electrophoresed RNA samples (the positions of 28s and 18s rRNAs are indicated). MEL cells were treated with the following additions: Lane 1, none; Lanes 2 and 6, DMSO (1.5% v/v); Lanes 3 and 7, DMSO (1.5% v/v) + neplanocin A (1 10m6 M); Lanes 4 and 8, DMSO (1.5% v/v)+ 3-deazaneplanocin A (1 1O-5 M); Lanes 5 and 9, DMSO (1.5% v/v) +cycloleucine (4. lo-* M); Lane 10, neplanocin A (1 10m6 MI; Lane 11, 3-deazaneplanocin A (1 . lo-’ M) and Lane 12, cycloleucine (4. lo-’ M).
18 IS. Vizirianakis, AS. Tsiftsoglou/ Biochimica et Biophysics Acta I312 (1996) 8-20
in methylation of RNA was observed several hours after the reduction of RNA synthesis, but not simultaneously.
HPLC analysis of [methyl- 3H]poly(A)+ RNA revealed methylated constituents at 5’-cap structure (m7G, C,, U,) and hardly detectable levels of m6A (Figs. 4 and 5). It must be noted that l-methylguanosine (m’G) was detected in poly(A)+ RNA from DMSO-treated cells for the first time. The gradual accumulation of [methyl- 3H]-labeled 5’-cap structure constituents in DMSO-treated cells (Fig. 5) indi- cates that mRNAs are relatively hypermethylated at the 5’-cap structure during differentiation as well as at other base residues. At some sites, methylation occurs on the base residue while in others at 2’-OH position of ribose. Unfortunately, the analytical methods employed here did not permit us to demonstrate whether transmethylation of RNA at internal base residues occurs randomly or at discrete regions of RNA molecules.
Alterations in RNA methylation observed during DMSO-induced MEL cell differentiation can be attributed either to changes in the intracellular level of SAM and SAH or to alterations in the activity of RNA methyltrans- ferases. As shown in Fig. 6A, the level of SAM decreased in both control and differentiating MEL cells by different rates following an early increase. In contrast, the level of SAH remarkably increased in control cells, while dramati- cally decreased in differentiating cells from the first hours of incubation with DMSO. Overall, a lower ratio of SAH/SAM observed in differentiated cells (Fig. 6C). These changes in the ratio SAH/SAM appear to affect the degree of RNA methylation, since RNA methyltransferases may no longer be inhibited by SAH [38]. Technical difli- culties in achieving detectable level of RNA methylation in vitro did not allow us to assess endogenous RNA methyltransferase activity in control and DMSO-treated cells (data not shown).
Although the data presented thus far indicate that MEL cell differentiation is associated with both qualitative and quantitative changes in poly(A)+ RNA methylation at specific sites, the precise role of these changes in matura- tion of MEL cells remains elusive. Hypermethylation of course could increase hydrophobicity of RNA and may facilitate RNA transport from nucleus into cytoplasm as reported by Camper et al. [37]. Alternatively, hypermeth- ylation may affect the tertiary structure and conformation of RNA in a way that renders it capable to interact with trans-acting proteins like in other cases [55-621. Further- more, changes in methylation of RNA at several sites may affect its stability, an event that occurs during MEL cell differentiation [63-651 and is developmentally regulated [65]. A study showing an increase in methylation of 5.8 S rRNA in normal tissues versus neoplastic cells (HeLa and Novikoff hepatoma) has been reported [ 181. Similarly, the role of RNA methylation was also examined in L5 my- oblast cell differentiation [ 191.
To further support the notion that there may be a causal relationship between methylation of RNA and specific
events of MEL cell differentiation, we employed a reverse but complementary approach mentioned above. Knowing that RNA methylation can be inhibited by agents like neplanocin A, 3-deazaneplanocin A and cycloleucine which have been already used in many cellular systems as spe- cific inhibitors of methylation reactions [39-511, it was reasonable to investigate whether selective inhibition of methylation of nuclear RNA and most importantly of cytoplasmic poly(A)+ RNA leads to: (a) alterations in SAH/SAM ratio, (b) changes in the steady-state accumu- lation and stability of RNA transcripts coded by various genes (MERS, /3-actin, c-myc and pmajor globin), and (c) blockade of maturation. We are aware that although the methylation inhibitors employed in this study are specific inhibitors of active methylation cycle, one can argue that they can affect methylation of other macromolecules in addition to RNA. We reason that their effect on DNA methylation must be negligible, since this process is al- ready suppressed in differentiating MEL cells [4]. Further- more, if DNA methylation was a rate-limiting step in MEL cell differentiation, then we would expect to see induction of differentiation rather than inhibition since evidence exists to indicate that MEL cell differentiation is associ- ated with DNA hypomethylation [4]. However, the rela- tively high steady-state level of pmajor globin mRNA in cells exposed exclusively to methylation inhibitors and fail to undergo terminal maturation may be due to DNA hypomethylation as seen by treatments of MEL cells with 5-aza-cytidine and 5-aza-2’-deoxy-cytidine [66]. DNA hy- pomethylation can occur at 5’-end upstream sequences adjacent or distant from the globin genes that contain transcription cis-control elements in a way seen in LCR region (HS region) of the globin genes [67-691. The findings that co-treatment of MEL cells with DMSO and each of the inhibitors of RNA methylation blocked induc- tion of erythroid maturation, suppressed the steady-state level accumulation of pmajor globin and c-myc RNA transcripts and decreased their stability while had no de- tectable effect on p-actin and MERS RNAs, suggest that RNA methylation and RNA stability may be related to each other in MEL cell differentiation.
The findings presented here are also in agreement with previous studies showing that N6-methyladenosine [ 10,ll I, 3-deazaadenosine [70], cordycepin [7], 5’-methylthioa- denosine [7 1,721 and 5’-S-isobutylthioadenosine [71], which modulate the methylation cycle [8,11,73] inhibit initiation of MEL cell differentiation. Methylation of RNA may be a critical event in induction of erythroid differentiation of MEL cells. Moreover, knowing that commitment of MEL cells depends on the synthesis of new RNA and proteins as well as on methylation and differential stability of poly(A)+ RNAs, it is reasonable to assume that inhibition of RNA methylation may block initiation of differentiation by af- fecting stability of critical RNA transcripts. Of course, this is an interesting working hypothesis pending further inves- tigation and approval.
I.S. Vizirianakis, A.S. Tsiftsoglou/Biochimica et Biophysics Acta 1312 (1996) 8-20 19
Acknowledgements
We would like to thank Drs. J.E. Kountourellis and I. Niopas for their contribution to technical issues in the HPLC studies described in this paper. We would like also to thank Drs. L.C. Papadopoulou and C. Markopoulou for their technical assistance during the initial phase of HPLC experiments, as well as Dr. V.E. Marquez for kindly donated neplanocin A and 3-deazaneplanocin A used in this study. This work was supported in part by a grant to A.S. Tsiftsoglou from the Greek Secretariat of Research and Technology.
References
[I] Tsiftsoglou, AS. and Wong, W. (1985) Anticancer Res. 5, 81-100. [2] Tsiftsoglou, AS., Hensold, J., Robinson, S.H. and Wong, W. (1987)
in New Avenues in Developmental Cancer Chemotherapy (Harrap, K.R. and Connors, T.A., eds.), vol. 8, pp. 205-227, Bristol-Myers Cancer Symposia, Academic Press, Orlando, USA.
[3] Marks, P.A., Sheffery, M. and Rifkind, R.A. (1987) Cancer Res. 47, 659-666.
[4] Christman, J.K., Weich, N., Schoenbrun, B., Schneiderman, N. and Acs, G. (19801 J. Cell Biol. 86, 366-370.
[5] Doerfler, W. (1983) Ann. Rev. Biochem. 52, 93-124. [6] Taylor, J.H. (ed.), (1984) DNA methylation and cellular differentia-
tion, vol. 11, Cell Biology Monographs, Springer-Verlag, Vienna. [7] Levenson, R., Kernen, J. and Housman, D. (1979) Cell 18, 1073-
1078. [8] Kredich, N.M. (1980) J. Biol. Chem. 255, 7380-7385. [9] Vizirianakis, I.S., Marcopoulou, C., Kountourellis. J.E., Pa-
padopoulou, L.C. and Tsiftsoglou, AS. (1990) Proc. Am. Assoc. Cancer Res. 31, 35.
[lo] Vizirianakis, I.S., Wong, W. and Tsiftsoglou, A.S. (1992) Biochem. Pharmacol. 44, 927-936.
[l 11 Vizirianakis, IS. and Tsiftsoglou, AS. (1995) Biochem. Pharmacol. 50, 1807-1814.
[12] Banerjee, A.K. (1980) Microbial. Rev. 44, 175-205. [13] Choi, Y.C., Reddy, R. and Busch, H. (1982) in Biochemistry of
S-adenosyl-methionine and related compounds (Usdin, E., Bor- chardt, R.T. and Creveling, C.R., eds.), pp. 313-320, Macmillan Press. London.
[14] Kersten, H. (1984) Prog. Nucl. Acid Res. Mol. Biol. 31, 59-l 14. [15] Maden, B.E.H. (1990) Prog. Nucl. Acid Res. Mol. Biol. 39,241-303. [16] Alix, J-H. (19861 in Biological Methylation and Drug Design
(Borchardt, R.T., Creveling, CR. and Ueland, P.M., eds.). pp. 175- 187, Humana Press, Clifton, New Jersey.
[17] Rottman, F., Narayan, P., Goodwin. R., Camper, S., Yao, Y., Horowitz, S., Albers, R., Ayers, D., Maroney, P. and Nilsen, T. (1986) in Biological Methylation and Drug Design (Borchardt, R.T., Creveling, CR. and Ueland, P.M., eds.), pp. 189-200, Humana Press. Clifton, New Jersey.
[18] Munholland, J.M. and Nazar, R.N. (1987) Cancer Res. 47, 169-172. [19] Scarpa, S., Renzo, L.D. and Strom, R. (1990) in Nucleic Acid
Methylation (Clawson. G.A., Willis, D.B., Weissbach, A. and Jones, P.A., eds.), pp. 103-112, Alan R. Liss, New York.
[20] Vizirianakis, IS., Niopas, I., Marquez, V.E. and Tsiftsoglou, AS. (1992) Ann. Oncol. 3(suppl. 1). 182.
[21] Hartwick, R.A., Assenza, S.P. and Brown, P.R. (1979) J. Chro- matogr. 186, 647-658.
1221 Albers. R.J., Coffin, B. and Rottman, F.M. (1981) Anal. Biochem. 113, 118123.
1231 Gehrke, C.W., Kuo, K.C., McCune, R.A. and Gerhardt, K.O. (1982) J. Chromatogr. 230, 297-308.
1241
[251
[261
b71
t281
I291
[301
1311
1321
[331
[341
[351
1361
I371
Pappas, I.S., Niopas, I. and Tsiftsoglou A.S. (1992) Anticancer Drug Res. 7, 153-161. Orkin, S.H., Harosi, F.I. and Leder, P. (19751 Proc. Natl. Acad. Sci. USA 72, 98-102. Gusella, J., Geller, R., Clarke, B., Weeks, V. and Housman, D. (19761 Cell 9, 221-229. Maden, B.E.H.. Salim, M. and Summers, D.F. (1972) Nature New Biol. 237, 5-9. Tsiftsoglou, A.S., Wong, W., Robinson, S.H. and Hensold, J. (19891 Dev. Genet. 10, 311-317. Kingston. R.E. (1987) in Current Protocols in Molecular Biology 1987-1988 (Ausubel, F.M., Brent, R., Kingston, R.E., Moore, D.D., Smith, J.A.. Seidman, J.G. and Struhl, K., eds.), pp. 4.5.1-4.5.3, John Wiley and Sons, New York. Bock, R.M. (1967) in Methods in Enzymology (Grossman, L. and Moldave, K.. eds.1, vol. XII, Nucleic Acids, Part A, pp. 224-228, Academic Press, New York. Kredich, N.M. and Hershfield, MS. (19791 Proc. Natl. Acad. Sci. USA 76, 2450-2454. Cheng, T-C. and Kazazian, J.H.H. (1977) J. Biol. Chem. 252, 175881763. Church, G.M. and Gilbert, W. (1984) Proc. Natl. Acad. Sci. USA 81, 1991-1995. Dalla-Fevera, R., Gelman, E.P., Marinotti, S., Franchini, G., Papas, T.S., Gallo, R.C. and Wong-Staal, F. (19821 Proc. Natl. Acad. Sci. USA 79, 6497-6501. DeChiara, T.M.. Robertson, E.J. and Efstratiadis, A. (1991) Cell 64, 849-859. Yamamoto. T.. Matsui, Y., Natori. S. and Obinata, M. (1989) Gene 80, 337-343. Camper. S.A., Albers, R.J., Coward. J.K. and Rottman, F.M. (1984) Mol. Cell. Biol. 4, 538-543.
[38] Cantoni, G.L. (19861 in Biological Methylation and Drug Design (Borchardt, R.T., Creveling, C.R. and Ueland, P.M., eds.1, pp. 227-238, Humana Press, Clifton, New Jersey.
[39] Glazer, RI. and Knode, M.C. (1984) J. Biol. Chem. 259, 12964- 12969.
[40] Tseng, C.K.H., Marquez, V.E., Fuller, R.W., Goldstein, B.M., Haines, D.R., McPherson H., Parsons, J.L., Shannon, W.M., Amett, G., Hollingshead M. and Driscoll, J.S. (1989) J. Med. Chem. 32, 1442- 1446.
[41] Caboche, M. and Bachellerie. J-P. (1977) Eur. J. Biochem. 74, 19-29.
[42] Caboche, M. and Hatzfeld, J. (1978) J. Cell. Phys. 97, 361-370. [43] Keller, B.T. and Borchardt R.T. (1984) Biochem. Biophys. Res.
Comm. 120, 131-137. [44] Porter, C.W., Sufrin, J.R. and Keith, D.D. (1984) Biochem. Biophys.
Res. Comm. 122, 350-357. [45] Sufrin, J.R., Lombardini, J.B., Kramer, D.L., Alks, V., Bemacki,
R.J. and Porter, C.W. (1986) in Biological methylation and drug design (Borchardt, R.T., Creveling, CR. and Ueland, P.M., eds.). pp. 373-384, Humana Press, Clifton, New Jersey.
[46] Keller, B.T. and Borchardt, R.T. (19861 in Biological Methylation and Drug Design (Borchardt, R.T., Creveling, CR. and Ueland, P.M., eds.1, pp. 385-396, Humana Press, Clifton. New Jersey.
[47] Inaba, M., Nagashima, K., Tsukagoshi. S. and Sakurai, Y. (1986) Cancer Res. 46, 1063-1067.
[48] Wolfson. G., Chisholm, J., Tashjian, A.H., Fish, S. and Abeles, R.H. (1986) J. Biol. Chem. 261, 4492-4498.
[49] Hasobe, M., McKee, J.G. and Borchardt R.T. (1989) Antim. Agents Chem. 33, 828-834.
[50] Kramer, D.L.. Porter C.W., Borchardt R.T. and Sufrin, J.R. (1990) Cancer Res. SO, 3838-3842.
[51] Glazer, RI., Hartman, K.D., Knode, M.C., Richard, M.M., Chiang, P.K., Tseng, C.K.H. and Marquez, V.E. (1986) Biochem. Biophys. Res. Comm. 135. 688-694.
[52] Coppola. J.A. and Cole, M.D. (1986) Nature 320, 760-763.
20 I.S. Vizirianakis. A.S. Tsiftsoglou/Biochimica et Biophysics Acta 1312 (19Y61 8-20
1531 Cheng, G. and Skoultchi, AI. (1989) Mol. Cell. Biol. 9, 2332-2340. 1541 Housman, D., Volloch, V., Tsiftsoglou, AS., Levenson, R., Gusella,
J.F., Kernen, J. and Mitrani, A. (1979) in In viva and in vitro Erythropoiesis: The Friend Cell System, (Rossi, G.B.. ed.), pp. 273-282, Elsevier/North-Holland Biomedical Press, Amsterdam.
[55] Hentze, M.W., Caughman, SW., Rouault, T.A., Barriocanal, J.G., Dancis, A., Harford, J.B. and Klausner, R.D. (19871 Science 238, 1570-1573.
[56] Miillner, E.W. and Kuhn, L.C. (1988) Cell 53, 815-825. [57] Haile, D.J., Hentze, M.W., Rouault, T.A., Harford, J.B. and Klaua-
ner, R.D. (19891 Mol. Cell. Biol. 9, 5055-5061. [58] Miillner, E.W., Neupert, B. and Kuhn, L.C. (1989) Cell 58. 373-382. [59] Peltz, S.W., Brewer, G., Bernstein, P., Hart, A. and Ross, J. (19911
Critical Reviews in Eukayotic Gene Expression I, 99-126. [60] Tahara, SM., Darzynkiewicz, E., Stepinski, J., Ekiel, I., Jin, Y.,
Hahn, C., Strauss, J.H., Sijuwade, T. and Haber, D. (1990) in Nucleic Acid Methylation (Clawson, G.A., Willis, D.B., Weissbach, A. and Jones, P.A., eds.1, pp. 67-82, Alan R. Liss, New York.
[61] Belasco, J. and Brawerman, G. (eds.), (1993) in Control of messen- ger RNA stability, Academic Press, Inc., San Diego.
[62] Burd C.G. and Dreyfuss, G. (1994) Science 265, 615-621. [63] Volloch, V., Schweitzer, B. and Rits, S. (1987) Exp. Cell Res. 173,
38-48. [64] Tsiftsoglou, A.S., Christou, I.E. and Vizirianakis, I.S. (1992) Proc.
Am. Assoc. Cancer Res. 33, 48. [65] Christou, I.E. and Tsiftsoglou, A.S. (19921 Biomed. Pharmacother.
46, 300.
[66] Creusot, F., Acs, G. and Cristman, J.K. (1982) J. Biol. Chem. 257, 2041-2048.
1671 Shen C-K. J. and Maniatis, T. (1980) Proc. Natl. Acad. Sci. USA 77, 6634-6638.
[68] Busslinger, M., Hurst J. and Flavell, R.A. (1983) Cell 34, 197-206. 1691 Ley, T.J., Chiang, Y.L., Haidaris, D., Anagnou, N.P., Wilson, V.L.
and Anderson, F. (1984) Proc. Natl. Acad. Sci. USA 8 1, 6618-6622. 1701 Sherman, M.L., Shafman, T.D., Spriggs,. R. and Kufe, D.W. (1985)
Cancer Res. 45, 5830-5834. [71] Fiore, P.P.D., Grieco, M., Pinto, A., Attadia, V., Porcelli, M.,
Cacciapuoti. G. and Carteni-Farina, M. (1984) Cancer Res. 44, 4096-4 103.
[72] Shafman, T.D., Sherman, M.L. and Kufe, D.W. (1984) Biochem. Biophys. Res. Commun. 124, 172-177.
[73] Chiang, P.K. and Miura, G.A. (1986) in Biological methylation and drug design (Borchardt, R.T., Creveling, CR. and Ueland, P.M., eds.1, pp. 239-25 1, Humana Press, Clifton, New Jersey.
[74] Garrett, C. and Kredich, N.M. (1981) J. Biol. Chem. 256, 12705- 12709.
[75] Borchardt, R.T.. Huber, J.A. and Wu, Y.S. (1976) J. Org. Chem. 41, 565-567.
[76] Montgomery, J.A., Clayton, S.J., Thomas, H.J., Shannon, W.M., Amett, G., Bodner, A.J., Kion, I.K., Cantoni, G.L. and Chiang, P.K. (19821 J. Med. Chem. 25, 626-629.