induction of renal and intestinal gluconeogenesis …...control of blood glucose in the absence of...
TRANSCRIPT
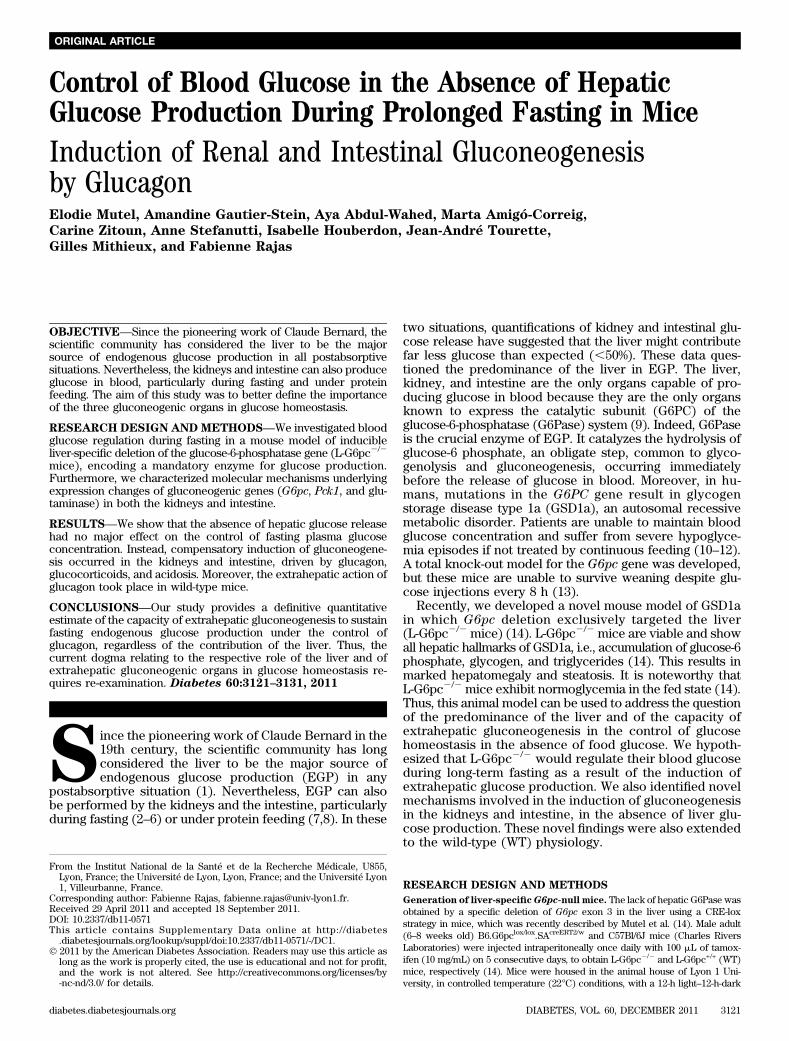
Control of Blood Glucose in the Absence of HepaticGlucose Production During Prolonged Fasting in MiceInduction of Renal and Intestinal Gluconeogenesisby GlucagonElodie Mutel, Amandine Gautier-Stein, Aya Abdul-Wahed, Marta Amigó-Correig,
Carine Zitoun, Anne Stefanutti, Isabelle Houberdon, Jean-André Tourette,
Gilles Mithieux, and Fabienne Rajas
OBJECTIVE—Since the pioneering work of Claude Bernard, thescientific community has considered the liver to be the majorsource of endogenous glucose production in all postabsorptivesituations. Nevertheless, the kidneys and intestine can also produceglucose in blood, particularly during fasting and under proteinfeeding. The aim of this study was to better define the importanceof the three gluconeogenic organs in glucose homeostasis.
RESEARCH DESIGN ANDMETHODS—We investigated bloodglucose regulation during fasting in a mouse model of inducibleliver-specific deletion of the glucose-6-phosphatase gene (L-G6pc2/2
mice), encoding a mandatory enzyme for glucose production.Furthermore, we characterized molecular mechanisms underlyingexpression changes of gluconeogenic genes (G6pc, Pck1, and glu-taminase) in both the kidneys and intestine.
RESULTS—We show that the absence of hepatic glucose releasehad no major effect on the control of fasting plasma glucoseconcentration. Instead, compensatory induction of gluconeogene-sis occurred in the kidneys and intestine, driven by glucagon,glucocorticoids, and acidosis. Moreover, the extrahepatic action ofglucagon took place in wild-type mice.
CONCLUSIONS—Our study provides a definitive quantitativeestimate of the capacity of extrahepatic gluconeogenesis to sustainfasting endogenous glucose production under the control ofglucagon, regardless of the contribution of the liver. Thus, thecurrent dogma relating to the respective role of the liver and ofextrahepatic gluconeogenic organs in glucose homeostasis re-quires re-examination. Diabetes 60:3121–3131, 2011
Since the pioneering work of Claude Bernard in the19th century, the scientific community has longconsidered the liver to be the major source ofendogenous glucose production (EGP) in any
postabsorptive situation (1). Nevertheless, EGP can alsobe performed by the kidneys and the intestine, particularlyduring fasting (2–6) or under protein feeding (7,8). In these
two situations, quantifications of kidney and intestinal glu-cose release have suggested that the liver might contributefar less glucose than expected (,50%). These data ques-tioned the predominance of the liver in EGP. The liver,kidney, and intestine are the only organs capable of pro-ducing glucose in blood because they are the only organsknown to express the catalytic subunit (G6PC) of theglucose-6-phosphatase (G6Pase) system (9). Indeed, G6Paseis the crucial enzyme of EGP. It catalyzes the hydrolysis ofglucose-6 phosphate, an obligate step, common to glyco-genolysis and gluconeogenesis, occurring immediatelybefore the release of glucose in blood. Moreover, in hu-mans, mutations in the G6PC gene result in glycogenstorage disease type 1a (GSD1a), an autosomal recessivemetabolic disorder. Patients are unable to maintain bloodglucose concentration and suffer from severe hypoglyce-mia episodes if not treated by continuous feeding (10–12).A total knock-out model for the G6pc gene was developed,but these mice are unable to survive weaning despite glu-cose injections every 8 h (13).
Recently, we developed a novel mouse model of GSD1ain which G6pc deletion exclusively targeted the liver(L-G6pc2/2 mice) (14). L-G6pc2/2 mice are viable and showall hepatic hallmarks of GSD1a, i.e., accumulation of glucose-6phosphate, glycogen, and triglycerides (14). This results inmarked hepatomegaly and steatosis. It is noteworthy thatL-G6pc2/2 mice exhibit normoglycemia in the fed state (14).Thus, this animal model can be used to address the questionof the predominance of the liver and of the capacity ofextrahepatic gluconeogenesis in the control of glucosehomeostasis in the absence of food glucose. We hypoth-esized that L-G6pc2/2 would regulate their blood glucoseduring long-term fasting as a result of the induction ofextrahepatic glucose production. We also identified novelmechanisms involved in the induction of gluconeogenesisin the kidneys and intestine, in the absence of liver glu-cose production. These novel findings were also extendedto the wild-type (WT) physiology.
RESEARCH DESIGN AND METHODS
Generation of liver-specificG6pc-null mice. The lack of hepatic G6Pase wasobtained by a specific deletion of G6pc exon 3 in the liver using a CRE-loxstrategy in mice, which was recently described by Mutel et al. (14). Male adult(6–8 weeks old) B6.G6pclox/lox.SAcreERT2/w and C57Bl/6J mice (Charles RiversLaboratories) were injected intraperitoneally once daily with 100 mL of tamox-ifen (10 mg/mL) on 5 consecutive days, to obtain L-G6pc2/2 and L-G6pc+/+ (WT)mice, respectively (14). Mice were housed in the animal house of Lyon 1 Uni-versity, in controlled temperature (22°C) conditions, with a 12-h light–12-h-dark
From the Institut National de la Santé et de la Recherche Médicale, U855,Lyon, France; the Université de Lyon, Lyon, France; and the Université Lyon1, Villeurbanne, France.
Corresponding author: Fabienne Rajas, [email protected] 29 April 2011 and accepted 18 September 2011.DOI: 10.2337/db11-0571This article contains Supplementary Data online at http://diabetes
.diabetesjournals.org/lookup/suppl/doi:10.2337/db11-0571/-/DC1.� 2011 by the American Diabetes Association. Readers may use this article as
long as the work is properly cited, the use is educational and not for profit,and the work is not altered. See http://creativecommons.org/licenses/by-nc-nd/3.0/ for details.
diabetes.diabetesjournals.org DIABETES, VOL. 60, DECEMBER 2011 3121
ORIGINAL ARTICLE

cycle. Mice had free access to water and standard chow (unless fasted). Micewere studied 5 weeks after tamoxifen treatment. The specific hepatic deletion ofG6pc exon 3 in the L-G6pc2/2 mice was always verified by PCR on purified livergenomic DNA after euthanasia, as described by Mutel et al. (14). All procedureswere performed in accordance with the guidelines established by the EuropeanConvention for the Protection of Laboratory Animals. The animal care com-mittee of the University approved all experiments.Metabolic studies. Blood was withdrawn from the retro-orbital vein forplasma metabolite determinations. Glucose, triglyceride, and total cholesterolconcentrations were determined with Biomérieux colorimetric kits. Free fattyacid and glycerol concentrations were determined with a Diasys colorimetrickit. Insulin, glucagon, and corticosterone concentrations were determinedwith mouse ELISA kits from Chrystal Chem, Biovendor, and Neogen, respec-tively. Catecholamines and amino acids levels were determined by high-performance liquid chromatography (Centre Hospitalier Universitaire, Lyon).b-Hydroxybutyrate was measured using Optium b2ketone test strips withOptium Xceed sensors (Abbott Diabetes Care, U.K.). Blood glucose wasdetermined with an Accu-Chek Go glucometer (Roche Diagnostics) duringfasting experiments. Hepatic glycogen determinations were carried out asdescribed by Keppler and Decker (15).In vivo analyses. EGP was determined in conscious, unrestrained, cathe-terized mice. A catheter was inserted into the right jugular vein under anes-thesia, and mice were allowed to recover for 4–6 days. After 6 h or 24 h offasting, mice were infused with a bolus (92.5 kBq) of [3-3H] glucose. We thenadministered [3-3H] glucose at a rate of 6.3 kBq/min. Blood glucose wasmonitored every 15 min. In preliminary experiments, we checked that a steadystate of plasma [3-3H] glucose-specific activity reached from 30 min of infusion(data not shown). Plasma glucose concentration did not vary during the in-fusion time. At a steady state of glycemia and [3-3H] glucose-specific activity(between 60 to 90 min), blood was collected to determine glucose specificactivity and glucose concentration (16). EGP was calculated as Ra using thesimplified equation of Steele, by dividing the [3-3H] glucose infusion rate by the[3-3H] glucose-specific activity (16).
L-Alanine and L-glutamine tolerance tests were performed after 6 h or 24 hof fasting. Mice were injected intraperitoneally with L-alanine or L-glutamine(2 g/kg BW). Blood glucose levels were determined from the tail vein at 0, 15,30, 45, 60, and 120 min after injection.
For glucagon challenge, WT mice were injected intraperitoneally with 0.9%NaCl or glucagon (Glucagen, Novo Nordisk) at a dose of 200 ng/g of weight.Mice were killed by cervical dislocation after 30 min. Kidneys and intestinewere rapidly removed and fixed in formaldehyde for chromatin immunopre-cipitation (ChIP) experiments, as described previously (17).
For GcgR antagonist experiments, L-G6pc2/2 mice were dosed by gavagewith 50 mg/kg of GcgR antagonist L168,049 (Glucagon receptor antagonist II,Calbiochem) in 5% PEG-400/5% Tween-80/90% H2O or vehicle, as describedpreviously (18). Immediately after gavage, mice were fasted and killed 6 hlater.Gene expression analysis.Mice were killed by cervical dislocation. The liverand kidneys were rapidly removed, with tongs chilled previously in liquid N2,and frozen. The intestine (proximal jejunum) was rinsed and immediatelyfrozen in liquid N2. G6Pase and PEPCK-c activities were assayed at maximalvelocity, as described previously (19). Immunoblotting was carried out usingpurified anti-rat G6PC (20), anti-PEPCK (Santa Cruz Biotechnology), andantiglutaminase (kindly provided by Dr. N. Curthoys) antibodies. Membraneswere reprobed with anti-b-actin monoclonal antibody for standardization.Total RNAs were isolated from tissues with TRIzol reagent. Reverse tran-scription and real-time PCR were performed using sequence-specific primers(Supplementary Table 1), with ribosomal protein mL19 transcript (Rpl19) asa reference.ChIP assays. Nuclear isolation and ChIP assays were performed as described(17). Chromatin obtained was then sheared with the Enzymatic shearing kit(Active Motif), yielding chromatin fragments of 500–200 bp in size. Each im-munoprecipitation was performed with about 10 mg of chromatin using theChIP-It Express kit (Active Motif). Chromatin complexes were immunopre-cipitated for 16–18 h at 4°C while rotating with either phospho-CREB (pS133)antibody (Epitomics), glucocorticoid receptor antibody (sc-1004; Santa CruzBiotechnology), or GFP antibody (Santa Cruz) as a negative control. AfterDNA purification, quantitative PCR amplification was performed using primers
FIG. 1. Hepatic glucose production is not crucial for the control offasting glycemia. G6Pase activities (A) and glycogen content (B) wereassayed in the liver of L-G6pc
2/2(black bar) and WT (white bar) mice
in the fed state (0 h) or in fasted states (6 h, 24 h, and 40 h; n = 5 to 6mice per group). C: Blood glucose concentrations were determined af-terward for 0, 6, 16, 24, 30, 40, and 45 h fasting in L-g6pc
2/2and WT
mice. D: EGP was determined in conscious L-G6pc2/2
(black bar) andWT (white bar) mice fasted for 6 h or 24 h (n = 6 mice per group). Mice
had free access to water during fasting. Data were obtained 5 weeksafter gene deletion and are expressed as means 6 SEM. Values signif-icantly different from WT (**P < 0.01). ††, significantly different withrespect to the value in fed state in each group (P < 0.01). F and FF,significantly different with respect to the value at 6 h of fasting in eachgroup (P < 0.05 and P < 0.01, respectively).
GLUCOSE HOMEOSTASIS IN ABSENCE OF LIVER G6PASE
3122 DIABETES, VOL. 60, DECEMBER 2011 diabetes.diabetesjournals.org

specific for the cAMP or glucocorticoid response units of Pck1 and G6pcpromoters (Supplementary Table 1).Statistical analyses. Results are reported as means 6 SEM. The variousgroups were compared by Mann-Whitney tests. Differences were consideredstatistically significant at P , 0.05.
RESULTS AND DISCUSSION
Control of blood glucose in L-G6pc2/2
mice duringfasting. G6Pase activity was disrupted specifically in theliver by temporal and tissue-specific deletion of the G6pcgene based on a CRE-lox strategy (14). In brief, trans-genic B6.G6pclox/lox mice were crossed with transgenicB6.SAcreERT2/w mice (21) to generate B6.G6pclox/lox.SAcreERT2/w
mice, expressing inducible CREERT2 specifically in theliver. The treatment of adult B6.G6pclox/lox.SAcreERT2/w
mice with tamoxifen induced the excision of G6pc exon 3,specifically in the liver (14), leading to a complete lack ofhepatic G6Pase activity (Fig. 1A). This finding is consistentwith these mice being unable to mobilize their glycogenstocks during fasting (Fig. 1C), leading to a hepatomegaly(Table 1). In WT mice, indeed, glycogen stock was about40% of the fed level at 6 h of fasting and was completelyexhausted after 12 h of fasting (0.6 mg/g of liver, n = 4).Although mice with the total knock-out of G6pc die afterweaning, these L-G6pc2/2 mice are viable. Moreover, allL-G6pc2/2 mice survived prolonged fasting (45 h), althoughhepatic G6Pase activity was still undetectable throughout thefasting period (Fig. 1A). Because hepatic glucose productionis thought to be critical for glucose homeostasis during fastingperiods, plasma glucose concentration and EGP were de-termined in L-G6pc2/2 and WT mice during prolonged fast-ing. L-G6pc2/2 mice displayed the same blood glucose levelas control mice in the fed state (Fig. 1C). Consistent with therole of hepatic glycogenolysis as an important pathway ofglucose production in the early postabsorptive state, EGPlevels were found to be lower in 6 h–fasted L-G6pc2/2
animals than in control animals (Fig. 1D). This was correlatedwith a lower blood glucose in 6 h–fasted L-G6pc2/2 mice(Fig. 1C).
Concomitant with this drop in blood glucose observed at6 h fasting, ketogenesis was rapidly induced in L-G6pc2/2
animals. At 6 h fasting, the amounts of ketone bodies(b-hydroxybutyrate) in L-G6pc2/2 mice were fivefoldgreater compared with the control mice that were able toproduce high levels of glucose by inducing glycogenolysis(Supplementary Fig. 1A). These results were accountedfor by fast induction of the mitochondrial 3-hydroxy-3-methylglutaryl-CoA synthase (Hmgcs2) expression in 6 h–fasted L-G6pc2/2 mice (Supplementary Fig. 1B). It isimportant to recall here that ketone bodies provide analternative form of cellular energy fuel in postabsorptivesituations characterized by low glucose availability. Thisis true notably for the brain, which may derive up to 70%of its energy from ketone bodies (6), and for the kidneyand intestine, the two alternative gluconeogenic organs,which derive 50% of their energy from ketone bodies inpostabsorptive state (22,23). It therefore seems unlikelythat L-G6pc2/2 mice lacked energy fuels for these essentialorgans.
It is noteworthy that differences in EGP betweenL-G6pc2/2 and control animals were no longer observedafter longer fasting periods, and that L-G6pc2/2 micecontrolled blood glucose effectively during long fastingperiods (Fig. 1D). We even observed a significant increasein blood glucose between 6 h and 16 h fasting, such that theblood glucose concentration of L-G6pc2/2 mice eventually
reached that of control mice after 30 h fasting (Fig. 1C). Bycontrast, blood glucose concentration decreased steadilyduring fasting in control mice, eventually reaching a plateauat 100 mg/dL after 24 h of fasting (Fig. 1C).Induction of extrahepatic gluconeogenesis in L-G6pc
2/2
mice. It was hypothesized that L-G6pc2/2 mice maintainedtheir glycemia through rapid induction of extrahepatic glu-coneogenesis, compensating for lack of glucose productionby the liver. It is noteworthy that blood glucose was the samein L-G6pc2/2 and control mice in the fed state, althoughglucose injection was necessary in the total G6pc knockoutmice to maintain blood glucose (24). To explain this differ-ence, we assessed the expression of gluconeogenic genes inthe kidneys and intestine of fed animals. Renal G6pc mRNAlevels of fed L-G6pc2/2 mice were about 1.7-fold higher thanthose in control mice (Fig. 2A). This was associated withan increase in renal G6PC protein (Fig. 2B). Finally,specific G6Pase activity in the kidney was 40% higher inL-G6pc2/2 than in control mice (Fig. 2C). On the con-trary, renal Pck1 expression and PEPCK activity were notmodified (Fig. 2A–C). In the fed state, no modification ofG6PC and PEPCK-c expression was observed in the intestineof L-G6pc2/2 compared with control mice (Fig. 2D–F). Thus,only G6Pase was upregulated in the kidneys of L-G6pc2/2
mice in the fed state, reflecting constitutive induction ofthe gluconeogenic pathway in the kidneys of L-G6pc2/2
compared with WT mice.After 6 h fasting, the expression of the genes encoding
major regulatory enzymes of extrahepatic gluconeogenesis[G6Pase, PEPCK-c, and glutaminase] was dramatically in-duced in both the kidneys and intestine of L-G6pc2/2 mice.In the kidneys, amounts of G6pc mRNA and protein wereabout twice those in the control (Fig. 3A and B), and spe-cific G6Pase activity was 36% higher than in control mice(Fig. 3C). Renal PEPCK-c expression was increased con-comitantly, resulting in a threefold increase of Pck1 mRNAand protein and specific PEPCK-c activity more than twicethat of L-G6pc2/2 mice (Fig. 3A–C). There was also an in-duction of glutaminase in the kidneys of L-G6pc2/2 mice(Fig. 3B). A similar pattern of induction of gluconeogenic
TABLE 1Body and liver weights and plasmatic parameters of 6 h–fastedL-g6pc2/2 mice
L-g6pc2/2 L-g6pc+/+
Mice per group 6 6Body wt (g) 27.8 6 0.8 26.5 6 0.8Liver wt (g) 1.8 6 0.04** 1.1 6 0.1Glucose (mmol/L) 3.4 6 0.2** 7.2 6 0.3Insulin (ng/mL) 0.35 6 0.02** 0.67 6 0.07Glucagon (pg/mL) 552 6 50** 302 6 28Corticosterone (ng/mL) 191 6 19** 71.0 6 9.7Norepinephrine (ng/mL) 0.43 6 0.06 0.43 6 0.03Epinephrine (ng/mL) 0.36 6 0.10 0.36 6 0.04Total cholesterol(g/L) 1.33 6 0.09** 0.89 6 0.04Triglycerides (g/L) 1.42 6 0.1** 0.78 6 0.03Free fatty acids (mmol/L) 1.07 6 0.09** 0.69 6 0.06Glycerol (mg/dL) 4.3 6 0.2 4.2 6 0.3Lactate (mmol/L) 5.5 6 0.5** 3.5 6 0.3Alanine (mmol/L) 336 6 34** 224 6 18Glutamine (mmol/L) 538 6 16* 618 6 26
Values are expressed as means 6 SEM. Data were determined 5weeks after gene invalidation from L-g6pc2/2 and WT L-g6pc+/+ miceupon 6 h of fasting. Values significantly different from WT (*P , 0.05and **P , 0.01) are indicated (Mann-Whitney test).
E. MUTEL AND ASSOCIATES
diabetes.diabetesjournals.org DIABETES, VOL. 60, DECEMBER 2011 3123

FIG. 2. Expression of main gluconeogenic enzymes in the kidneys (A–C) and the intestine (D–F) of fed L-G6pc2/2
mice. A and D: Level of G6pc andPck1 mRNA expressed as a ratio relative to the Rpl19 mRNA level. B and E: Western blot and quantification analysis for G6PC and PEPCK-Cproteins. Actin is shown as a loading control. C and F: Specific G6Pase and PEPCK-c activity of homozygous L-G6pc
2/2(black bar) and WT
(white bar) mice. Data were obtained 5 weeks after gene deletion in fed mice (n = 6 mice per group) and are expressed as the mean 6 SEM. Valuessignificantly different from WT (*P < 0.05, **P < 0.01) are indicated. AU, arbitrary units.
GLUCOSE HOMEOSTASIS IN ABSENCE OF LIVER G6PASE
3124 DIABETES, VOL. 60, DECEMBER 2011 diabetes.diabetesjournals.org

FIG. 3. Expression of main gluconeogenic enzymes in the kidneys (A–C) and the intestine (D–F) of 6 h–fasted L-G6pc2/2
mice. A and D: Level ofG6pc and Pck1 mRNA expressed as a ratio relative to Rpl19 mRNA level. B and E: Western blot analysis and quantification for G6PC, PEPCK-C,and glutaminase proteins. Actin is shown as a loading control. Results are expressed as fold induction versus WT. C and D: Specific G6Pase andPEPCK-c activity of homozygous L-G6pc
2/2(black bar) and WT (white bar) mice. Data were obtained 5 weeks after gene deletion, in mice fasted
for 6 h (n = 6 mice per group), and are expressed as means 6 SEM. Values significantly different from WT (*P < 0.05, **P < 0.01) are indicated.
E. MUTEL AND ASSOCIATES
diabetes.diabetesjournals.org DIABETES, VOL. 60, DECEMBER 2011 3125

gene expression was observed for the three enzymes in theintestine of L-G6pc2/2 mice (Fig. 3D–F). Thus, the expres-sion of gluconeogenic genes was rapidly induced in boththe kidneys and intestine of L-G6pc2/2 mice in post-absorptive state.
These results strongly suggested that the L-G6pc2/2
mouse rapidly upregulated gluconeogenesis in the kidneysand intestine once food glucose was lacking. It is notewor-thy that there is clear-cut organ substrate selectivity for theliver, kidney, and intestine gluconeogenesis (9). Whereasgluconeogenesis from glutamine only takes place in thekidneys and intestine, gluconeogenesis from alanine andlactate is the key pathway in the liver (4,9,25). To sub-stantiate the view that postabsorptive or fasting L-G6pc2/2
mice were able to regulate plasma glucose from extrahe-patic gluconeogenesis in the absence of hepatic gluconeo-genesis, we performed tolerance tests from alanine(exclusive hepatic substrate) and glutamine (exclusive ex-trahepatic substrate). After 6 h of fasting, there was amarked increase in plasma glucose upon glutamine injectionin L-G6pc2/2 mice, whereas only a marginal increase wasobserved in WT mice (Fig. 4A). On the contrary, L-G6pc2/2
mice were unable to increase their plasma glucose in re-sponse to alanine injection (Fig. 4B). Surprisingly, there wasno increase in plasma glucose in WT mice injected withalanine; this might be a result of the preponderant role ofhepatic glycogenolysis in EGP and the nonactivation ofgluconeogenesis at 6 h fasting in normal mice (see Fig. 1). Inagreement with this rationale, WT mice dramatically in-creased plasma glucose in response to alanine injection af-ter 24 h of fasting, a time where glycogen stores wereexhausted and liver gluconeogenesis was enhanced (Fig. 1Aand B and Fig. 4C). On the contrary, L-G6pc2/2 mice werestill unable to convert the injection of alanine in increasedplasma glucose (Fig. 4C). Also in line with the absence ofliver gluconeogenesis in L-G6pc2/2 mice, plasma alanineand lactate concentrations were 50–60% higher than in WTmice (Table 1). On the other hand, the plasma concentrationof glutamine was slightly lower in L-G6pc2/2 mice than inWT mice, which was consistent with an increased utilizationof glutamine (Table 1). Taken together, these data stronglysuggested that L-G6pc2/2 mice regulated plasma glucosefrom extrahepatic gluconeogenesis exclusively.Role of glucagon in physiological adaptation ofthe L-G6pc
2/2mouse to fasting. We then investigated
the mechanisms underlying expression changes of gluco-neogenic genes in both the kidneys and intestine in theabsence of G6pc in the liver.
First, we analyzed the hormonal status of L-G6pc2/2 micein both fed and 6 h fasting states. In mammals, sophisticatedhormonal control by insulin, glucagon, glucocorticoids, andcathecholamines maintains blood glucose within narrowlimits, orchestrating the uptake and production of glucose.In both the fed state and after 6 h fasting, glucagon levelswere higher in L-G6pc2/2 mice than in control mice (Fig. 5A).On the contrary, L-G6pc2/2 mice exhibited a lower insulinlevel than that of control mice after 6 h fasting (Fig. 5B),but were not hypoinsulinemic in fed state (Fig. 5B). Thisresulted in a twofold (fed state) to threefold (6 h fastedstate) increase in the glucagon-to-insulin ratio in L-G6pc2/2
mice in comparison with that of the control mice (Fig. 5C).Moreover, corticosterone levels were markedly increased inL-G6pc2/2 mice compared with the control mice after 6 hfasting (Table 1), but not in the fed state (63.0 6 10.8 ng/mLin L-G6pc2/2 mice vs. 65.0 6 14.0 ng/mL in WT mice).However, the epinephrine and norepinephrine plasma
FIG. 4. Glutamine and alanine tolerance tests in L-G6pc2/2
and WT mice .After 6 h (A and B) or 24 h (C) of fasting, L-G6pc
2/2(black circles) and
WT (open squares) mice were injected with glutamine (A) or alanine (Band C). Blood glucose levels were measured every 15 min for 2 h. Datawere obtained 5 weeks after tamoxifen treatment. Percent values relativeto time 0 were expressed as means 6 SEM (n = 6 mice/group). Valuessignificantly different from WT (*P < 0.01); †significantly different withrespect to the value before alanine or glutamine injection (P < 0.01).
GLUCOSE HOMEOSTASIS IN ABSENCE OF LIVER G6PASE
3126 DIABETES, VOL. 60, DECEMBER 2011 diabetes.diabetesjournals.org

FIG. 5. Glucagon regulates gluconeogenic gene expression in the kidneys and intestine of L-G6pc2/2
mice. Plasma glucagon (A), plasma insulin (B),and glucagon-to-insulin ratio (C) of fed or 6 h–fasted L-G6pc
2/2(black bars) and control (white bars) mice are shown. D: RT-PCR analysis of the
expression of glucagon receptor in the liver, kidney, and intestine of control mice fasted for 6 h. E-G: P-CREB binding to the G6pc or Pck1 promoterwas analyzed by ChiP assay from kidneys or intestine of fed mice (E) or 6 h–fasted mice (F and G). H: Level of Pck1 mRNA expressed as a ratiorelative to Rpl19 mRNA level in the liver of L-G6pc
2/2mice treated or not with GcgR antagonist L-168,049 (black bars) and WT mice (white bars)
fasted for 6 h. I and J: Level of G6pc mRNA expressed as a ratio relative to Rpl19 mRNA level in the kidneys (I) and intestine (J) of L-G6pc2/2
micetreated or not with GcgR antagonist L-168,049 (black bars) and WT mice (white bars) fasted for 6 h. Data were obtained 5 weeks after gene deletion(n = 6 mice per group) and are expressed as means 6 SEM. Values significantly different from WT (*P < 0.05, **P < 0.01) and untreated L-G6pc
2/2
mice ($P < 0.05, $$P < 0.01) are indicated. †, significantly different fed state (P < 0.01).
E. MUTEL AND ASSOCIATES
diabetes.diabetesjournals.org DIABETES, VOL. 60, DECEMBER 2011 3127

concentrations were similar in both L-G6pc2/2 and controlmice (Table 1). This is in agreement with the observationthat a hypoglycemic state around 60 mg/dL is mild anddoes not represent a stressed condition from the metabolicviewpoint, especially in the light of the concomitant in-creased availability of ketone bodies (see above).
In the light of these findings, glucagon could be a majorcandidate responsible for the induced expression of gluco-neogenic genes in the kidneys and intestine of L-G6pc2/2
mice. Glucagon receptors (GcgR) are known to be presentin the liver, but GcgR are also expressed in the kidneys,notably in the proximal tubules and, to a lesser extent, in theintestine (26–28). We confirmed these data in L-G6pc2/2
mice where GcgR mRNA was substantially expressed in thekidneys (10 times less than in the liver, however) and moreweakly in the intestine (about 500 times less than in theliver) of both control and L-G6pc2/2 mice (Fig. 5D). To date,the specific role of GcgR in these organs is still unexplained.However, two previous articles suggested a possible role ofglucagon in the kidney cortex and intestine: 1) glucagonstimulated cAMP production in a kidney cortical cell line(29) and 2) glucagon infusion caused a net release of glu-cose into portal blood in dog (30). The GcgR is coupled toGas proteins, stimulating adenylate cyclase and increasingintracellular cAMP levels (26). This activates protein kinaseA (PKA), which phosphorylates cAMP-response elementbinding protein (CREB). The phosphorylated form of CREB(P-CREB) induces the transcription of G6pc in the kidneysand intestine, via binding to the gene promoter (17). Wethen examined whether P-CREB could bind to the G6pc andPck1 promoters by performing a ChIP assay. On the fedstate, P-CREB was bound to the G6pc promoter in thekidneys of the fed L-G6pc2/2 mice, but not to that of the WTmice (Fig. 5E). P-CREB was bound neither to the G6pcpromoter nor to the Pck1 promoter in the intestine of fedL-G6pc2/2 or WTmice (not shown). After 6 h fasting, P-CREBwas bound to the renal G6pc promoter, but still not to thePck1 promoter of L-G6pc2/2 mice (Fig. 5F). It is noteworthythat in the intestine of 6 h–fasted L-G6pc2/2 mice, P-CREBwas bound to both G6pc and Pck1 promoters (Fig. 5G). Todemonstrate unequivocally that the binding of P-CREB onG6pc promoter in the intestine and kidney of L-G6pc2/2 micewas dependent on the increase of plasmatic glucagon, weadministered orally a glucagon receptor antagonist toL-G6pc2/2 mice (L-168,049, 50 mg/kg body) (18). L-168,049inhibits the fixation of glucagon on GcgR and glucagon-stimulated cAMP synthesis in CHO cells expressing humanGcgR (31). In the liver of L-G6pc2/2 mice, Pck1 mRNA ex-pression was decreased by half 6 h after the administration ofGcgR antagonist (Fig. 5H), demonstrating the efficiency of thesuppression of glucagon signaling. In agreement with the roleof glucagon in the induction of extrahepatic gluconeogenesis,the administration of the antagonist prevented the increase ofthe G6pc expression in both the kidneys and intestine of 6 h–fasted L-G6pc2/2 mice (Fig. 5I and J). These results stronglysuggested that the increase of glucagon levels could accountfor the induction of G6pc expression in the kidneys and in-testine of L-G6pc2/2 mice.
An intriguing observation, however, is that the G6pc genewas induced in the kidneys but not in the intestine in fedL-G6pc2/2 mice (Figs. 2 and 5). This might be dependent ondifferential sensitivity to glucagon in both organs, possiblyrelated to the higher expression level of GcgR in the kidneys(see above). Although this reasoning may appear specula-tive, this phenomenon might to some extent be related tothe fact that the kidney rapidly become predominant in
participating in EGP during fasting (8), whereas the par-ticipation of the intestine is weaker and is induced later inthe same situation (5). In agreement with this rationale, thebinding of P-CREB to the renal G6pc promoter occurredfrom 6 h of fasting in WT mice (Fig. 5F). To increment ourfindings and confirm that the extrahepatic glucagon effectsobserved herein were not an adaptation specific toL-G6pc2/2 mice but could also take place in WT, we car-ried out a glucagon challenge in fed WT mice. After 30 minof glucagon administration, the plasma glucagon rose tothe level of 6 h–fasted L-G6pc2/2 mice (Figs. 5A and 6A).Consistent with the results obtained in L-G6pc2/2 mice,P-CREB was firmly bound to the G6pc promoter in bothtissues (Fig. 6B). Moreover, in response to glucagon in-jection, P-CREB bound to the Pck1 promoter only in theintestine (Fig. 6B), as already noted in L-G6pc2/2 mice(Fig. 5). In conclusion, these results show definitively forthe first time that G6pc gene expression is regulated byglucagon not only in the liver, but also in the kidneys andintestine, under physiological conditions. Moreover, glu-cagon can also regulate Pck1 in the intestine, but not in thekidneys. It must be noted that the increased concentrationof corticosterone might also play a role in the induction of
FIG. 6. Glucagon induces P-CREB binding to G6pc and Pck1 promotersin WT mice. A: Plasma glucagon of WT mice injected with saline solution(white bar) or glucagon (black bar). Values significantly different fromsaline solution (*P< 0.05) are indicated. B: P-CREB binding to G6pc orPck1 promoter was analyzed by ChIP assay from the kidneys and in-testine, 30 min after the injection of saline solution or glucagon in WTmice.
GLUCOSE HOMEOSTASIS IN ABSENCE OF LIVER G6PASE
3128 DIABETES, VOL. 60, DECEMBER 2011 diabetes.diabetesjournals.org
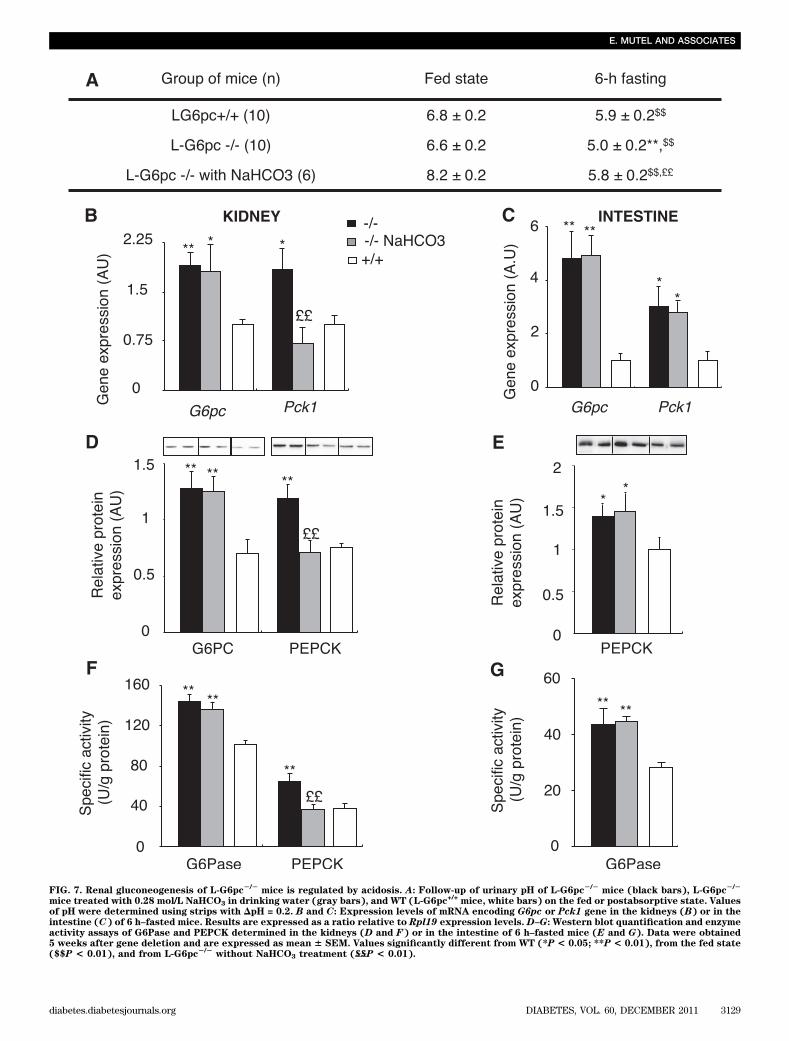
FIG. 7. Renal gluconeogenesis of L-G6pc2/2
mice is regulated by acidosis. A: Follow-up of urinary pH of L-G6pc2/2
mice (black bars), L-G6pc2/2
mice treated with 0.28 mol/L NaHCO3 in drinking water (gray bars), and WT (L-G6pc+/+
mice, white bars) on the fed or postabsorptive state. Valuesof pH were determined using strips with DpH = 0.2. B and C: Expression levels of mRNA encoding G6pc or Pck1 gene in the kidneys (B) or in theintestine (C) of 6 h–fasted mice. Results are expressed as a ratio relative to Rpl19 expression levels. D–G: Western blot quantification and enzymeactivity assays of G6Pase and PEPCK determined in the kidneys (D and F) or in the intestine of 6 h–fasted mice (E and G). Data were obtained5 weeks after gene deletion and are expressed as mean 6 SEM. Values significantly different from WT (*P < 0.05; **P < 0.01), from the fed state($$P < 0.01), and from L-G6pc
2/2without NaHCO3 treatment (££P < 0.01).
E. MUTEL AND ASSOCIATES
diabetes.diabetesjournals.org DIABETES, VOL. 60, DECEMBER 2011 3129

extrahepatic gluconeogenesis. Glucocorticoids activate glu-coneogenesis via the binding of glucocorticoid receptors(GRs) to glucocorticoid response element on both G6pc andPck1 promoters. These regulations have been essentiallydocumented in the liver up to now (for review see [32]).Using ChIP experiments, we showed that GRs were boundto G6pc and Pck1 promoters in both the kidney and intestineof 6 h–fasted L-G6pc2/2 and WT mice (SupplementaryFig. 2). The recruitment of GRs to Pck1 promoter wasmarkedly increased in both the kidney (about threefoldcompared with WT) and intestine (sixfold compared withWT) of L-G6pc2/2 mice (Supplementary Fig. 2A and B).There was also a robust recruitment of GRs to the G6pcpromoter in the intestine of L-G6pc2/2 mice comparedwith WT mice (about eightfold compared with WT; Sup-plementary Fig. 2B). These data suggested that gluco-corticoids concurred in the induction of G6pc and Pck1gene expression in the kidney and intestine of L-G6pc2/2
mice. This does not exclude that they could act in synergywith P-CREB to stimulate both G6pc and Pck1 gene tran-scription in the kidney and intestine, as it was observedpreviously in the liver (33,34).Role of metabolic acidosis in the adaptation of renalgluconeogenesis of L-G6pc
2/2mice to fasting. In view
of these results, another mechanism should be involved inthe induction of PEPCK-c expression in the kidneys of 6 h–fasted L-G6pc2/2 mice. Despite a high glucagon-to-insulinratio, Pck1 was not activated in the kidneys of fed L-G6pc2/2
mice. The transcription of Pck1 gene is known to be con-trolled by metabolic acidosis in the kidneys, whereas it doesnot respond to changes in pH in the liver (35,36). It isnoteworthy that the plasmatic levels of free fatty acids, ke-tone bodies, and lactate were higher in L-G6pc2/2 mice thanin control mice, after 6 h fasting (Table 1, SupplementaryFig. 1). This could lead to a change in the acid-base status.Consistently, urinary pH of 6 h–fasted L-G6pc2/2 mice wasmore acidic compared with that of 6 h–fasted control mice(Fig. 7A). In the fed state, both L-G6pc2/2 and WT micepresented the same neutral urinary pH, ranging from 6.5 to7.0. To test whether acidosis is the mechanism by which thePck1 gene was induced in L-G6pc2/2 mice, we counteractedacidosis by the addition of 0.28M NaHCO3 in the drinkingwater of L-G6pc2/2 mice for 3 days (37). The urinary pH of 6h–fasted L-G6pc2/2 mice increased after treatment withNaHCO3 and was not different from that of control mice(Fig. 7A). This led to a specific normalization of Pck1 ex-pression at the mRNA and protein levels in the kidneys, butnot in the intestine, of 6 h–fasted L-G6pc2/2 mice treatedwith NaHCO3 (Fig. 7B–G). On the contrary, G6Pase ex-pression was not affected in the kidneys and in the in-testine after NaHCO3 treatment (Fig. 7B–G), confirmingthat G6pc expression is not regulated by acidosis (35).These data also strongly suggested that Pck1 expression isnot regulated by acidosis in the intestine.Conclusion. The liver has always been considered themajor source of EGP until now. In contradiction with thisdogma, we here report that, after a transient drop inplasma glucose as a result of incapacity to mobilize gly-cogen stores, the absence of hepatic glucose productionhas no major effect on the control of fasting plasma glu-cose. Instead, the early induction of gluconeogenesis in thekidneys and intestine occurs, permitting sustentation ofEGP and blood glucose right from the start of fasting peri-ods. This perfectly matches what has been observed duringthe anhepatic phase of liver transplantation in humans(38,39). Our data also emphasize that an essential function
of the liver is the rapid tuning of blood glucose during nu-tritional transitions, via the handling of glycogen stores.However, the first major finding of this study is that the liveris not an irreplaceable source of endogenous glucose in theabsence of food glucose. Similarly, glucagon, which is wellknown to stimulate hepatic glucose release via activation ofglycogenolysis and gluconeogenic gene expression, has upto now been considered as only targeting the liver. In op-position to this other dogma, the second major finding hereis that glucagon also plays a key role in the transcriptionalregulation of renal and intestinal gluconeogenic genes. Thismay account for the basal induction of renal G6pc in theabsence of hepatic glucose production and for the rapidinduction of intestinal G6pc and Pck1 once food is lacking.Either fasting or type 2 diabetes is characterized by in-creased glucagon secretion in humans, which is believed toexert a key role in the augmented EGP of diabetes (40). Inthese two situations, the renal glucose production is in-creased (4,41–43). Moreover, the renal glucose productioncould play a crucial role in the counterregulation of insulin-induced hypoglycemia in humans, a situation of increasedglucagon and cortisol secretions (41,42). At least, the impor-tant role of the kidney evidenced here might also explain whypatients with renal failure are prone to hypoglycemia (44).
In conclusion, our study provides a definitive quantitativeestimate of the capacity of extrahepatic gluconeogenesis tosustain fasting EGP, regardless of the contribution of theliver. It also extends the regulatory role of glucagon to thecontrol of gluconeogenesis in the kidneys and intestine. Thisleads us to conclude that the current dogma relating to therelative role of the liver vis-à-vis extrahepatic gluconeogenicorgans in glucose homeostasis should be reconsidered.
ACKNOWLEDGMENTS
This work was supported by research grants from theAgence Nationale de la Recherche (ANR-07-MRAR-011-01)and the Association Francophone des Glycogénoses. A.A.-W.is supported by the Syrian government.
No potential conflicts of interest relevant to this articlewere reported.
E.M. conducted and designed experiments, performeddata analyses, and wrote the manuscript. A.G.-S., A.A.-W.,and M.A.-C. contributed to the discussion and interpretationof data. C.Z. assisted in surgical procedures. A.S., I.H., andJ.-A.T. assisted in animal breeding, housing, and animalexperimentation. G.M. and F.R. supervised the work andwrote the manuscript.
The authors thank Angèle Chamousset and Jean-MichelVicat for animal care (Animalerie Lyon Est Conventionnelleet SPF, Faculté de Médecine Laennec, IFR62 Lyon-Est,Lyon), Dr. Jean-Marie Cottet-Emard (Centre HospitalierUniversitaire, Lyon) for the determination of catechol-amine levels, Dr. Christine Saban (Centre Hospitalier Uni-versitaire, Lyon) for the determination of amino acidlevels, and the members of the CECIL Platform (Facultéde Médecine Laennec, IFR62 Lyon-Est, Lyon).
REFERENCES
1. Wahren J, Ekberg K. Splanchnic regulation of glucose production. AnnuRev Nutr 2007;27:329–345
2. Croset M, Rajas F, Zitoun C, Hurot JM, Montano S, Mithieux G. Rat smallintestine is an insulin-sensitive gluconeogenic organ. Diabetes 2001;50:740–746
3. Ekberg K, Landau BR, Wajngot A, et al. Contributions by kidney and liverto glucose production in the postabsorptive state and after 60 h of fasting.Diabetes 1999;48:292–298
GLUCOSE HOMEOSTASIS IN ABSENCE OF LIVER G6PASE
3130 DIABETES, VOL. 60, DECEMBER 2011 diabetes.diabetesjournals.org
4. Gerich JE, Meyer C, Woerle HJ, Stumvoll M. Renal gluconeogenesis: itsimportance in human glucose homeostasis. Diabetes Care 2001;24:382–391
5. Mithieux G, Bady I, Gautier A, Croset M, Rajas F, Zitoun C. Induction ofcontrol genes in intestinal gluconeogenesis is sequential during fastingand maximal in diabetes. Am J Physiol Endocrinol Metab 2004;286:E370–E375
6. Owen OE, Felig P, Morgan AP, Wahren J, Cahill GF Jr. Liver and kidneymetabolism during prolonged starvation. J Clin Invest 1969;48:574–583
7. Mithieux G, Misery P, Magnan C, et al. Portal sensing of intestinal gluco-neogenesis is a mechanistic link in the diminution of food intake inducedby diet protein. Cell Metab 2005;2:321–329
8. Pillot B, Soty M, Gautier-Stein A, Zitoun C, Mithieux G. Protein feedingpromotes redistribution of endogenous glucose production to the kidneyand potentiates its suppression by insulin. Endocrinology 2009;150:616–624
9. Mithieux G, Rajas F, Gautier-Stein A. A novel role for glucose 6-phosphatasein the small intestine in the control of glucose homeostasis. J Biol Chem2004;279:44231–44234
10. Chou JY, Matern D, Mansfield BC, Chen YT. Type I glycogen storage dis-eases: disorders of the glucose-6-phosphatase complex. Curr Mol Med2002;2:121–143
11. Ozen H. Glycogen storage diseases: new perspectives. World J Gastro-enterol 2007;13:2541–2553
12. Moses SW. Historical highlights and unsolved problems in glycogen stor-age disease type 1. Eur J Pediatr 2002;161(Suppl. 1):S2–S9
13. Lei KJ, Chen H, Pan CJ, et al. Glucose-6-phosphatase dependent substratetransport in the glycogen storage disease type-1a mouse. Nat Genet 1996;13:203–209
14. Mutel E, Abdul-Wahed A, Ramamonjisoa N, et al. Targeted deletion of liverglucose-6 phosphatase mimics glycogen storage disease type 1a includingdevelopment of multiple adenomas. J Hepatol 2011;54:529–537
15. Keppler D, Decker K. Methods of Enzymatic Analysis. New York, VCHPublishers, 1974
16. Guignot L, Mithieux G. Mechanisms by which insulin, associated or notwith glucose, may inhibit hepatic glucose production in the rat. Am JPhysiol 1999;277:E984–E989
17. Gautier-Stein A, Zitoun C, Lalli E, Mithieux G, Rajas F. Transcriptionalregulation of the glucose-6-phosphatase gene by cAMP/vasoactive in-testinal peptide in the intestine. Role of HNF4alpha, CREM, HNF1alpha,and C/EBPalpha. J Biol Chem 2006;281:31268–31278
18. de Laszlo SE, Hacker C, Li B, et al. Potent, orally absorbed glucagon re-ceptor antagonists. Bioorg Med Chem Lett 1999;9:641–646
19. Rajas F, Bruni N, Montano S, Zitoun C, Mithieux G. The glucose-6phosphatase gene is expressed in human and rat small intestine: regu-lation of expression in fasted and diabetic rats. Gastroenterology 1999;117:132–139
20. Rajas F, Jourdan-Pineau H, Stefanutti A, Mrad EA, Iynedjian PB, MithieuxG. Immunocytochemical localization of glucose 6-phosphatase and cy-tosolic phosphoenolpyruvate carboxykinase in gluconeogenic tissuesreveals unsuspected metabolic zonation. Histochem Cell Biol 2007;127:555–565
21. Schuler M, Dierich A, Chambon P, Metzger D. Efficient temporally con-trolled targeted somatic mutagenesis in hepatocytes of the mouse. Genesis2004;39:167–172
22. Delaere F, Magnan C, Mithieux G. Hypothalamic integration of portalglucose signals and control of food intake and insulin sensitivity. DiabetesMetab 2010;36:257–262
23. Windmueller HG, Spaeth AE. Identification of ketone bodies and glutamineas the major respiratory fuels in vivo for postabsorptive rat small intestine.J Biol Chem 1978;253:69–76
24. Zingone A, Hiraiwa H, Pan CJ, et al. Correction of glycogen storage diseasetype 1a in a mouse model by gene therapy. J Biol Chem 2000;275:828–832
25. Mithieux G. The new functions of the gut in the control of glucose ho-meostasis. Curr Opin Clin Nutr Metab Care 2005;8:445–449
26. Authier F, Desbuquois B. Glucagon receptors. Cell Mol Life Sci 2008;65:1880–1899
27. Burcelin R, Li J, Charron MJ. Cloning and sequence analysis of the murineglucagon receptor-encoding gene. Gene 1995;164:305–310
28. Marks J, Debnam ES, Dashwood MR, Srai SK, Unwin RJ. Detection ofglucagon receptor mRNA in the rat proximal tubule: potential role forglucagon in the control of renal glucose transport. Clin Sci (Lond) 2003;104:253–258
29. Prié D, Friedlander G, Coureau C, Vandewalle A, Cassingéna R, Ronco PM.Role of adenosine on glucagon-induced cAMP in a human cortical col-lecting duct cell line. Kidney Int 1995;47:1310–1318
30. Weber FL Jr, Veach GL, Friedman DW. Effects of insulin and glucagon onthe uptake of amino acids from arterial blood by canine ileum. Dig Dis Sci1981;26:113–118
31. Cascieri MA, Koch GE, Ber E, et al. Characterization of a novel, non-peptidyl antagonist of the human glucagon receptor. J Biol Chem 1999;274:8694–8697
32. Yabaluri N, Bashyam MD. Hormonal regulation of gluconeogenic genetranscription in the liver. J Biosci 2010;35:473–484
33. Waltner-Law M, Duong DT, Daniels MC, et al. Elements of the glucocor-ticoid and retinoic acid response units are involved in cAMP-mediatedexpression of the PEPCK gene. J Biol Chem 2003;278:10427–10435
34. Vander Kooi BT, Onuma H, Oeser JK, et al. The glucose-6-phosphatasecatalytic subunit gene promoter contains both positive and negative glu-cocorticoid response elements. Mol Endocrinol 2005;19:3001–3022
35. Curthoys NP, Gstraunthaler G. Mechanism of increased renal gene ex-pression during metabolic acidosis. Am J Physiol Renal Physiol 2001;281:F381–F390
36. Curthoys NP, Taylor L, Hoffert JD, Knepper MA. Proteomic analysis of theadaptive response of rat renal proximal tubules to metabolic acidosis. AmJ Physiol Renal Physiol 2007;292:F140–F147
37. López-Flores I, Peragón J, Valderrama R, et al. Downregulation in theexpression of the serine dehydratase in the rat liver during chronic met-abolic acidosis. Am J Physiol Regul Integr Comp Physiol 2006;291:R1295–R1302
38. Battezzati A, Caumo A, Martino F, et al. Nonhepatic glucose production inhumans. Am J Physiol Endocrinol Metab 2004;286:E129–E135
39. Joseph SE, Heaton N, Potter D, Pernet A, Umpleby MA, Amiel SA. Renalglucose production compensates for the liver during the anhepatic phaseof liver transplantation. Diabetes 2000;49:450–456
40. Unger RH. Glucagon physiology and pathophysiology in the light of newadvances. Diabetologia 1985;28:574–578
41. Cersosimo E, Garlick P, Ferretti J. Renal glucose production during insulin-induced hypoglycemia in humans. Diabetes 1999;48:261–266
42. Meyer C, Gerich JE. Role of the kidney in hyperglycemia in type 2 di-abetes. Curr Diab Rep 2002;2:237–241
43. Meyer C, Stumvoll M, Nadkarni V, Dostou J, Mitrakou A, Gerich J. Ab-normal renal and hepatic glucose metabolism in type 2 diabetes mellitus.J Clin Invest 1998;102:619–624
44. Arem R. Hypoglycemia associated with renal failure. Endocrinol MetabClin North Am 1989;18:103–121
E. MUTEL AND ASSOCIATES
diabetes.diabetesjournals.org DIABETES, VOL. 60, DECEMBER 2011 3131