industrial and commercial opportunities to utilise
TRANSCRIPT

AbstractA solar energy technology roadmap has been devel-oped for South Africa. The roadmap lists a numberof technological systems that fulfil three require-ments from a South African perspective. First, theyhave clearly been demonstrated or commercialised.Second, a local industry could be stimulated includ-ing the potential to export, with associate socio-eco-nomic growth; and the other requirements of gov-ernment can be met in terms of improving energysecurity and access, and addressing climate change.Third, they have a medium to high R&D intensity,in terms of available capacity and associateresources needed to support the further develop-ment of the technological systems. ConcentratedSolar Thermal systems feature prominently in thelist of technologies. These systems can generateelectrical power, then referred to as ConcentratingSolar Power systems, typically in the 1 to 100 MWrange for on- and off-grid applications. They canalso simply produce heat, typically in the 100 to1000ºC range, primarily for commercial and indus-trial process applications. This paper discusses theinternational trends and drivers for these systems togenerate power and heat, and then focuses on thespecific potential in the South African context. Anumber of barriers to realizing the potential are dis-cussed and recommendations are made according-ly to stimulate the growth of this industry sector inSouth Africa. Keywords: Technology Roadmap, solar energy, con-centrating, developing countries
1. IntroductionSouth Africa has the major challenge of closing thegap between its first (developed) and second(developing) economies, while ‘decoupling’ thegrowth of the economy as a whole (see Figure 1). Inother words, maintaining the growth with decliningmaterial throughput, and with associated benefitssuch as improving the carbon emissions balance ofthe economy (Brent et al., 2009). Further, to beglobally competitive, and to make the transitiontowards a knowledge-based economy, will requireinnovation for sustainability and associated innova-tive development strategies. The support of appro-priate technology research and development is coreto such strategies. To this end, the South Africannational Department of Science and Technologyhas recognised the need to enable an emergingsolar energy industry, which can address the chal-lenge, and also contribute to energy resourcesdiversification in the country. The response was anational project. The coordination and develop-ment of a national solar energy technologyroadmap, through a multi-stakeholder process, wasthe second component of the larger project, whichfollowed on a baseline study, and formed the foun-dation of a further feasibility study and a businessplan for a Centre of Competence (DST, 2010).
The solar energy technology roadmap (SETRM)primarily aims to highlight key strategic researchand development (R&D) focus areas, and therequired interventions by various role players toenable such R&D. The goal of the SETRM is not toprovide insight in terms of where the solar energysector of South Africa should be heading, but wherethe national system of innovation (NSI) shouldplace its emphasis to support and expand theemerging industry.
The SETRM specifically focuses on active solarenergy systems,1 and excludes passive solar energysystems.2 The primary breakdown of the systems
Journal of Energy in Southern Africa • Vol 22 No 4 • November 2011 15
Industrial and commercial opportunities to utiliseconcentrating solar thermal systems in South Africa
Alan BrentCentre for Renewable and Sustainable Energy Studies, School of Public Leadership, Stellenbosch University
Marthinus PretoriusGraduate School of Technology Management, University of Pretoria

that are based on concentrating solar thermal tech-nology platforms are summarised in Table 1, interms of power and thermal as energy services, andincluding scale or temperature ranges.
2. International market trends and drivers,and cost implicationsThe global projections are that solar energy tech-nologies will, overall, play a significant role in thefuture energy supply and demand landscape(REN21, 2009), especially beyond 2040 (see Figure2).
The contribution of solar thermal applicationsmay remain relatively small, but it is expected thatsolar power applications will, eventually, overtakethe combined contributions of all other energyresources.2.1 CSP systems – TrendsTwo new concentrating solar (thermal) power(CSP) plants came online in 2008: the 50 MWAndasol- 1 parabolic trough plant in Spain, and a 5MW central receiver demonstration plant inCalifornia. These followed on three new parabolictrough plants during 2006/2007; the first in one anda half decades (see Figure 3). A number of addi-tional projects came online in 2009/2010, including
16 Journal of Energy in Southern Africa • Vol 22 No 4 • November 2011
Figure 1: Representation of ‘Upstream’ and‘Downstream’ decoupling
(Source: UNEP, 2009)
Table 1: Classification of the concentrating solar thermal systems that form part of the SETRM(Source: DST, 2010)
System service System market / application System outputPower Industry sector Large > 1 MW
Municipalities / commercial clusters Large > 1 MWNational grid Large > 1 MW
Thermal Commercial buildings / agriculture sector / industry sector for Medium 130 – 180ºCcooling (adsorption chillers, single and double action)Municipalities / commercial clusters / industry sector for Medium 90 – 120ºCdesalination by multi stage flash (MSF) distillationIndustry sector for process heat < 250ºCIndustry sector for process heat High < 500ºCIndustry sector for thermochemistry and fuels > 750ºC
Figure 2: Projected global primary energy consumption(Source: Weber, 2009)

two more 50 MW plants and 20 MW of CSP inte-grated with a 450 MW natural-gas combined-cycleplant in Morocco; this is the first operational plant ofthis type.
The pipeline of projects under development orconstruction increased dramatically during 2008, tomore than 8 GW by some estimates, with over 6GW under development in the United States alone.New projects are under contract in Arizona,California, Florida, Nevada, and New Mexico in theUnited States and under development in AbuDhabi, Algeria, Egypt, Israel, Italy, Portugal, Spain,and Morocco. A growing number of these futureCSP plants will include thermal storage to allowoperation into the evening hours. For example, theAndasol-1 plant in Spain has more than sevenhours of full-load thermal storage capability, and a280 MW plant is planned in Arizona with six hoursstorage (REN21, 2009).
The CSP industry saw many new entrants interms of manufacturing facilities in 2008. Activeproject developers grew to include Ausra, BrightSource Energy, eSolar, FPL Energy, Infinia, Sop-ergy, and Stirling Energy Systems in the UnitedStates; Abengoa Solar, Acciona, IberdrolaRenovables, and Sener in Spain; and Solar Millen-nium in Germany. Ausra also opened a manufac-turing facility in the US state of Nevada that beganto produce 700 MW per year of CSP componentsby mid-2009. Schott Solar of Germany opened amanufacturing plant in Spain and is constructing asimilar plant in New Mexico to produce receivertubes. Rio Glass Solar opened a manufacturingplant in Spain for trough mirrors, and Flabeg ofGermany announced plans to build a parabolicmirror factory in the United States (REN21, 2009).
These industry trends support the envisaged marketdevelopments; expected to reach 20 GWP by 2020and 160 GWP by 2030 (see Figure 4).
Figure 4. Expected CSP market development(Source: Meyer, 2010)
2.2 CSP systems – DriversFeed-in-tariffs that are directed towards CSP tech-nologies specifically have been major drivers forthese systems (WWG and MMA, 2008). The drivebehind the feed-in-tariffs has been the perceptionthat the installation of CSP systems would: meetrapidly growing electricity demand by providing thehighest capacity during utility peak loads, namelydiversifying energy supply; reduce the load on longdistance transmission lines; meet national and reg-ional renewable energy portfolio standards; reducethe demand for and price pressure on non-renew-able energy resources; improve and/or maintain air
Journal of Energy in Southern Africa • Vol 22 No 4 • November 2011 17
Figure 3: Development and implementation of the CSP technology(Source: Fluri et al., 2008)

quality; and create new jobs and economic oppor-tunity. Furthermore, although CSP systems, in gen-eral, cost more today than other renewable optionssuch as wind, there are several risk-related reasonsfor large-scale utilities to show interest in these sys-tems (WWG and MMA, 2008). For example:• Thermal storage, or the hybridization of CSP
systems with natural gas, avoids the problems ofsolar intermittency and allows the plant to dis-patch power to the line when it is needed.
• The appropriate placement of CSP plants canreduce grid congestion and increase grid relia-bility.
• Large centrally-located power plants are the
18 Journal of Energy in Southern Africa • Vol 22 No 4 • November 2011
Figure 5: Scenario of reducing levelised electricity cost (LEC) for high temperature solar thermal(HTST) electricity using the learning curve approach
(Source: WWG and MMA, 2008)
Table 2: Characteristics of CSP systems(Source: WWG and MMA, 2008)
Parabolic trough Central receivers Dish StirlingSize 30 – 320 MW* 10 – 200 MW* 5 – 25 kW*Operating temperature 390ºC 565ºC 750ºCAnnual capacity factor** 23 – 50 %* 20 – 77 %* 25 %Peak efficiency 20 % (d) 23 % (p) 29.4 % (d)Net annual efficiency 11 (d’) – 16 %* 7 (d’) 20 %* 12 – 25 (p) %*Commercial status Commercially Scale-up Prototype
available demonstration demonstrationTech. development risk Low Medium HighStorage available Limited Yes BatteryHybrid designs Yes Yes YesCost:$/m2 630 – 275* 475 – 200* 3100 – 320*$/W 4.0 – 2.7* 4.4 – 2.5* 12.6 – 1.3*$/Wp*** 4.0 – 1.3* 2.4 – 0.9* 12.6 – 1.1** Values indicate changes over the 1997 to 2030 timeframe.** Increases in capacity factor due to the use of thermal storage.*** Removes the effect of thermal storage (or hybridization for Dish Stirling).
(p) = predicted; (d) = demonstrated; (d’) = has been demonstrated – years are predicted values.

types of systems that the utilities have operatedfor years and with which they are most comfort-able.
• Once the CSP plant is built, its energy costs arefixed; this stands in contrast to fossil-fuelledplants that have experienced large fluctuationsin fuel prices over the last several years.Nevertheless, the learning curve of CSP systems
seems to have a smaller slope compared to, forexample, photovoltaic systems (see Figure 5), andthe industry drive is for cost reductions throughplant scale-up (20%/48%), volume production(26%/28%) and technological advancement(54%/24%) (see Table 2, Figure 6, and Table 3).Table 3: Installed and predicted capacities for
CSP technologies (MWe)(Source: Fluri et al., 2008)
CSP system Installed (2008) Predicted (2018)Parabolic trough 418 3528Central receivers 11 1353Linear Fresnel 0 477Dish Stirling < 2 800
The typical cost breakdown of a CSP system isshown in Figures 7 and 8. Much of the current R&Deffort is due to a market push from the materialmanufacturing sectors, as well as a market pull fromthe CSP manufacturing sector for system compo-nents. It is at this interface that significant costreductions are expected to optimise the CSP valuechain.2.3 Trends and drivers for thermalapplicationsThe European Solar Thermal Industry Federation
has found that (EUREC, 2009):• In OECD countries, industry accounts for 30%
of energy consumption;• In the EU, two-thirds of this 30% consists of heat
rather than electrical energy; and• About 50% of the industrial heat demand lies
below 250°C, a large proportion of which canbe supplied by current or close-to-market solarthermal technologies.
Other studies have had similar findings (Weiss et al.,2009) and the industrial heat demand has beendescribed in temperature ranges: • Below 400°C: 57%;• Below 250°C (in several industrial sectors):
60%; and• Below 100°C: 30% of the total figure.
Figure 9 and Table 4 show the industrial heatdemand share broken down by temperature leveland industrial sector for thirty-two European coun-tries: EU25 plus Bulgaria, Romania, Turkey,Croatia, Iceland, Norway and Switzerland.
In Europe, the key sectors are food (includingwine and beverage), textile, transport equipment,metal and plastic treatment, and chemical. Theareas of application with the most suitable industri-al processes include cleaning, drying, evaporationand distillation, blanching, pasteurisation, sterilisa-tion, cooking, melting, painting, and surface treat-ment. Space heating and cooling of factory build-ings are also included among the most promisingapplications. In these sectors, solar thermal heatcould be very effective, as the heat demand is moreor less continuous throughout the year; and thetemperature level required by some of the process-es is compatible with the efficient operation of solarthermal collectors.
About ninety operating solar thermal plants forprocess heat exist worldwide, with a total capacity
Journal of Energy in Southern Africa • Vol 22 No 4 • November 2011 19
Figure 6: Levelised electricity cost (LEC) predictions for parabolic troughs and central receivers(US cents/kWh)
(Source: Sargent and Lundy Consulting Group, 2003)

20 Journal of Energy in Southern Africa • Vol 22 No 4 • November 2011
Figure 7: Cost breakdown of a typical CSP system(Source: Sargent and Lundy Consulting Group, 2003)
Figure 8: Comparison of investment breakdown of two 50MW parabolic trough plants: thermal oilwith three hours storage (left), direct steam generation with no storage (right)
(Source: Pitz-Paal et al., 2005)
Figure 9: Share of industrial heat demand by temperature level and industrial sector(Source: Vannoni et al., 2008)

of about 25 MWth (35000 m²). This is a very smallfraction (0.02%) of the total solar thermal capacityinstalled worldwide, which equals 118 GWth (most-ly domestic solar water heating, pool heating andspace heating). Figures 10 and 11 show the distri-bution of capacity by industry and country respec-tively. The low figure of 0.02% of the installed solarthermal capacity for industrial process heat, com-
pared to existing domestic water heating, shows agreat opportunity for improvement.2.3.1 High temperature applicationsThe trends in high temperature, concentrating ther-mal with tracking applications have largely beenthrough combined heat and power (CHP) systemsthat are located at industrial and very large com-
Journal of Energy in Southern Africa • Vol 22 No 4 • November 2011 21
Table 4: Industrial heat demand and solar process heat potential for selected countriesand for EU25
(Source: Vannoni et al, 2008)Country Industrial heat demand Solar process heat Solar process heat/ Potential in terms
potential: low and Ind. heat demand of capacitymedium temperature
PJ/year PJ/year % GWthAustria 137 5.4 3.9 3Spain 493* 17.0 3.4 5.5 – 7Portugal 90* 4.0 4.4 1.3 – 1.7Italy 857 31.8 3.7 10Netherlands 46 1.95 3.2 0.5 – 0.7EU 25 6,881 258.2 3.8 100 – 125
Figure 10: Solar industrial process heat plants – distribution by industry sector
Figure 11: Solar industrial process heat plants – distribution by country(Source: Vannoni et al., 2008)

mercial facilities; these systems generate bothpower and steam. The steam is used on site (ornearby) for process heat or space conditioning, andthe power may be used on site or sold to the grid(EAC, 2009). These plants can have very high effi-ciency (45% to 80%) because much of the heat isused and not wasted. In 2006, CHP systems gener-ated about 322 TWh of electricity in the UnitedStates, accounting for 7.9% of net generation thatyear (EAC, 2009). Several studies have estimatedthat the amount of power from CHP could beincreased by more than 50% (Shipley et al., 2009).However, little information is available in terms ofnon-renewable resource usage, for process heat,which can be replaced over time, but projectionsare large quantities (Roos, 2009). Nevertheless,realizing this potential will require the overcoming ofa variety of barriers, ranging from host-site reluc-tance to get into the power business, fluctuations innon-renewable fuel and electricity prices over time,and problems with environmental regulations andinterconnection requirements in some service areasand jurisdictions (EAC, 2009). The future trendsand drivers, and cost implications, are subsequent-ly vague.
A number of solar thermochemical processesare being investigated; most notably the productionof hydrogen as a clean liquid fuel (see Figure 12).Economic assessments (Steinfeld, 2005) have indi-cated that the solar thermochemical production ofhydrogen can be competitive with the electrolysis ofwater using solar-generated electricity, and, undercertain conditions, might become competitive withconventional fossil-fuel-based processes at the then
(2005) fuel prices, even before the application ofcredit for CO2 mitigation and pollution avoidance.However, there are (still) many uncertainties associ-ated with the viable efficiencies and investmentcosts of the various components due to their earlystage of development and their economy of scale.Thus, further developments and large-scale demon-strations are warranted (Steinfeld, 2005). Also, themarket projections of a hydrogen economy are stillmuch debated (NAE, 2004) and it is difficult at thisstage to ascertain the market pull that will drivedown the costs of these technological systems.3. South African market potential andbarriers to be addressed through researchand developmentA ‘progressive renewable scenario’ for South Africahas shown the largest shift to be in the electricitysupply sector. To meet electricity demands, the cur-rent models project that within the next two decadesactive solar systems could contribute as much to thepower mix as wind energy. Thermal applicationsare mostly modelled as demand side energy effi-ciency measures, but Banks and Shäffler (2006)have predicted a steady, but small, growth in thesolar water heating, which includes process heat, asenergy supply markets. Nevertheless, South Africahas seen recent market developments that will drivethe implementation of active solar energy systems,even within a number of constraints that have beenidentified primarily pertaining to governance issues(Sebitosi and Pillay, 2008). For example, the evi-dence of uncoordinated and at times conflictingapproaches by various arms of government.
22 Journal of Energy in Southern Africa • Vol 22 No 4 • November 2011
Figure 12: Five thermochemical routes for the production of solar hydrogen(Source: Steinfeld, 2005)

3.1 CSP systems – Market potentialThe contribution of concentrating solar power(CSP) systems to the South African market is notlimited by general resource availability.Furthermore, the materials used to construct CSPplants are (mostly) readily available and land use isnot a significant constraint. Given that thermal stor-age is an option in CSP systems, they can also morereadily match the supply/demand needs of thenational grid (Banks and Shäffler, 2006). It is forthese reasons that the renewable energy feed-in-tar-iff (REFIT) scheme places much emphasis on CSPsystems (NERSA, 2009). Thereby the governmentaims to create a sufficient market that may drive theCSP industry towards greater commercialisationand eventually drive the price of electricity fromCSP systems low enough to make them competitivewith conventional generation sources (Edkins et al.,2009).
CSP learning curves are thought to be anywherein the range of 5 to 32%, for parabolic trough sys-tems, and 2 to 20%, for central receiver systems(Winkler et al., 2007; 2009). As the technologymatures on a global scale, cost reductions arethought to come from production changes (processinnovations, learning effects and scaling effects),product changes (innovation, design standards andredesign) and changes in input prices (Edkins et al.,2009). Models (Marquard et al., 2008) have subse-quently indicated that the levelised electricity cost(LEC) from CSP systems may be competitive withthe conventional coal systems by 2045 and withnuclear by 2026 (see Figure 13). However, theuncertainties of the costs are still high with estimatescurrently between R1/kWh and R2/kWh, althoughpredictions are that the costs should come down tobelow R0.60/kWh within the next four years (Fluriet al., 2008).
In the long-term, post-2030, the large-scale roll-out of CSP is expected to achieve cost savings forthe South African electricity generation sector(Edkins et al., 2009). Until then, however, the addi-tional cost to the electricity system is estimate atR2.5 billion for 2010 to 2015, R8 billion for 2016 to2020 and R23 billion for 2021 to 2030 (see Table5).
The models of the long-term mitigation scenar-ios (SBT, 2007), which incorporate technologylearning rates for CSP systems, indicate that theincremental investment costs to achieve the rolloutof CSP systems on the scale envisioned for the sce-narios would be R3.9 billion per year for the ‘Start’(2010 to 2015) period; rising to R4.4-4.9 billion peryear for the ‘Scale Up’ (2016 to 2030) period; andfurther rising to about R13 billion per year for the‘Rollout’ (2031 to 2050) period (Edkins et al.,2009; Winkler et al., 2009; Haw and Hughes,2007). How potential changes in the REFIT mayaffect the annual incremental cost thereof have alsobeen calculated (see Figure 14). With a reduction inthe tariff by 15% per year, in line with the estimat-ed learning rate of CSP systems, from 2014onwards, after the first CSP plants have been con-structed, the annual cost of REFIT would peakaround R30 billion in 2020. However, CSP tech-nologies may experience higher technology learn-ing rates if a local CSP component supply industryis developed (Edkins et al., 2009). This would resultin reduced upfront investment costs for CSP plantconstructions, which, in turn, may reduce the LEC(see Figure 13). If investment cost reductions of 5%per year can be achieved due to local production,in addition to global technology learning for CSPsystems, then incremental investment costs for thelarge-scale rollout of CSP is estimated (Edkins et al.,2009) to be much lower (see Table 5).
Journal of Energy in Southern Africa • Vol 22 No 4 • November 2011 23
Figure 13: Projections of the LECs from coal, nuclear and CSP systems in South Africa(Source: Marquard et al., 2008)

3.2 CSP systems – Market barriersA workshop facilitated by the Energy ResearchCentre (ERC) highlighted that a solar industrydevelopment programme could lead to large-scaleemployment creation and possible foreign earningsthrough the export of the technology, especially ifSouth Africa were to become a market leader in theless developed central receiver and linear Fresneltechnologies (Edkins et al., 2009). It was furthernoted that the well-established automotive manu-facturing industry could possibly evolve to supplythe CSP industry. If 5.9 employment opportunitiesare expected for each MW of CSP generationcapacity constructed then the large-scale rollout of
CSP may result in creating over 600 000 employedpositions. However, the same workshop raised anumber of issues facing the large-scale rollout ofCSP in South Africa. The largest barrier is financialsupport, with the others grouped into technological(innovate), infrastructure (operate), industry-related(manufacture) and legal/regulatory (regulate) issues(see Table 6).
Some of these barriers can be addressed by con-certed research efforts. For example:• To start large-scale rollout of CSP, South Africa
would have to invest in importing the requiredtechnology, in particular parabolic trough tech-nologies: Technology transfer issues and chal-
24 Journal of Energy in Southern Africa • Vol 22 No 4 • November 2011
Table 5: Scenarios for large-scale rollout of CSP in South Africa(Source: Edkins et al., 2009)
Start Scale-up Rollout2010-2015 2016-2020 2021-2030 2031-2050
CO2-eq emissions avoided 20 Mt 140 Mt 370 Mt 3270 Mt(4 Mt/yr) (28 Mt/yr) (38 Mt/yr) (165 Mt/yr)
Share of electricity sector 4% 13% 27% 55%(installed generating capacity) (2 GW) by 2015 (7 GW) by 2020 (24 GW) by 2030 (100 GW) by 2050Incremental cost to electricity 2.5 8 23 -2generation systema (0.4/yr) (1.6/yr) (2.3/yr) (-0.1.yr)Incremental investment cost of CSP rollouta– with technology learningb 23.5 24.6 44 266
(3.9/yr) (4.9/yr) (4.4/yr) (13/yr)– with technology learningb 22.9 19.4 20 87and local productionc (3.8/yr) (3.9/yr) (2/yr) (4.3/yr)
Notes:a) Billion rands in 2008.b) Learning ratio is 15% and 20% reduction per doubling of deployment for parabolic trough and central
receivers respectively.c) Local production of CSP components is assumed to reduce CSP investment costs at a rate of 5% per year.
Figure 14: Estimated annual costs of REFIT, reduced by 5%, 10% and 15% after the first CSP plantsare built in 2014, in support of the large-scale rollout of CSP
(Source: Edkins et al., 2009)

lenges need to be investigated.• Thermal storage technology, such as motel salt
storage, would also have to be acquired, andimporting such technology may prove costly:New storage technologies need to be researchedand developed.
• Smaller-scale applications of CSP for off-gridcommunities or rooftops are required: Feasibilitystudies and demonstration facilities need to bedeveloped.
• Existing hybrid systems are not appropriate forSouth Africa, since these systems rely primarilyon natural gas: Coal would also have to beinvestigated for country-specific CSP designs asa suitable backup fuel.
• The availability of water resources: Changes inavailability due to climate change needs to beinvestigated as well as novel water resourcemanagement practices; existing dry coolingtechnology expertise need to be expanded in thecountry.
• Infrastructure barriers: Integrated planning stud-ies need to be ongoing, and especially pertain-ing to transmission and storage on the nationalgrid, e.g. through the promotion of electric vehi-cles or more pump-storage schemes.
• Governance barriers: Regulatory barriers, suchas the Environmental Impact Assessmentprocess, need to be investigated, as well asdeveloping the NSI to expand the existing man-ufacturing sector to accommodate a CSP indus-try in South Africa.In all cases financial support for these research
efforts are necessary for CSP developers to preparefeasibility studies. For the Start phase of large-scaleCSP rollout in South Africa (2010 to 2015) financ-ing could come from commercial investors and
development financers, such as the IndustrialDevelopment Corporation (Maia, 2009). However,the current global economic climate presents diffi-culties for CSP developers to access finance, evenwith the REFIT in place (Edkins et al., 2009), andpublic financing mechanisms are therefore (still)required. These would include R&D support andgrants from climate change funds, such as the CleanTechnology Fund of the World Bank (2009), andthe Clean Technology Fund Investment Plan of theGovernment of South Africa (2009).3.3 Potential for thermal applicationsHigh temperature applications of concentratingsolar thermal systems have been considered in theSouth African context, especially within the heavyindustrial base of the country to improve energy(and carbon) efficiencies, and for specific applica-tions such as the gasification of coal (Roos, 2009).It has been concluded (Weiss, 2009; EAC, 2009)that solar thermal could provide the Europeanindustrial sector with 3 to 4% of its heat demand(see Figure 9 and Table 4). Given that South Africahas a better solar resource than Europe and theindustries described exist in South Africa, the pene-tration of solar process heat technologies into theseindustries in South Africa can be expected to becomparable or better with suitable support initia-tives.
Now in South Africa, the food, wine and bever-age, paper, textile and automotive industries allexist. They can be targeted for solar process heat inthe same way as Europe. Unfortunately, though,these sectors form a much smaller fraction of ener-gy demand in South Africa than in Europe. Figures15 and 16 show that the industrial sector comprises41% of energy use, similar to the 30% of Europe.
Journal of Energy in Southern Africa • Vol 22 No 4 • November 2011 25
Table 6: Main barriers facing the large-scale rollout of CSP in South Africa(Source: Adapted from Edkins et al., 2009)
Start Scale-up Rollout2010-2015 2016-2020 2021-2050
Innovate Import technology South African specific Water-saving technologyThermal storage technology technologyEskom cooperation
Adopt / Risky investment: ‘Test Plant’ Lacking skills for local contentmanufacture branding – no market outlookOperate / Initial grid expansion Massive grid expansion Grid-wide storagemaintain Lacking skills Water-stressRegulate REFIT untested REFIT expiry unknown SAPP day-ahead marketFinance Venture capital and grants from Investment facilitation; Equity, mezzanine, debt,
climate change funds, e.g. NAMA crediting from climate insurance and carbon-basedWorld Bank and other Clean change funds and loansTechnology Funds
Stakeholder REFIT established Growing solar industry Future employment andinterests development programme exportsStakeholder REFIT untested Eskom as electricity distributor Environmental Impactconcerns Assessments – water

Within the industrial sector, however, mining, ironand steel, non-ferrous metals and non-metal miner-als together consume 59% of energy and 66% ofelectricity consumed in the industrial sector.
Here the greatest contribution that could bemade by solar industrial process heat would proba-bly be provided by parabolic troughs: firstly drivingdouble effect absorption chillers for mining ventila-tion, and secondly providing process steam in thechemical and petrochemical industries, and others.Air conditioning of commercial buildings mayrequire single-effect absorption chillers with station-ary collectors as typical roof structures may not beideal for parabolic troughs. A small linear Fresnelsystem, which can drive a double effect absorptionchiller, would be ideal, however, because of lesserweight and area requirements, especially on flatroofs. The use of solar collectors to drive large-scalethermal desalination plants, such as multi-effectdesalination or multi-stage flash evaporation, allowsa solution to both mine acid drainage and the pro-vision of fresh water at mines.
Important here is the realisation that the manu-facturing and installing of collectors for solar indus-trial process heat is an industry in its own right,meeting government imperatives of labour-inten-sive employment, climate change mitigation, andenergy security.
4. Discussion – The way forwardTo develop the solar energy technology roadmap(SETRM) (DST, 2010), strength, weakness, oppor-tunity and threat (SWOT) analyses were conductedfor the different applications and technological sys-tems in the South African national system of inno-vation (NSI). The SWOT analyses were compli-mented with market readiness analyses of the dif-ferent technological systems based on current inter-national advances in the technological systems, theinternational market trends and drivers, and theSouth African market potential and barriers thatmay be addressed through research and develop-ment (R&D). The analyses revealed the R&Drequirements of the different technologies, as wellas the requirements of those technologies that havebeen demonstrated, which need to be commer-cialised in South Africa, and those that are alreadycommercialised and can therefore be acquireddirectly. The requirements are summarised in Table7.
Those technological platforms that are in thedemonstrated and commercialised life cycle phase(see Table 7) were then further analysed in terms of:• Government intensity in terms of the require-
ment for those technological platforms thatwould stimulate economic growth coupled withindustry development and employment cre-
26 Journal of Energy in Southern Africa • Vol 22 No 4 • November 2011
Figure 15: Total energy and electricity consumption in South Africa per sector in 2005(Source: DME, 2006)
Figure 16: Total energy and electricity consumption in the industrial sector in South Africa persector in 2005
(Source: DME, 2006)
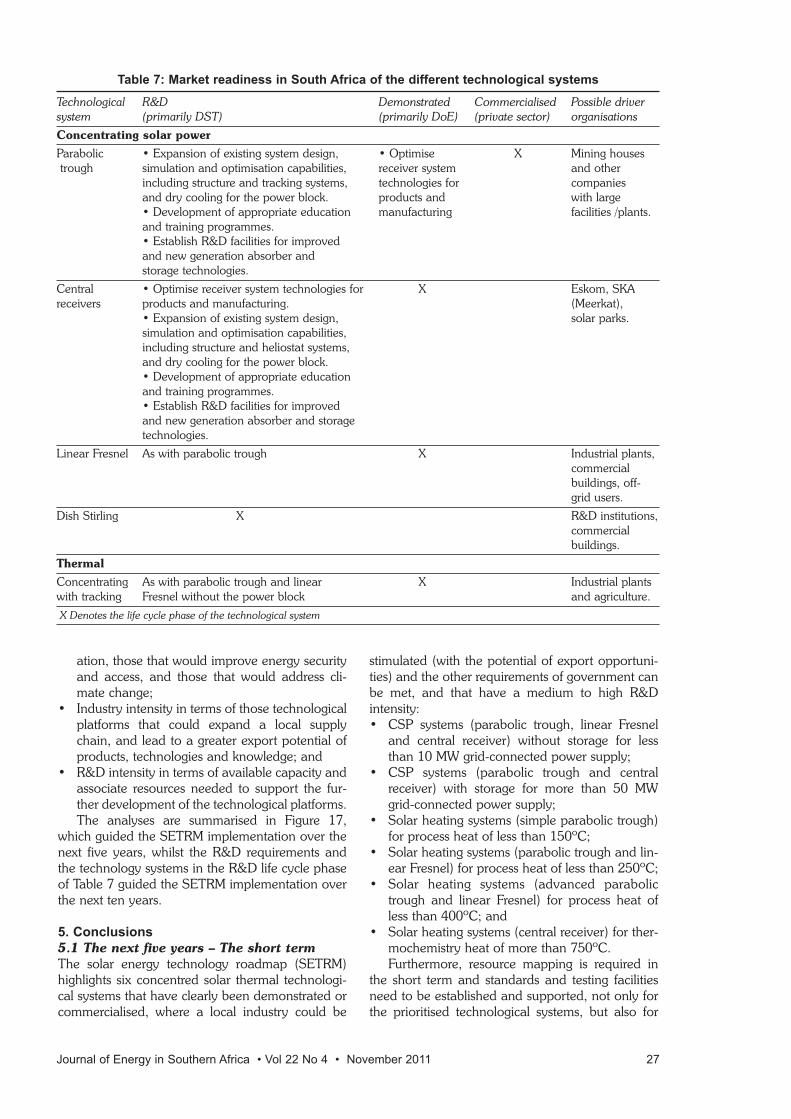
ation, those that would improve energy securityand access, and those that would address cli-mate change;
• Industry intensity in terms of those technologicalplatforms that could expand a local supplychain, and lead to a greater export potential ofproducts, technologies and knowledge; and
• R&D intensity in terms of available capacity andassociate resources needed to support the fur-ther development of the technological platforms.The analyses are summarised in Figure 17,
which guided the SETRM implementation over thenext five years, whilst the R&D requirements andthe technology systems in the R&D life cycle phaseof Table 7 guided the SETRM implementation overthe next ten years.5. Conclusions5.1 The next five years – The short termThe solar energy technology roadmap (SETRM)highlights six concentred solar thermal technologi-cal systems that have clearly been demonstrated orcommercialised, where a local industry could be
stimulated (with the potential of export opportuni-ties) and the other requirements of government canbe met, and that have a medium to high R&Dintensity:• CSP systems (parabolic trough, linear Fresnel
and central receiver) without storage for lessthan 10 MW grid-connected power supply;
• CSP systems (parabolic trough and centralreceiver) with storage for more than 50 MWgrid-connected power supply;
• Solar heating systems (simple parabolic trough)for process heat of less than 150ºC;
• Solar heating systems (parabolic trough and lin-ear Fresnel) for process heat of less than 250ºC;
• Solar heating systems (advanced parabolictrough and linear Fresnel) for process heat ofless than 400ºC; and
• Solar heating systems (central receiver) for ther-mochemistry heat of more than 750ºC.Furthermore, resource mapping is required in
the short term and standards and testing facilitiesneed to be established and supported, not only forthe prioritised technological systems, but also for
Journal of Energy in Southern Africa • Vol 22 No 4 • November 2011 27
Table 7: Market readiness in South Africa of the different technological systemsTechnological R&D Demonstrated Commercialised Possible driversystem (primarily DST) (primarily DoE) (private sector) organisationsConcentrating solar powerParabolic • Expansion of existing system design, • Optimise X Mining housestrough simulation and optimisation capabilities, receiver system and other
including structure and tracking systems, technologies for companies and dry cooling for the power block. products and with large• Development of appropriate education manufacturing facilities /plants.and training programmes.• Establish R&D facilities for improved and new generation absorber and storage technologies.
Central • Optimise receiver system technologies for X Eskom, SKA receivers products and manufacturing. (Meerkat),
• Expansion of existing system design, solar parks.simulation and optimisation capabilities, including structure and heliostat systems, and dry cooling for the power block.• Development of appropriate education and training programmes.• Establish R&D facilities for improved and new generation absorber and storage technologies.
Linear Fresnel As with parabolic trough X Industrial plants,commercial buildings, off-grid users.
Dish Stirling X R&D institutions,commercial buildings.
ThermalConcentrating As with parabolic trough and linear X Industrial plantswith tracking Fresnel without the power block and agriculture.X Denotes the life cycle phase of the technological system

those that have already been commercialised andrequire less R&D interventions. 5.2 The next ten years – The short tomedium termIn the short to medium term R&D resources need tobe directed on a continual basis to support the fourprioritised and other technological systems that arein the commercialisation phase:• CSP systems for power and thermal applica-
tions: Optimise receiver system technologies forproducts and manufacturing (central receivers);expansion of existing system design, simulationand optimisation capabilities, including receiverstructure and tracking systems, and dry andhybrid cooling in the power block; developmentof appropriate education and training pro-grammes; and establishing R&D facilities forimproved and new generation absorber andstorage technologies.
• Thermal applications: System optimisationresearch projects for specific applications, espe-cially for process heat where a significant contri-bution can be made.
The proposed five and ten year activities werereviewed and benchmarked against the outcomesof two workshops: the first a CSP workshop held on11 December 2009, where R&D requirements werediscussed; and a second workshop on 19 February2010, where stakeholders in the solar energy field(government, industry and the research institutions)held a strategic conversation about the proposedSETRM.
From an evaluation of the comparisons of thevarious outcomes of the proposed SETRM and theworkshops, five definitive solar technology systemfocus areas can be identified, namely: 1. Solar Resource Assessment;2. Photovoltaic Systems (not addressed in this
paper);3. Concentrating Solar Power Systems;4. Industrial Solar Heating and Cooling; and5. National coordination and collaborative demon-
stration facilities.For the practical implementation of the SETRM
the government is investigating further the structurethat should be created to accommodate the various
28 Journal of Energy in Southern Africa • Vol 22 No 4 • November 2011
Figure 17: Analyses of the technological platforms in terms of government, industry and R&D intensities
activities of the SETRM within these technology sys-tem focus areas.
Notes1. Active solar technologies are employed to convert
solar energy into usable heat or electricity, cause air-movement for ventilation or cooling, or store heat forfuture use. Active solar systems use electrical ormechanical equipment, such as pumps and fans, toincrease the usable heat in a system.
2. Passive solar technologies convert sunlight into usableheat, cause air-movement for ventilation or cooling,or store heat for future use, without the assistance ofother energy sources.
AcknowledgementsThe authors wish to thank the team members of the larg-er DST project that contributed to the development of theSETRM, and in particular those individuals that providedmeaningful inputs to improve and finalise the SETRMdocument: Wikus van Niekerk of Stellenbosch University,Thomas Roos of the CSIR, and Dieter Holm and JohannBasson in their private capacities. The authors are furtherappreciative of the numerous participants of the work-shops, and those individuals in the public and private sec-tors that availed themselves for personal interviews andconsultations; without these engagements the SETRMwould not have been possible. Finally, the authorsexpress their gratitude towards the DST, for providing thefinancial support, and the CSIR, for coordinating andfacilitating the larger project.
ReferencesBanks, D., Shäffler, J., 2006. The potential contribution
of renewable energy in South Africa. SustainableEnergy & Climate Change Project (SECCP), EarthlifeAfrica, Available from: www. earthlife.org.za.
Brent, A.C., Hietkamp, S., Wise, R.M., O’Kennedy, K.,2009. Estimating the carbon emissions balance forSouth Africa. South African Journal of Economic andManagement Sciences, 12 (3): 263-279.
Department of Minerals and Energy (DME), 2006. Digestof South African energy statistics. Available from:www.energy.gov.za/files/media/ explained/2006Digest PDF version.pdf.
Department of Science and Technology (DST), 2010.Establishment of a Centre of Competence in SolarEnergy. CSIR project no. 06000/ 0NRDE/JZRDE02,Pretoria.
Edkins, M., Winkler, H., Marquard, A., 2009. Large-scalerollout of concentrating solar power in South Africa.Energy Research Centre, Univer-sity of Cape Town,Available from: www.erc.uct. ac.za.
Electricity Advisory Committee (EAC), 2009. Keeping thelights on in a new world. Available from:www.oe.energy.gov/eac.htm.
European Renewable Energy Research Centres (EUREC)Agency, 2009. Research priorities for renewable ener-gy technology: By 2020 and beyond. Brussels,Available from: www.eurec. be/component/option,com_docman/task,doc_view/gid,540/.
Fluri, T.P., Meyer, A.J., Swanepoel, R., Rautenbach, K.,Arai, A.W., Fakir, M.S., van Niekerk, J.L., 2008.Renewable energy study for: MeerKAT. Final report,Centre for Renewable and Sustainable EnergyStudies, Stellenbosch Uni-versity.
Government of South Africa, 2009. Clean technologyfund investment plan for South Africa, Review draft.Available from: www.climateinvestmentfunds.org/cif/sites/climateinvestmentfunds.org/files/ctf_south_africa_investment_plan_revised_110909.pdf.
Haw, M., Hughes, A., 2007. Clean energy and dev-elop-ment for South Africa: Scenarios. Energy ResearchCentre (ERC), University of Cape Town, British HighCommission South Africa, Available from: www.erc.uct.ac.za.
Maia, J., 2009. The role of IDC in the financing of renew-able energy projects with a focus on CSP. CSP work-shop, Development Bank of Southern Africa, Mid-rand.
Marquard, A., Merven, B., Tyler, E., 2008. Costing a2020 target of 15% renewable electricity for SouthAfrica. Energy Research Centre (ERC), University ofCape Town, Available from: www. erc.uct.ac.za/Research/publications/08-Mar-quardetal-costing_a_2020_target.pdf.
Meyer R, 2010. Concentrated solar power. Lecture slides,Centre for Renewable and Sustainable EnergyStudies, Stellenbosch University.
National Academy of Engineering (NAE), 2004. Thehydrogen economy: Opportunities, costs, barriers,and R&D needs. Committee on Alternatives andStrategies for Future Hydrogen Production and Use,Board on Energy and Environmental Systems,Division on Engineer-ing and Physical Sciences,National Academies Press, Available from:www.nap.edu/openbook .php?isbn=0309091632
National Energy Regulator of South Africa (NERSA),2009. NERSA decision on renewable energy feedintariffs (REFITs) Phase II. Media statement 2November, Pretoria, Available from: www.nersa.org.za/UploadedFiles/News/Media%20statement%20NERSA%20Decision%20on%20REFIT%20Phase%202%20-021109. pdf.
Pitz-Paal, R., Dersch, J., Milow, B., 2005. EuropeanConcentrated Solar Thermal Road-mapping.European Commission, 6th Framework Programme,SES6-CT-2003-502578, Available from: www.vgb.org/data/vgborg_/Forschung/ roadmap252.pdf.
Renewable Energy Policy Network for the 21st Century(REN21), 2009. Renewable Global Status Report:2009 Update. REN21 Secretariat, Paris, Availablefrom: www.ren21.net/globalstatusreport/.
Roos, T., 2009. South African CSP industrial and manu-facturing potential – components, subsystems or sys-tems. CSP workshop, Development Bank ofSouthern Africa, Midrand.
Sargent and Lundy Consulting Group, 2003. Assessmentof parabolic trough and power tower solar technologycost and performance forecasts. National RenewableEnergy Lab-oratory (NREL) SL-5641, Prepared forDepartment of Energy, Chicago, Illinois.
Scenario Building Team (SBT), 2007. Long term mitiga-tion scenarios: Technical summary. Department ofEnvironmental Affairs and Tourism, Pretoria, South
Journal of Energy in Southern Africa • Vol 22 No 4 • November 2011 29

Africa, Available from: www.environment.gov.za/HotIssues/2008/LTMS/LTMS.html.
Sebitosi, A.B., Pillay, P., 2008. Renewable energy and theenvironment in South Africa: A way forward. EnergyPolicy, 36: 3312-3316.
Shipley, A., Hampson, A., Hedman, B., Garland, P.,Bautista, P., 2009. Combined heat and power:Effective energy solutions for a sustainable future.Oak Ridge National Laboratory, Oak Ridge,Tennessee, Available from: www1.eere. energy.gov/industry/distributedenergy/pdfs/chp_report_12-08.pdf.
Steinfeld, A., 2005. Solar thermochemical production ofhydrogen: A review. Solar Energy, 78 (5): 603-615.
United Nations Environmental Programme (UNEP),2009. Decoupling and sustainable resource manage-ment: Towards a conceptual framework. UNEPInternational Panel for Sustainable Resource
Management, Paris, Available from: www.unep.fr/scp/rpanel/publications/.
Vannoni, C., Battisti, R., Drigo, S., 2008. Potential forsolar heat in industrial processes. Booklet IEA SHCTask 33/IV, CIEMAT, Madrid.
Weber, E.R., 2009. The future of solar energy. Key noteaddress, Solar World Congress, Sandton City,Available from: www.solarworldcongress 2009.com/plenarypresentations.html.
Weiss, W., Bergmann, I. and Stelzer, R., 2009. Solar heatworldwide – Markets and contribution to the EnergySupply 2007. IEA Solar Heating & Cooling Pro-gramme, Paris.
While Wyld Group (WWG), McLennan MagasanikAssociates (MMA), 2008. High temperature solarthermal technology roadmap. Sandring-ham,Victoria, Available from: www.wyldgroup. com.au.
Winkler, H., Mukheibir, P., Mwakasonda, S., Garg, A.,Halsneas, K., 2007. Electricity supply options, sus-tainable development and climate change priorities:Case studies for South Africa. UNEP Risoe Centre onEnergy, Climate Change and Sustainable Develop-ment, Denmark, Available from: www.erc.uct.ac.za.
Winkler, H., Hughes, A., Haw, M., 2009. Technologylearning for renewable energy: Implications for SouthAfrica’s long-term mitigation scenarios. Energy Policy,37 (11): 4987-4996.
World Bank, 2009. Clean technology fund. Availablefrom: http://go.worldbank.org/SG8NY Y3DK0.
Received 16 September 2010; revised 19 April 2011
30 Journal of Energy in Southern Africa • Vol 22 No 4 • November 2011