industrial computer tomography - a universal inspection … · industrial computer tomography - a...
TRANSCRIPT
17th World Conference on Nondestructive Testing, 25-28 Oct 2008, Shanghai, China
INDUSTRIAL COMPUTER TOMOGRAPHY - A UNIVERSAL INSPECTION TOOL
Christof REINHART 1
1 Volume Graphics GmbH
Wieblinger Weg 92a, 69117 Heidelberg, Germany, Phone: +49 6221 7392060, Fax: +49 6221 7392088; e-mail: [email protected]
Abstract Over the last decade Computer Tomography (CT) has become a well recognized tool in industrial use. Today CT enables engineers from all kinds of industries to inspect objects from the smallest to the largest scale ranging from electronic devices up to complete car engines. The fast development of CT and its applications was further accelerated over the past 3 years due to the use of CT in metrology. Today CT has entered a market which so far was reserved for classical coordinate measurement devices. With this additional capability being accepted by the industries CT has become a universal inspection tool. With a single scan a CT user is able to check internal and external geometries as well as all kinds of material related aspects such as porosity or fibre orientation. Therefore CT allows a complete first article inspection using a single scan. Volume Graphics is the pioneer in industrial CT data analysis software with more than 10 years of experience in the market. This presentation will introduce the latest generation of visualization and analysis software tool – VGStudio MAX 2.0 – enabling the CT user to process data sets larger than 32 GB in size on modern PC hardware. The software allows the user to process CT data sets with high precision within a single software environment. Tools are available for tasks such as porosity analysis, to check wall-thicknesses, to compare the actual part against the nominal CAD model and to measure individual geometries. All data analysis processes can even be automated so that fast and efficient series inspection scenarios can be realized. The presentation will introduce the latest data analysis and automation concepts implemented in the software making CT a universal inspection tool. It will address, by means of customer examples, topics such as attainable measurement uncertainties and data analysis performance. Keywords: CT, NDT, coordinate measuring technology, metrology, local threshold value, actual/nominal comparison, porosity analysis, wall thickness analysis, CAD
1. Introduction Looking at the development of computer tomography (CT) in retrospective it becomes obvious that the practical usefulness of CT has always been largely determined by the development of PC hardware and software. In the 1970ies, the computer hardware used with the first CT scanners – “EMI scanners” – allowed one single slice with a low image resolution of 80x80 Pixels (12.5 Kbytes) to be reconstructed in 7 minutes. Even the displaying of slice images was a problem since graphic displays were not available at that time. Computed images had to be projected onto film to be able to view them. The recording, reconstruction and projection onto film represented a time-consuming chain of processes and an enormous task that could be justified only in relation to its usefulness in medical applications – the diagnosis of brain tumours. With increasing computing power and the availability of computer graphics, CT became an established technology for everyday medical use. Increasing computing power made it possible to create larger image matrixes with a higher resolution. Ten years later, in the late 1990ies, CT became a widely-used in industrial applications. Cost-effective PC clusters made it

possible to reconstruct the enormous data sets created by industrial applications within a time span practicable in everyday use. In parallel, in 1998 the VGStudio software made it possible for the first time to interactively visualize and analyse such large amounts of data on standard PC hardware. With constantly increasing computer power easily made available by PC technology it is possible today to reconstruct 512 slice images of 512 x 512 Pixels (256 Mbytes) in less than 30 seconds using one single graphics board that is normally used for computer games. With 64-bit PC hardware becoming widely available, it is even possible to process data volumes with a size of more than 10 Gbytes. Image matrixes have increased to 2048x2048 pixels in the process. Just like the PC hardware, the hardware of industrial CT equipment and its components such as x-ray sources, detectors and manipulators, has been steadily enhanced. As a result, CT users today benefit from a higher image resolution and a better image quality than ever before. These developments have recently led to CT being used as a coordinate measuring tool. The sum of all its capabilities – the examination of the materials of a component as well as its complete geometric analysis – makes CT a universal tool in industrial quality control. However, the usefulness of this universal tool can only be maximized by using software that is able to turn the enormous amount of data into meaningful analysis results within a short space of time. With VGStudio MAX 2.0, we have launched a new software generation that represents a new stage in the development of analysis software for industrial CT data. For the first time, VGStudio MAX 2.0 combines all possibilities of CT data analysis – NDT and metrology, CT and CAD – in one single application. It provides a previously unknown degree of efficiency and precision in the analysis of data. In the following, some of the data analysis concepts and tools available in VGStudio MAX 2.0 will be described in detail.
2. CT Data Analysis using VGStudio MAX 2.0 The following paragraphs begin with a description of some of the most important basic concepts and functions for CT data analysis implemented in VGStudio MAX 2.0. On the basis of real application examples it is shown how these concepts can be used to reduce measurement uncertainties, to increase performance and in the end to improve user benefit. 2.1 CT and CAD, or „images and triangles“ combined in one software Modern software packages for the processing of three-dimensional measurement data are usually based on a powerful data processing kernel. CAD software is based on a so-called CAD kernel (such as the ACIS kernel from Spatial/Dassault Systems) providing all essential data processing functions. VGStudio MAX 2.0 has been developed around the latest VGL™ kernel developed by Volume Graphics. The unique concept implemented in the VGL™ kernel is the fact that this kernel can process both voxel data and scatter plots or grids of triangles. Thanks to this technology, VGStudio MAX 2.0 is the first software on the market that is effectively able to process both CT slice image data and data sets consisting of points or triangles (e.g. CAD models) together in one application. The development of such a data processing kernel represents an enormous effort in terms of man-years of development time. This effort is, however, justified because in the end it provides decisive advantages for the user of this unique technology. Some of the most obvious advantages shall be described at this point: If, for example, a CAD model of the component tomographed by the CT user exists, the CT data set can be aligned directly with the CAD model. VGStudio MAX 2.0 provides all established methods (e.g. Best Fit, 3-2-1, RPS, ruled geometry-based alignment) in order to register or align data sets.

Fig. 1. Three orthogonal CT images of a pressure die cast aluminium tank, before (left) and after (right) alignment.
After alignment or calibration of the CT data, this data will immediately be available in the CAD or calibrated coordinate system. Viewing and assessment of the CT slice images is facilitated by the fact that these can be displayed in parallel to the coordinate axes. Each individual slice image can now be accurately displayed and assessed on the basis of its position. Defects in the actual component can more easily be allocated and localized. It is also possible to superimpose CAD and CT data both in three-dimensional mode and in 2-dimensional slice images, allowing rapid assessment, for example, of cast plastic or aluminium components.
Fig. 2. CT slice image of an unmachined cylinder head with the CAD model (black line) superimposed. The exact position of this crossection on the x axis is shown below the image.
After alignment of the models, nominal/actual comparison of CT data with a CAD model can be performed directly at the push of a button and within a very short time. For more information please refer to chapter 2.2.

2.2 Direct processing of voxel data The information derived from a CT scan consists solely in layer images, the voxel data. Until this day, however, voxel data is converted into scatter plots or grids of triangles (e.g. STL data) to be able to analyse the component surface geometrically. This conversion is a very time-consuming process, however, and prone to a certain loss of information. The reason why this procedure has become established in spite of its known limitations is mainly historical. Software for the analysis of scatter plots or triangle grids has been available for many years. These software packages have their origin in other methods of geometry data capture such as tactile or optical measuring methods. Since measuring software specialized in voxel data did not exist, the obvious solution was to use existing software packages for the geometrical analysis of voxel data by converting the data to a format that could be used by the software. This method has always been a compromise since generally, an extracted triangle model does not describe the tomographed component as precisely as the original voxel data it is based on. Conversion thus represents a source of additional measurement uncertainty. VGStudio MAX 2.0 eliminates the need for data conversion since its VGL™ kernel processes voxel data directly. It allows the component geometry represented by voxel data to be analysed directly and without any loss of quality. This reduces the time required e.g. for an actual/nominal comparison dramatically. The introduction of a further source of measurement inaccuracy is avoided.
Fig 3. Example of the time saving achieved during nominal/actual comparison by direct analysis of voxel data: Cylinder head CT data set, 574 slices
with 1024x1024 pixels each. Resolution: 0.3 x 0.3 x 0.75 mm In VGStudio MAX 2.0, all geometrical analyses of voxel data, be it 2D measurements in the slice images or 3D analyses such as nominal/actual comparison, wall thickness analysis or metrological inspection tasks, are based on the full information content of the voxel data and supply consistent measuring results with the lowest possible measuring uncertainty.
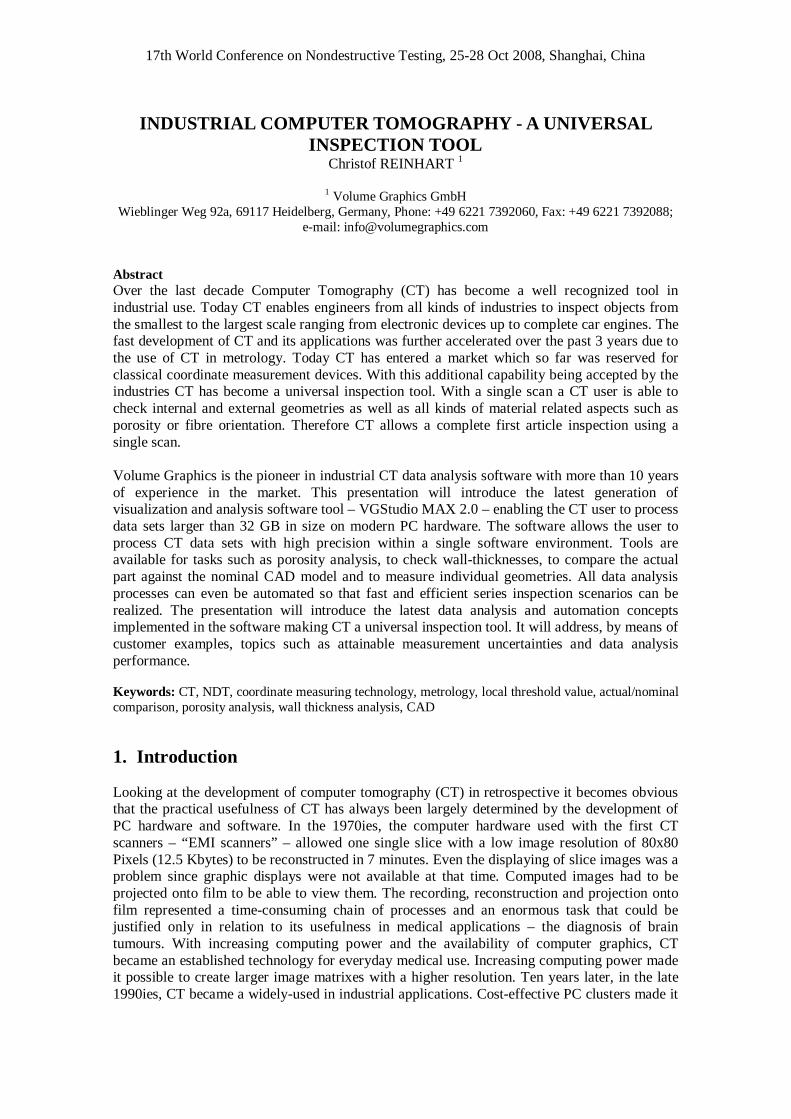
2.3 CT and Metrology For several years, industrial CT has been establishing itself as the new sensory system in metrology because it presents the user with some unique advantages. It allows complex component geometries with undercuts and even interior geometries to be captured and measured without destroying the component. To be able to perform precise measurements, a modern analysis software has to take the most diverse aspects into account. In the following, two of the functions implemented in VGStudio MAX 2.0 are described that every CT user can routinely use for minimizing measurement uncertainty. 2.3.1 Local surface detection Under ideal conditions, a CT scan of a homogenous material such as aluminium or plastic would produce a homogenous grey value on the slice image. Differing grey values along the edges, representing the surface of the component in the slice picture, would only be produced as a result of the Partial Volume Effect. Under such ideal conditions it would be possible to define the component surface simply by determining the grey value threshold. This threshold, also known as the ISO50 threshold, could be calculated as the mean value from the material grey value and the image background grey value. Such an ISO50 threshold value could be used to describe the entire component surface in the CT data set.
Fig. 4. Real and idealized CT slice image. The green line in the image on the right represents the component surface. The percentages shown represent the overlap of the respective voxel with the object
and the voxel grey value at the same time. However, each measuring or imaging method is prone to interference that produces artefacts and thus has its own inherent sources of measuring errors or measuring uncertainties. CT is no exception to this rule. Known sources of errors in CT are, e.g., beam hardening, scattered radiation or artefacts created by insufficient penetration of the object. All these effects lead to a situation where the component surface cannot be exactly described by a global ISO50 threshold value. For example, even the edge threshold value between a surface on the inside of the object and an outside surface will vary. To be able to use CT as a coordinate measurement tool, the surface displayed in the slice images of the scanned component must, however, be defined as precisely as possible. This means that the component surface must be determined locally and not by using a global threshold value. In 2D and 3D image processing, methods for edge detection with an accuracy down to sub-pixel and sub-voxel level have been known for many years (e.g. Sobel, Gauss, Laplace or Canny)1. Under optimum conditions these methods are able to determine an edge with an uncertainty of less than 1/10th of a voxel. Unfortunately, these methods require a lot of computing. Highly optimized algorithms have been developed in order

to perform a local edge detection over the entire component surface within a practicable period of time even with a CT data set of 2048^3 (16 Gbytes). These algorithms allow the components surface to be calculated in an initial calibration process following data import. After the calibration process, the determined surface can be displayed both in 2D slice images and 3D volume visualization. The representation of data is always based on the original voxel data to avoid measuring uncertainties caused by a second data representation. The coordinate measuring module available with VGStudio MAX 2.0 allows geometric evaluations in 2D or 3D, achieving the minimum possible measuring uncertainty for the respective CT data set by using the local surface calibration process.
Fig. 5. Metrological component analysis with VGStudio MAX 2.0 on the example of a die cast aluminium tank.
In VGStudio MAX 2.0, all further geometric analysis functions such as wall thickness analyses, nominal/actual comparisons and surface extractions are also performed on the voxel data surface calibrated locally. This is why they, too, produce analysis results with the minimum measuring uncertainty possible.
Fig. 6. 2D and 3D metrological component analysis with VGStudio MAX 2.0 on the example of a plastic
connector.
A - A
A A
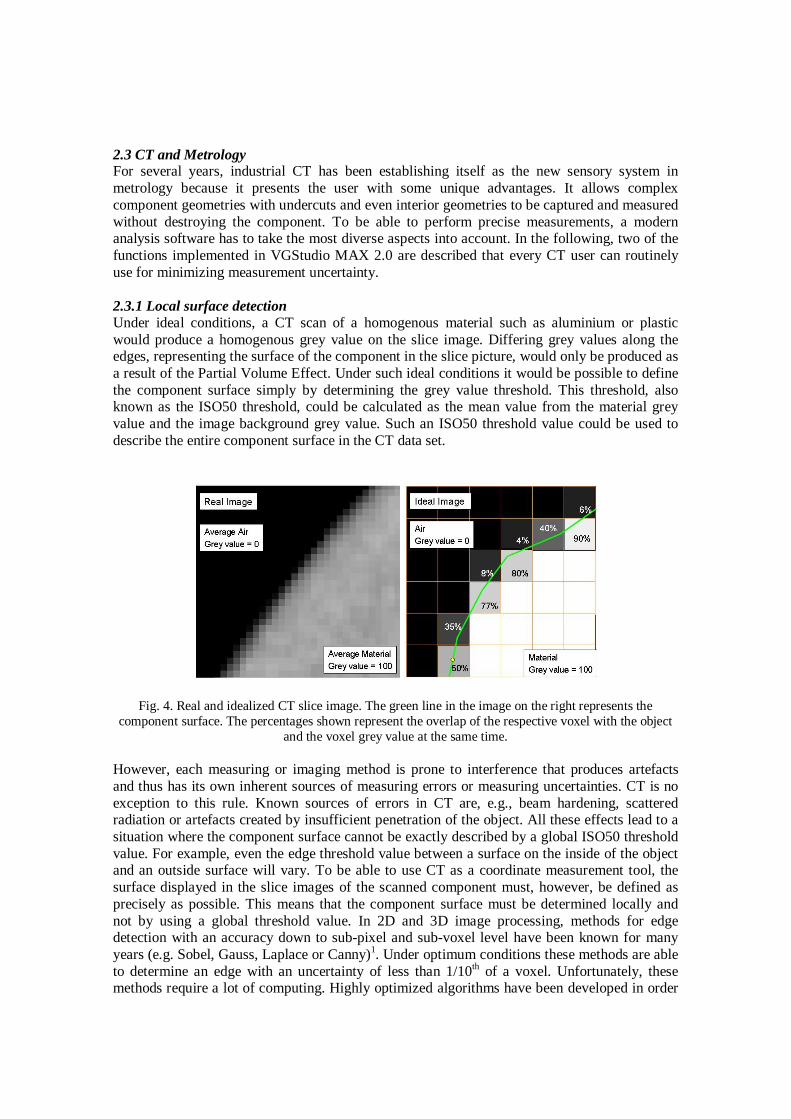
2.3.2 Scaling error correction One of the possible sources of measuring uncertainties when measuring with CT is the scaling factor of the image data. Such errors can be caused, for example, if the equipment geometry is not defined absolutely perfectly. To be able to verify the equipment geometry itself or to be able to perform highly precise measurements, reference bodies with known dimensions are used in CT. Suitable bodies are, for example, bars with spheres at either end and a known distance between the spheres. The position of a sphere centre point is independent from the surface threshold value, eliminating an important influence and possible source of errors in CT measurements. A known distance between the centre points of two spheres taken by tactile measurement can thus be used as an ideal calibration standard to eliminate a possible scaling factor of a CT data volume. VGStudio MAX 2.0 comprises a simple-to-use function allowing scaling errors to be corrected using one or more known reference measurements. All the user has to do is to take a reference measurement in the CT data and enter the respective actual measurement. VGStudio MAX 2.0 uses this to correct the scaling error.
Fig. 7. CT scan of a mobile phone housing with two ruby key switches –
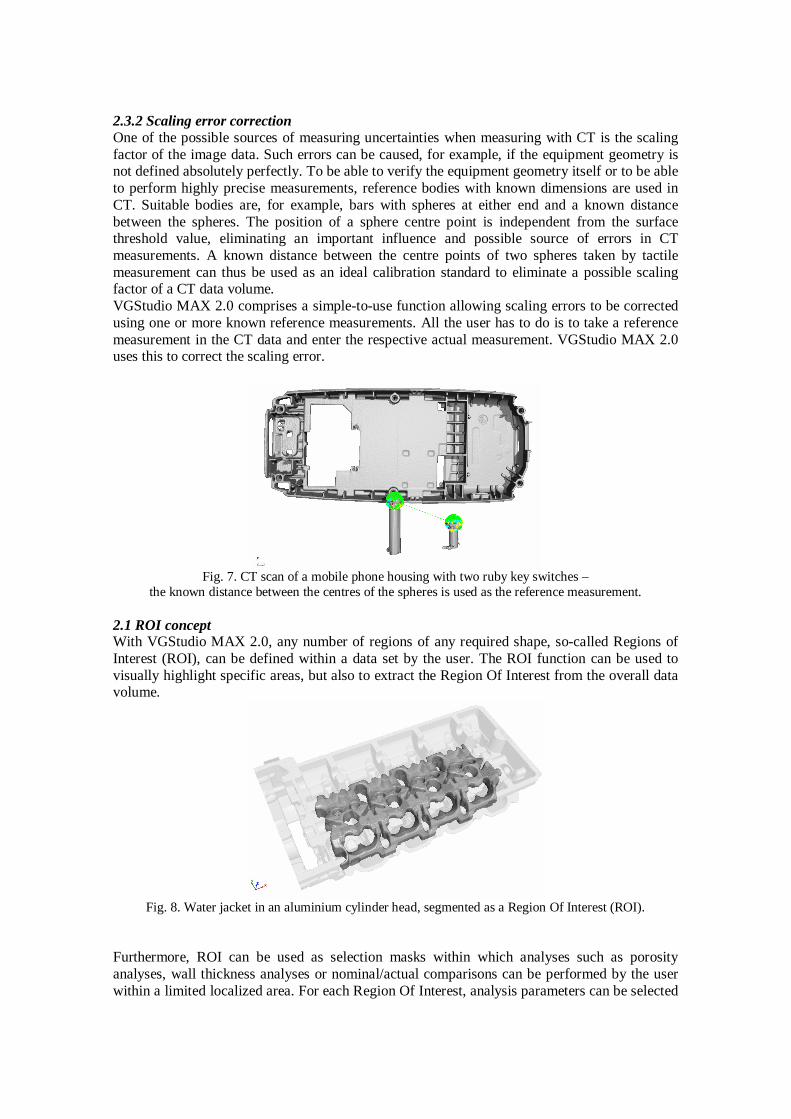
the known distance between the centres of the spheres is used as the reference measurement. 2.1 ROI concept With VGStudio MAX 2.0, any number of regions of any required shape, so-called Regions of Interest (ROI), can be defined within a data set by the user. The ROI function can be used to visually highlight specific areas, but also to extract the Region Of Interest from the overall data volume.
Fig. 8. Water jacket in an aluminium cylinder head, segmented as a Region Of Interest (ROI).
Furthermore, ROI can be used as selection masks within which analyses such as porosity analyses, wall thickness analyses or nominal/actual comparisons can be performed by the user within a limited localized area. For each Region Of Interest, analysis parameters can be selected

individually to be able to examine different areas of the material against different quality standards. Analyses performed within specific Regions Of Interest may also produce more meaningful results. By restricting analyses to relevant component areas, the influences of irrelevant areas can be disregarded. This is a distinct advantage especially if parts of the data set show interference by artefacts. In such areas, analyses do not usually produce meaningful results or even give false results. Such areas can easily be excluded from analyses by using ROI.
Fig. 9. Wall thickness analysis in an aluminium cylinder head. A ROI restricts the
analysis to the intake and exhaust ports. ROI can be created within well-defined coordinate systems and saved as ROI templates. Such a ROI template can later be imported into other data sets. Analyses within such geometrically precise, reproducible ROI result in a better comparability of the results achieved with different components. A further advantage of the use of ROI is the fact that during analyses performed within a ROI, only part of the entire data volume has to be processed, allowing analyses to be performed more quickly. The time savings achieved by using a smaller ROI can, in turn, be used to perform analyses with a higher accuracy and computational effort within an acceptable time span. 2.2 The combination of classical NDT, metrology and CAD VGStudio MAX 2.0 combines the functionality of classical Non-Destructive Testing, metrology and CAD in one application software. CT data can be aligned with the CAD model and is thus available within the CAD coordination system. All results of the different analysis modules, such as the results of a porosity analysis, are output in CAD coordinates, so that the exact localization of discontinuities in a component becomes a very easy task. Monitoring and traceability of results can easily be achieved.
Fig. 10. Result of a porosity analysis in an aluminium cylinder head. CAD coordinates are used to define defect positions.

Well-defined coordinate systems are the basis for many other data analysis applications. As an example, quality control plans can be saved in a template and then applied to other data sets to be inspected in automated processes. In a serial testing scenario, this possibility bears an enormous time-saving potential.
3. Application example The features implemented in VGStudio MAX 2.0 allow time-consuming process chains to be simplified and accelerated. Moreover, measuring uncertainties can be reduced at the same time. The following example illustrates these advantages: It is a process chain for the geometric analysis of cast aluminium components by nominal/actual comparison as established by one of our customers. After the CT scan itself, this process consisted of the following steps:
- Determining the ideal ISO50 threshold value. The threshold value was determined by extracting STL surface models on an internal and an external cylinder geometry with a diameter of approximately 20 mm with an increasing ISO50 threshold value. With the threshold value increasing, the internal diameter increases while the external diameter decreases. The point of intersection between the two lines was chosen as the ideal threshold value. With this procedure, the error caused by using the ISO50 threshold value method could not be eliminated entirely, but at least reduced to the best possible minimum. Time needed: 0.5 hours.
- A bar with four spheres, the distance between the centres of which was determined by tactile measurement, was used to determine a correction factor in order to minimise scaling errors. Time needed: 0.5 hours.
- With the corrected data volume, an STL model was then created from the CT data set using the optimum ISO50 threshold value determined earlier.
- The STL model was imported into another software, aligned with the CAD model and a nominal/actual comparison performed. Time needed: 0.5 hours.
Fig. 11. CT scan of a cylinder head with calibration objects for the determination of ISO50 threshold values (two cylindrical tubes with a known geometry) and for scaling error correction (bar with spheres
with known distances)
The entire process took 1.5 to 2 hours during which one person worked almost continuously on a PC. The same data set was analysed using VGStudio MAX 2.0.
- With VGStudio MAX 2.0, determining of the ISO50 threshold value is not necessary. A local surface calibration is used instead. For a dataset of 700 slice images (1024x1024 pixels), this process takes less than 3 minutes. Scaling factor correction can be performed by fitting the sphere geometries in VGStudio MAX 2.0, measuring the distances between the spheres and comparing these distances with the actual measured distances. Again, an experienced user is able to do this within less than 3 minutes. To verify the first two steps of the process chain, the diameters of the calibration cylinders was determined and compared with the results of the nominal values determined by tactile measurement. For the nominal internal diameter of 19.963 mm, an actual value of 19.928 mm was determined by VGStudio MAX 2.0. For the nominal external diameter of 20.034 mm, an actual value of 20.020 mm was found. With a voxel resolution of 0.40 mm in the slice image layer and a slice distance of 0.5 mm, this results in a deviation of 0.035 mm and 0.014 mm respectively.
- The extraction of the STL surface is completely superfluous in VGStudio MAX 2.0 since the software is able to process the voxel data directly and compare it with the CAD model.
- The alignment and computation of the nominal/actual comparison again takes less than 10 minutes with VGStudio MAX 2.0.
With VGStudio MAX 2.0, the user can produce analysis results within 15 minutes where he needed 1.5 hours before. Obviously, the time saving is enormous. In addition, the results achieved with VGStudio MAX 2.0 are more precise because they were calculated on the basis of a surface detected locally.
4. Summary VGStudio MAX 2.0 represents the latest stage in the development of data analysis software for users of industrial computer tomography. It combines some of the functionality of classical non-destructive testing such as porosity analysis with the functionality of metrology or component geometry analysis such as nominal/actual comparison or wall thickness analysis in one single application. The unique ability of the VGL™ kernel integrated into VGStudio MAX 2.0 to process both voxel data and polygon data eliminates the need for unnecessary data conversion. The resulting possibility of a direct analysis of CT data represents an enormous simplification and acceleration of many process chains in the area of classical non-destructive testing and the most up-to-date applications of industrial computer tomography – the use of CT equipment as a coordinate measuring system. Not only can it speed up analysis processes by avoiding data conversion, but it also consistently reduces the measurement uncertainty of the entire process. When combined with VGStudio MAX 2.0, industrial computer tomography becomes a universal, highly efficient and precise tool for product development and industrial quality control. References 1 Vision Systems by Dr A D Marshall Online Tutorial in Image Processing. http://www.cm.cf.ac.uk/Dave/Vision_lecture/Vision_lecture_caller.html