industrial - iec electronics · iec electronics corp., a delaware corporation, is the successor by...
TRANSCRIPT

Military • Aerospace • Industrial • Communications • Medical
2009Annual Report
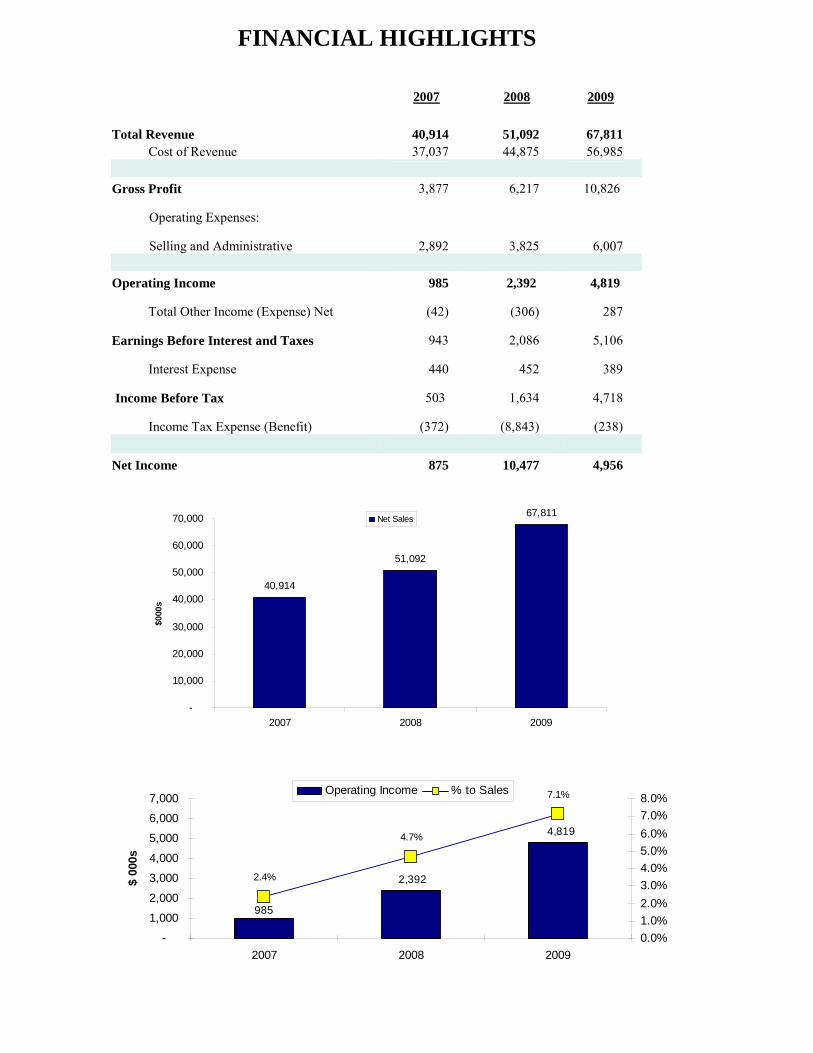
FINANCIAL HIGHLIGHTS
40,914
51,092
67,811
-
10,000
20,000
30,000
40,000
50,000
60,000
70,000
2007 2008 2009
$000
s
Net Sales
4,819
2,392
985
2.4%
4.7%
7.1%
-
1,000
2,000
3,000
4,000
5,000
6,000
7,000
2007 2008 2009
$ 00
0s
0.0%1.0%2.0%3.0%4.0%5.0%6.0%7.0%8.0%
Operating Income % to Sales
2007 2008 2009 Total Revenue 40,914 51,092 67,811 Cost of Revenue $$ 37,037 44,875 56,985 Gross Profit 3,877 6,217 10,826
Operating Expenses:
Selling and Administrative 2,892 $ 3,825 6,007
Operating Income 985 2,392 4,819
Total Other Income (Expense) Net (42) (306) 287
Earnings Before Interest and Taxes 943 2,086 5,106
Interest Expense 440 452 389
Income Before Tax 503 1,634 4,718
Income Tax Expense (Benefit) (372) (8,843) (238) Net Income 875 10,477 4,956

2
Business IEC Electronics Corp. is a premier provider of electronic manufacturing services to advanced technology companies. We specialize in the custom manufacture of high reliability, complex circuit cards, system level assemblies and a wide array of custom cable/wire harness assemblies. We excel where quality is paramount and where low to medium volume, high mix production is the norm. We utilize state-of-the art, automated circuit card assembly equipment coupled with a full complement of high reliability manufacturing stress testing technologies. We have created a “high intensity response culture” to react and adapt to our customer’s ever-changing needs. Our customer focused approach offers a high degree of flexibility while simultaneously complying with the industry’s rigorous quality and on-time delivery standards. As a true extension of our customer’s operation, we have applied industry leading Six Sigma and Lean Manufacturing principles to eliminate waste and lower our customer’s total cost of ownership. While many EMS services are viewed as a commodity, we have set ourselves apart through an uncommon mix of features including:
A world class Technology Center that combines a dedicated prototype manufacturing center with an on-site Materials Analysis Lab (headed by two staff PhD’s) for the seamless introduction of complex electronics
A sophisticated Lean/Sigma continuous improvement program supported by five certified Six Sigma Blackbelts delivering best-in-class results
Industry-leading Web Portal providing real-time access to a wide array of critical customer data
In-house custom functional test development to support complex system-level assembly, test, troubleshoot and end-order fulfillment
IEC Electronics Corp., a Delaware corporation, is the successor by merger in 1990 to IEC Electronics Corp., a New York corporation, which was organized in 1966. On May 30, 2008, IEC acquired all of the stock of Val-U-Tech Corp., a wire and cable-harness inter-connect business, located in Victor, New York. Val-U-Tech was renamed IEC Electronics Wire and Cable, Inc. during 2009. IEC Electronics Wire and Cable, Inc. is a premier cable and wire harness manufacturer specializing in high-reliability applications for companies in the military, medical, industrial and transportation market sectors. Wire and Cable manufactures a diverse portfolio of custom cable/wire harness assemblies, mechanical sub-assemblies, circuit card assemblies and box builds with an emphasis on perfect quality delivered precisely on time. IEC is a world-class ISO 9001-2000, AS9100 and ISO13485 certified company. The AS9100 certification enables IEC to service the military and commercial aerospace markets. The ISO13485 certification supports the quality requirements of the medical device markets. We are also ITAR registered and NSA approved under the COMSEC standard. Our manufacturing processes encompass the best aspects of Lean Manufacturing and Six Sigma Principles. Many customers consider these certifications crucial when qualifying an EMS provider. Our state-of-the-art Technology Center includes prototype assembly, design engineering services, and an Advanced Materials Technology Laboratory. We continually evaluate emerging technologies and maintain a technology road map to ensure relevant processes and advances in new equipment are available to our customers when commercial and design factors so indicate. The current generation of interconnection technologies includes chip scale packaging and ball grid array assembly techniques. We have placed millions of plastic and ceramic BGA's since 1994. Future advances will be directed by our Technology Center, which combines Prototype and Pilot Build Services with the capabilities of our Advanced Materials Technology Laboratory and our Design Engineering Group. Our experienced workforce has a high level of technical expertise. Our emphasis is on building the most challenging complex systems serving original equipment manufacturers with advanced electronics technology. IEC has positioned itself as a leader of lead-free solder assembly technology through early development and technical publications. Lead-free was mandated by July 2006 for many electronic products sold in Europe. Our executive offices are located at 105 Norton Street, Newark, New York 14513. Our telephone number is (315)331-7742, and our Internet address is www.iec-electronics.com .

3
Chairman’s Letter Dear Shareholder, I am pleased to report that we had an excellent year. Your Company continues to grow during a very turbulent economic period. For those new to the IEC family of investors, I hope this letter offers you a perspective of how we view this past year and our thoughts about next year. Our fiscal year opened with the country in the midst of the sub-prime mortgage crisis and gasoline prices were starting to recede from $4.00 a gallon. In February, the stock market fell to the lowest level in decades, credit markets seized, banks were not lending money and the world was in the midst of recession. Despite these profound challenges, our top line showed double digit-growth and our bottom line improved by triple-digits. We were fortunate to be working with a solid group of well- managed customers, and we applied a disciplined and prudent approach toward managing our business. We view the growth this past year to be inextricably entwined with our vision, “Absolutely, Positively Perfect and On Time(sm)”. This is a simple pledge which has driven an uncompromising focus on satisfying our customers and which governs virtually all of our investment decisions. Much of our focus during the year was spent on integrating our wire and cable acquisition, IEC Electronics Wire and Cable, formerly Val-U-Tech, (“Wire and Cable”) into IEC Electronics. The goal of this fiscal 2008 acquisition was to expand our customer base and bring new capability to our existing customers. So far the acquisition has had modest success. The strategic reasons for the acquisition are important and starting to reach fruition. We are cross selling new and existing customers for both wire and cable and electronic assembly business. Though there is still much to be done, we view Wire and Cable as a profitable addition to the Company. Our expectations for it during the coming year are high and we have no reason to believe it will not meet those expectations. IEC experienced sequential improvement in both revenue and margins, as it has done every year since fiscal 2006. Fiscal year 2009, was by far the best year. We finished the year with revenue of $67.6 million and earnings before tax of $4.7 million. This was an increase of 35% in sales and 180% increase in earnings from 2008. Our other metrics, gross profit and operating earnings as a percent of sales dramatically improved, and we are proud to say, to a level where our performance is among the highest in the industry. We continue to aggressively reduce our debt and maximize the use of our tax loss carry forward. We have approximately $39 million remaining on the NOL. Our growth comes from two sources. First, we have solid relationships with first class companies that look to us to provide them with greater support. Second, we are expanding outsourcing opportunities within the military and aerospace sectors. All customers want high quality and timely delivery of their products. We believe the need for timely delivery and the universal demand for high reliability products will continue to drive military and aerospace outsourcing during the next decade. Companies serving these markets are increasingly recognizing that their competitive advantage is designing unique solutions and not simply the mere manufacture and delivery of the finished product. We see similar trends developing in the health care sector where we are also adding new customers.

We believe that the financial turbulence will continue for most of 2010. The banking disruption has made us especially vigilant and we continuously assess and reassess our customers’ and suppliers’ financial condition and the prospects for their end markets. Most are doing quite well. Where they are not, we have taken appropriate action. In fiscal 2010 we anticipate continued growth in both sales and earnings which we expect to translate into greater shareholder value. Externally, we continue to review and pursue acquisitions. We see ourselves in a strong position to move forward on this front. Last year, we asked our shareholders for approval to execute a one, up to four, reverse split to position the Company to apply for listing on the NASDAQ Capital Market. We did not execute the reverse split and, instead, made the decision to list on the NYSE Amex exchange. We believe this listing has enabled us to attract a broader range of investors which in turn benefits all shareholders. In conclusion, we like what we see for the future. I thank everyone at IEC for their efforts and you, our shareholders, for your continued confidence and support. W. Barry Gilbert Chairman, IEC Electronics Corp.
4

5
MANAGEMENT'S DISCUSSION AND ANALYSIS OF FINANCIAL CONDITION AND RESULTS OF OPERATIONS The information in this Management's Discussion & Analysis should be read in conjunction with the accompanying financial statements, the related Notes to Consolidated Financial Statements and the Five-Year Summary of Financial Data. Forward-looking statements in this Management's Discussion and Analysis are qualified by the cautionary statement preceding Item 1 in our Form 10-K for the fiscal year ending September 30, 2009 which was filed with the Securities and Exchange Commission on November 13, 2009. Overview During 2004, we refocused our sales efforts on high technology products that are less likely to migrate to offshore suppliers due to proprietary technology content, governmental restriction or volume considerations. Since then we have continued to expand our business adding new customers and new markets. Our customer base is stronger and more diverse than ever. We continue to expand in areas we view as important for our continued growth. IEC is ISO-9001:2000 registered, and an NSA approved supplier under the COMSEC standard. Both IEC and Wire and Cable, our cable harness and interconnect business, are AS9100 certified to service the military and commercial aerospace market sector and ISO13485 certified to service the medical market sector. We have identified and gained entry into advantageous markets by leveraging our ability to provide products of the highest quality and reliability, including significantly complex, low-run volume assemblies. Currently, the markets we serve include military, governmental agencies, aerospace, communications, medical, computing and a variety of industrial sectors. During fiscal 2009 our backlog remained solid, an excellent result given the commercial turbulence of the last year. We closed the year with backlog of $41.4 million as compared to a fiscal 2008 closing backlog of $43.9 million. Backlog consists of two categories; orders, and firm forecasted commitments. We also receive orders during the quarter, to ship in the same period, that do not appear in our backlog information. Substantially, the entire current backlog is expected to be shipped within our current fiscal year. Variations in the magnitude and duration of contracts received by us, and customer delivery requirements may result in fluctuations in backlog from period to period. We continue to improve our internal bench strength and skills, our reliability testing capabilities and our machinery and equipment infrastructure to optimize production performance and effectively manage the steady growth in volume and complexity that we are experiencing. Despite the recessionary outlook for the economy, based upon cautiously optimistic comments from our customers in the military and aerospace sectors, we expect continued growth in both revenue and profitability throughout fiscal 2010. Analysis of Operations
Sales (dollars in millions) For Year Ended September 30, 2009 2008 2007 Net sales $ 67.8 $ 51.1 $ 40.9
IEC continues to experience strong top-line growth. Revenue has increased 33% over 2008 and 66% over the sales achieved in 2007. While the current fiscal year included twelve months of Wire and Cable revenues compared to four months in the previous fiscal year, the Company also enjoyed healthy organic growth in its core business. This significant growth has been fueled by the expansion of product offerings and by market segment diversification as discussed above. Because of our execution, our customers have rewarded us with ongoing programs and additional business. The ongoing programs have become a stable core of our operation. The most significant revenue growth in recent years has occurred for IEC in the aerospace, medical and industrial market sectors.
Gross Profit (dollars in thousands and as a % of Net Sales) For Year Ended September 30, 2009 2008 2007 Gross profit $ 10,826 $ 6,217 $ 3,877 Gross profit percent 16.0% 12.2 % 9.5%
IEC continues to show an increasing Gross Profit measured as a percentage of Net Sales. Versus the prior year, fiscal 2009 gross profit as a percentage of net sales improved over 2008 by 3.8%. Since fiscal 2007, the Company has increased its gross profit as a percentage of net sales by 6.5%. This trend of significant increase, at a materially higher revenue level, further demonstrates the strength of our Company. This improvement in gross margin was expected and was discussed in the 2007 year end SEC filing. In fiscal 2007 IEC transitioned from low volume prototype work to new programs with larger production volumes. The associated learning curves for new employees and for new products affected our efficiency and therefore our profitability. In fiscal 2008 and 2009 labor efficiency improved through effective training of production employees, investments in capital equipment that served to modernize some processes, and through further implementation of continuous improvement and lean manufacturing principles. Our workforce has expanded in size and in capability. Our continued increases in productivity and improvements in execution have resulted in further penetration into profitable market sectors.

6
Selling and Administrative Expense (dollars in thousands and as a % of Net Sales) For Year Ended September 30, 2009 2008 2007 Selling and administrative expense $ 6,007 $ 3,825 $ 2,892 Selling and administrative expense percent 8.9% 7.5 % 7.1%
Selling and administrative expenses as a percentage of sales increased to 8.9% in fiscal 2009. Fiscal 2009 included twelve months of Wire and Cable SG&A costs as compared to fiscal 2008 which included only four months of Wire and Cable SG&A costs. This accounts for $618 of the increase in SG&A costs. Incremental costs were also incurred in fiscal 2009 to strengthen our sales and marketing team. Sales commissions, advertising, public relations and travel costs were higher as would be expected with incremental sales efforts and our efforts to expand into newer markets. Additionally, costs were incurred to improve our information systems and technology infrastructure. We also have accrued for plant-wide performance-based incentives which includes a provision for the next segment of Mr. Gilbert’s contractual incentives.
Other Income and Expense (dollars in millions) For Year Ended September 30, 2009 2008 2007 Interest and financing expense $ 0.4 $ 0.5 $ 0.4 Other (income)/expense $ (0.3) $ 0.3 $ -
Interest and financing expense was reduced in 2009. Favorable interest rates and reduced debt levels resulted in lower financing costs. The Company has consistently remained ahead of schedule with respect to the reduction of debt associated with its acquisition of the Wire and Cable business. From fiscal year end 2008 to fiscal year end 2009 the Company’s debt was reduced by $2.3 million. Total cash available to reduce debt was offset by $1.8 million of capital investments and $2.0 million of payments to suppliers to capture discounts. We had “Other income” of $0.3 million during fiscal 2009 versus $0.3 million of “Other expense” in fiscal 2008. Other Income for the current year is comprised mainly of a refund of sales tax, penalties and accrued interest from the State of Alabama and the City of Arab, Alabama in settlement of a long standing dispute over a previous sales tax assessment. Additionally, we received a rebate on utilities associated with our recent capital project to reduce electricity usage for plant lighting.
Income Taxes (dollars in thousands) For Year Ended September 30, 2009 2008 2007 Effective tax (benefit) $ (238) $ (8,843 ) $ (372)
Our 2009 tax benefit included a $1.9 million reversal of the valuation allowance against our deferred tax asset. Our 2008 tax benefit included an $8.9 million reversal of the valuation allowance against our deferred tax asset. (See Note #4 in Notes to Consolidated Financial Statements) Liquidity and Capital Resources Cash Flow provided by (used in) operating activities was $3.0 million for the fiscal year ended September 30, 2009 compared to $0.1 million for fiscal 2008. The principal reason for this variance of $2.9 million versus prior year is the improvement in Net Income Before Tax. Improved cash inflows from collections on customer receivables was offset by cash used to reduced payables and capture vendor discounts which was a benefit to earnings.
Cash Flow provided by (used in) investing activities was ($1.8) million for the fiscal year end versus ($4.4) million for fiscal 2008. The prior year’s investing activities included the cash investment in Wire and Cable. During fiscal 2009 we invested ($1.8) million in new production equipment to improve efficiency and capacity. Cash Flow provided by (used in) financing activities was a use of ($1.2) million in fiscal 2009 versus a net source of cash of $4.4 million in fiscal 2008. In fiscal 2009 we reduced our term debt and our revolving debt by an aggregate total of $2.2 million. We also borrowed $0.8 million on our capital financing line of credit. The prior year included the funding from our new credit facility which enabled the acquisition of Wire and Cable.

7
At September 30, 2009 we had a $3.9 million balance under our revolving credit facility. The maximum borrowing limit under our revolving credit facility is limited to the lesser of (i) $9.0 million or (ii) an amount equal to the sum of 85% of the receivables borrowing base and 35% of the inventory borrowing base. On September 30, 2009, the remaining availability under the collateralized portion of our line of credit was $5.1 million. We believe that our liquidity is adequate to cover operating requirements for the next 12 months. The Company entered into a $14.2 million senior secured loan agreement (Credit Agreement) and Sale Leaseback agreement with Manufacturers and Traders Trust Company (M&T Bank) on May 30, 2008. The following is a summary of the Credit and Sale Leaseback agreements: A revolving credit facility up to $9.0 million, available for direct borrowings. The facility is based on a borrowing base formula
equal to the sum of 85% of eligible receivables and 35% of eligible inventory. As of September 30, 2009, outstanding loans under the revolving credit facility were $3.9 million. The credit facility matures on May 30, 2013. Interest on the revolver is either prime or a stated rate over LIBOR, whichever is lower based on certain ratios. On September 30, 2009 the interest rate on our revolving line balance was 1.75 %.
A $1.7 million term loan amortized equally over 60 months beginning July 2008. IEC’s interest rate is fixed at 6.7%. The
outstanding balance at September 30, 2009 was $0.8 million. One year prior, at September 30, 2008, the outstanding balance of our term loan was $1.1 million.
An available $1.5 million equipment line of credit. The capital credit facility is amortized equally over 60 months and matures on
May 30, 2013. Interest on the equipment line is either prime or a stated rate over LIBOR, whichever is lower based on certain ratios at the time of borrowing. Using this capital credit line the Company was able to secure additional interest rate subsidies from New York State’s Linked Deposit Program and has used a total of $0.8 million of the $1.5 million available line as of September 30, 2009. New equipment was purchased to continue driving our increased operating efficiencies. For the year ended September 30, 2009 the weighted average interest rate on capital financing was 3.08%. The outstanding balance at September 30, 2009 was $0.7 million.
A $2.0 million Sale Leaseback of the Company’s fixed assets amortized equally over 60 months beginning June 27, 2008. Annual
payments are fixed and are $388,800 per year with a total for the five years of $1.9 million. Assets sold had a cost of $15.6 million inclusive of $1.2 million of assets purchased during the nine months ended June 27, 2008, and an accumulated depreciation of $13.6 million. A minimal loss will be amortized over the five year period of the lease. At September 30, 2009 our remaining unpaid balance for the lease was $1.5 million compared to $1.8 million at September 30, 2008.
All loans and the Sale-Leaseback are secured by a security interest in the assets of the Company and Wire and Cable; a pledge of
all the Company’s equity interest in Wire and Cable, a negative pledge on the Company’s real property and a guaranty by Wire and Cable.
In connection with the acquisition of Wire and Cable and the payment of the purchase price to the sellers, a portion of the purchase price was paid in the form of promissory notes (the "Seller Notes") in the aggregate principal amount of $3.9 million with interest at the rate of 4% per annum. The remaining balance at September 30, 2009 is $2.2 million. The Company’s financing agreements contain various affirmative and negative covenants concerning the ratio of “EBITDARS” (Earnings Before Interest, Taxes, Depreciation, Amortization, Rent Expense under the Sale Leaseback and Stock Option Expense) to total debt and to fixed charges. These are calculated on a twelve month rolling basis. The Company must also maintain a minimum EBITDARS level of $350,000 per individual quarter. The Company was compliant with these covenants as of September 30, 2009. The table below provides details on the Company’s performance relative to each of the three covenants as of September 30, 2009:
Covenant Requirement Actual
Performance ▪ Minimum quarterly EBITDARS ≥ $ 350,000 $ 1,641,000 ▪ Fixed Charge Coverage ≥ 1.1 x 3.03x▪ Total Debt to EBITDARS < 3.75 x 1.56x
If evaluated on an annual basis rather than quarterly, the Company’s performance with respect to the “Minimum EBITDARS Covenant” was $5,902,000 versus a four-quarter aggregate required minimum of $1,400,000.

8
Application of Critical Accounting Policies Our financial statements and accompanying notes are prepared in accordance with generally accepted accounting principles in the United States. Preparing financial statements requires management to make estimates and assumptions that affect the reported amounts of assets, liabilities, revenue, and expenses. These estimates and assumptions are affected by management's application of accounting policies. Critical accounting policies for us include revenue recognition, provisions for doubtful accounts, provisions for inventory obsolescence, impairment of long-lived assets, accounting for legal contingencies and accounting for income taxes. FASB ASC 605-10 (Prior Authoritative Literature: Staff Accounting Bulletin No.101, "Revenue Recognition in Financial Statements."). Sales are recorded when products are shipped to customers. Provisions for discounts and rebates to customers, estimated returns and allowances and other adjustments are provided for in the same period the related sales are recorded. FASB ASC 360-10 (Prior Authoritative Literature: Statement of Financial Accounting Standards No. 144, "Accounting for the Impairment or Disposal of Long-Lived Assets), requires that we evaluate our long-lived assets for financial impairment on a regular basis. We evaluate the recoverability of long-lived assets not held for sale by measuring the carrying amount of the assets against the estimated undiscounted future cash flows associated with them. At the time such evaluations indicate that the future discounted cash flows of certain long-lived assets are not sufficient to recover the carrying value of such assets, the assets are adjusted to their fair values. FASB ASC 450-10 (Prior Authoritative Literature: Statement of Financial Accounting Standards No. 5, "Accounting for Contingencies"), requires that when, from time to time, we are subject to various legal proceedings and claims, the outcomes of which are subject to significant uncertainty, an estimated loss from a loss contingency should be accrued by a charge to income if it is probable that an asset has been impaired or a liability has been incurred and the amount of the loss can be reasonably estimated. Disclosure of a contingency is required if there is at least a reasonable possibility that a loss has been incurred. We evaluate, among other factors, the degree of probability of an unfavorable outcome and the ability to make a reasonable estimate of the amount of loss. Changes in these factors could materially impact our financial position or our results of operations. FASB ASC 740 (Prior Authoritative Literature: Statement of Financial Accounting Standards No. 109, "Accounting for Income Taxes"), establishes financial accounting and reporting standards for the effect of income taxes. The objectives of accounting for income taxes are to recognize the amount of taxes payable or refundable for the current year and deferred tax liabilities and assets for the future tax consequences of events that have been recognized in an entity's financial statements or tax returns. Judgment is required in assessing the future tax consequences of events that have been recognized in our financial statements or tax returns. Fluctuations in the actual outcome of these future tax consequences could impact our financial position or our results of operations. Impact of Inflation To date, the impact of inflation has been minimal due to the fact that we have been able to adjust many of our bids to reflect most inflationary increases in costs; however it is not clear this will continue and in turn could affect our margins. RECENTLY ISSUED ACCOUNTING STANDARDS FASB ASC 805 (Prior Authoritative Literature: Financial Accounting Standards Board Statement of Financial Accounting Standards (“SFAS”) No. 141(R), “Business Combinations”), establishes principles and requirements for how the acquirer recognizes and measures in its financial statements the identifiable assets acquired, the liabilities assumed, any non-controlling interest in the acquiree, recognizes and measures the goodwill acquired in the business combination or a gain from a bargain purchase, and determines what information to disclose to enable users of the financial statements to evaluate the nature and financial effects of the business combination. FASB ASC 805 is effective for fiscal years, and interim periods within those fiscal years, beginning on or after December 15, 2008. As such, the Company is required to adopt these provisions at the beginning of the fiscal year ended September 30, 2010. The Company is currently evaluating the impact of FASB ASC 805 but does not expect it to have a material effect on its consolidated financial statements. FASB ASC 810-10-65 (Prior Authoritative Literature: Financial Accounting Standards Board Statement of Financial Accounting Standard (“SFAS”) No. 160, "Non-controlling Interests in Consolidated Financial Statements, an amendment of ARB No. 51”), establishes accounting and reporting standards for the non-controlling interest in a subsidiary and for the deconsolidation of a subsidiary. FASB ASC 810-10-65 is effective for fiscal years, and interim periods within those fiscal years, beginning on or after December 15, 2008. As such, the Company is required to adopt these provisions at the beginning of the fiscal year ended September 30, 2010. The Company is currently evaluating the impact of FASB ASC 810-10-65 but does not expect it to have a material effect on its consolidated financial statements.
9
FASB ASC 855-10 (Prior Authoritative Literature: Financial Accounting Standards Board (“FASB”) Statement of Financial Accounting Standard (“SFAS”) No.165, "Subsequent Events"), establishes requirements for subsequent events. FASB ASC 855-10 is effective for interim or annual periods ending after June 15, 2009. The Company is required to adopt this standard in the current period. Adoption of FASB ASC 855 did not have a significant effect on the Company’s consolidated financial statements. QUANTITATIVE AND QUALITATIVE DISCLOSURES ABOUT MARKET RISK Quantitative and Qualitative Disclosures about Market Risk represents the risk of loss that may impact the financial position, results of operations or cash flows of IEC due to adverse changes in financial rates. We are exposed to market risk in the area of interest rates. One exposure is directly related to our Revolving Credit borrowings under the Credit Agreement, due to the variable interest rate pricing. Management believes that interest rate fluctuations will not have a material impact on IEC's results of operations.
MARKET FOR REGISTRANT’S COMMON EQUITY, RELATED STOCKHOLDER MATTERS, AND ISSUER PURCHASES OF EQUITY SECURITY
(a) Market Information. IEC's Common Stock began trading on the NYSE Amex on June 9, 2009 under the symbol "IEC". Prior to that, IEC's Common Stock was traded on The Over-the-Counter Bulletin Board ("OTCBB") under the symbol "IECE.OB". The following table sets forth, for the fiscal quarter indicated, the high and low closing sales prices for the Common Stock as reported on the OTCBB or NYSE Amex, as applicable. The quotations on the OTCBB reflect inter-dealer prices, without mark-up, mark-down or commission, and may not represent actual transactions.
Quarter High Low October 1, 2007 – December 28, 2007 $ 2.50 $ 1.60 December 29, 2007 – March 28, 2008 $ 1.90 $ 1.60 March 29, 2008 – June 27, 2008 $ 2.20 $ 1.50 June 28, 2008 – September 30, 2008 $ 2.20 $ 1.76 October 1, 2008 – December 26, 2008 $ 1.90 $ 1.40 December 27, 2008 – March 27, 2009 $ 1.60 $ 1.19 March 28, 2009 – June 26, 2009 $ 3.98 $ 1.35 June 27, 2009 – September 30, 2009 $ 7.45 $ 3.30
The closing price of IEC's Common Stock on the NYSE Amex on November 9, 2009, was $ 4.57 per share.
(b) Holders. As of November 9, 2009, there were approximately 165 holders of record of IEC's Common Stock, which does not include shareholders whose stock is held through securities position listings. Many of our shares of Common Stock are held in street name by brokers and other institutions, and we are unable to estimate the number of their beneficial stockholders.
(c) Dividends. IEC has never paid dividends on its Common Stock. It is the current policy of the Board of Directors of IEC to retain earnings for use in our business. Certain financial covenants set forth in IEC's current loan agreement prohibit IEC from paying cash dividends. We do not plan to pay cash dividends on our Common Stock in the foreseeable future.

10
(d) Securities Authorized for Issuance under Equity Compensation Plans
The following table sets forth information concerning IEC's equity compensation plans as of September 30, 2009. Number of securities Number of securities remaining available for to be issued upon Weighted-average future issuance under exercise of exercise price of equity compensation plans outstanding options, outstanding options, (excluding securities
Plan Category warrants and rights warrants and rights reflected in column (a)) (a)(2) (b) (c)(3) Equity compensation plans:
approved by security holders(1) 971,988 $ 1.10 602,786 not approved by security holders -0- N/A -0-
Total 971,988 $ 1.10 602,786
(1) Consists of IEC's 2001 Stock Option and Incentive Plan (the "2001 Plan") (2) Under the 2001 Plan, in addition to options, we have granted share-based compensation awards to outside directors, restricted stock awards, other stock-based awards and stock purchase programs. As of September 30, 2009, there were 545,602 such awards under the 2001 Plan, all of which shares were issued and outstanding. (3) These shares may be issued in the form of stock options, restricted stock, performance shares or other share-based awards. Issuance of Unregistered Securities: Not Applicable Repurchases of IEC Securities: We repurchased no shares during the last quarter of Fiscal 2009.

Corporate Performance Graph
The following graph and table show a comparison of cumulative total shareholder return for our common stock, the AMEX Market Index, the NASDAQ Market Index and a Peer Group Index for the year indicated as prescribed by SEC rules.
COMPARISON OF CUMULATIVE TOTAL RETURN (1) AMONG IEC ELECTRONICS CORP., AMEX MARKET INDEX,
NASDAQ MARKET INDEX, AND PEER GROUP INDEX (2)
$0
$100
$200
$300
$400
$500
$600
$700
$800
2004 2005 2006 2007 2008 2009
COMPANY NASDAQ AMEX PEER INDEX
2004 2005 2006 2007 2008 2009
Company 100$ 106$ 156$ 286$ 267$ 807$ NASDAQ 100$ 113$ 119$ 142$ 110$ 112$ AMEX 100$ 137$ 150$ 190$ 140$ 140$ Peer Index 100$ 123$ 110$ 111$ 82$ 65$
(1) Assumes $100 invested on September 30, 2004, in our common stock, the AMEX Market Index, the NASDAQ Market Index, and our constructed Peer Group Index.
(2) We constructed a Peer Group consisting of Labarge Inc., Nortech Systems Inc., Sigmatron International Inc., SMTC Corp., Sparton
Corporation, and Winland Electronics Inc.
The information contained in the above performance graph and table shall not be deemed “soliciting material” or “filed” with the SEC, or subject to the liabilities of Section 18 of the Securities Exchange Act of 1934, except to the extent that we specifically incorporate it by reference into such filing
11
12
IEC ELECTRONICS CORP. AND ITS SUBSIDIARIES CONSOLIDATED STATEMENTS OF OPERATIONS
FOR THE YEARS ENDED SEPTEMBER 30, 2009, 2008 AND 2007 (in thousands, except per share and share data)
2009 2008 2007 Net sales $ 67,811 $ 51,092 $ 40,914 Cost of sales 56,985 44,875 37,037
Gross profit 10,826 6,217 3,877
Selling and administrative expenses 6,007 3,825 2,892
Operating income 4,819 2,392 985
Interest and financing expense 389 452 440 Other (income)/expense (287 ) 306 42
Net income before income taxes 4,718 1,634 503 (Benefit from) income taxes (footnote #4) (238 ) (8,843) (372) Net income $ 4,956 $ 10,477 $ 875 Net income per common and common equivalent share:
Basic Income available to common shareholders $ 0.57 $ 1.22 $ 0.11
Diluted Income available to common shareholders $ 0.52 $ 1.12 $ 0.10 Weighted average number of common and common equivalent shares outstanding:
Basic 8,728,930 8,553,635 8,114,491
Diluted 9,553,526 9,337,097 8,895,819 The accompanying notes are an integral part of these financial statements.

13
FIVE YEAR SUMMARY (in thousands, except per share data)
Years Ended September 30, 2008 2007 2006 2005 2004 INCOME STATEMENT DATA Net sales $ 51,092 $ 40,914 $ 22,620 $ 19,066 $ 27,701 Gross profit (loss) $ 6,217 $ 3,877 $ 2,753 $ 2,630 $ 1,987 Operating income (loss) $ 2,392 $ 985 $ 598 $ 346 $ (759) Net income (loss) $ 10,477 $ 875 $ 215 $ 285 $ (828) Net income (loss) per common and common equivalent share:
Basic $ 1.22 $ 0.11 $ 0.03 $ 0.03 $ (0.10)Diluted $ 1.12 $ 0.10 $ 0.03 $ 0.03 $ (0.10)
Common and common equivalent shares
Basic 8,554 8,114 7,973 8,261 8,119 Diluted 9,337 8,896 8,276 8,571 8,119
BALANCE SHEET DATA Working capital $ 4,254 $ 2,970 $ 2,202 $ 2,038 $ 726 Total assets $ 33,520 $ 11,845 $ 11,718 $ 5,538 $ 8,530 Long-term debt, including current
maturities $ 10,008 $ 1,751 $ 4,164 $ 937 $ 2,366 Shareholders' equity $ 15,976 $ 4,163 $ 3,092 $ 3,020 $ 2,616
Note: Comparability of 2008 to prior year data is affected by the 2008 acquisition of Val-U-Tech.

14
IEC ELECTRONICS CORP. AND ITS SUBSIDIARIES CONSOLIDATED STATEMENTS OF COMPREHENSIVE INCOME AND SHAREHOLDERS' EQUITY
FOR THE YEARS ENDED SEPTEMBER 30, 2009, 2008 AND 2007 (in thousands)
Additional Retained Total Comprehensive Common Treasury Paid-In Earnings Shareholders Income Stock Stock Capital (Deficit) Equity BALANCE, September 30, 2006 $ 84 $ (223) $ 38,601 $ (35,370) $ 3,092 Shares issued and expensed Under Directors and Employee Stock Plan $ 3 - $ 193 - $ 196 Net Income $ 875 - - - $ 875 $ 875 Comprehensive income $ 875 BALANCE, September 30, 2007 $ 87 $ (223) $ 38,794 $ (34,495) $ 4,163 Shares issued and expensed Under Directors and Employee Stock Plan $ 1 - $ 285 - $ 286 Shares Issued for Wire and Cable Acquisition $ 5 - $ 1,045 - $ 1,050 Net Income $ 10,477 - - - $ 10,477 $ 10,477 Comprehensive income $ 10,477 BALANCE, September 30, 2008 $ 93 $ (223) $ 40,124 $ (24,018) $ 15,976 Shares issued and expensed Under Directors and Employee Stock Plan $ 4 - $ 508 - $ 512 Acquisition of Treasury Stock $ (1,190) $ (1,190) Net Income $ 4,956 - - - $ 4,956 $ 4,956 Comprehensive income $ 4,956 BALANCE, September 30, 2009 $ 97 $ (1,413) $ 40,632 $ (19,062) $ 20,254 The accompanying notes are an integral part of these financial statements.

15
IEC ELECTRONICS CORP. AND ITS SUBSIDIARIES CONSOLIDATED STATEMENTS OF CASH FLOWS
FOR THE YEARS ENDED SEPTEMBER 30, 2009, 2008 AND 2007 (in thousands)
2009 2008 2007
CASH FLOWS FROM OPERATING ACTIVITIES: Net income $ 4,956 $ 10,477 $ 875Non-cash adjustments:
Compensation Expense - Stock Options 131 195 80Depreciation and amortization (See Note#3) 282 378 410(Gain) loss on sale of fixed assets (5 ) 1 17Issuance of directors fees in stock 44 35 41Changes in operating assets and liabilities:
Accounts receivable (9 ) (2,497) (1,244)Inventories (260 ) (595) 1,788Deferred income taxes (335 ) (9,014) (390)Other assets (46 ) (23) 62Accounts payable (1,942 ) 761 1,084Accrued expenses 685 333 385Customer Deposits (475 ) - -Net cash flows from operating activities 3,026 51 3,108
CASH FLOWS FROM INVESTING ACTIVITIES:
Proceeds from sale of property 11 2,002 17Cash Paid for Acquisition of Subsidiary - (5,500) -Cash Received upon Acquisition of Subsidiary - 544 -Purchases of property, plant and equipment (1,816 ) (1,434) (787)Capitalized acquisition costs paid - (54) -
Net cash flows from investing activities (1,805 ) (4,442) (770) CASH FLOWS FROM FINANCING ACTIVITIES:
Net Borrowings (Repayments) on Revolver (1,110 ) 3,964 (2,558)Repayments on Term Debt (1,135 ) (1,501) (305)Borrowings from Capital and Term Debt 828 1,903 450Proceeds from exercise of stock options 196 89 75Capitalized financing costs - (64) -
Net cash flows from financing activities (1,221 ) 4,391 (2,338) Change in cash and cash equivalents - - -Cash and cash equivalents, beginning of year - - -Cash and cash equivalents, end of year $ - $ - $ - SUPPLEMENTAL DISCLOSURES OF CASH FLOW INFORMATION:
Cash paid during the year for: Interest $ 419 $ 452 $ 427Income taxes, net of refunds received 26 3 3
SUPPLEMENTAL DISCLOSURE OF NON-CASH INVESTING AND FINANCING Wire and Cable Assets and Liabilities acquired:
Net Accounts Receivable $ - $ 1,663 $ -Net Inventories - 1,645 -Net Fixed Assets - 175 -Deferred Tax Assets -1,894 6,981 -Other Assets - 489 -Accounts Payable - -428 -Accrued Expenses - -83 -Seller Notes 844 -3,892 -Stock issued to Sellers 1,050 -1,050 -Cash Paid to Sellers - 5,500 -
Return Exercised Option to Treasury 140 - -
The accompanying notes are an integral part of these financial statements.
16
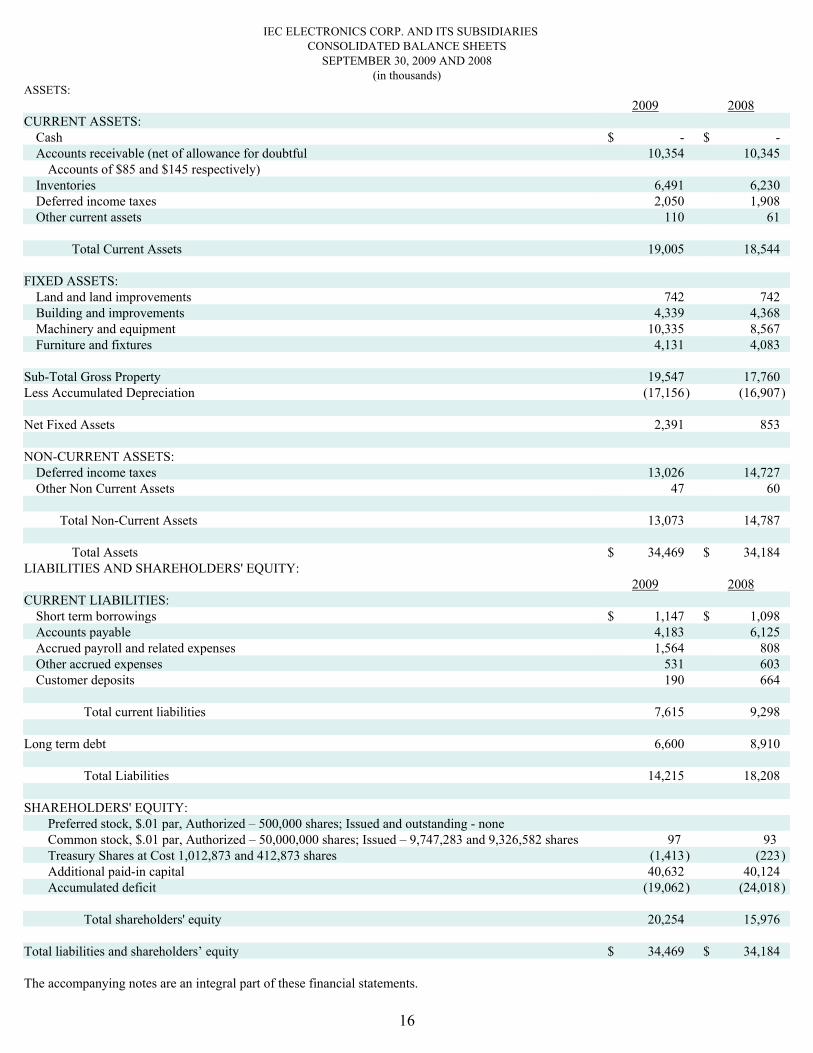
IEC ELECTRONICS CORP. AND ITS SUBSIDIARIES CONSOLIDATED BALANCE SHEETS
SEPTEMBER 30, 2009 AND 2008 (in thousands)
ASSETS: 2009 2008 CURRENT ASSETS:
Cash $ - $ - Accounts receivable (net of allowance for doubtful 10,354 10,345
Accounts of $85 and $145 respectively) Inventories 6,491 6,230 Deferred income taxes 2,050 1,908 Other current assets 110 61
Total Current Assets 19,005 18,544
FIXED ASSETS:
Land and land improvements 742 742 Building and improvements 4,339 4,368 Machinery and equipment 10,335 8,567 Furniture and fixtures 4,131 4,083
Sub-Total Gross Property 19,547 17,760 Less Accumulated Depreciation (17,156) (16,907) Net Fixed Assets 2,391 853 NON-CURRENT ASSETS:
Deferred income taxes 13,026 14,727 Other Non Current Assets 47 60
Total Non-Current Assets 13,073 14,787
Total Assets $ 34,469 $ 34,184
LIABILITIES AND SHAREHOLDERS' EQUITY: 2009 2008 CURRENT LIABILITIES:
Short term borrowings $ 1,147 $ 1,098 Accounts payable 4,183 6,125 Accrued payroll and related expenses 1,564 808 Other accrued expenses 531 603 Customer deposits 190 664
Total current liabilities 7,615 9,298
Long term debt 6,600 8,910
Total Liabilities 14,215 18,208 SHAREHOLDERS' EQUITY:
Preferred stock, $.01 par, Authorized – 500,000 shares; Issued and outstanding - none Common stock, $.01 par, Authorized – 50,000,000 shares; Issued – 9,747,283 and 9,326,582 shares 97 93 Treasury Shares at Cost 1,012,873 and 412,873 shares (1,413) (223)Additional paid-in capital 40,632 40,124 Accumulated deficit (19,062) (24,018)
Total shareholders' equity 20,254 15,976
Total liabilities and shareholders’ equity $ 34,469 $ 34,184 The accompanying notes are an integral part of these financial statements.
17
NOTES TO CONSOLIDATED FINANCIAL STATEMENTS SEPTEMBER 30, 2009, 2008 AND 2007 1. BUSINESS AND SUMMARY OF SIGNIFICANT ACCOUNTING POLICIES: Business IEC Electronics Corp.,("IEC", "we", "our", “us” the “Company”), is a premier provider of electronic manufacturing services,(“EMS”), to advanced technology companies. We specialize in the custom manufacture of high reliability, complex circuit cards, system level assemblies and a wide array of custom cable/wire harness assemblies. We excel where quality is paramount and where low to medium volume, high mix production is the norm. We utilize state-of-the art, automated circuit card assembly equipment coupled with a full complement of high reliability manufacturing stress testing technologies. We have created a “high intensity response culture” to react and adapt to our customer’s ever-changing needs. Our customer focused approach offers a high degree of flexibility while simultaneously complying with the industry’s rigorous quality and on-time delivery standards. As an extension of our customer’s operation, we have applied industry leading Six Sigma and Lean Manufacturing principles to eliminate waste and lower our customer’s total cost of ownership. While many EMS services are viewed as a commodity, we have set ourselves apart through an uncommon mix of features including: A world class Technology Center that combines a dedicated prototype manufacturing center with an on-site Materials Analysis Lab
(headed by a staff PhD) for the seamless introduction of complex electronics A sophisticated Lean/Sigma continuous improvement program supported by five certified Six Sigma Blackbelts delivering best-in-
class results Industry-leading Web Portal providing real-time access to a wide array of critical customer data In-house custom functional test development to support complex system-level assembly, test, troubleshoot and end-order fulfillment Fiscal Calendar The Company’s fiscal quarters end on the last Friday of the final month of each quarter, except that our fiscal year ends on September 30. Change of Name of Wholly Owned Subsidiary Effective June 17, 2009 the name of IEC Electronics’ wholly owned subsidiary, formerly known as Val-U-Tech Corp., was changed to IEC Electronics Wire and Cable, Inc. (“Wire and Cable”) Consolidation The consolidated financial statements include the accounts of IEC and its wholly owned subsidiary, Wire and Cable, from May 31, 2008. All significant inter-company transactions and accounts have been eliminated. Reclassifications Certain amounts in the prior year financial statements have been reclassified to conform with the current year presentation. Customer deposits for raw materials, previously shown as offsets to inventory, have been reclassified on the balance sheet as Other Current Liabilities. Cash and Cash Equivalents The Company’s cash received is applied against its revolving line of credit on a daily basis reducing interest expense. Cash and cash equivalents include highly liquid investments with original maturities of three months or less. The Company's cash and cash equivalents are held and managed by institutions which follow the Company's investment policy. The fair value of the Company's financial instruments approximates carrying amounts due to the relatively short maturities and variable interest rates of the instruments, which approximate current market interest rates.

18
Allowance for Doubtful Accounts The Company establishes an allowance for uncollectable trade accounts receivable based on the age of outstanding invoices and management’s evaluation of collectability of outstanding balances. Inventory Valuation Inventories are stated at the lower of weighted average cost (first-in, first-out) or market. The Company regularly assesses slow-moving, excess and obsolete inventory and maintains a balance sheet reserve against these risks. Property, Plant and Equipment Property, plant, and equipment are stated at cost and are depreciated over various estimated useful lives using the straight-line method.
Maintenance and repairs are charged to expense as incurred; renewals and improvements are capitalized. At the time of retirement or other disposition of property, plant, and equipment, the cost and accumulated depreciation are removed from the accounts and any gain or loss is reflected in other income.
Depreciation and amortization was $0.3 million, $0.4 million, and $0.4 million for the years ended September 30, 2009, 2008 and 2007, respectively. The principal depreciation and amortization lives used are as follows: Description
Estimated Useful Lives
Land improvements 10 years Buildings and improvements 5 to 40 years Machinery and equipment 3 to 5 years Furniture and fixtures 3 to 7 years
Long-Lived Assets FASB ASC 360-10 (Prior Authoritative Literature: Statement of Financial Accounting Standards No. 144, "Accounting for the Impairment or Disposal of Long-Lived Assets), requires that we evaluate our long-lived assets for financial impairment on a regular basis. We evaluate the recoverability of long-lived assets not held for sale by measuring the carrying amount of the assets against the estimated undiscounted future cash flows associated with them. At the time such evaluations indicate that the future discounted cash flows of certain long-lived assets are not sufficient to recover the carrying value of such assets, the assets are adjusted to their fair values. Fair Value of Financial Instruments Financial instruments consist of cash and cash equivalents, accounts receivable and payable, accrued liabilities, and debt. The carrying amount of cash and cash equivalents, accounts receivable, accounts payable and accrued liabilities approximate fair value. The fair value of the Company's debt is estimated based upon similar market rate debt issues. Revenue Recognition FASB ASC 605-10 (Prior Authoritative Literature: Staff Accounting Bulletin No.101, "Revenue Recognition in Financial Statements."). Sales are recorded when products are shipped to customers. Provisions for discounts and rebates to customers, estimated returns and allowances and other adjustments are provided for in the same period the related sales are recorded. The Company’s net revenue is derived from the sale of electronic products built to customer specifications. The Company also derives revenue from design services and repair work. Revenue from sales is generally recognized, net of estimated product return costs, when goods are shipped; title and risk of ownership have passed; the price to the buyer is fixed or determinable; and recovery is reasonable assured. Service related revenues are recognized upon completion of the services. The Company assumes no significant obligations after product shipment. Stock Based Compensation FASB ASC 718 (Prior Authoritative Literature: SFAS No. 123(R), Share-Based Payment), requires the measurement of the cost of employee services received in exchange for an award of equity instruments based on the grant-date fair value of the award. The cost is recognized over the period during which an employee is required to provide service in exchange for the award.

19
Income Tax/Deferred Tax Policy FASB ASC 740 (Prior Authoritative Literature: SFAS No. 109, Accounting for Income Taxes), requires recognition of deferred tax assets and liabilities for the expected future tax consequences of events that have been included in the financial statements or tax returns. Under this method, deferred tax assets and liabilities are determined based on differing treatment of items for financial reporting and income tax reporting purposes. The deferred tax balances are adjusted to reflect tax rates by tax jurisdiction, based on currently enacted tax laws, which will be in effect in the years in which the temporary differences are expected to reverse. We have provided deferred income tax benefits on net operating loss carry-forwards to the extent we believe we will be able to utilize them in future tax filings. Earnings Per Share FASB ASC 260 (Prior Authoritative Literature: SFAS No. 128, "Earnings Per Share"). Basic earnings per common share are calculated by dividing income available to common shareholders by the weighted-average number of common shares outstanding for each period. Diluted earnings per common share are calculated by adjusting the weighted-average shares outstanding assuming conversion of all potentially dilutive stock options, warrants and convertible securities. Use of Estimates The preparation of financial statements in conformity with generally accepted accounting principles requires management to make estimates and assumptions that affect the reported amount Of assets and liabilities, the disclosure of contingent assets and liabilities at the date of the financial statements, and the reported amounts of revenues and expenses during the reporting period. Actual results could differ from those estimates. RECENTLY ISSUED ACCOUNTING STANDARDS FASB ASC 805 (Prior Authoritative Literature: Financial Accounting Standards Board Statement of Financial Accounting Standards (“SFAS”) No. 141(R), “Business Combinations”), establishes principles and requirements for how the acquirer recognizes and measures in its financial statements the identifiable assets acquired, the liabilities assumed, any non-controlling interest in the acquiree, recognizes and measures the goodwill acquired in the business combination or a gain from a bargain purchase, and determines what information to disclose to enable users of the financial statements to evaluate the nature and financial effects of the business combination. FASB ASC 805 is effective for fiscal years, and interim periods within those fiscal years, beginning on or after December 15, 2008. As such, the Company is required to adopt these provisions at the beginning of the fiscal year ended September 30, 2010. The Company is currently evaluating the impact of FASB ASC 805 but does not expect it to have a material effect on its consolidated financial statements. FASB ASC 810-10-65 (Prior Authoritative Literature: Financial Accounting Standards Board Statement of Financial Accounting Standard (“SFAS”) No. 160, "Non-controlling Interests in Consolidated Financial Statements, an amendment of ARB No. 51”), establishes accounting and reporting standards for the non-controlling interest in a subsidiary and for the deconsolidation of a subsidiary. FASB ASC 810-10-65 is effective for fiscal years, and interim periods within those fiscal years, beginning on or after December 15, 2008. As such, the Company is required to adopt these provisions at the beginning of the fiscal year ended September 30, 2010. The Company is currently evaluating the impact of FASB ASC 810-10-65 but does not expect it to have a material effect on its consolidated financial statements. FASB ASC 855-10 (Prior Authoritative Literature: Financial Accounting Standards Board (“FASB”) Statement of Financial Accounting Standard (“SFAS”) No.165, "Subsequent Events"), establishes requirements for subsequent events. FASB ASC 855-10 is effective for interim or annual periods ending after June 15, 2009. The Company is required to adopt this standard in the current period. Adoption of FASB ASC 855 did not have a significant effect on the Company’s consolidated financial statements. 2. INVENTORIES Inventories are stated at the lower of weighted average cost (first-in, first-out) or market. The Company regularly assesses slow-moving, excess and obsolete inventory and maintains a balance sheet reserve against these risks. The major classifications of inventories are as follows at period end (in thousands): 2009 2008 Raw Materials $ 3,365 $ 3,775 Work-in-process 2,555 1,743 Finished goods 571 712 $ 6,491 $ 6,230 The Company negotiates deposits from customers covering its raw material exposure when the customer significantly delays its original shipping date. These customer deposits, when received, are carried as other current liabilities on the balance sheet. Current customer deposits total $190,000 and $664,000 at September 30, 2009 and 2008, respectively.
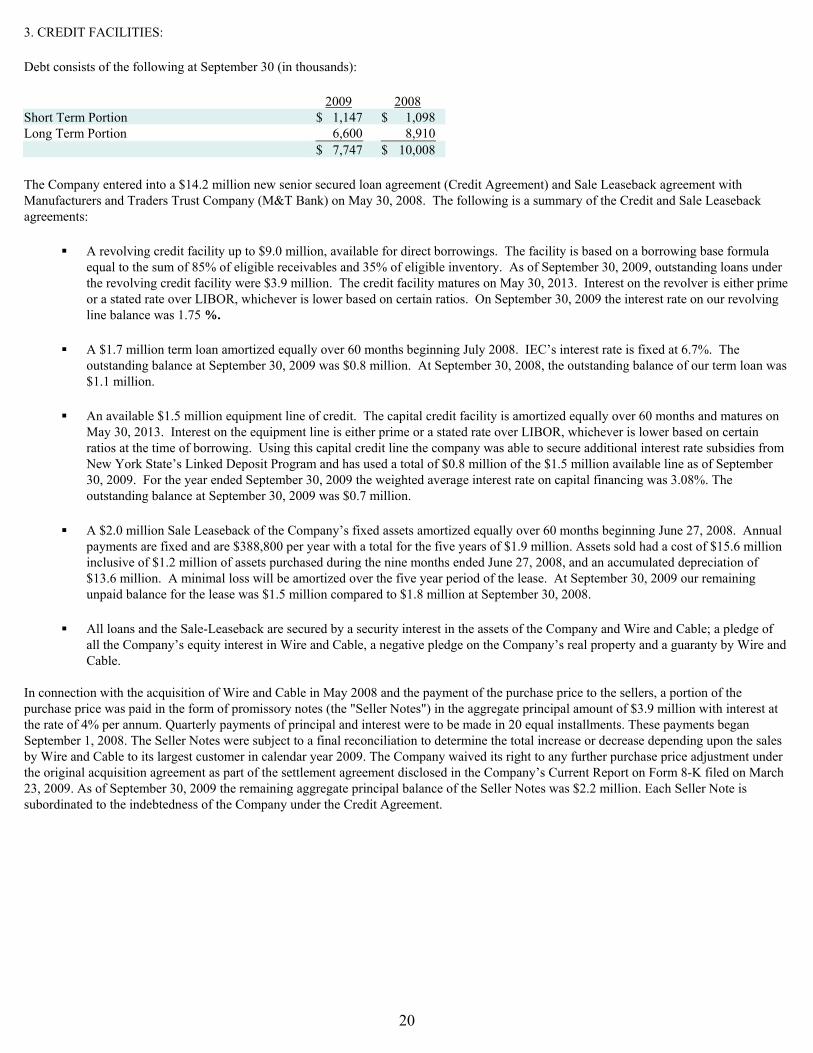
20
3. CREDIT FACILITIES: Debt consists of the following at September 30 (in thousands): 2009 2008 Short Term Portion $ 1,147 $ 1,098 Long Term Portion 6,600 8,910 $ 7,747 $ 10,008 The Company entered into a $14.2 million new senior secured loan agreement (Credit Agreement) and Sale Leaseback agreement with Manufacturers and Traders Trust Company (M&T Bank) on May 30, 2008. The following is a summary of the Credit and Sale Leaseback agreements: A revolving credit facility up to $9.0 million, available for direct borrowings. The facility is based on a borrowing base formula
equal to the sum of 85% of eligible receivables and 35% of eligible inventory. As of September 30, 2009, outstanding loans under the revolving credit facility were $3.9 million. The credit facility matures on May 30, 2013. Interest on the revolver is either prime or a stated rate over LIBOR, whichever is lower based on certain ratios. On September 30, 2009 the interest rate on our revolving line balance was 1.75 %.
A $1.7 million term loan amortized equally over 60 months beginning July 2008. IEC’s interest rate is fixed at 6.7%. The
outstanding balance at September 30, 2009 was $0.8 million. At September 30, 2008, the outstanding balance of our term loan was $1.1 million.
An available $1.5 million equipment line of credit. The capital credit facility is amortized equally over 60 months and matures on
May 30, 2013. Interest on the equipment line is either prime or a stated rate over LIBOR, whichever is lower based on certain ratios at the time of borrowing. Using this capital credit line the company was able to secure additional interest rate subsidies from New York State’s Linked Deposit Program and has used a total of $0.8 million of the $1.5 million available line as of September 30, 2009. For the year ended September 30, 2009 the weighted average interest rate on capital financing was 3.08%. The outstanding balance at September 30, 2009 was $0.7 million.
A $2.0 million Sale Leaseback of the Company’s fixed assets amortized equally over 60 months beginning June 27, 2008. Annual
payments are fixed and are $388,800 per year with a total for the five years of $1.9 million. Assets sold had a cost of $15.6 million inclusive of $1.2 million of assets purchased during the nine months ended June 27, 2008, and an accumulated depreciation of $13.6 million. A minimal loss will be amortized over the five year period of the lease. At September 30, 2009 our remaining unpaid balance for the lease was $1.5 million compared to $1.8 million at September 30, 2008.
All loans and the Sale-Leaseback are secured by a security interest in the assets of the Company and Wire and Cable; a pledge of
all the Company’s equity interest in Wire and Cable, a negative pledge on the Company’s real property and a guaranty by Wire and Cable.
In connection with the acquisition of Wire and Cable in May 2008 and the payment of the purchase price to the sellers, a portion of the purchase price was paid in the form of promissory notes (the "Seller Notes") in the aggregate principal amount of $3.9 million with interest at the rate of 4% per annum. Quarterly payments of principal and interest were to be made in 20 equal installments. These payments began September 1, 2008. The Seller Notes were subject to a final reconciliation to determine the total increase or decrease depending upon the sales by Wire and Cable to its largest customer in calendar year 2009. The Company waived its right to any further purchase price adjustment under the original acquisition agreement as part of the settlement agreement disclosed in the Company’s Current Report on Form 8-K filed on March 23, 2009. As of September 30, 2009 the remaining aggregate principal balance of the Seller Notes was $2.2 million. Each Seller Note is subordinated to the indebtedness of the Company under the Credit Agreement.
21
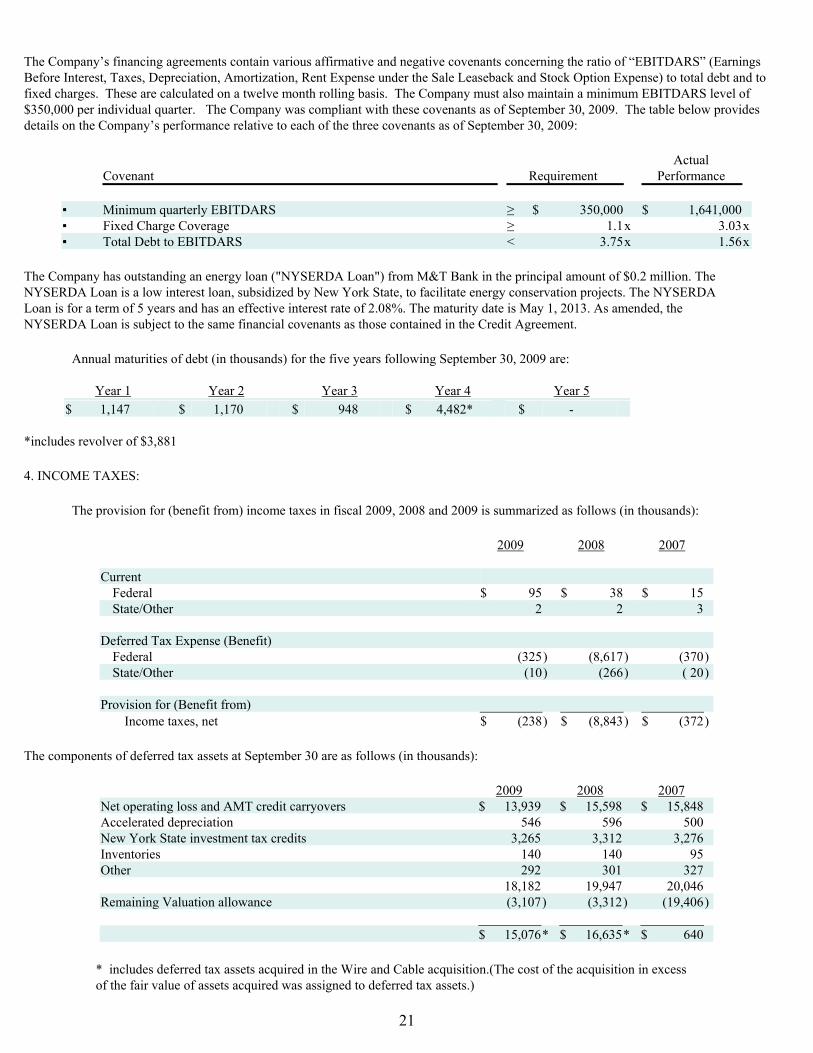
The Company’s financing agreements contain various affirmative and negative covenants concerning the ratio of “EBITDARS” (Earnings Before Interest, Taxes, Depreciation, Amortization, Rent Expense under the Sale Leaseback and Stock Option Expense) to total debt and to fixed charges. These are calculated on a twelve month rolling basis. The Company must also maintain a minimum EBITDARS level of $350,000 per individual quarter. The Company was compliant with these covenants as of September 30, 2009. The table below provides details on the Company’s performance relative to each of the three covenants as of September 30, 2009:
Covenant Requirement Actual
Performance ▪ Minimum quarterly EBITDARS ≥ $ 350,000 $ 1,641,000 ▪ Fixed Charge Coverage ≥ 1.1 x 3.03x▪ Total Debt to EBITDARS < 3.75 x 1.56x
The Company has outstanding an energy loan ("NYSERDA Loan") from M&T Bank in the principal amount of $0.2 million. The NYSERDA Loan is a low interest loan, subsidized by New York State, to facilitate energy conservation projects. The NYSERDA Loan is for a term of 5 years and has an effective interest rate of 2.08%. The maturity date is May 1, 2013. As amended, the NYSERDA Loan is subject to the same financial covenants as those contained in the Credit Agreement.
Annual maturities of debt (in thousands) for the five years following September 30, 2009 are:
Year 1 Year 2 Year 3 Year 4 Year 5 $ 1,147 $ 1,170 $ 948 $ 4,482* $ -
*includes revolver of $3,881 4. INCOME TAXES:
The provision for (benefit from) income taxes in fiscal 2009, 2008 and 2009 is summarized as follows (in thousands):
2009 2008 2007 Current
Federal $ 95 $ 38 $ 15 State/Other 2 2 3
Deferred Tax Expense (Benefit)
Federal (325) (8,617 ) (370)State/Other (10) (266 ) ( 20)
Provision for (Benefit from)
Income taxes, net $ (238) $ (8,843 ) $ (372) The components of deferred tax assets at September 30 are as follows (in thousands):
2009 2008 2007 Net operating loss and AMT credit carryovers $ 13,939 $ 15,598 $ 15,848 Accelerated depreciation 546 596 500 New York State investment tax credits 3,265 3,312 3,276 Inventories 140 140 95 Other 292 301 327 18,182 19,947 20,046 Remaining Valuation allowance (3,107) (3,312 ) (19,406) $ 15,076* $ 16,635 * $ 640
* includes deferred tax assets acquired in the Wire and Cable acquisition.(The cost of the acquisition in excess of the fair value of assets acquired was assigned to deferred tax assets.)

22
The Company has a net operating loss carry-forward of $39.1 million (expiring in years through 2025). The Company has available approximately $5.0 million in New York State investment tax credits (expiring in years through 2017). FASB ASC 740 requires the Company to establish an asset on the balance sheet to reflect the future value associated with the ability to utilize these losses and credits against future income tax obligations. At the end of the first quarter of fiscal 2009, and as described in the Company’s Quarterly Report on Form 10-Q for the three month period ended December 26, 2008, the Company decreased the Seller Notes by $844,000 based upon the terms and conditions of the Wire and Cable acquisition agreement. The offset to the Seller Note decrease was a reduction of the Company’s deferred tax asset. Subsequently, during the second quarter of fiscal 2009, as part of its settlement agreement with Wire and Cable, the Company received back the 500,000 shares of IEC stock, with a value of $1,050,000, that had been issued to the sellers of Wire and Cable as part of the purchase price. The settlement agreement with Wire and Cable is described in the Company’s Current Report on Form 8-K, filed on March 23, 2009. The offset to the increase in treasury stock was an additional reduction of the Company’s deferred tax asset. FASB ASC 740 requires that the company establish an asset on the balance sheet to reflect the future value associated with the Company’s ability to utilize its past losses and credits against future income tax obligations. To comply with FASB ASC 740 the Company performed an interim evaluation of its deferred tax asset valuation allowance and, based upon expected performance, determined that there is a high probability that the majority of the deferred tax asset would be utilized. Accordingly, adjustments to deferred tax assets, as noted above, were credited to income tax expense in the current quarter. A valuation allowance of $3,107,000 remains appropriate due to the Company's probable inability to realize the majority of the tax benefits from New York State investment tax credits. These credits fully expire in 2017 and cannot be used until the Company exhausts all of its NY State net operating loss carry-forwards for state taxes. Due to a low allocation of income to New York, our effective state tax rate is minimal. Therefore it is unlikely that the Company will use 100% of its state net operating losses before 2017. The differences between the effective tax rates and the statutory federal income tax rates for fiscal years 2009, 2008 and 2007 are summarized as follows:
2009 2008 2007 Federal Tax at statutory rates 34.0% 34.0 % 34.0%State tax, net of Federal Benefit 1.0 1.0 5.0 Carryforwards - - - Valuation Allowance (40.0) (576.2 ) (39.0) (5.0)% (541.2 )% -%
5. Stock Based Compensation
a.) Stock Option Plan
Under IEC's 2001 Stock Option and Incentive Plan (the "2001 Plan"), officers, key employees, directors and other key individuals may be granted various types of equity awards, including stock options, restricted stock and other stock awards. The option price for incentive options must be at least 100 percent of the fair market value at date of grant, or if the holder owns more than 10 percent of total common stock outstanding at the date of grant, then not less than 110 percent of the fair market value at the date of grant. Stock options issued to employees under the 2001 Plan generally terminate seven years from date of grant. Generally, incentive stock options granted during the period between July 2002 through January 2007 vest in annual increments of 25 percent. Starting in March 2007, some incentive stock options were granted that vest 50% after three years from the date of grant, and 50% after four years from the date of grant. In fiscal 2005, the Board of Directors granted certain incentive stock options that vest on the attainment of certain performance goals rather than on the basis of time. Nonqualified stock options granted to directors during fiscal years 2002 through 2009 vest in increments of 33 1/3 percent six months, one year, and two years from the date of grant. The fair value of options issued during fiscal years 2007 through 2009 was estimated on the date of grant using the Black-Scholes option pricing model with the following weighted average assumptions:
2009 2008 2007 Risk free interest rate 2.25% 2.7 % 4.8 %Expected term 4.5 years 4.7 years 5.0 years Volatility 66% 50 % 52 %Expected annual dividends none none none
23
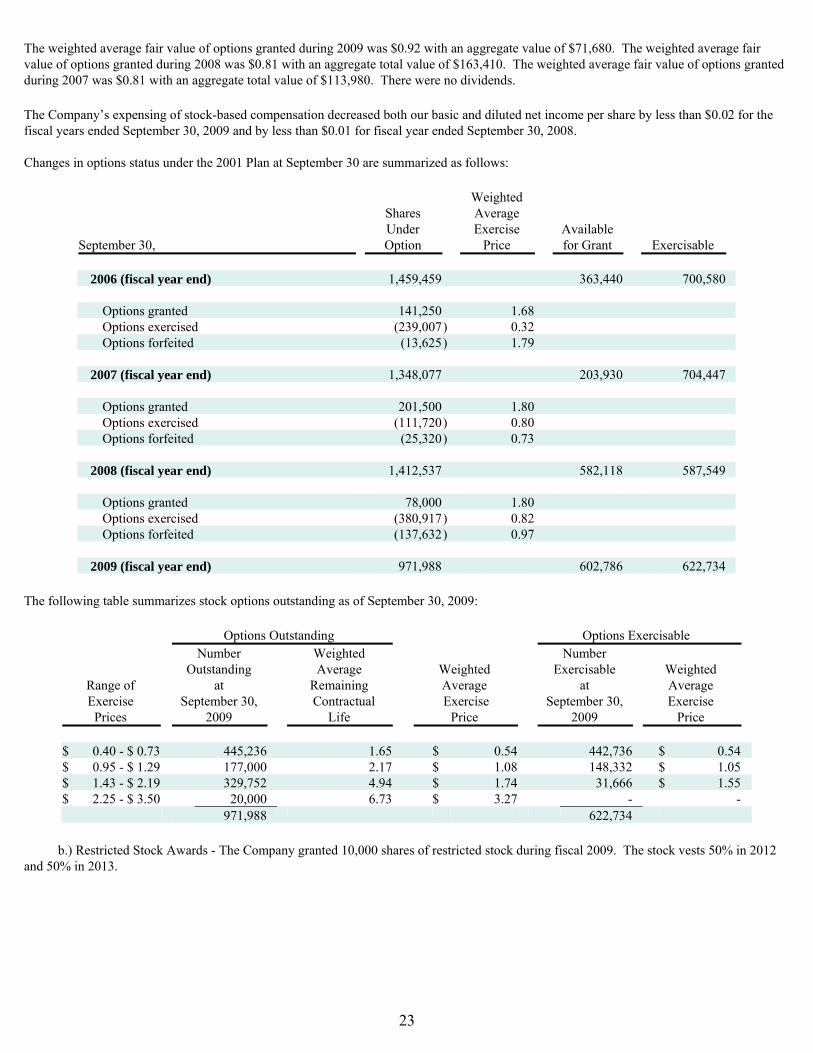
The weighted average fair value of options granted during 2009 was $0.92 with an aggregate value of $71,680. The weighted average fair value of options granted during 2008 was $0.81 with an aggregate total value of $163,410. The weighted average fair value of options granted during 2007 was $0.81 with an aggregate total value of $113,980. There were no dividends. The Company’s expensing of stock-based compensation decreased both our basic and diluted net income per share by less than $0.02 for the fiscal years ended September 30, 2009 and by less than $0.01 for fiscal year ended September 30, 2008. Changes in options status under the 2001 Plan at September 30 are summarized as follows:
Weighted Shares Average Under Exercise Available September 30, Option Price for Grant Exercisable
2006 (fiscal year end) 1,459,459 363,440 700,580
Options granted 141,250 1.68 Options exercised (239,007) 0.32 Options forfeited (13,625) 1.79
2007 (fiscal year end) 1,348,077 203,930 704,447
Options granted 201,500 1.80 Options exercised (111,720) 0.80 Options forfeited (25,320) 0.73
2008 (fiscal year end) 1,412,537 582,118 587,549
Options granted 78,000 1.80 Options exercised (380,917) 0.82 Options forfeited (137,632) 0.97
2009 (fiscal year end) 971,988 602,786 622,734
The following table summarizes stock options outstanding as of September 30, 2009:
Options Outstanding Options Exercisable Number Weighted Number Outstanding Average Weighted Exercisable Weighted
Range of at Remaining Average at Average Exercise September 30, Contractual Exercise September 30, Exercise Prices 2009 Life Price 2009 Price
$ 0.40 - $ 0.73 445,236 1.65 $ 0.54 442,736 $ 0.54 $ 0.95 - $ 1.29 177,000 2.17 $ 1.08 148,332 $ 1.05 $ 1.43 - $ 2.19 329,752 4.94 $ 1.74 31,666 $ 1.55 $ 2.25 - $ 3.50 20,000 6.73 $ 3.27 - - 971,988 622,734
b.) Restricted Stock Awards - The Company granted 10,000 shares of restricted stock during fiscal 2009. The stock vests 50% in 2012
and 50% in 2013.

24
6. MAJOR CUSTOMER CONCENTRATIONS and CREDIT RISK: Five customers accounted for 55% of our revenue during the fiscal year ended September 30, 2009. No single customer exceeded 15% of total Company sales revenue for the current fiscal year. Comparatively, five customers accounted for 62% and 61% of our revenue during the fiscal years ended September 30, 2008 and September 30, 2007 respectively. For fiscal 2008 and 2007, no single customer exceeded 25% of total Company sales revenue. At September 30, 2009, amounts due from two customers represented 14 percent and 10 percent of trade accounts receivable. At September 30, 2008, amounts due from two customers represented 24 and 14 percent of trade accounts receivable. At September 30, 2007, amounts due from two customers represented 28 and 19 percent of trade accounts receivable. The Company performs ongoing credit evaluations of its customers' financial positions payment history and generally does not require collateral. 7. LITIGATION: There are no material legal proceedings pending to which IEC or its subsidiary is a party or of which any of their property is the subject. To our knowledge, there are no material legal proceedings to which any director, officer or affiliate of IEC, or any beneficial owner of more than five percent (5%) of Common Stock of IEC, or any associate of any of the foregoing, is a party adverse to IEC or its subsidiary or has a material interest adverse to IEC or its subsidiary. 8. COMMITMENTS AND CONTINGENCIES: Operating Leases - The Company is obligated under non-cancelable operating leases, primarily for manufacturing equipment, buildings, and office equipment. The buildings are leased under a non-cancelable operating lease which expires in December 2012. These operating leases generally contain renewal options and provisions for payment of the lease by the Company for executory costs (taxes, maintenance and insurance). Annual minimum lease obligations are approximated as follows:
Fiscal Year Amount 2010 628,521 2011 636,242 2012 638,814 2013 368,708
Total minimum lease payments $ 2,272,285
9. RETIREMENT PLAN: The Company has a retirement savings plan, established pursuant to Sections 401(a) and 401(k) of the Internal Revenue Code. This plan is for the exclusive benefit of its eligible employees and beneficiaries. Eligible employees may elect to contribute a portion of their compensation each year to the plan. The plan allows the Company to make discretionary contributions as determined by the Board of Directors. There were no discretionary contributions for fiscal 2009, 2008, or 2007. 10. SUBSEQUENT EVENTS: There have been no material subsequent events. Subsequent events were evaluated through November 12, 2009, the date these financial statements were issued.

25
SELECTED QUARTERLY FINANCIAL DATA (UNAUDITED) First Second Third Fourth Quarter Quarter Quarter Quarter (in thousands, except per share data) YEAR ENDED SEPTEMBER 30,2009:
Net sales $ 15,857 $ 16,335 $ 17,346 $ 18,273 Gross profit 2,233 2,607 2,790 3,196 Net income 532 2,618 903 903
Basic earnings per share $ 0.06 $ 0.30 $ 0.11 $ 0.10 Diluted earnings per share $ 0.06 $ 0.29 $ 0.10 $ 0.09
YEAR ENDED SEPTEMBER 30,2008:
Net sales $ 11,160 $ 11,940 $ 11,888 $ 16,104 Gross profit 1,147 1,383 1,413 2,274 Net income 420 673 868 8,516
Basic earnings per share $ 0.05 $ 0.08 $ 0.10 $ 0.99 Diluted earnings per share $ 0.05 $ 0.07 $ 0.09 $ 0.91
YEAR ENDED SEPTEMBER 30,2007:
Net sales $ 9,246 $ 10,899 $ 11,165 $ 9,604 Gross profit 208 1,529 1,315 825 Net income (576) 603 553 295
Basic earnings per share $ ( 0.07) $ 0.08 $ 0.07 $ 0.03 Diluted earnings per share $ ( 0.07) $ 0.07 $ 0.07 $ 0.03

26
VALUATION AND QUALIFYING ACCOUNTS September Charged to September 30, 2008 Expense Deductions 30, 2009 Allowance for doubtful accounts 145 9 (69)** 85 Inventory reserves 564 66 (51) 579 Warranty reserves 198 52 (139)* 111 Deferred tax valuation allowance 3,312 - (205) 3,107 * final payment for GE settlement ** A/R collections success September Charged to September 30, 2007 Expense Deductions 30, 2008 Allowance for doubtful accounts 100 73 (28) 145 Inventory reserves 506 128 (70) 564 Warranty reserves 115 (9 ) 92* 198 Deferred tax valuation allowance 19,406 - (16,094) 3,312 * accrued for GE settlement September Charged to September 30, 2006 Expense Deductions 30, 2007 Allowance for doubtful accounts 59 46 (5) 100 Inventory reserves 516 (58) 48 506 Warranty reserves 140 26 (51) 115 Deferred tax valuation allowance 19,946 - (540) 19,406

27
IEC ELECTRONICS CORP. AND ITS SUBSIDIARIES SELECTED FINANCIAL DATA
(in thousands, except per share data)
Years Ended September 30, 2009(#1) 2008(#1) 2007 2006 2005 INCOME STATEMENT DATA Net sales $ 67,811 $ 51,092 $ 40,914 $ 22,620 $ 19,066 Gross profit $ 10,826 $ 6,217 $ 3,877 $ 2,753 $ 2,630
Percent of net sales 16.0% 12.2% 9.5 % 12.2% 13.8% Operating income $ 4,819 $ 2,392 $ 985 $ 598 $ 346
Percent of net sales 7.1% 4.7% 2.4 % 2.6% 1.8% Net income before tax $ 4,718 $ 1,634 $ 503 $ 215 $ 257 Net income $ 4,956 $ 10,477 $ 875 $ 215 $ 285 Net income (loss) per common and common equivalent share:
Basic $ 0.57 $ 1.22 $ 0.11 $ 0.03 $ 0.03 Diluted $ 0.52 $ 1.12 $ 0.10 $ 0.03 $ 0.03
Common and common equivalent shares
Basic 8,729 8,554 8,114 7,973 8,261 Diluted 9,554 9,337 8,896 8,276 8,571
BALANCE SHEET DATA Working capital(#2) $ 11,295 $ 9,247 $ 3,985 $ 5,775 $ 2,038 Total assets $ 34,469 $ 34,184 $ 12,344 $ 11,894 $ 5,538 Long-term debt, including current maturities(#3) $ 7,747 $ 10,008 $ 1,751 $ 4,164 $ 937 Shareholders' equity $ 20,254 $ 15,976 $ 4,163 $ 3,092 $ 3,020 Notes: #1.) Comparability of 2009 to prior year is affected by 2008 late-year acquisition of Wire and Cable. #2.) 2009 Customer deposits included in current liabilities. Previously an offset to assets. #3.) Revolving Line of Credit categorized as Long Term Debt.

REPORT OF INDEPENDENT REGISTERED PUBLIC ACCOUNTING FIRM
28

BOARD OF DIRECTORS W. Barry Gilbert Chairman of the Board and Chief Executive Officer of the Company Eben S. Moulton President Seacoast Capital Corporation James C. Rowe President Rowe and Company LLC Carl E. Sassano Chairman of the Board Transcat, Inc. Amy L. Tait Chief Executive Officer Broadstone Real Estate, LLC Jerold L. Zimmerman Chaired Professor William E. Simon Graduate School of Business Administration University of Rochester
OFFICERS W. Barry Gilbert Chairman of the Board and Chief Executive Officer Jeffrey T. Schlarbaum Executive Vice President and President of IEC Contract Manufacturing Donald S. Doody Senior Vice President of Operations Michael R. Schlehr Vice President and Chief Financial Officer Martin S. Weingarten Corporate Secretary Cautionary Statement/10-K Reports In an effort to give investors a well-rounded view of trends and future opportunities, this report includes several forward-looking statements. Caution is advised in assessing these as they necessarily involve substantial uncertainty. Our 10-K report discusses these risks in greater detail including sections on timing of orders and shipments, availability of materials, product mix and general market conditions. 10-K reports are readily available on-line at www.sec.gov or by writing: Michael R. Schlehr, CFO. IEC Electronics Corp. 105 Norton St. P.O. Box 271 Newark, NY 14513-0271 Telephone: (315)331-7742
INVESTOR INFORMATION Annual Meeting 9:00 a.m. Wednesday February 3, 2010 at IEC, 105 Norton St. Newark, NY 14513 Change of Address, Lost Certificates and Ownership Transfers Registrar and Transfer Company Shareholder Relations 10 Commerce Drive Cranford, NJ 07016 Telephone: (800)368-5948 www.rtco.com Stock Market Shares trade on the NYSE Amex exchange under the symbol IEC Independent Accountants EFP Rotenberg, LLP 1870 Winton Road South Suite 200 Rochester, NY 14618 Legal Counsel Boylan, Brown, Code, Vigdor andWilson, LLP 2400 Chase Square Rochester, NY 14604-1915 Investor Relations John Nesbett Institutional Marketing Services 51 Locust Avenue Suite 204 New Canaan, CT 06840
29

105 Norton Street • PO Box 271 • Newark, NY 14513www.iec-electronics.com