industrial polymer effluent treatment by chemical …12 treatment by physio-chemical process. in the...
TRANSCRIPT
Industrial polymer effluent treatment by chemical coagulation and flocculation Sher, F., Malik, A. & Liu, H. Author post-print (accepted) deposited by Coventry University’s Repository Original citation & hyperlink:
Sher, F, Malik, A & Liu, H 2013, 'Industrial polymer effluent treatment by chemical coagulation and flocculation' Journal of Environmental Chemical Engineering, vol. 1, no. 4, pp. 684-689. https://dx.doi.org/10.1016/j.jece.2013.07.003
DOI 10.1016/j.jece.2013.07.003 ISSN 2213-2929 ESSN 2213-3437 Publisher: Elsevier NOTICE: this is the author’s version of a work that was accepted for publication in Journal of Environmental Chemical Engineering. Changes resulting from the publishing process, such as peer review, editing, corrections, structural formatting, and other quality control mechanisms may not be reflected in this document. Changes may have been made to this work since it was submitted for publication. A definitive version was subsequently published in Journal of Environmental Chemical Engineering, Journal of Environmental Chemical Engineering Vol. 1, Iss. 4, (2013) DOI: 10.1016/j.jece.2013.07.003 © 2013, Elsevier. Licensed under the Creative Commons Attribution-NonCommercial-NoDerivatives 4.0 International http://creativecommons.org/licenses/by-nc-nd/4.0/ Copyright © and Moral Rights are retained by the author(s) and/ or other copyright owners. A copy can be downloaded for personal non-commercial research or study, without prior permission or charge. This item cannot be reproduced or quoted extensively from without first obtaining permission in writing from the copyright holder(s). The content must not be changed in any way or sold commercially in any format or medium without the formal permission of the copyright holders. This document is the author’s post-print version, incorporating any revisions agreed during the peer-review process. Some differences between the published version and this version may remain and you are advised to consult the published version if you wish to cite from it.

1
Industrial Polymer Effluent Treatment by Chemical Coagulation 1
and Flocculation 2 3
Farooq Shera,*, Atiq Malikb,*, Hao Liua 4
a. Energy and Sustainability Research Division, Faculty of Engineering, University of Nottingham, 5
University Park, Nottingham, NG7 2RD, UK. 6
b. Scott Bader Company Limited, Wollaston, Wellingborough, Northampton, Northamptonshire, NN29 7
7RL, UK. 8
ABSTRACT 9
Polymer industries generate significant amounts of effluent which has to be treated before being 10
discharged into water stream. So far, very little attention has been paid towards polymer effluent 11
treatment by physio-chemical process. In the present study, chemical coagulation-flocculation 12
process was used to separate solids from industrial polymer effluent in order to make the effluent 13
dischargeable with suitable characteristics. Aluminium Sulphate [Al2(SO4)3] and Anionic 14
Polyacrylamide (Magnafloc155) were used as coagulant and flocculant respectively. Sulphuric 15
Acid (H2SO4) and Lime solution [Ca(OH)2] were used to adjust the pH values during the 16
treatment process. A series of jar tests were conducted with different values of pH and dosing 17
amounts of coagulant and flocculant. After each test, the supernatant layer of treated effluent was 18
analysed for Chemical Oxygen Demand (COD), Suspended Solids (SS), colour and Turbidity. 19
The process efficiency varied between 10 and 98% in COD removal, between 23 and 91% in 20
suspended solids removal and between 37% and 99% reduction in turbidity. The optimal 21
working pH value for coagulation was found to be 6 and that for flocculation was 8. The optimal 22
doses of coagulant and flocculant were 7.5 mL per litre of effluent. These jar testing results have 23
* Corresponding authors. Tel.: +44 740 370 5599; Fax: +44 193 366 6559
E-mail addresses: [email protected], [email protected] (F.Sher)

2
been further proved by a successful pilot scale trial at the polymer plant with 1000 L effluent in 24
an Intermediate Bulk Container (IBC) using the same optimal values of the jar tests, which 25
indicates that the chemical coagulation and flocculation process is a feasible solution for the 26
treatment of effluent generated at polymer industry. 27
Keywords 28
Polymer effluent, water-based emulsion, effluent treatment, chemical treatment, coagulation and 29
flocculation. 30
1 Introduction 31
Polymer industry is the world’s fastest growing sector due to ever increasing demand of its 32
products. Polymer-based products have become an essential part of every day’s life. Due to their 33
unique mechanical and thermo-physical properties, they are replacing wood, metal and many 34
other products. The high demand for polymers has resulted in a large quantity of polymer 35
effluent that needs to be treated in order to protect the environment and aquatic life. 36
37
The industrial polymer effluent contains residual polymers in water or caustic solution and has 38
higher level of suspended solids and organic materials. This effluent is usually milky in colour 39
containing finely dispersed solids particles called collides which are stabilised by negative 40
electric charges on their surface, causing them to repel each other. The repulsion between these 41
particles prevents them from settling and keeps them in suspension. These particles cannot be 42
easily separated with conventional physical methods such as filtration or settling and therefore, 43
require the addition of chemicals to neutralise the charges on colloidal particles. 44
45
3
There are a number of processes available for water and wastewater treatment such as chemical 46
coagulation-flocculation, electro-coagulation, electro-floatation, sedimentation precipitation, 47
extraction, evaporation, membrane filtration, adsorption on activated carbon, ion-exchange, 48
oxidation and advanced oxidation, incineration, bio-degradation and electrochemical treatment 49
etc. However, complete treatment of wastewater usually require number of steps and it is often 50
appropriate to combine more than one method of treatment and purification before the maximal 51
efficiency/purity can be obtained, knowing that each method has its advantages and its 52
disadvantages. [1-6]. 53
54
Coagulation-flocculation is one of the most practised technologies extensively used on industrial 55
scale wastewater treatment [7-12]. The removal mechanism of this process is mainly due to the 56
charge neutralization of negatively charged colloids by cationic hydrolysis products which 57
allows the Van der Waals force of attraction to encourage initial aggregation of colloidal 58
particles to form microflocs [13]. The efficiency of coagulation-flocculation process depends on 59
the coagulant type, dosage, pH value, temperature, ionic strength, nature and concentration of 60
organic matter, total dissolved solids, size and distribution of colloidal particles in suspensions 61
and several other factors [14, 15]. Coagulation-flocculation is an important unit operation in 62
wastewater treatment of many industries such as pulp and paper, pharmaceutical, petrochemical, 63
cosmetics, food, mineral processing, metal working and textile [16]. This technique has been 64
successfully employed for the treatment of the effluents from tannery [17], yeast wastewater[18], 65
textile [19, 20], petroleum refinery [8], dyebath and dye house [21], aquaculture [13], vinasse 66
[22], municipal [23, 24] , landfill leachates [25], pulping [26, 27], olive mill [28] and many other. 67
These multitudes of applications on the examination of coagulation–flocculation for the 68

4
industrial effluents treatment aim mainly at the performance optimisation. Although chemical 69
coagulation and flocculation may be a feasible solution for the treatment of effluent from 70
polymer industry, few studies have been carried out to investigate the polymer effluent treatment 71
using coagulation and flocculation processes. In fact, the studies on the polymer effluent 72
treatment are also quite limited. Araya et al. investigated the anaerobic treatment of effluents 73
from an industrial polymers synthesis plant and were able to reduce the COD value by 75% by 74
using the anaerobic treatment process [29]. 75
76
The effectiveness of coagulation depends on the coagulating agent used, the dosage, the solution 77
pH, the concentration and the nature of the organic compound present in the water [30]. The 78
widely used coagulants are iron and alum salts. These coagulants promote particles 79
agglomeration by reducing the electrostatic particle surface charges in the acidic pH region 80
prominently where hydrolysed metal species are abundant [8]. The aluminium salts are 81
commonly used coagulants for water and wastewater treatment [31]. One of the most widely 82
used coagulant is Aluminium Sulphate (alum), due to its low cost, ease of use, handling, storage 83
and mixing properties [32]. 84
85
The flocculant adsorbs destabilised colloidal particles with loop and tails extending into the 86
solution for bridging with other particles [33]. The long chain polymers attach at a relatively few 87
sites on the particles, leaving long loops and tails which stretch out into the surrounding water. 88
Flocculation is usually more effective with higher molecular weight polymers. Adding excessive 89
amount of polymer results in entire particle surface becoming coated with polymer, such that no 90
sites are available to ‘bridge’ with other particles [34]. The flocs structure may differ as a 91

5
function of physical-chemical conditions, as the flocs formed at the lower pH and dose are 92
reported to be denser and less porous than those formed at higher pH and dose [35]. 93
94
In the present study, an investigation on the treatment of effluent generated from an industrial-95
scale polymer plant was conducted by the chemical coagulation-flocculation. The polymer 96
manufactured at the plant was water based, mainly consisting of Acrylic Acid, Methylacrylic 97
Acid, Maleic Acid and their derivatives. A series of jar tests were conducted in order to 98
determine the optimal dosage and pH for coagulation and flocculation. The experimental results 99
were evaluated using major ecological parameters, like Chemical Oxygen Demand (COD), 100
Suspended Solids (SS), colour and turbidity values. 101
2 Materials and methods 102
2.1 Materials 103
Aluminium Sulphate [Al2(SO4)3] and Magnafloc155 (Anionic polyacrylamide) were used as 104
coagulant and flocculant respectively. Sulphuric acid (H2SO4) and Lime solution [Ca(OH)2] were 105
used for regulating the pH value of effluent during the treatment processes. The details of used 106
materials are described in Table 1. 107
108

6
Table 1. Materials characteristics. 109
Chemicals Formula Physical Form
Molecular Weight
(g/mole)
Concentration
(%)
Purpose
Sulphuric Acid H2SO4 Liquid 98.01 77 pH
adjustment
Aluminium
Sulphate
Al2(SO4)3 Powder 342.15 26 Coagulant
Lime Ca(OH)2 Powder 74.093 12 pH
adjustment
Magnafloc155 -C3H5NO- Powder 5x10⁶ 0.16 Flocculant
2.2 Sampling 110
The effluent samples were collected from the polymer manufacturing plant at Scott Bader 111
Company Limited situated in Northamptonshire, UK. The samples were collected from the outlet 112
of the holding tank where the effluent is stored before it is sent to the effluent treatment plant. 113
114
The initial solid contents in the effluent samples collected were 1.0% on dry basis. Various 115
characteristics of the effluent were determined according to the Standard Methods [36] and are 116
summarised Table 2. The target values are defined for Scott Bader as the discharge consent 117
limits by Anglian Water (regulated under the Water Industry Act 1991). 118
119
Table 2. Physico-chemical characteristics of the pre-treated effluent. 120
Parameters Units Initial Values Target Values
Temperature oC 45 <40
PH – 13 6–10
COD mg/L >20,000 <6000
SS mg/L 3500 <1000
Turbidity NTU 750 <20

7
2.3 Jar tests 121
The jar test has been the standard technique used to optimise the addition of coagulants and 122
flocculants used in the water and wastewater treatment industry from more than half a century. 123
The scope of this practice is to evaluate the treatment to reduce the suspended, colloidal and non-124
settable matter from the effluent by chemical coagulation-flocculation. The same standard was 125
utilized to evaluate the variables normally encountered in the coagulation-flocculation process 126
[13]. 127
128
Considering the number of possible jar tests and total effluent volume of 15 L available for all 129
these tests, it was decided to use 200 mL sample for each jar test. The resulting optimal pH and 130
dose of chemicals was then applied to 500 mL and 1000 mL of the remaining sample and the 131
same results were observed as those for 200 mL. The equipment used was a laboratory 132
flocculator model JLT-4 VELP by Scientifica, Italy equipped with four parallel beakers. A 133
volume of 200 mL of the polymer effluent was placed in each beaker. The desired pH for 134
coagulation was adjusted using Sulphuric Acid (H2SO4) and for flocculation using Lime solution 135
[(Ca(OH)2]. Inorganic coagulant Aluminium Sulphate [Al2(SO4)3] and anionic polyacrylamide 136
flocculant (Magnafloc155) were used in different combinations. 137
138
For coagulation, vigorous mixing at 200 rpm was used for 5 minutes whereas for flocculation, 139
slow mixing at 40 rpm was used for 5 minutes followed by settling time of 30 minutes. Two 140
series of jar tests were conducted according to the standard test methods [37]. In the first series, 141
the dose of coagulant and flocculant was varied from 0.5 to 2.5 mL. In the second series, the pH 142

8
for coagulation was varied from 4 to 8 and for flocculation 6 to10. The final pH, COD, SS, 143
colour and turbidity of the supernatant were then measured. 144
2.4 Analysis 145
The methods and equipment used for determining the pH, COD, SS, TS and Turbidity are shown 146
in Table 3. All analyses were performed according to the Standard Methods [36]. 147
148
Table 3. Analytical methods and equipment used in the study. 149
Parameter Method Apparatus Range Brand/Model Reference
pH Electrometry pH Meter 0–14 HANNA
Instruments HI2212
Standard Methods [36]
APHA 4500-H
COD Spectroscopy Photometer 20–20,000
mg/L
PALINTEST 8000 Standard Methods [36]
APHA 5520-B
Turbidity Nephelometry Turbid meter 0.01–1100
NTU
HANNA
Instruments TB200
Standard Methods [36]
APHA 2130
Total Solids Evaporation Moisture
Analyser
0–36 % OHAUS MB35 Standard Methods [36]
APHA 2540
3 Results and Discussion 150
3.1 The coagulation-flocculation process 151
The coagulation-flocculation process was completed in four steps. In the first step, the pH of 152
effluent was adjusted to 6 as the optimum pH for Aluminium Sulphate is between the range of 153
5.8 to 6.5 [38]. The second step was the addition of coagulant (Aluminium Sulphate) to 154
destabilise the colloidal particle of emulsion. In the third step, pH was adjusted to 8 using lime 155
as Magnafloc155 tends to work best in the pH range of 6 to 10 [39] which was also suggested by 156
the manufacturer, Goldcrest Chemicals Limited, UK. In the final step, flocculant (Magnafloc155) 157

9
was added to bridge the destabilised colloidal particles together to develop larger flocs. The same 158
procedure was repeated for the second series of the experiments in which the concentration of 159
the coagulant and flocculant were kept constant but pH values for coagulation and flocculation 160
were changed. The effects of coagulant-flocculant concentration and pH were analysed on the 161
removal of COD, suspended solids, colour and turbidity. 162
3.2 Effects of coagulant and flocculant doses on the removals of COD, suspended 163
solids, colour and turbidity 164
The effects of coagulant and flocculant doses on the removals of COD, SS and turbidity were 165
investigated at constant pH values of 6 for coagulation and 8 for flocculation with varying doses 166
of the reagents. pH is a measure of the acidity or alkalinity of water and is one of the stable 167
measurements. pH is a simple parameter but is extremely important, since most of the chemical 168
reactions in aquatic environment are controlled by any change in its value. Anything either 169
highly acidic or alkaline would kill marine life. Aquatic organisms are sensitive to pH changes 170
and biological treatment requires pH control or monitoring. The toxicity of heavy metals also 171
gets enhanced at particular pH. Thus, pH is having primary importance in deciding the quality of 172
wastewater effluent. Waters with pH value of about 10 are exceptional and may reflect 173
contamination by strong base such as NaOH and Ca(OH)2 [40]. The range of desirable pH of 174
wastewater prescribed for discharge purpose by Anglian water was 6.0 to 10.0. The pH value of 175
effluent samples collected was observed as 13.0, well above from the permissible limit. 176
177
Chemical Oxygen Demand value is useful in specifying toxic condition and presence of 178
biologically resistant substances. It is an important, rapidly measured parameter for industrial 179
wastewater studies and control of waste treatments. The COD value is a measure of the relative 180

10
oxygen-depletion effect of a waste contaminant and has been widely adopted as a measure of 181
pollution effect [41]. 182
183
The COD value in collected effluent was observed to be greater than 20,000 mg/L whereas the 184
discharge consent limit allowed by Anglian Water authorities is only 6000 mg/L. The effects of 185
the coagulant and flocculant doses on the removal of COD are shown in Fig. 1. 186
0.0 0.5 1.0 1.5 2.0 2.5
0
20
40
60
80
100 Flocculant (mL)
0.5
1.0
1.5
2.0
2.5
CO
D r
em
ova
l (%
)
Coagulant (mL)
187
Fig. 1. COD removal with different coagulant and flocculant doses. 188
189
It can clearly be seen that the COD removal increased with the increase in coagulant and 190
flocculant doses until the maximum values were obtained. When the doses of coagulant and 191

11
flocculant were 0.5 mL (in 200 mL sample), the removal of COD was about 10% but it increased 192
to 51% which is still not sufficient for the required standard (<6000 mg/L) when both doses 193
increased to 1.0 mL; however, when the coagulant dose was increased from 1.0 to 1.5 mL 194
combined with the addition of 1.5mL of flocculant, a significant improvement in COD removal 195
efficiency was achieved with the COD removal of 91% with the corresponding COD value (1800 196
mg/L) much smaller than the required standard value. At the coagulant dosage of 1.5 mL and 197
flocculant dose of 2.0 mL, the COD removal was at the highest level, 98%. With a further 198
increase in the coagulant dose up to 2.5 mL, no further significant COD reduction was observed. 199
200
Both the scientific literature and international water quality guidelines relating to SS are 201
dominated by the implicit assumption that the concentration-response model applies to SS effects 202
on aquatic biota (i.e. increase in SS = increase in effect on aquatic biota) [42]. Indeed, numerous 203
authors have reported that the magnitude of the effects of SS on aquatic organisms generally 204
increases with SS concentrations. However, other factors such as the duration of exposure, 205
particle-size distribution and chemical composition of the SS, and the presence of other 206
contaminants on the solids also appear to have an important control over the effect of SS on 207
aquatic biota. Suspended solids can harbour opportunistic pathogens and speed up the growth of 208
bacteria. They are associated with environmentally-induced disease problems, and have been 209
reported to cause sub-lethal effects such as fin rot and direct gill damage [43]. The effects of the 210
coagulant and flocculant doses on the removal of SS are shown in Fig. 2. 211
212

12
0.0 0.5 1.0 1.5 2.0 2.50
20
40
60
80
Flocculant (mL)
0.5
1.0
1.5
2.0
2.5
S
S r
em
ova
l (%
)
Coagulant (mL)
213
Fig. 2. SS removal with different coagulant and flocculant doses. 214
215
It can clearly be seen that SS removal increased with the increases in coagulant and flocculant 216
doses until the maximum removal values were obtained, similar to what have been shown in Fig. 217
1. For example, when the initial doses of coagulant and flocculant were 0.5 mL, the removal 218
efficiency of SS was about 23% but it increased to 40% when both doses increased to 1.0 mL, 219
which is still not sufficient for the required standard value (<1000 mg/L). When both the 220
coagulant doses were increased to 1.5 mL, the SS removal efficiency was significantly high at 82% 221
with the SS value (674 mg/L) being well below the required standard value. At the coagulant 222
dosage of 2.5 mL and flocculant dose of 2.0 mL, the SS removal was at its highest level of 86%. 223

13
No significant SS reduction was observed for further increases in the coagulant and flocculant 224
doses beyond 1.5 mL. 225
226
Turbidity diffuses sunlight and slows photosynthesis. Plants begin to die, reducing the amount of 227
dissolved oxygen and increasing the acidity (decaying organic material produces carbonic acid, 228
which lowers the pH level), both of these effects harm aquatic life. Turbidity as sedimentation 229
can also affect ecosystem functions [44,45]. Fig. 3 shows the removal of turbidity with different 230
coagulant and flocculant doses at constant pH values of 6 and 8 for coagulation and flocculation 231
respectively. 232
0.0 0.5 1.0 1.5 2.0 2.50
20
40
60
80
100
Flocculant (mL)
0.5
1.0
1.5
2.0
2.5
Tu
rbid
ity r
em
ova
l (%
)
Coagulant (mL)
233
Fig. 3. Turbidity removal with different coagulant and flocculant doses. 234

14
Similar to the COD and SS removals, the turbidity removal increased with the increase in 235
coagulant and flocculant doses until the maximum values were obtained. With the doses of 236
coagulant and flocculant at 0.5 mL, the removal efficiency of turbidity was about 37%. When 237
both doses increased from 0.5 to1.0 mL, the removal of turbidity increased to 69% but still not 238
up to the required standard value (<20 NTU). When both the coagulant dose and the flocculant 239
dose were 1.5mL, the total turbidity removal reached 98% with the turbidity value (18 NTU) 240
being well below the required standard value. At the coagulant dosage of 2.5 mL and flocculant 241
dose of 1.5 mL, turbidity removal was at its highest level of 99%. 242
243
This series of tests showed that it was possible to achieve the maximum removal efficiency of 98% 244
for COD, 86% for SS and 99% for turbidity. When both the coagulant and the flocculant doses 245
were increased from 1.0mL to 1.5 mL remarkable improvements in removal efficiencies were 246
observed. Visual inspection also showed that with the increase in coagulant and flocculant 247
dosage, the supernatant became clearer as shown in Fig. 1. On the other hand, the targeted values 248
of COD, SS and turbidity were well within the range of 91%, 82% and 98% removals 249
respectively which are quite close to the best values. Therefore it can be concluded that the 250
coagulant dose of 1.5 mL and flocculant dose of 1.5 mL are optimal doses for the targeted values 251
of the all three parameters. 252
3.3 Effects of pH on the removal of COD, suspended solids, colour and turbidity 253
The effects of pH values on the removals of COD, SS and turbidity were investigated at a 254
constant dose of 1.5 mL (in 200 mL sample) of coagulant and 1.5 mL (in 200 mL sample) of 255
flocculant whereas the pH values for both steps were varied. The removal percentage of COD 256
with varying pH values for coagulation and flocculation is shown in Fig. 4. 257

15
4 5 6 7 8
0
20
40
60
80
100
120Flocculation pH
6
7
8
9
10
C
OD
re
mo
va
l (%
)
Coagulation pH
258 Fig. 4. COD removal with varying pH values for coagulation and flocculation. 259
260
Divergent from the series one tests where the pH value for coagulation and flocculation were 261
fixed at 6 and 8 respectively, the pH values for the series two tests were changed from 4 to 8 for 262
coagulation and from 6 to 10 for flocculation., Fig. 6 shows that the percentage of COD removal 263
increases up to the maximum level of 98% then starts to decrease with an increase in the pH 264
value for either coagulation or flocculation. At an initial pH value of 4 for coagulation and 6 for 265
flocculation the removal percentage of COD was 40% while changing pH value to 5 for 266
coagulation and 6 for flocculation led to the COD removal percentage of 69%, which is still not 267
sufficient for the required standard value (<1000 mg/L). Further increases in pH value to 6 for 268
coagulation and 8 for flocculation resulted in the COD removal to the highest level of 91%. 269
16
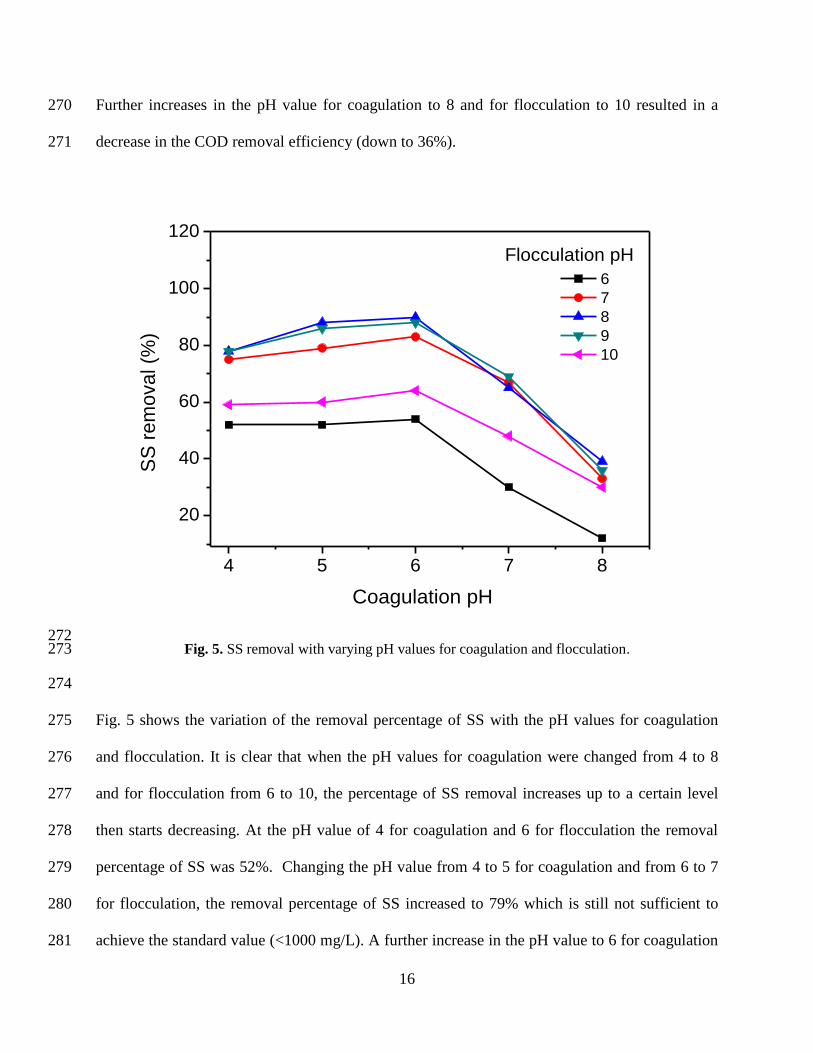
Further increases in the pH value for coagulation to 8 and for flocculation to 10 resulted in a 270
decrease in the COD removal efficiency (down to 36%). 271
4 5 6 7 8
20
40
60
80
100
120
Flocculation pH
6
7
8
9
10
SS
re
mo
va
l (%
)
Coagulation pH
272 Fig. 5. SS removal with varying pH values for coagulation and flocculation. 273
274
Fig. 5 shows the variation of the removal percentage of SS with the pH values for coagulation 275
and flocculation. It is clear that when the pH values for coagulation were changed from 4 to 8 276
and for flocculation from 6 to 10, the percentage of SS removal increases up to a certain level 277
then starts decreasing. At the pH value of 4 for coagulation and 6 for flocculation the removal 278
percentage of SS was 52%. Changing the pH value from 4 to 5 for coagulation and from 6 to 7 279
for flocculation, the removal percentage of SS increased to 79% which is still not sufficient to 280
achieve the standard value (<1000 mg/L). A further increase in the pH value to 6 for coagulation 281

17
and to 8 for flocculation resulted in the maximum SS removal efficiency of 90% SS. Any further 282
increase in the pH values for coagulation and flocculation lead to a reduction in SS removal. The 283
effects of pH values on the removal of turbidity are shown in Fig. 6. 284
4 5 6 7 8
80
90
100
110
Flocculation pH
6
7
8
9
10
Tu
rbid
ity r
em
ova
l (%
)
Coagulation pH
285 Fig. 6. Turbidity removal with varying pH values for coagulation and flocculation. 286
287
In contrast to the trends of COD and SS removals shown in Figs. 5-6, the pH value of 288
flocculation has a much smaller influence on the removal of turbidity. In addition, within the 289
ranges of the investigated pH values (4 to 8 for coagulation and 6 to 10 for flocculation), the 290
percentage of turbidity removal remained above 80% although it peaked to 98% at the pH value 291
of 6 for coagulation and 8 for flocculation. 292
293

18
The second series test results showed that the maximum removal efficiencies of 91% for COD, 294
90% for SS and 98% for turbidity could be achieved with the pH value of 6 for coagulation and 8 295
for flocculation. Under these conditions, the required target values for COD, SS and Turbidity 296
were all successfully achieved. Therefore, it can be concluded that the pH value of 6 for 297
coagulation and pH value of 8 for flocculation are the optimal pH values for targeted parameters. 298
Examples of jar tests, which yielded good results, are shown in Fig. 7. 299
300
Fig. 7. Effluent samples during treatment: (A) acid addition, (B) coagulant addition, (C) lime addition, 301 and (D) flocculant addition. 302
303
These jar tests were then followed by a successful pilot scale trial at the polymer plant with 1000 304
litres of effluent in an Intermediate Bulk Container (IBC) using the same optimal pH and dosage 305
values. 1000 litres of the effluent was transferred into and open top Intermediate bulk container 306
(IBC) with an air driven agitator fitted on it and spinning at 30 rpm. The total solids in this 307
effluent were 1.1% (dry basis). The pH of the effluent was adjusted to 6 by adding 77% 308
sulphuric acid. 7.5 litres of coagulant (26% aluminium sulphate) solution was added into IBC. 309

19
The pH was re-adjusted to 8 by manually adding 12% lime solution. Then 7.5 litres of flocculant 310
(0.16% Magnafloc) was added and the agitator speed was slowed down to 15 rpm. The agitator 311
was stopped 5 minutes after adding flocculant and the flocs were allowed to settle. After 10 312
minutes of sedimentation, the sludge was settled at bottom taking about 15% volume of IBC. 313
Supernatant water was collected for analysis and the results showed its pH 7.9, Suspended Solids 314
280 mg/L, COD 350 mg/L, Turbidity 20 NTU. These values were quite similar with those of jar 315
tests. 316
317
The results of the present study are also better than those of few studies on the treatment of 318
polymer effluent [29] found in the literature. Ayara et al. [29] investigated the feasibility of the 319
anaerobic treatment of an industrial polymer synthesis plant effluent having the initial COD 320
value of about 2000 mg/L. Their process was able to reduce the COD value by 75%, which is 321
much smaller 91% achieved with the present work. 322
4 Conclusions 323
The chemical coagulation-flocculation process for the treatment of effluent from a polymer 324
industrial plant showed a great potential to reduce the COD, SS, colour and turbidity. The 325
process effectively removed COD, SS and turbidity up to 98%, 91% and 99% respectively. 326
However, the jar tests found that the treatment process was highly sensitive to the pH values and 327
the coagulant and flocculant doses used for the effluent treatment. The targeted values of the 328
main parameters (COD<6000 mg/L, SS<1000 mg/L and turbidity < 20 NTU) were achieved by 329
the coagulant and flocculant doses of 7.5mL/L(1.5 mL per 200 mL of effluent) each at the pH 330
value of 6 and 8 respectively. Thus 7.5 mL/L doses of coagulant and flocculant at pH values of 6 331
and 8 were found to be optimal conditions for the effluent treatment. Under the optimal 332

20
conditions, the final values of COD, SS and turbidity were 1750 mg/L, 354 mg/L and 18 NTU 333
respectively, meeting their respective standard values. The jar test results were also confirmed by 334
a successful pilot scale trial at the polymer plant with 1000 L effluent in an Intermediate Bulk 335
Container (IBC) using the same optimal values. So far, there are only a few studies having 336
investigated the treatment of polymer effluent and therefore more investigations are required. 337
The chemical coagulation and flocculation process has been shown to be a feasible solution for 338
the treatment of effluent from polymer industry. 339
340

21
References
1. Dąbrowski, A., et al., Adsorption of phenolic compounds by activated carbon—a critical review.
Chemosphere, 2005. 58(8): p. 1049-1070.
2. Swami, D. and D. Buddhi, Removal of contaminants from industrial wastewater through various
non-conventional technologies: a review. Environment and Pollution, 2006. 27(4): p. 324-346.
3. Kawashima, A., et al., Physicochemical characteristics of carbonaceous adsorbent for dioxin-like
polychlorinated biphenyl adsorption. Chemosphere, 2011. 83(6): p. 823-830.
4. Moo-Young, H., Pulp and paper effluent management. Water Environment Research, 2007. 79: p.
1733–41.
5. Mondal, S., Methods of Dye Removal from Dye House Effluent - An Overview. Environmental
Engineering Science, 2008. 25(3): p. 383-396.
6. Lefebvre, O. and R. Moletta, Treatment of organic pollution in industrial saline wastewater: a
literature review. Water Research, 2006. 40: p. 3671-82.
7. Ghafari, S., et al., Application of response surface methodology (RSM) to optimize coagulation-
flocculation treatment of leachate using poly-aluminum chloride (PAC) and alum. J Hazard Mater,
2009. 163(2-3): p. 650-6.
8. Santo, C.E., et al., Optimization of coagulation–flocculation and flotation parameters for the
treatment of a petroleum refinery effluent from a Portuguese plant. Chemical Engineering Journal,
2012. 183: p. 117-123.
9. Ahmad, A.L., et al., Optimization of coagulation-flocculation process for pulp and paper mill
effluent by response surface methodological analysis. J Hazard Mater, 2007. 145(1-2): p. 162-8.
10. Ginos, A., T. Manios, and D. Mantzavinos, Treatment of olive mill effluents by coagulation-
flocculation-hydrogen peroxide oxidation and effect on phytotoxicity. J Hazard Mater, 2006.
133(1-3): p. 135-42.
11. Haydar, S. and J.A. Aziz, Coagulation-flocculation studies of tannery wastewater using
combination of alum with cationic and anionic polymers. J Hazard Mater, 2009. 168(2-3): p.
1035-40.
12. Verma, A.K., R.R. Dash, and P. Bhunia, A review on chemical coagulation/flocculation
technologies for removal of colour from textile wastewaters. J Environ Manage, 2012. 93(1): p.
154-68.
13. Ebeling, J.M., et al., Evaluation of chemical coagulation–flocculation aids for the removal of
suspended solids and phosphorus from intensive recirculating aquaculture effluent discharge.
Aquacultural Engineering, 2003. 29(1-2): p. 23-42.
14. Goloba, V., A. Vinderb, and M. Simonic, Efficiency of the coagulation/flocculation method for
the treatment of dyebath effluents. Dyes and Pigments, 2005. 67: p. 93-97.
15. Zhu, G., et al., Characterization and coagulation–flocculation behavior of polymeric aluminum
ferric sulfate (PAFS). Chemical Engineering Journal, 2011. 178: p. 50-59.
16. Lee, K.E., et al., Development, characterization and the application of hybrid materials in
coagulation/flocculation of wastewater: A review. Chemical Engineering Journal, 2012. 203(0): p.
370-386.

22
17. Garrote, J.I., et al., Treatment of tannery effluents by a two step coagulation/flocculation process.
Water Res, 1995. 29(11): p. 2605-2608.
18. Zhou, Y., Z. Liang, and Y. Wang, Decolorization and COD removal of secondary yeast
wastewater effluents by coagulation using aluminum sulfate. Desalination, 2008. 225(1–3): p.
301-311.
19. Khouni, I., et al., Decolourization of the reconstituted textile effluent by different process
treatments: Enzymatic catalysis, coagulation/flocculation and nanofiltration processes.
Desalination, 2011. 268(1-3): p. 27-37.
20. Riera-Torres, M., C. Gutiérrez-Bouzán, and M. Crespi, Combination of coagulation–flocculation
and nanofiltration techniques for dye removal and water reuse in textile effluents. Desalination,
2010. 252(1-3): p. 53-59.
21. Allegre, C., et al., Coagulation-flocculation-decantation of dye house effluents: concentrated
effluents. J Hazard Mater, 2004. 116(1-2): p. 57-64.
22. Zayas, T., et al., Applicability of coagulation/flocculation and electrochemical processes to the
purification of biologically treated vinasse effluent. Separation and Purification Technology, 2007.
57(2): p. 270-276.
23. Petala, M., et al., The effect of coagulation on the toxicity and mutagenicity of reclaimed
municipal effluents. Chemosphere, 2006. 65(6): p. 1007-18.
24. Dwyer, J., P. Griffiths, and P. Lant, Simultaneous colour and DON removal from sewage
treatment plant effluent: alum coagulation of melanoidin. Water Res, 2009. 43(2): p. 553-61.
25. Tatsi, A.A., et al., Coagulation–flocculation pretreatment of sanitary landfill leachates.
Chemosphere, 2003. 53(7): p. 737-744.
26. Wang, J.P., et al., Optimization of the coagulation-flocculation process for pulp mill wastewater
treatment using a combination of uniform design and response surface methodology. Water Res,
2011. 45(17): p. 5633-40.
27. Liu, T., et al., Treatment of APMP pulping effluent based on aerobic fermentation with
Aspergillus niger and post-coagulation/flocculation. Bioresour Technol, 2011. 102(7): p. 4712-7.
28. Papaphilippou, P.C., et al., Sequential coagulation–flocculation, solvent extraction and photo-
Fenton oxidation for the valorization and treatment of olive mill effluent. Chemical Engineering
Journal, 2012.
29. Araya, P., G. Aroca, and R. Chamy, Anaerobic treatment of effluents from an industrial polymers
synthesis plant. Waste Management, 1999. 19(2): p. 141-146.
30. Dominguez, J.R., et al., Aluminium sulfate as coagulant for highly polluted cork processing
wastewaters: removal of organic matter. J Hazard Mater, 2007. 148(1-2): p. 15-21.
31. Meghzili, B., M.S. Medjram, and M. Zoubida, Tests of Coagulation - Flocculation by Aluminium
Sulphate and Polycations Al13 on Raw Waters of the Station of Treatment Skikda (Algeria).
European Journal of Scientific Research, 2008. 23(2): p. 268-277.
32. Renault, F., et al., Chitosan for coagulation/flocculation processes – An eco-friendly approach.
European Polymer Journal, 2009. 45(5): p. 1337-1348.
33. Hogg, R., Collision efficiency factors for polymer flocculation. Journal of Colloid and Interface
Science, 1984. 102(1): p. 232-236.
34. Ebeling, J.M., C.F. Welsh, and K.L. Rishel, Performance evaluation of an inclined belt filter
using coagulation/flocculation aids for the removal of suspended solids and phosphorus from
microscreen backwash effluent. Aquacultural Engineering, 2006. 35(1): p. 61-77.

23
35. Guigui, C., et al., Impact of coagulation conditions on the in-line coagulation/UFprocess for
drinking water production. Desalination, 2002. 147: p. 95-100.
36. APHA, Standard Methods for the Examination of Water and Wastewater, 20th Edition, in
American Public Health Association (APHA), AWWA, WEF1999, Washington DC, USA
37. ASTM, Standard Practice for Coagulation-Flocculation Jar Test of Water, D2035-08., in Annual
Book of ASTM Standards, Vol. 11.02.
2008.
38. Gebbie, P., An operator's guide to water treatment coagulants, in 31st annual qld water industry
workshop – operations skills2006: University Central Queensland - Australia. p. 14-20.
39. Harith, Z.T., et al., Effect of different flocculants on the flocculation performance of microalgae,
Chaetoceros calcitrans, cells. African Journal of Biotechnology, 2009. 8(21): p. 5971-5978.
40. Langmuir, D., P. Hall, and J. Drever, Aqueous Environmental Chemistry1997: Prentice-Hall;
New Jersey US.
41. Lokhande, R.S., P.U. Singare, and D.S. Pimple, Study on physico-chemical parameters of waste
water effluents from Taloja industrial area of Mumbai, India. International Journal of Ecosystem,
2011. 1(1): p. 1-9.
42. Newcombe, C.P. and D.D. MacDonald, Effects of suspended sediments on aquatic ecosystems.
North American journal of fisheries management, 1991. 11(1): p. 72-82.
43. Noble, A.C. and S.T. Summerfelt, Diseases encountered in rainbow trout cultured in recirculating
systems. Annual Review of Fish Diseases, 1996. 6: p. 65-92.
44. Kefford, B.J., R.B. Schäfer, and L. Metzeling, Risk assessment of salinity and turbidity in
Victoria (Australia) to stream insects' community structure does not always protect functional
traits. Science of The Total Environment, 2012. 415(0): p. 61-68.
45. Ferrari, M.C.O., K.R. Lysak, and D.P. Chivers, Turbidity as an ecological constraint on learned
predator recognition and generalization in a prey fish. Animal Behaviour, 2010. 79(2): p. 515-519.