industrial radiography ct scanning for metrology …
TRANSCRIPT

1
INDUSTRIAL RADIOGRAPHY
CT SCANNING FOR METROLOGY APPLICATIONS
Jeffrey August, CyberOptics Corporation
Executive Summary ................................................................................................................. 2Results ................................................................................................................................. 2
Introduction ............................................................................................................................. 3Background .............................................................................................................................. 3Measurement System Analysis ................................................................................................ 4
Challenges ........................................................................................................................... 4Test ........................................................................................................................................... 4
Machine ............................................................................................................................... 5Materials ............................................................................................................................. 5Setup ................................................................................................................................... 5Analysis............................................................................................................................... 6
Data .......................................................................................................................................... 7Results ................................................................................................................................. 7
Conclusion ............................................................................................................................... 8
Table of Contents

2
Executive SummaryXray technology, more specifically Computed Tomography (CT), has been adapted for use as an instrument of industrial metrology. Early adopters have quickly recognized the benefits of internal and external nondestructive testing for 3D defect detection and geometric analysis, while those considering adoption may be uncertain how to implement the technology effectively. This study was conducted to demonstrate the accuracy and precision achievable using RX Solutions®, EasyTom 150kV Xray microCT (μCT) system for metrology applications.
Traditionally, measurement system performance is characterized by the result of standardized testing. For example, gantry CMM + tactile probe systems are commonly qualified using ANSI B89, ISO 10360, or similar test procedures. Inherently, the aforementioned studies are not directly applicable for CT measurement systems due to non-uniform parameterization required to achieve an optimum result for scan specimen of varied shape, size, and material. For this reason, we have conceived a test to evaluate general machine performance by blending principles of B89 ball bar study and VDI/VDE 2630, an industry leading procedure designed to quantify uncertainty of Xray μCT measurements for industrial metrology applications.
Briefly, our study evaluates measurements of a calibrated scan artifact, repeated at intervals throughout the usable work volume of the machine. Optimized scan parameters are deployed at each machine condition to evaluate global system performance. Global results are also compared with results of local parameter sets to demonstrate the accuracy and precision achievable when best practices and application specific controls are administered.
ResultsDescribed by the mean of all measurements subtracted from ground truth, nominal values, global system Accuracy = 1.446μm as applied to metrology artifact using EasyTom RX1805 machine. Conveyed as six sigma standard deviation, global Repeatability = 2.07μm. Further, local results, following standard operating procedure (SOP) recommendations, have demonstrated that measurement repeatability as small as 0.2μm is achievable.
0
0.0001
0.0002
0.0003
0.0004
0.0005
0.0006
0.0007
0.0008
sphere 1 sphere 2 sphere 3 distance 1 distance 2 distance 3
Standard Deviations
15 micron 30 micron 60 micron
Table 2: Standard deviation of all dimensions measured, categorized by resolution.
Part-to-PartReprodRepeatGage R&R
100
50
0
Perc
ent
% Contribution% Study Var% Tolerance
spher e
3
sphere
2
sphere
1
di stan
ce 3
di stan
ce 2
di stan
ce 1
sphere
3
sphere
2
sphere
1
distan
ce 3
distan
ce 2
distan
ce 1
s phere
3
sphere
2
sphere
1
di stan
ce 3
distan
ce 2
distan
ce 1
0.00080.0004
0.0000
Feature
Sam
ple
StDe
v
_S=0.0003636UCL=0.0006240
LCL=0.0001031
15 30 60
spher e
3
sphere
2
sphere
1
di stan
ce 3
di stan
ce 2
di stan
ce 1
sphere
3
sphere
2
sphere
1
distan
ce 3
distan
ce 2
distan
ce 1
s phere
3
sphere
2
sphere
1
di stan
ce 3
distan
ce 2
distan
ce 1
0.0020.000
-0.002
FeatureSa
mpl
e M
ean
__X=0.000246UCL=0.000600LCL=-0.000109
15 30 60
sphere 3sphere 2sphere 1distance 3distance 2distance 1
0.004
0.000
-0.004
Feature
603015
0.004
0.000
-0.004
Resolution
sphere
3
sphere
2
sphere
1
di stan
ce 3
di stan
ce 2
di stan
ce 1
0.0020.000
-0.002
Feature
Aver
age
153060
Resolution
Gage name: 3 Sphere Metrology A rtifactDate of study : 2021
Reported by : C y berO ptics Industrial MetrologyTolerance: +/-0.005Misc:
Components of Variation
S Chart by Resolution
Xbar Chart by Resolution
Value by Feature
Value by Resolution
Feature * Resolution Interaction
Gage R&R (ANOVA) for Value
Table 1: MiniTab ANOVA study -Evaluation of measurement variance as a function of resolution (magnification)
Table 3: Deviation from nominal for all dimensions of population, categorized by measurement

3
IntroductionMeasurement accuracy, alongside repeatability and reproducibility (aspects of precision), are, by definition, the critical evaluation characteristics of any measurement system. Operationally, the accuracy and precision of a measurement is affected by variables inherent to the measurement system, environment, inspection specimen, and operator. By minimizing and stabilizing variables, peak performance of any measurement system can be achieved.
Regarding Xray μCT, specifically, workflow is characterized by a three-phase process. Each phase consists of a unique set of variables that impact the accuracy of measurement output. We will refer to these phases of workflow, throughout this document, as: 1- Acquisition 2- Reconstruction 3- Inspection. Employing application specific parameter controls, automated workflow (acquisition, reconstruction, inspection), and establishing traceability to ground truth measurements, we can characterize accuracy, repeatability and uncertainty of Xray μCT measurements for any application.
BackgroundXray μCT machines must consider a unique set of variables to be implement as accurate measurement systems. While physical pixel size (X/Y grid) composing imager hardware (CMOS or CCD camera + Scintillator) remains constant, Cone Beam Xray sources, commonly used in industrial applications, are synonymous with the principle of geometric magnification. As illustrated (Figure 1), the measuring unit of each pixel is variable with dependence on position of the scan specimen, related to position of Xray focal spot (source object distance (SOD)), as well as position of the detector (imager), also with relation to the position of Xray focal spot (source detector distance (SDD)). Considering this relationship, critical mechanical characteristics of a metrology grade Xray μCT machine include linearity of zoom axis, parallel to the Xray source, and perpendicularity of the Xray cone beam center axis to the X/Y image plane.
Downstream, reconstruction of projection images into a 3D volume (Computed Tomography) can be a source of error. Conversely, reconstruction can improve accuracy of resultant 3D (volumetric) object. This loss or gain is dependent on software and the library of algorithms accessible to the user. For example, focal spot instability and coordinate imperfections (hardware) can be compensated if prerequisite references are collected, during acquisition, and corrective algorithms are deployed during reconstruction.
Lastly, measurement error can be introduced if geometric controls, within inspection software, are improperly defined. While there is always potential for human error, defining measurement controls or measuring sub optimal data, governing bodies such as NIST (National Institute of Standards and Technology) and PTB (Physikalish-Technische Bundesanstalt (DE)) have established certifications of conformity pertaining to software’s used for geometric, dimensional evaluations.
e- A
B
Figure 1: Explanation graphic; visual description of geometric magnification. Resolution as a function of varied SOD and fixed SDD.
Lesser magnification
Xray Cone:Detection area “A”:Detection area “B”:
Greater magnification
Xray Source
Xray Source
Flat Panel
Imaging Device
Flat Panel
Imaging Device
γ
γ
SOD
SDD
SOD
SDD
e-
e- = Electronγ = Photon

4
Measurement System Analysis (MSA)Confronted with any measurement task, it is critical to qualify the chosen measurement tool for its application. To do this, we perform a measurement system analysis (MSA). Regarding Xray μCT, as applied for metrology applications, it is best practice to dimensionally characterize an exemplary scan specimen with a calibrated machine of defined uncertainty (or “ground truth” measurement system). Measurements of CT data are to be compared with values from the ground truth measurement system to determine accuracy and compound uncertainty of measurements extracted from CT data.
ChallengesVariable feedback defines the challenge of using optical sensors, of all types, for metrology applications. Similar to the way touch probe CMMs (Coordinate Measuring Machines) are ineffective for measuring soft goods (part deforms when contacted by tactile probe), signal feedback for an optical sensor varies dependent on characteristics of the scan specimen ((surface color and specularity, for reflection-based technologies (laser line, structured light)) or material density and thickness for attenuation-based technologies (Xray CT)).
To overcome the challenge of expanded variables associated with Xray μCT, we establish controls specific to the application and characterize
Figure 2: Explanation graphic, composited image. Superimposed scan parameter positions photographed inside machine. Xray source shown on the right.
expanded uncertainty following standardized processes’ (VDI/VDE2630, ISO98-1 GUM, etc).
We correlate measurement uncertainty with manufacturing tolerances to determine if the instrument is suitable for a particular application. Generally, a measurement tool is considered sufficient if uncertainty < 10% control tolerance.
TestOur gage study is comprised of repeated measurements (3x30) of a calibrated scan artifact. The scan artifact is composed of multiple ruby spheres (x3), to be measured as “ball bars”. Using compiled measurement data, we characterize Accuracy by correlating measured values to those from a ground truth measurement system and Repeatability by computing six sigma standard deviations for global and local populations. Acquisition and Reconstruction processes are performed within X-Act software, from RX Solutions, while final surface determination, alignment, and dimensional inspection are completed using Volume Graphics Studio Max v3.4 (NIST and PTB certified), from Hexagon AB.
Data was acquired in sets of 10 at three distinct parameter intervals. Most notably, each group of data was collected at magnification intervals (15, 30, and 60μm voxel size) to evaluate performance across the range of three focal spot sizes available using our 150kV, sealed tube, cone beam Xray source from Hamamatsu.
Xray Source

5
Machine
RX Solutions EasyTom 150kV (RX1805) microCT machine (Figure 3).
– Imager = Varex 2520 DX-I CsI flat panel detector (127µm pixel, 1920x1536)
– Xray Generator = Hamamatsu L12161-07 (150kV, 75W)
Materials
Serialized artifact (Figure 4) with current, valid dimensional certification.
– Maximum uncertainty of calibrated length measurement = 0.11 + L/2625.00 [µm] – ISO 10360 calibration – NIST traceable – A2LA accredited
– Part fixture – fine thread centering jig – Xray filter
- Steel (1.5mm thickness)
Setup
HARDWAREInstall centering jig (part fixture):
– Secure jig to rotary faceplate using center, M6 threaded, mount location (Figure 5).
– Install steel Xray filter to source output window - 1.5 mm thickness
– Secure scan specimen to centering jig – Optimize center position – fine thread
adjustments
SOFTWAREAcquisition Parameters:
– Define magnification and focal spot iterations. Our study evaluates 3 different magnifications, 3 different focal spot sizes.
– 15μm voxel resolution = Small focal spot – 30μm voxel resolution
= Middle focal spot – 60μm voxel resolution
= Large focal spot
– Define optimized scan parameters for each iteration. Our study evaluates three different parameter sets (Figure 5), optimized for each magnification interval (voxel resolution).
Figure 4: Scan Artifact
Figure 3: RX Solutions EasyTom 150kV Xray microCT Machine
Figure 5: (Left) Machine Setup - Scan artifact held by fine thread adjustment fixture, mounted to Rotation stage. (Right) Magnification (Scan Resolution) intervals of study: 15µm (top), 30µm (middle), and 60µm (bottom)

6
Figure 7: Form Analysis - Fit point distribution
– Define flat panel (Imager) calibrations – Black and Gain calibrations – Settings related to each parameter set
– Define repetitions. Our study repeats x10 for each magnification and parameter set
Reconstruction Parameters: – Define templates for automation (x3),
optimized for each parameter set. – Uniform position, volume, and beam
profiles – Enable automatic recalculation of
acquisition specific corrections – Spot Correction
– Corrects focal spot drift – Geometry Correction
– Corrects machine coordinate non-linearities – Enable automatic creation of
Volume Graphics inspection file
– Volume Graphics inspection macro – Surface determination
– Local adaptive – ROI segmentation
– Data alignment – Best fit (pre alignment) – RPS, 3 sphere centers
(inspection alignment) – Dimensional inspection criteria (Figure 6)
– Sphere diameters + form (Figure 7) – 3D distances between sphere
centers – Export results (.csv, .xls, etc)
Analysis
Calculate the following for each of the three individual data groups. Include every piece within respective parameter set (x10):
– Mean – Range – Standard Deviation
– Calculate the following to include all data in a single, cumulative population – Mean – Range – Standard Deviation
Figure 6: Inspection Criteria
12.5000
4
R1 R1.2500
R1
A
6.5
192
6.5192
7 B
C
CT Scan Artifact - Inspection Criteria
A2LA accredited facility to inspect1.Inspection tool to be qualified <0.5µm accuracy•
NIST traceability required2.To be measured at 20°C ± 1°C3.Evaluate Flatness of Datum A4.Evaluate Sphericity of all spherical features (x3)5.Report Distances and Tolerancing to 0.0000 (4) decimal places6.Surface finish not to be altered7.
Avoid epoxy adhesive for sphere measurements•Gage report to doc specified; see reference8.
Sphere diameters and 3D distances for production referance ONLYActual gage dimensions to be certified for field application
NOTE
TYP - Note 7
8 7
A
B
23456 1
578 246 13
E
D
C
F F
D
B
A
E
C
DRAWN
CHK'D
APPV'D
MFG
Q.A
UNLESS OTHERWISE SPECIFIED:DIMENSIONS ARE IN MILLIMETERSSURFACE FINISH: P2TOLERANCES: LINEAR: ANGULAR:
FINISH:
NAME SIGNATURE DATE
MATERIAL:
DO NOT SCALE DRAWING REVISION
TITLE:
DWG NO.
SCALE:5:1 SHEET 1 OF 1
A3
Polished
WEIGHT:
JA 6/1/2021
CTartifact_Print2
CT Scan Artifact
RubyQuartz
Mean and Standard Deviation characterize the distribution of test results. One of the ways these calculations are applied to metrology applications is to characterize uncertainty of results from a measurement system. Uncertainty helps us determine if the measurement system is capable of outputting reliable measurements for any particular application. In practice, Gage R&R data is collected following standard operating procedures (SOP) then, from the resultant data, measurement uncertainty is calculated. Uncertainty is correlated with measurement control tolerances unique to the application then, generally speaking, the measurement system is deemed reliable if uncertainty < 10% of geometric tolerances being evaluated. If uncertainty > 10% (or other threshold deemed acceptable), implementing further SOP process controls may be necessary, including, but not limited to, stabilizing variables associated with environmental conditions, measurement parameters and fixturing inconsistencies.
7
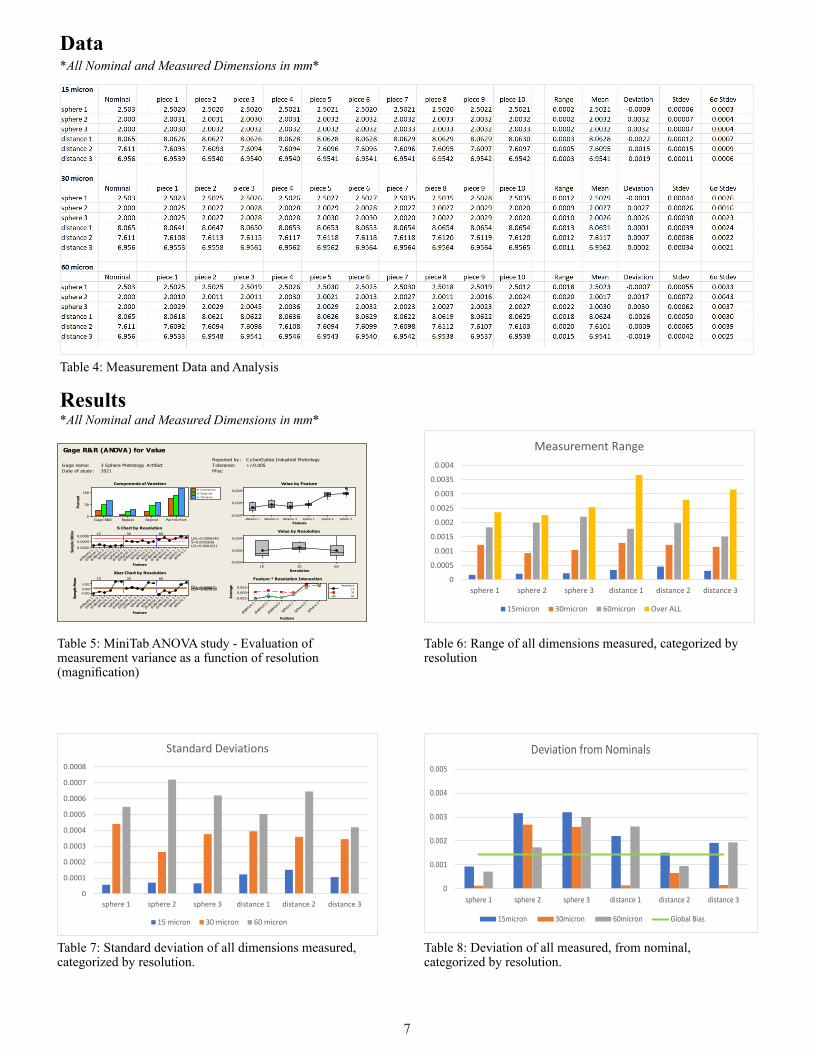
Table 4: Measurement Data and Analysis
Data
Results
0
0.0005
0.001
0.0015
0.002
0.0025
0.003
0.0035
0.004
sphere 1 sphere 2 sphere 3 distance 1 distance 2 distance 3
Measurement Range
15micron 30micron 60micron Over ALL
Table 6: Range of all dimensions measured, categorized by resolution
Part-to-PartReprodRepeatGage R&R
100
50
0
Perc
ent
% Contribution% Study Var% Tolerance
spher e
3
sphere
2
sphere
1
di stan
ce 3
di stan
ce 2
di stan
ce 1
sphere
3
sphere
2
sphere
1
distan
ce 3
distan
ce 2
distan
ce 1
s phere
3
sphere
2
sphere
1
di stan
ce 3
distan
ce 2
distan
ce 1
0.00080.0004
0.0000
Feature
Sam
ple
StDe
v
_S=0.0003636UCL=0.0006240
LCL=0.0001031
15 30 60
spher e
3
sphere
2
sphere
1
di stan
ce 3
di stan
ce 2
di stan
ce 1
sphere
3
sphere
2
sphere
1
distan
ce 3
distan
ce 2
distan
ce 1
s phere
3
sphere
2
sphere
1
di stan
ce 3
distan
ce 2
distan
ce 1
0.0020.000
-0.002
Feature
Sam
ple
Mea
n
__X=0.000246UCL=0.000600LCL=-0.000109
15 30 60
sphere 3sphere 2sphere 1distance 3distance 2distance 1
0.004
0.000
-0.004
Feature
603015
0.004
0.000
-0.004
Resolution
sphere
3
sphere
2
sphere
1
di stan
ce 3
di stan
ce 2
di stan
ce 1
0.0020.000
-0.002
Feature
Aver
age
153060
Resolution
Gage name: 3 Sphere Metrology A rtifactDate of study : 2021
Reported by : C y berO ptics Industrial MetrologyTolerance: +/-0.005Misc:
Components of Variation
S Chart by Resolution
Xbar Chart by Resolution
Value by Feature
Value by Resolution
Feature * Resolution Interaction
Gage R&R (ANOVA) for Value
Table 5: MiniTab ANOVA study - Evaluation of measurement variance as a function of resolution (magnification)
0
0.001
0.002
0.003
0.004
0.005
sphere 1 sphere 2 sphere 3 distance 1 distance 2 distance 3
Deviation from Nominals
15micron 30micron 60micron Global Bias
0
0.0001
0.0002
0.0003
0.0004
0.0005
0.0006
0.0007
0.0008
sphere 1 sphere 2 sphere 3 distance 1 distance 2 distance 3
Standard Deviations
15 micron 30 micron 60 micron
Table 7: Standard deviation of all dimensions measured, categorized by resolution.
Table 8: Deviation of all measured, from nominal, categorized by resolution.
*All Nominal and Measured Dimensions in mm*
*All Nominal and Measured Dimensions in mm*
8
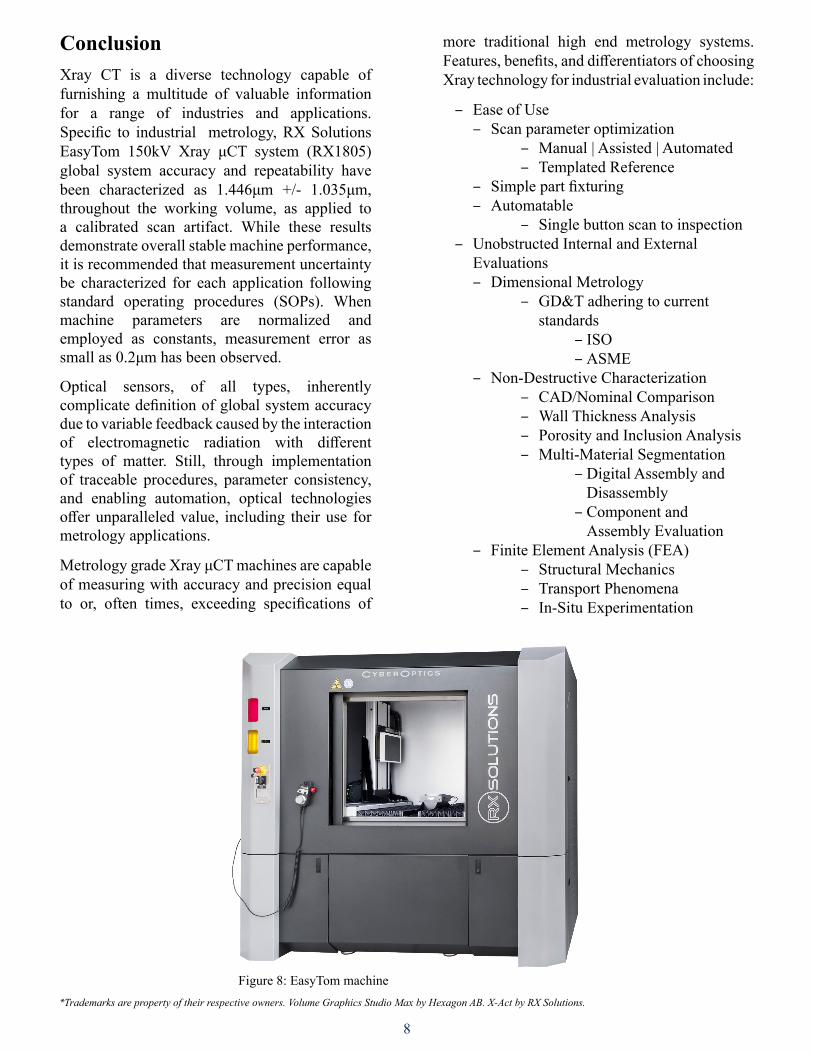
ConclusionXray CT is a diverse technology capable of furnishing a multitude of valuable information for a range of industries and applications. Specific to industrial metrology, RX Solutions EasyTom 150kV Xray μCT system (RX1805) global system accuracy and repeatability have been characterized as 1.446μm +/- 1.035μm, throughout the working volume, as applied to a calibrated scan artifact. While these results demonstrate overall stable machine performance, it is recommended that measurement uncertainty be characterized for each application following standard operating procedures (SOPs). When machine parameters are normalized and employed as constants, measurement error as small as 0.2μm has been observed.
Optical sensors, of all types, inherently complicate definition of global system accuracy due to variable feedback caused by the interaction of electromagnetic radiation with different types of matter. Still, through implementation of traceable procedures, parameter consistency, and enabling automation, optical technologies offer unparalleled value, including their use for metrology applications.
Metrology grade Xray μCT machines are capable of measuring with accuracy and precision equal to or, often times, exceeding specifications of
*Trademarks are property of their respective owners. Volume Graphics Studio Max by Hexagon AB. X-Act by RX Solutions.
Figure 8: EasyTom machine
more traditional high end metrology systems. Features, benefits, and differentiators of choosing Xray technology for industrial evaluation include:
– Ease of Use – Scan parameter optimization
– Manual | Assisted | Automated – Templated Reference
– Simple part fixturing – Automatable
– Single button scan to inspection – Unobstructed Internal and External
Evaluations – Dimensional Metrology
– GD&T adhering to current standards
– ISO – ASME
– Non-Destructive Characterization – CAD/Nominal Comparison – Wall Thickness Analysis – Porosity and Inclusion Analysis – Multi-Material Segmentation
– Digital Assembly and Disassembly
– Component and Assembly Evaluation – Finite Element Analysis (FEA)
– Structural Mechanics – Transport Phenomena – In-Situ Experimentation