industrial robot population density and the neoclassical
TRANSCRIPT
Industrial robot population density and the
neoclassical growth model
Johan le Roux
Student number: 15407081
A research project submitted to the Gordon Institute of Business Science, University
of Pretoria, in partial fulfilment of the requirements for the degree of Master of Business
Administration.
7 November 2016
© University of Pretoria

MBA 2015.16 Industrial robot population density and the neoclassical growth model Johan le Roux
Industrial robot population density and the neoclassical growth model i
Abstract
Neoclassical economic growth model theory identifies technology as a key promotor
of productivity and long-run economic growth. Theory and literature on the subject has
grown significantly since Robert Solow’s seminal work in 1956. Notwithstanding the
substantial literature, gaps remain in several aspects, including the establishment of
suitable metrics that can be applied to assess the impact and influence of certain
technologies, and in particular industrial robots, on the modern economy.
Given these gaps in knowledge, the aim of this study was to support exploratory
research that has found industrial robot density, as a proxy for technology and
automation, to be a relevant metric that correlates with productivity and economic
growth. Decision and policy makers aiming to improve manufacturing productivity and
economic development should find this metric and the associated analysis beneficial
in achieving a better understanding of forces that influence economic performance.
This research was quantitative by design, and used inferential analysis of data from
diverse countries. The suitability of industrial robot density as an econometric measure
was tested with statistical methods.
Strong statistical correlations were found between industrial robot density, productivity
and economic growth in the manufacturing sector. These findings supported existing
growth theory quantitatively, while addressing limitations in previous research by using
a larger sample that included developing countries for the first time.
Keywords
Industrial robot density; productivity; neoclassical economic growth; automation;
econometrics
© University of Pretoria

MBA 2015.16 Industrial robot population density and the neoclassical growth model Johan le Roux
Industrial robot population density and the neoclassical growth model ii
Declaration
I declare that this research project is my own work. It is submitted in partial fulfilment
of the requirements for the degree of Masters of Business Administration at the Gordon
Institute of Business Science, University of Pretoria. It has not been submitted before
for any degree or examination in any other University. I further declare that I have
obtained the necessary authorisation and consent to carry out his research.
________________________
Johan le Roux
7 November 2016
© University of Pretoria

MBA 2015.16 Industrial robot population density and the neoclassical growth model Johan le Roux
Industrial robot population density and the neoclassical growth model iii
Contents
Abstract .................................................................................................................... i
Declaration ...............................................................................................................ii
List of Figures ......................................................................................................... vi
List of Tables ........................................................................................................... vi
List of Acronyms..................................................................................................... vii
1. Introduction to Research Problem .................................................................... 1
1.1. Research Title ........................................................................................... 1
1.2. Technology and Productivity in the Manufacturing Sector Economy ......... 1
1.3. Research Problem .................................................................................... 3
1.4. Research Objective ................................................................................... 4
1.5. Academic Motivation ................................................................................. 5
1.6. Report Outline ........................................................................................... 5
2. Literature Review ............................................................................................. 6
2.1. Introduction to the Literature Review ......................................................... 6
2.2. The Solow Residual and the Neoclassical Economic Growth Model ......... 6
2.3. Manufacturing Sector Productivity ............................................................. 8
2.4. Industrial Robot Density .......................................................................... 10
2.5. The Effect of Increased Industrial Robot Density on Labour .................... 13
2.6. Technology Indicators and Economic Growth ......................................... 15
2.7. Stage of Development ............................................................................. 15
2.8. Methodologies Used for Analysis ............................................................ 16
2.9. Literature Review Conclusion .................................................................. 17
3. Research Propositions and Hypotheses ........................................................ 18
3.1. Introduction ............................................................................................. 18
3.2. Research Propositions ............................................................................ 18
3.2.1. Proposition one: Robot Density and Productivity .............................. 18
3.2.2. Proposition two: Robot Density and Economic Contribution ............. 19
3.2.3. Proposition three: Productivity and Stage of Country Development . 20
© University of Pretoria

MBA 2015.16 Industrial robot population density and the neoclassical growth model Johan le Roux
Industrial robot population density and the neoclassical growth model iv
4. Research Methodology .................................................................................. 21
4.1. Introduction ............................................................................................. 21
4.2. Units of Analysis ..................................................................................... 22
4.2.1. Industrial Robot Density ................................................................... 22
4.2.2. Manufacturing Value Added ............................................................. 22
4.2.3. Manufacturing Worker Productivity .................................................. 22
4.3. Population ............................................................................................... 23
4.4. Sampling Method .................................................................................... 23
4.5. Data Collection ........................................................................................ 24
4.6. Assumptions ........................................................................................... 24
4.7. Data description ...................................................................................... 25
4.7.1. Industrial Robot Density ................................................................... 25
4.7.2. Manufacturing Value Added ............................................................. 26
4.7.3. Manufacturing Sector Employee Productivity ................................... 27
4.8. Data Analysis .......................................................................................... 28
4.8.1. Simple Linear Regression ................................................................ 28
4.8.2. Correlation Analysis ......................................................................... 29
4.9. Limitations ............................................................................................... 30
5. Results ........................................................................................................... 32
5.1. Introduction ............................................................................................. 32
5.2. Description of Sample Obtained .............................................................. 32
5.3. Data Quality Check for Normality ............................................................ 32
5.4. Data Transformations .............................................................................. 35
5.5. Proposition one: Robot Density and Productivity ..................................... 35
5.5.1. Null Hypothesis one Rejected: Robot Density and Productivity ........ 35
5.5.2. Failed to Reject Null Hypothesis one: Robot Density and Productivity .
............................................................................................ 38
5.6. Proposition two: Robot Density and Economic Contribution .................... 38
© University of Pretoria
MBA 2015.16 Industrial robot population density and the neoclassical growth model Johan le Roux
Industrial robot population density and the neoclassical growth model v
5.6.1. Null Hypothesis two Rejected: Robot Density and Economic
Contribution ............................................................................................ 39
5.6.2. Failed to Reject Null Hypothesis two: Robot Density and Economic
Contribution ................................................................................................... 41
5.7. Proposition three: Stages of Economic Development .............................. 43
6. Discussion of Results ..................................................................................... 45
6.1. Introduction ............................................................................................. 45
6.2. Proposition one: Robot Density and Productivity ..................................... 45
6.2.1. Proposition one: Statistical Significance ........................................... 46
6.2.2. Proposition one: Regression Coefficient or Slope ............................ 47
6.2.3. Proposition one: Pearson’s Correlation ............................................ 48
6.2.4. Proposition one: Coefficient of Determination .................................. 49
6.3. Proposition two: Robot Density and Industrial Sector Value Added ......... 51
6.3.1. Proposition two: Regression Significance ........................................ 53
6.3.2. Proposition two: Regression Coefficient or Slope ............................. 53
6.3.3. Proposition two: Pearson’s Correlation ............................................ 55
6.3.4. Proposition two: Coefficient of Determination ................................... 55
6.4. Proposition three: Stages of Economic Development .............................. 57
7. Conclusion ..................................................................................................... 58
7.1. Industrial Robot Density and Worker Productivity .................................... 58
7.2. Industrial Robot Density and Manufacturing Value Added ....................... 58
7.3. Implications for Management .................................................................. 59
7.4. Limitations of the Research ..................................................................... 60
7.5. Recommendations for Future Research .................................................. 61
Reference List ....................................................................................................... 62
APPENDIX 1 – ETHICAL CLEARANCE APPROVAL............................................ 69
APPENDIX 2 – IFR APPROVAL LETTER ............................................................. 70
APPENDIX 3- TURNITIN ORIGINALITY REPORT ............................................... 71
© University of Pretoria

MBA 2015.16 Industrial robot population density and the neoclassical growth model Johan le Roux
Industrial robot population density and the neoclassical growth model vi
List of Figures
Figure 1. Typical examples of industrial robots. ..................................................... 11
Figure 2. Number of industrial robots per 10,000 employees................................. 12
Figure 3. Number of industrial robots per 10,000 employees (continued). ............. 12
Figure 4. Japan, not normal data for total manufacturing value added .................. 33
Figure 5. The Republic of Korea, not normal data for productivity. ........................ 34
Figure 6. Estonia normal data for manufacturing value added per employee ........ 34
Figure 7. Combined X-Y scatterplot of all 38 countries. ......................................... 44
Figure 8. Malaysia Productivity Slope .................................................................... 48
Figure 9. China X Y Scatterplot with r squared. ..................................................... 50
Figure 10. The Republic of Korea, scatterplot with slope. ...................................... 54
Figure 11. China X Y scatterplot with r squared, manufacturing value added. ....... 56
List of Tables
Table 1. Industrial robot density data per country and year ...................................... 26
Table 2. Manufacturing value added data example .................................................. 27
Table 3. Manufacturing sector employee productivity data ....................................... 28
Table 4. Ryan-Joiner normality test, selected countries. .......................................... 33
Table 5. Proposition one: Robot Density and Productivity, H0 Rejected .................... 37
Table 6. Proposition one: Robot Density and Productivity, Failed to Reject H0 ......... 38
Table 7. Proposition two: Robot Density and Economic Contribution, H0 Rejected ... 40
Table 8. Proposition two: Robot Density and Economic Contribution, Failed to Reject
H0 ............................................................................................................................. 42
© University of Pretoria

MBA 2015.16 Industrial robot population density and the neoclassical growth model Johan le Roux
Industrial robot population density and the neoclassical growth model vii
List of Acronyms
CEP Centre for Economic Performance
GDP Gross Domestic Product
IFR International Federation of Robotics
ISIC International Standard Industrial Classification
ISO International Organization for Standardization
OECD Organisation for Economic Co-operation and Development
TFP Total Factor Productivity
© University of Pretoria
MBA 2015.16 Industrial robot population density and the neoclassical growth model Johan le Roux
Industrial robot population density and the neoclassical growth model 1
1. Introduction to Research Problem
1.1. Research Title
Industrial robot population growth and the neoclassical growth model.
1.2. Technology and Productivity in the Manufacturing Sector Economy
Automation, technological innovation and increased productivity in the
manufacturing sector are fundamental factors that are linked to the neoclassical
economic growth model. One only has to reflect back on the economic impact of
the industrial revolution following the invention of steam engine technology in the
18th century to realize the great impact technological advances have had on the
manufacturing sector and the world economy as a whole. Were the number of
steam engines employed per country measured, recorded and used to make
business investment decisions and to explain and predict economic growth during
the industrial revolution? Are industrial robots our modern day steam engines, and
can a statistical evaluation of new robotic installations be shown to have strong
correlation with productivity increases and economic growth?
The impact of robotic automation on the economy is certainly contemporary and
topical. The Financial Times (2016) featured a four-day series on the robot
economy, titled: “Robots: Friend or Foe”. Topics covered were: The Robot
Economy, Living with Robots, Working with Robots and The Human/Robot Future.
Waters and Bradshaw (2016) reported that the robot market (manufacturing, sales
and installations) would reach $135bn by 2019, and that patents covering robot
technology have recently soared. While these periodical articles are not necessarily
suitable for a literature review, it does indicate that this proposed research covers
a topic that is current and relevant. This again supports the need for the proposed
study, which will not be based on opinion or speculation, but a quantitative study on
actual secondary data.
The so-called Fourth Industrial Revolution was also a primary topic of the 2016
World Economic Forum in Davos Switzerland. Klaus Schwab, founder and
executive chairman of the World Economic Forum discussed the first (water and
steam mechanisation), the second (electric power) and the third (electronics and
information technologies) industrial revolutions. He further introduced the current
© University of Pretoria
MBA 2015.16 Industrial robot population density and the neoclassical growth model Johan le Roux
Industrial robot population density and the neoclassical growth model 2
fourth industrial revolution as a fusion of technologies that could increase global
income levels and benefit mankind, as reported by Trudeau (2016). Key amongst
these technologies are advances being made in robotics and the way robots are
integrated with emerging technologies.
Industrial robots are increasingly being used to substitute for labour and to increase
productivity (Autor, 2015; Mokyr, Vickers & Ziebarth, 2015; Krone, 2014). The
increased use of industrial robots, defined through industrial robot density, was
shown to correlate with increased economic growth in the recent exploratory
empirical study of 17 developed countries (Graetz & Michaels, 2015).
Industrial robot density is a parameter derived from actual industrial robot
installations reported annually by the International Federation of Robotics’ statistical
department and is defined as the number of industrial robots per 10 000 industrial
workers. A thorough literature review identified that there is a need to substantiate
industrial robot density as an indicator and key promotor of economic growth in
developed economies, and to expand the correlation between robot density and
productivity and gross domestic product contribution to emerging economies. The
potential to expand Graetz and Michaels’ (2015) findings to emerging economies is
supported by Rodrik (2012), where he found cross-country convergence of
improvements in productivity when comparing developed and developing countries’
productivity. This suggests that developing countries should achieve comparatively
high rates of productivity improvement when introducing benchmark technologies.
The relevance of robotics in improving productivity and enabling economic growth
was expressed by Chinese President Xi Jinping in a speech in 2014 when he called
for a "robot revolution", affirming automation's key role in raising productivity in
China (Chan, 2015), thus further supporting the relevance and need for this
research. In 2013, 36 560 Robots were installed in China, 59 per cent more than in
2012 (International Federation of Robotics, 2014), followed by further growth of 56
per cent in 2014 (International Federation of Robotics, 2015). This rapid growth
could be explained by national policies implemented by the Jinping government to
stimulate the proliferation of industrial robotic installations.
This research aims to show that industrial robot density is an ideal metric to track
the pace of the revolution, as emerging technologies in fields such as artificial
intelligence, advanced multiple axis motion, sensing technologies, connectivity,
nanotechnology, biotechnology, materials science, energy storage, and quantum
computing are actively integrated into robot and manufacturing technologies.
© University of Pretoria

MBA 2015.16 Industrial robot population density and the neoclassical growth model Johan le Roux
Industrial robot population density and the neoclassical growth model 3
To put the scale of the robot industry into perspective, consider that the total number
of new industrial robot installations was 229,261 in 2014 (International Federation
of Robotics, 2015). This was 29 per cent more than in 2013, and by far the highest
level of new installations ever recorded for one year. These new installations
brought the total of installed operational industrial robots to 1,480,800 (International
Federation of Robotics, 2015) at the end of 2014. Comparing this growth rate of 29
per cent to the estimated global human population growth rate of just over one per
cent per annum (United States Census Bureau, 2016), the significance of the
comparative growth rates and the economic impact of the accelerated growth in the
industrial robot population cannot be underestimated.
1.3. Research Problem
Automation, mechanisation and the implementation of new technologies as a key
promotor of long-run economic growth is a well-established concept (Dowrick &
Rogers, 2002). Identifying simple metrics to determine the significant correlation
between technology, productivity and economic contribution in the manufacturing
sector remains a problem. Empirically measuring and evaluating the levels and
extent of technology in the manufacturing sector through industrial robot density
and its relation to productivity and economic growth was done recently for the first
time by Graetz and Michaels (2015).
Investigating and confirming that the accurately measured and reported trends of
industrial robot installations is a valid proxy or indicator for automation and
technology in the industrial sector will be invaluable for accurate econometric
analysis. Due to the technological nature of industrial robots, installations in
manufacturing facilities are not done in isolation from related technology. A typical
robot installation is integrated with peripheral automation system installations, such
as programmable logic controllers, computer based control, monitoring systems
and industrial information technology networks. The significance of this integrated
nature of automated industrial installations to this study is that industrial robots
represent more than just the pieces of equipment, but can be used as a valid
indicator for the level and intensity of automation and technology utilized in the
respective manufacturing economies.
© University of Pretoria

MBA 2015.16 Industrial robot population density and the neoclassical growth model Johan le Roux
Industrial robot population density and the neoclassical growth model 4
1.4. Research Objective
The aim of this quantitative study will be to identify and quantify the correlation of
the statistical relationship between robot density, productivity and economic growth,
with specific focus on including developing countries. The statistical significance,
and applicability as a metric or indicator of economic growth models of this research
analysis and findings will be investigated.
This study of industrial robot density in relation to productivity and manufacturing
sector economic value added could establish it as an economic metric. This new
metric may be useful to organisational, industrial and national policy decision
makers aiming to analyse productivity and make technology investment decisions
on company, industry and national levels.
The author contends that there is an academic and economic need to identify
simple, available metrics to accurately evaluate the level and efficacy of technology
in the industrial sector. If proven significant, such metrics would be beneficial to
economists, analysts and policy makers.
Furthermore, this research aims to show that industrial robot density is an accurate,
relevant metric and key promotor of increased productivity and the resulting
economic growth in the secondary economic sector, across developed and
developing countries.
The extent of correlation will thus determine whether robot density trends can be
used as a manufacturing sector economic indicator, similar to the agricultural
machinery, tractors per 100 square kilometres of arable land (denoted by
AGRMACH) indicator tracked by the World Bank (2016). The similarity between
industrial robots and agricultural machinery is that in each case human labour is
replaced by technology in order to increase productivity and economic contribution.
© University of Pretoria
MBA 2015.16 Industrial robot population density and the neoclassical growth model Johan le Roux
Industrial robot population density and the neoclassical growth model 5
1.5. Academic Motivation
The principle of diminishing marginal productivity gains on new robot installations
in developed countries was identified as a limitation by Graetz and Michaels (2015).
The authors remarked that recent evidence suggested that robots were increasingly
used in developing countries, and that the contribution to growth might be even
greater than shown in developed countries. Data limitations were cited as the
reason for the shortcoming in the research.
Identifying reliable and accurate metrics in order to determine the relationship
between technology, productivity and economic contribution on a global scale, thus
including developing countries, remains an area to which research can contribute.
This study will explore and expand on the exploratory research titled: “Robots at
Work”. In this research, Graetz and Michaels (2015) evaluated the economic and
productivity impact of industrial robots based on data from 17 developed countries
covering the period from 1993 to 2007. Their conclusion was that the increased
deployment of industrial robots contributed 10 per cent of annual aggregate
economic growth rate (Graetz & Michaels, 2015).
It is thus proposed that there is a need to explore the research with a more recent
and complete dataset, covering 38 countries and data up to 2014. It is specifically
relevant to evaluate the co-variance in developing countries, where increasing
industrial robot density has not yet reached the plateau of diminishing returns. This
study will utilise the available data to fill the void and explore the identified research
opportunity.
1.6. Report Outline
This report continues in Chapter 2 with an overview of the relevant theory and
literature concerning economic growth theory, productivity, industrial robot density
the effect of increased industrial robot density on labour and unemployment,
technology indicators, stages of country development and research methodology.
This is followed by Chapter 3 that covers the research questions and propositions,
and Chapter 4 where the research methodology is presented. Research results are
presented in Chapter 5 and discussed in Chapter 6. The research will conclude with
Chapter 7 where the findings, management implications, limitations and
suggestions for future research will be presented.
© University of Pretoria

MBA 2015.16 Industrial robot population density and the neoclassical growth model Johan le Roux
Industrial robot population density and the neoclassical growth model 6
2. Literature Review
2.1. Introduction to the Literature Review
The literature review is divided into four distinct sections: Economic growth,
productivity, industrial robot density, the effect on labour, technology indicators and
stage of development and methodologies used for analysis. Lastly, it concludes with
salient observations to consolidate the literature review.
2.2. The Solow Residual and the Neoclassical Economic Growth Model
Burda and Severgnini (2014) stated that for half a century the Solow decomposition
and residual theory have been used to define and measure the productivity
component of growth in economics and management. The work by Solow (1957)
remains influential, as it broke the limitations of the contemporary and restrictive
labour and capital input growth models of the period.
In Robert Solow’s (1956) seminal essay: “A Contribution to the Theory of Economic
Growth”, he supposed that the single composite product is produced by labour and
capital, and that in a new growth model it should be possible to substitute labour
with capital. The so-called Solow residual can be explained by the phenomenon
where the growth rate in output exceeds that of the growth rate of inputs (Ten Raa,
2011). This paved the way for the inclusion of productivity as a metric included in
long-run economic growth theory, and in this context, why the increased productivity
achieved through ever advancing robotic technologies and rate of implementation
are important to study. Robert Solow’s research was core to theoretical concepts of
which the Solow residual, total factor productivity (TFP), the Solow decomposition
and the neoclassical growth model were relevant to this research.
Robert Solow’s (1956) seminal essay introduced the framework for the
development of the neoclassical growth model. In theory, it is well established that
productivity is a key enabler of long-run economic growth (Autor, 2015; Krone,
2014; Mokyr et al., 2015). Bernard and Durlauf (1996) described the technological
growth component as exogenous technical change, and advances in robot
technology forms an integral part of recent technological growth. Similarly,
Gourinchas and Jeanne (2013) argued that according to the neoclassical growth
model, growth is driven by an exogenous productivity path. Furthermore, each
© University of Pretoria
MBA 2015.16 Industrial robot population density and the neoclassical growth model Johan le Roux
Industrial robot population density and the neoclassical growth model 7
countries’ productivity path in relation to the world technology frontier determines
capital flows into the country. The consequence of this is that when developing
countries embrace new technologies in order to improve productivity, the
neoclassical model postulates that foreign direct investment into the country should
increase.
Halsmayer (2014) concluded on Roberts Solow’s growth theory that while he was
not the first to show that economic growth was not entirely dependent on capital
accumulation and labour input, Solow was the first to have clearly articulated the
residual, which is referred to as the productivity component and explained shifts in
the production function. This study identified industrial robots as a quantifiable
metric that represents the capital employed to utilise technology in order to increase
productivity.
Conversely, Petrin, White and Reiter (2011), analysed the aggregate Solow
residual by isolating the aggregate plant resource reallocation and aggregate
technical efficiency aspects of productivity growth. On average, reallocation of
resources was responsible for more of the growth than technical efficiency. In
essence, they found that doing the right things is more important than doing things
right. While the findings made by Petrin et al. (2011) might be interpreted as
downplaying technological efficiency, both organisational and technological
efficiency remains the optimal goal.
As Ten Raa (2011) concluded, industries may achieve increased productivity
growth through technical progress or by through organisational efficiency and that
the combined performance remains consistent with the Solow residual and
Malmquist productivity indices.
The role of technology to improve productivity was evident in Crafts (2015)
assessment when he reviewed economic growth in the United Kingdom over the
past 30 years: “The information, communication and technology (ICT) revolution did
deliver and, as a pleasant surprise, the UK turned out to be much better at exploiting
its opportunities than had been the case with Fordist manufacturing” (p. 236).
The Solow decomposition and resultant neoclassical growth model is the theoretical
framework for the suitability of industrial robot density as an accurate metric and
enabler of economic growth within long-run economic growth theory framework.
© University of Pretoria

MBA 2015.16 Industrial robot population density and the neoclassical growth model Johan le Roux
Industrial robot population density and the neoclassical growth model 8
2.3. Manufacturing Sector Productivity
For the purpose of this study, the author chose to use one of the most basic
definitions and measurements of productivity, namely the ratio of value added to
the number of workers in the manufacturing industry per country. According to
Brandt, Van Biesebroeck and Zhang (2012) this was the most widely used measure
of labour productivity. An advantage to using this measure was that it could be
derived from the raw secondary data sourced from the World Bank and the
International Labour Organisation, and that the respective data could be sourced
from the same databases for the 38 countries in the sample. This prevented any
bias that could have emanated from different data sources, which would have
negatively impacted this correlational study.
Calver (2015) analysed the comparison between gross output based productivity
and value added based productivity growth measurements, and warned that while
the methods are comparable in the short term, differences are observed over longer
periods. Based on his conclusion that researchers should be wary of combining
these two methods when comparing productivity across countries or regions, this
study will standardise on the value added productivity measure for all countries in
the sample.
The gross value added at current basic prices and the total number of persons
engaged were also used by Mihai and Jivan (2014) in their comparative study of
productivity measurements across five European countries. This method concurred
with the work of Brandt et al. (2012), and supported the selection of productivity
measurement used in this research.
Below follows a review of contemporary views and measurement of productivity and
how it is impacted by advances in technology. While some of the productivity
measurements, such as total factor productivity, were not used in this study, the
theory, research findings and general principles regarding productivity in the
broader sense remained applicable to this study.
Baldwin and Teulings (2014) defined total factor productivity as a weighted average
of the ratio of output to labour input and the ratio of output to capital input, where
both types of inputs are adjusted for quality changes. The difference between
single-factor and multi-factor productivity, of which total factor productivity is an
example, was explained by Lieberman and Kang (2008). Multi-factor productivity
ratios take into account the weighted averages of multiple inputs. They identified
© University of Pretoria

MBA 2015.16 Industrial robot population density and the neoclassical growth model Johan le Roux
Industrial robot population density and the neoclassical growth model 9
labour productivity, or value added per worker hour, as used in their study as the
most simplified and widely used method, but also combined it with other weighted
input factors to yield multi-factor productivity. Lieberman and Kang (2008)
continued the explaining the difficulty in calculating the often arbitrarily measured
capital, material and energy inputs, and stated that: “Unlike labour productivity,
capital productivity is not directly interpretable as an indicator of economic welfare,
but it does provide an indicator of the efficiency of resource use” (p. 11).
Calculating multi-factor weightings and productivity ratios per company, industry
and country is thus a complex matter, open to subjectivity, and not ideal for a
comparative study such as this one. Subsequently, single factor labour productivity,
namely value added per unit of labour unit as described by Mihai and Jivan (2014),
Brandt et al. (2012) and Lieberman and Kang (2008) was used for this study.
The so-called productivity paradox was presented by Brynjolfsson and Hitt (1998),
the paradox discussed was the weak correlation between information technology
investments and productivity in the United States since 1973. Productivity
stagnated despite the rapid growth in computing power stemming from Moore’s law,
and wide adoption of computers. One explanation for this was that not all
information technology investment was aimed at cutting costs or improving
productivity, and that quality and customer service were identified is the primary
reasons for these investments. The reasons for investing in industrial robots today
are, however, overwhelmingly focussed on cost reduction and productivity
increases. Pratt (2015) proposed that robotics is a technology that might improve
productivity at an ever faster rate than previous technological advances, to the point
where it might disrupt the economy as the industrial revolution disrupted the textile
industry two centuries ago. It is thus doubtful that a study of industrial robotics and
productivity should face challenges similar to the productivity paradox of the
information technology sector discussed by Brynjolfsson and Hitt (1998).
Theoretically, the increase in total factor productivity yielded a high long-run growth
of an economy (Oh, Heshmati, & Lööf, 2012). Factors enabling productivity
improvements included product and process technology, skills and innovativeness.
Of relevance to this study is that industrial robot density has been identified as an
accurate, measurable parameter for process technology in the manufacturing
sector.
As found by Rodrik (2012), and applied by Inklaar and Diewert (2015), productivity
in the non-traded industries is convergent across countries. The phenomenon of
© University of Pretoria

MBA 2015.16 Industrial robot population density and the neoclassical growth model Johan le Roux
Industrial robot population density and the neoclassical growth model 10
cross country technology convergence was quantified by Dowrick and Rogers
(2002) at 3.4 per cent per annum. This quantified convergence implied that a
country’s technological development level will catch up with the global technology
benchmark within 20 years. The consequence is that improvements in productivity
are not restricted to certain countries, and that the macro-economic trends in
productivity spans borders. Furthermore, Inklaar and Diewert (2015) concluded that
during the 2007-2011 period, the world market TFP growth slowed from 1.1 per
cent to 0.6 per cent, and was caused by the contraction of the traded sector.
Conversely, during the same period the non-traded sector TFP expanded by 2.6
per cent per year from 2007 to 2011. This indicates the growth potential in the
nontraded manufacturing industries and could result in increased global productivity
growth, specifically in developing countries.
While Rodrik (2012) addressed cross country productivity convergence, Solow
(2001) expressed scepticism over applying growth theory regressions across
multiple countries, especially when developed industrialized countries, and
developing countries were being compared. His view seems problematic for this
study, but Solow (2001), however maintained that productivity remains a valid
metric for long-run economic growth, regardless whether the driver of productivity
change was technical or non-technical. Therefore, the theory of increased
productivity associated with increased use of new technology holds true for the
purpose of this study.
2.4. Industrial Robot Density
Firstly, a clear definition of exactly what is understood of industrial robots is required.
Below follows the official definition of industrial robots by ISO 8373:2012:
“An automatically controlled, reprogrammable, multipurpose manipulator
programmable in three or more axes, which can be either fixed in place or mobile
for use in industrial automation applications” (ISO, 2012, p.3).
Elaborating on this formal definition, one can describe industrial robots as computer
controlled machines that perform designated manipulation tasks in three or more
planes. Industrial robots are typically installed in factories and industrial plants as
part of greater automation systems. Industrial robots are not service robots, which
are popularly portrayed as android-like robots that interact with humans, talk and
© University of Pretoria
MBA 2015.16 Industrial robot population density and the neoclassical growth model Johan le Roux
Industrial robot population density and the neoclassical growth model 11
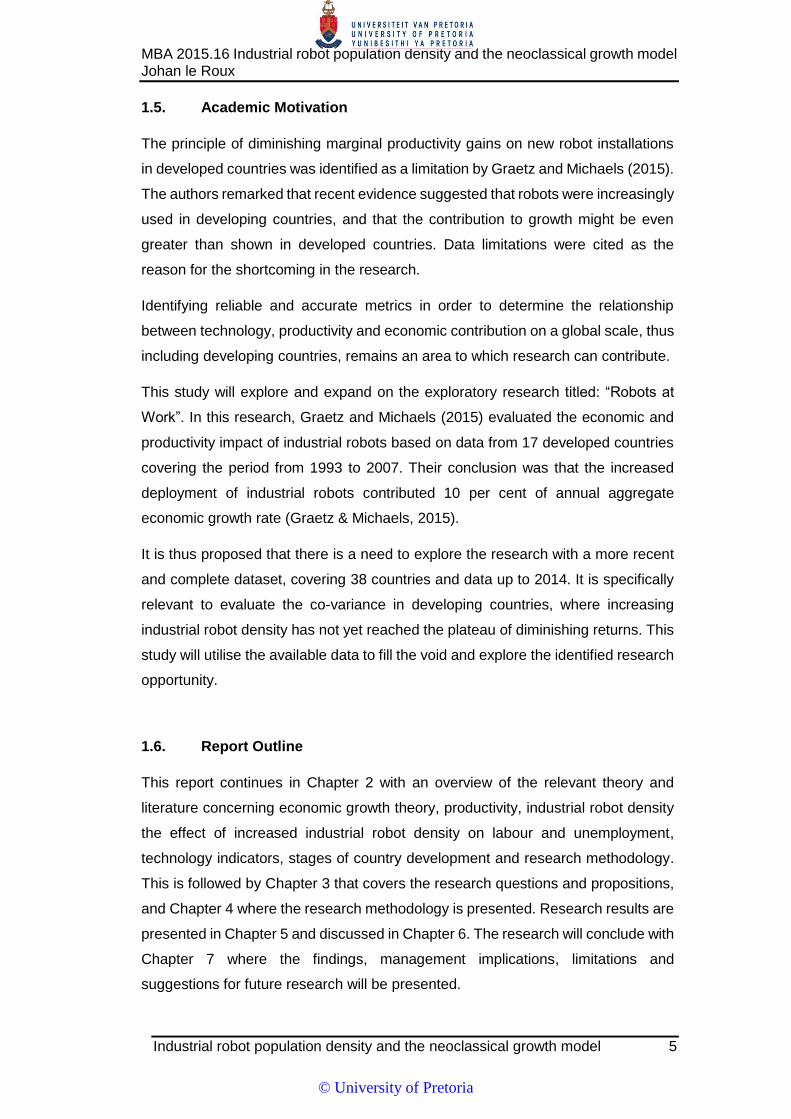
perform cleaning or similar tasks. For illustration purposes, Figure 1 shows typical
examples of industrial robots.
Figure 1. Typical examples of industrial robots.
Source: Authors own.
The global supply of industrial robots is accurately monitored and published annually
in the publication World Robotics Industrial Robots by the International Federation
of Robotics’ Statistical Department. The general parameter of interest was industrial
robot density per country, which was reported as the number of industrial robots per
10 000 industrial workers in each specific country.
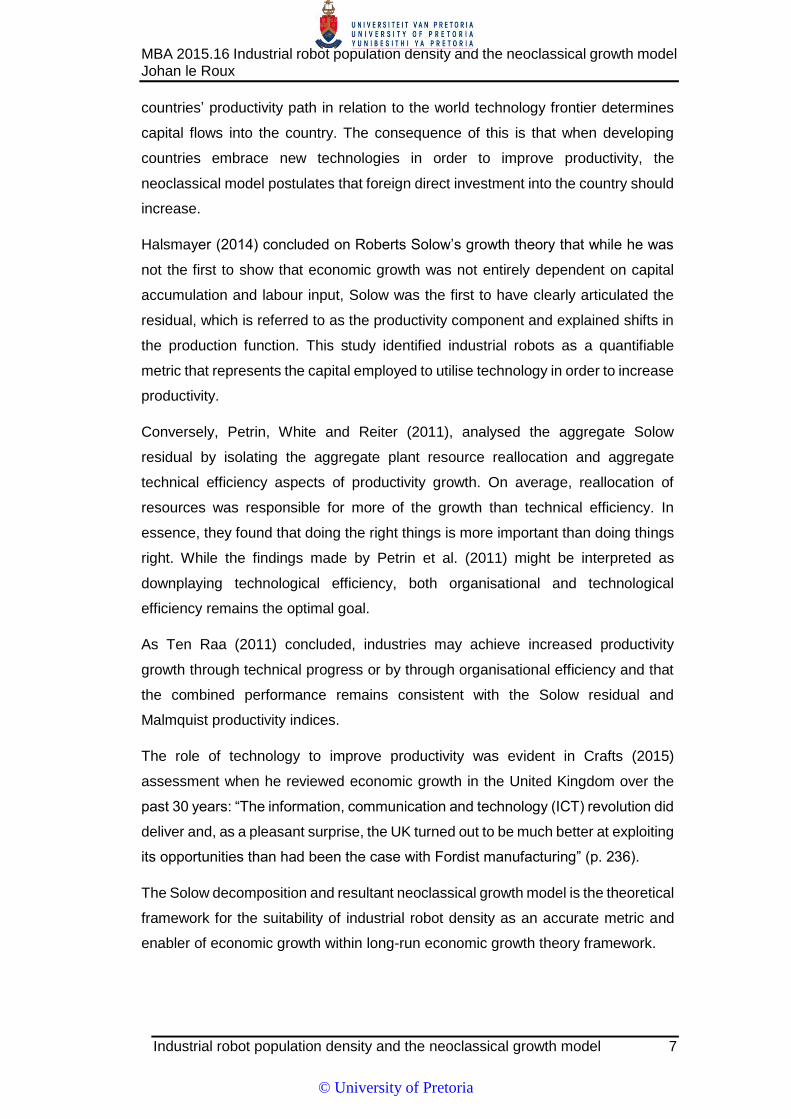
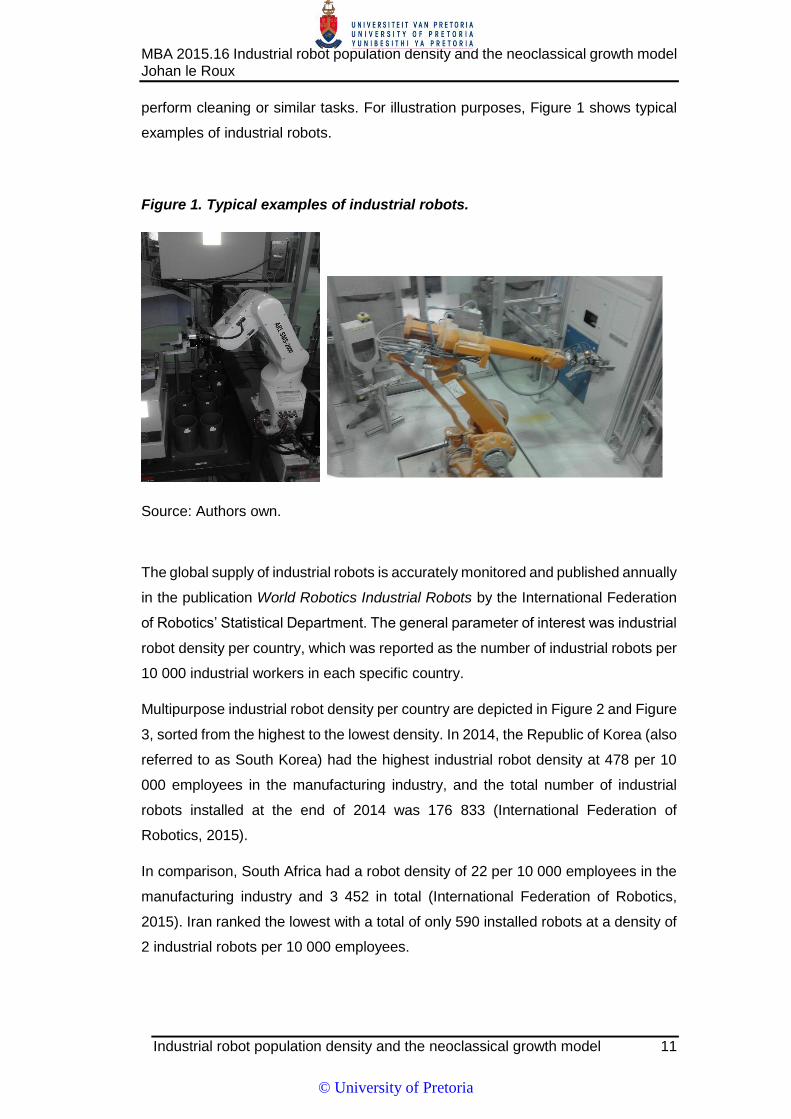
Multipurpose industrial robot density per country are depicted in Figure 2 and Figure
3, sorted from the highest to the lowest density. In 2014, the Republic of Korea (also
referred to as South Korea) had the highest industrial robot density at 478 per 10
000 employees in the manufacturing industry, and the total number of industrial
robots installed at the end of 2014 was 176 833 (International Federation of
Robotics, 2015).
In comparison, South Africa had a robot density of 22 per 10 000 employees in the
manufacturing industry and 3 452 in total (International Federation of Robotics,
2015). Iran ranked the lowest with a total of only 590 installed robots at a density of
2 industrial robots per 10 000 employees.
© University of Pretoria
MBA 2015.16 Industrial robot population density and the neoclassical growth model Johan le Roux
Industrial robot population density and the neoclassical growth model 12
Figure 2. Number of industrial robots per 10,000 employees.
Source: Adapted from International Federation of Robotics (2015) data.
Figure 3. Number of industrial robots per 10,000 employees (continued).
Adapted from International Federation of Robotics (2015).
© University of Pretoria
MBA 2015.16 Industrial robot population density and the neoclassical growth model Johan le Roux
Industrial robot population density and the neoclassical growth model 13
This valuable source of data was first used in exploratory academic research to
correlate industrial robot density to increases in productivity and value-added by
Georg Greatz, assistant professor at the Department of Economics at Uppsala
University, Sweden and Guy Michaels, Research Associate at the Centre for
Economic Performance, London School of Economics and Political Science in 2015,
CEP Discussion Paper No 1335.
A gap identified in this research was that Graetz and Michaels only evaluated
industrialized developed countries from Europe, Australia, South Korea and the
United States. This research proposal contends that similar work is of specific
relevance and importance to developing countries, where opportunities for robot
applications in manufacturing industries and potential for economic growth is higher
than the previously studied developed counties.
In his article, “Increasing Workforce Productivity: Smarter People and Machines”,
Krone (2014) argued that increased productivity gave companies and countries a
competitive economic advantage. Of further significance was that the pace of
technological innovation was increasing (Brynjolfsson & McAfee, 2011), and in the
current global market conditions, it is imperative that technological progress and its
effect on economies are measured and predicted if possible. This research will
explore the potential to develop increasing industrial robot density as a metric for
increased application of technology, productivity and economic growth, especially
in developing countries which were not included in Graetz and Michaels’ (2015)
study.
2.5. The Effect of Increased Industrial Robot Density on Labour
Arguments against technology and automation have been raised over two
centuries, Autor (2015), in his aptly named article: “Why Are There Still So Many
Jobs? The History and Future of Workplace Automation” investigated the Luddite-
like concerns that automation and robots destroyed jobs. He concluded that while
robots do in most cases substitute for human labour, these are mostly unskilled
labour performing menial tasks. Autor (2015) further emphasised that robots did in
fact compliment labour, improved productivity and stimulated the economy which in
turn created more employment. The phenomenon also allowed labourers to acquire
skills in order to gain middle and higher levels of employment that required a mixture
of tasks from across the skills spectrum.
© University of Pretoria

MBA 2015.16 Industrial robot population density and the neoclassical growth model Johan le Roux
Industrial robot population density and the neoclassical growth model 14
Seemingly opposing this view, Kristal (2013) showed that labours’ share of
production output declined by six per cent, and that this was due to the increasing
levels of computerisation, automation, and robots. This benefited capitalists and
highly skilled workers more than labourers. Substantiating this view, Milkman
(1997) found that at a General Motors automobile assembly plant in North America,
production workers were reduced by approximately a third when the plant was
technologically modernized.
The following interesting viewpoint was raised by Mokyr et al. (2015). In a
hypothetical case where labour was totally substituted by automation, it might
become necessary for the holders of capital, or government, to supplement the
income of some classes of workers through wealth distribution. While the labour
implications were not the focus of this research, it is noteworthy that the potential of
automation to create wealth in future could be so great that the need for wealth
redistribution to the unemployed is foreseen.
Brynjolfsson and McAfee (2012) also concluded that technology may substitute for
human labour in ever increasing instances, which may be good for business but not
individuals who lose their jobs. However, computers (technology, robots) are not
good at many things and human skills will remain in demand. Brynjolfsson and
McAfee (2012) further identified general skills that humans should attain and utilize
to use computers, rather than compete against them. These identified skills
generally had creativity in common, and included: applied mathematics and
statistics, negotiation and group dynamics, creative writing, framing problems and
solving open-ended problems, persuasion and human interaction, and nurturing.
This was comparable to the opinion of Crafts (2015) when he stated: “Tasks which
will probably not be susceptible to computerization are those involving perception
and manipulation, creative intelligence, or social intelligence” (p. 235). This
indicates that not all theorists fear that robots will be taking over most human jobs.
While the effect of automation and robotics in particular on rates of employment is
contemporary and of great importance, it will not have a direct impact on this study,
as the data used will represent economic performance and not the specific socio-
economic factors such as unemployment and income disparity.
© University of Pretoria
MBA 2015.16 Industrial robot population density and the neoclassical growth model Johan le Roux
Industrial robot population density and the neoclassical growth model 15
2.6. Technology Indicators and Economic Growth
The principle of specific technologies or deployment of technological equipment as
economic growth indicators or metrics is well established. An example that is
functionally similar to the prospect for using industrial robots as an economic growth
indicator in the manufacturing sector is the established use of agricultural
machinery and tractors per 100 square kilometres of arable land economic
indicator, as monitored and reported by the World Bank and represented by the
acronym AGRMACH. The relevance of agricultural machinery and tractors are clear
in the article by Alston and Pardey (2014), in which they attributed the increase in
agricultural productivity to the increased use of agricultural machinery and tractors.
This was corroborated by Khan, Khan, Zaman, and Khan (2014) in their study of
relieving rural poverty and economic growth in Pakistan. They found that variance
decomposition analysis showed that the agricultural machinery and tractors per 100
square kilometres exerted the largest positive degree of influence on economic
growth in the rural economy. This conclusion lends credibility to the potential of
industrial robots to be a useful indicator for economic growth in the manufacturing
sector. Agricultural machinery and tractors are similar to industrial robots, in that in
both cases sizable investments in technology are made for the purpose of improving
productivity in a specific economic sector, and sales and deployment of the
equipment are accurately recorded and reported for use by analysts and
researchers.
2.7. Stage of Development
The stage of development of each country as defined by the United Nations (2014)
publication, World Economic Situation and Prospects 2014, were used to classify
each of the 38 countries in the research sample as either developed or developing.
The Development Policy and Analysis Division of the Department of Economic and
Social Affairs of the United Nations Secretariat based the country classification on
basic economic country conditions (United Nations, 2014).
This classification will be used to observe whether the statistical correlation between
industrial robot density and worker productivity as shown by Graetz and Michaels
(2015) for 17 developed countries also holds for the 11 developing countries
included in this research.
© University of Pretoria
MBA 2015.16 Industrial robot population density and the neoclassical growth model Johan le Roux
Industrial robot population density and the neoclassical growth model 16
2.8. Methodologies Used for Analysis
This quantitative, descriptive, relational statistical study of industrial robot density
versus industrial worker productivity and total manufacturing value added per
country, using secondary data, was done using correlation and linear regression
techniques. This research design used similar techniques to that of the research by
Mihai and Jivan (2014), Khan et al. (2014) and Alston and Pardey (2014).
The Pearson’s correlation method was specifically used by Mihai and Jivan (2012),
in a similar study determine the correlation strength between productivity and gross
output and gross domestic product per capita, and the correlation between different
types of productivity measurements. The interpretation of the Pearson’s correlation
results (r) and coefficient of determination (r2) were based on guidelines provided
by Cohen (1998). The guidelines for interpretation of the Pearson’s correlation
coefficient values greater than 0.3 were regarded as moderate, values greater than
0.5 large or strong linear associations.
Baird and Bieber (2016) proposed the use of the least squared estimate of the slope
of the independent variable predictive of the dependent variable, and is the answer
to the research question, “how is the independent variable predictive of the
dependent variable”. In this study, the regression of industrial robot density is
proposed to be predictive of productivity and manufacturing value added
respectively. The respective slopes, or β, were proposed to be positive for the
management proposition in this study. The proposition tested whether the variability
in industrial robot density is associated positively with the variability in productivity
and manufacturing value added respectively.
Confidence intervals were constructed at the 95 per cent confidence interval, with
p at 0.05. The calculated p-values were evaluated, as it is a measure of the
significance of the relationship between the predictor and response variables, and
answers the question: “Is the statistical relationship between x and y, as given by
the regression equation, a genuine relationship or is it due purely to chance?”
(Wegner, 2012, p. 311). For the purpose of this research, p-values less than 0.05
were interpreted as significant at a confidence interval of 95 per cent. With the
significance level set at for p < 0.05, there was only a 5 per cent chance of making
a Type I error of rejecting a true null hypothesis.
Notably, Greenland et al. (2016) raised concerns about the misinterpretations of p
values and confidence intervals. They proposed the view that the p value should be
© University of Pretoria

MBA 2015.16 Industrial robot population density and the neoclassical growth model Johan le Roux
Industrial robot population density and the neoclassical growth model 17
interpreted as a statistical summary of the compatibility between the observed data
and what was predicted if the entire statistical model were known. Furthermore, the
p value should be seen as simply indicating the degree to which the data conforms
to the correlation predicted by the null hypothesis and the other assumptions used
in the model. Thus a p value of p < 0.05 shows that the data are not similar to what
the null hypothesis predicted they should be, and that the null hypothesis can be
rejected in favour of the alternative hypothesis (Greenland et al., 2016, p. 340). The
prevalence of making a Type I error of rejecting a true null hypothesis would only
be in 5 per cent of cases. It is noteworthy that Greenland et al. (2016) refers to the
confidence level not as the chance of making an error, but how often you would
have incorrectly rejected a null hypothesis.
2.9. Literature Review Conclusion
The literature reviewed gave theoretical evidence of the role of productivity and
technology in the neoclassical growth model. Literature on the quantification or
measurement of the level or extent of productivity promoting technologies used in
the manufacturing sectors remains sparse. Graetz and Michaels (2016) showed for
the first time that industrial robot density could be such a suitable metric for
productivity improvements. Unfortunately, their study was limited to developed
countries, and a need for further research to validate the findings for developing
countries was stated.
The literature review revealed the increased rate of new industrial robot installations,
and as comment, and indeed reaction, from leaders in the global economy. While
seemingly conflicting views on the effect of this phenomenon on labour was
observed, this impact was not the core focus of this research. The literature review
and this research certainly focussed on the effect of industrial robots as proxy and
metric for wider industrial technology, and as a key promotor of productivity and
long-run economic growth.
© University of Pretoria
MBA 2015.16 Industrial robot population density and the neoclassical growth model Johan le Roux
Industrial robot population density and the neoclassical growth model 18
3. Research Propositions and Hypotheses
3.1. Introduction
Research propositions are represented through the following:
Annual variations in industrial robot density correlate positively with changes
in industrial sector worker productivity per country.
Annual variations in industrial robot density correlate positively with changes
in the industrial sector value added per country.
The above correlations should be positive and applicable to developed as well
as developing countries.
The statistical relationship between the variables were described using correlation
and simple linear regression analysis, and aims to answer the question whether
industrial robot density (independent variable) can be used as an economic
indicator or metric for industrial worker productivity and manufacturing sector value
added to GDP respectively.
3.2. Research Propositions
3.2.1. Proposition one: Robot Density and Productivity
Annual variances in industrial robot density (independent variable) correlates
positively with changes in industrial sector worker productivity (dependent variable)
per country (n from 1 to 38) over an extended period. The nature of the relationship
is to be tested through simple linear regression and co-variance against the
following hypotheses and criteria:
Null Hypothesis one:
H0: βn ≤ 0
The alternate Hypothesis one:
H1: βn > 0
© University of Pretoria

MBA 2015.16 Industrial robot population density and the neoclassical growth model Johan le Roux
Industrial robot population density and the neoclassical growth model 19
The null hypothesis test will be discussed and described according to the following
management proposition criteria:
1a) The correlation is statistically significant, p < 0.05;
1b) The regression coefficient or slope is positive, β > 0;
1c) The strength of the statistical relationship is moderate (0.3) to strong (0.5), r
> 0.3;
1d) The coefficient of determination is moderate (0.09) to strong (0.25),
r2 > 0.09.
3.2.2. Proposition two: Robot Density and Economic Contribution
Annual variances in industrial robot density (independent variable) correlates
positively with changes in industrial sector value added (independent variable) per
country (n from 1 to 38) over an extended period. The nature of the relationship is
to be tested through simple linear regression and co-variance against the following
hypotheses and criteria.
Null Hypothesis two:
H0: βn ≤ 0
The alternate Hypothesis two:
H1: βn > 0
The null hypothesis test will be discussed and described according to the following
management proposition criteria:
2a) The correlation is statistically significant, p < 0.05;
2b) The regression coefficient or slope is positive, β > 0;
2c) The strength of the statistical relationship is moderate (0.3) to strong (0.5), r
> 0.3;
2d) The coefficient of determination is moderate (0.09) to strong (0.25),
r2 > 0.09.
© University of Pretoria

MBA 2015.16 Industrial robot population density and the neoclassical growth model Johan le Roux
Industrial robot population density and the neoclassical growth model 20
3.2.3. Proposition three: Productivity and Stage of Country Development
The positive linear relationship between industrial robot density and worker
productivity holds across economies, regardless of the stage of development and
economy size. This will be interpreted through observation and analysis of the
results Hypothesis one and 2, and supported by deductions from the literature
review.
© University of Pretoria
MBA 2015.16 Industrial robot population density and the neoclassical growth model Johan le Roux
Industrial robot population density and the neoclassical growth model 21
4. Research Methodology
This chapter covers the units of analysis, research methodology, population,
sampling methods used, data collection, assumptions, data analysis and limitations
of the research.
4.1. Introduction
A quantitative, descriptive, correlational statistical study of industrial robot density
versus industrial worker productivity and total manufacturing value added per
country using secondary data was done.
The empirical nature of the research propositions allowed the study to test the
relevant neoclassical growth theory discussed in Chapter 2 against independent
secondary data. Secondary data sourced from the International Federation of
Robotics, International Labour Organisation and the World Bank were analysed
using co-variation and simple linear regression techniques.
These methods were chosen for their simplicity, following guidelines from Wegner
(2012), and are suitable for this research because the aim was not to construct a
detailed economic growth model, but to test and describe the relationship between
robot density and productivity and economic contribution respectively. This study
does not propose that industrial robot density is the only predictor variable for
productivity and manufacturing value added, but tests the statistical relationship and
significance associated with the outcomes.
The simple linear and correlation analysis will be performed for each of the 38
countries separately, using annual data spanning the ten years from 2005 to 2014
for each of the three variables: industrial robot density, productivity per worker and
manufacturing sector value added.
An additional analysis of the combined set of all the countries will also be done and
interpreted.
© University of Pretoria
MBA 2015.16 Industrial robot population density and the neoclassical growth model Johan le Roux
Industrial robot population density and the neoclassical growth model 22
4.2. Units of Analysis
4.2.1. Industrial Robot Density
The first unit of analysis to represent industrial robot prevalence will be the
independent variable robot density, defined as the number of industrial robots
installed per 10 000 industrial workers per country, reported annually by the
International Federation of Robotics.
4.2.2. Manufacturing Value Added
The dependent variable, manufacturing sector contribution to gross domestic
product per country is represented by The World Bank indicator: Manufacturing
value added (current US$), unique indicator code NV.IND.MANF.CD. The World
Bank (2016) defined the parameter as follows:
Manufacturing refers to industries belonging to ISIC divisions 15-37. Value
added is the net output of a sector after adding up all outputs and subtracting
intermediate inputs. It is calculated without making deductions for
depreciation of fabricated assets or depletion and degradation of natural
resources. The origin of value added is determined by the International
Standard Industrial Classification (ISIC), revision 3. Data are in current U.S.
dollars. (Metadata-Indicators section, para. 1).
4.2.3. Manufacturing Worker Productivity
Productivity will be expressed in a simplified form, namely the single-factor
productivity measurement of total manufacturing value added figure per country
reported by the World Bank divided by the total employees in industry per country
reported by the International Labour Organisation.
© University of Pretoria
MBA 2015.16 Industrial robot population density and the neoclassical growth model Johan le Roux
Industrial robot population density and the neoclassical growth model 23
4.3. Population
“The population of any research study is the complete set of group members that
meet the requirements of the study” (Saunders & Lewis, 2012, p. 12). Thus a
complete sample would be all countries that have industrial robots installed. For the
purpose of this study, all the required data for the entire population was not readily
available for all the countries in the world.
4.4. Sampling Method
The researcher considered all 44 countries for which industrial robot density data
were available between 2005 and 2014.
The original sample which consisted of 44 were reduced by three , as only countries
for which sufficient robot density, total industry workers, and manufacturing value
added data for the period were available. The three countries, namely Israel,
Canada and Taiwan were excluded due to unavailability of manufacturing value
added or sector employment data. Furthermore, Iran, India and the Russian
Federation were excluded due to the fact that these countries had a robot density
of two or less.
Consequently, the method can be classified as availability sampling, as it excluded
countries for which sufficient data was not readily available
The final sample of 38 countries spans developed countries with high robot
densities such as Germany, Japan and Finland, to developing countries such as
South Africa, Brazil and Malaysia.
The complete list of the 38 countries sampled was as follows:
Argentina, Brazil, Mexico, USA, China, Indonesia, Japan, Malaysia, Philippines, the
Republic of Korea, Thailand, Australia, New Zealand, Austria, Belgium,
Netherlands, Croatia, Czech Republic, Denmark, Estonia, Finland, France,
Germany, Greece, Hungary, Italy, Norway, Poland, Portugal, Romania, Slovakia,
Slovenia, Spain, Sweden, Switzerland, Turkey, United Kingdom and South Africa.
Due to the phenomenon of diminishing returns observed by Graetz and Michaels
(2015) on investment in technology such as robotics, the hypotheses results will
also be evaluated in terms of their stage of development.
© University of Pretoria

MBA 2015.16 Industrial robot population density and the neoclassical growth model Johan le Roux
Industrial robot population density and the neoclassical growth model 24
4.5. Data Collection
Worldwide industrial robot density per country was obtained from the publication
World Robotics Industrial Robots 2015, compiled by the International Federation of
Robotics’ (IFR) Statistical Department. The reliability and accuracy of the data is
the best available on the subject, and according to the International Federation of
Robotics (2015):
The robot statistics are based on consolidated world data reported by robot
suppliers as well as on the statistics of the national robot associations of
North America (RIA), Japan (JARA), Denmark, (DIRA), Germany (VDMA,
R+A), Italy (SIRI), Republic of Korea (KOMMA), Spain(AER), United
Kingdom (BARA) and Peoples Republic of China (CRIA)” (p. 1).
The data and report is not open source, and can be purchased at EUR 1200 from
the organisation. The price of the publication might well be a contributing factor to
the limited quantitative research available on the subject utilising the data.
Manufacturing contribution to gross domestic product per country data for the
relevant years was sourced from the World Bank (2016).
The total employees in the industrial sector per country per year data was sourced
from the International Labour Organisation.
Manufacturing sector employee productivity was represented by dividing the
Manufacturing sector contribution by the total number of industry workers per
country.
The reliability and validity of the data is based on the source of the data and verified
by comparing data used in the statistic evaluation with original raw data.
4.6. Assumptions
Correlation and linear regressions require that the sets of variables are normally
distributed, or close to normal, linear or close to linear and that the variables are
homoscedastic.
The suitability of the data for the descriptive statistical methods, co-variance and
linear regression, will be verified for normality as per the Ryan–Joiner test.
According to de Souza and Junqueira (2005, p. 31), the Ryan-Joiner test is suitable
to prove the normal distribution of data regression residuals to verify data for
© University of Pretoria

MBA 2015.16 Industrial robot population density and the neoclassical growth model Johan le Roux
Industrial robot population density and the neoclassical growth model 25
normality and uses two fundamental concepts, the normal probability plot and the
correlation coefficient.
All 38 countries sets of data was tested for normal distribution, and results
discussed in Chapter 5.
The relationship between the two variables will be visually inspected for
linearity.
The relationship between the two variables is assumed to be homoscedastic.
4.7. Data description
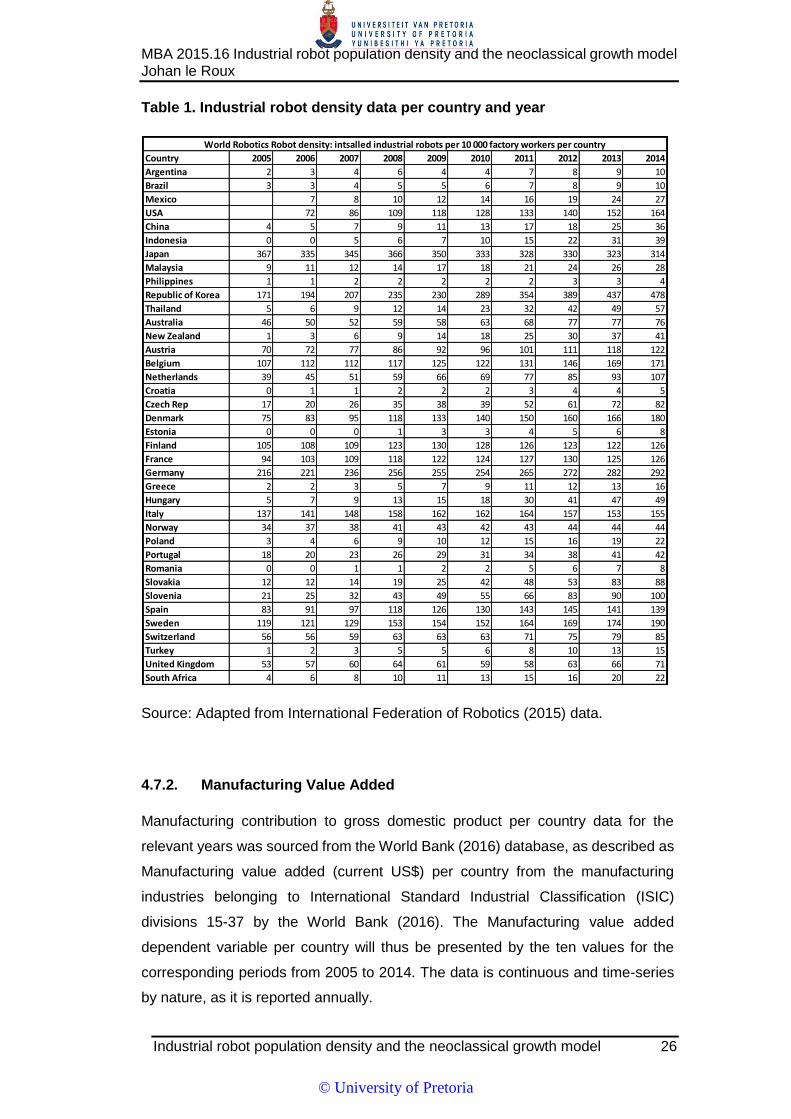
4.7.1. Industrial Robot Density
These secondary datasets were sourced from the annual publication “World
Robotics Industrial Robots 2015” by the International Federation of Robotics’
Statistical Department. The specific independent variable used for this research is
industrial robot density, represented as the annual number of installed industrial
robots per 10 000 industrial workers per country. The industrial robot density
independent variable per country will thus be presented by the ten values for the
corresponding periods from 2005 to 2014. The data is continuous and time-series
by nature, as it is reported annually.
The sample of countries and industrial robot density data is as per Table 1:
© University of Pretoria
MBA 2015.16 Industrial robot population density and the neoclassical growth model Johan le Roux
Industrial robot population density and the neoclassical growth model 26
Table 1. Industrial robot density data per country and year
Source: Adapted from International Federation of Robotics (2015) data.
4.7.2. Manufacturing Value Added
Manufacturing contribution to gross domestic product per country data for the
relevant years was sourced from the World Bank (2016) database, as described as
Manufacturing value added (current US$) per country from the manufacturing
industries belonging to International Standard Industrial Classification (ISIC)
divisions 15-37 by the World Bank (2016). The Manufacturing value added
dependent variable per country will thus be presented by the ten values for the
corresponding periods from 2005 to 2014. The data is continuous and time-series
by nature, as it is reported annually.
Country 2005 2006 2007 2008 2009 2010 2011 2012 2013 2014
Argentina 2 3 4 6 4 4 7 8 9 10
Brazil 3 3 4 5 5 6 7 8 9 10
Mexico 7 8 10 12 14 16 19 24 27
USA 72 86 109 118 128 133 140 152 164
China 4 5 7 9 11 13 17 18 25 36
Indonesia 0 0 5 6 7 10 15 22 31 39
Japan 367 335 345 366 350 333 328 330 323 314
Malaysia 9 11 12 14 17 18 21 24 26 28
Philippines 1 1 2 2 2 2 2 3 3 4
Republic of Korea 171 194 207 235 230 289 354 389 437 478
Thailand 5 6 9 12 14 23 32 42 49 57
Australia 46 50 52 59 58 63 68 77 77 76
New Zealand 1 3 6 9 14 18 25 30 37 41
Austria 70 72 77 86 92 96 101 111 118 122
Belgium 107 112 112 117 125 122 131 146 169 171
Netherlands 39 45 51 59 66 69 77 85 93 107
Croatia 0 1 1 2 2 2 3 4 4 5
Czech Rep 17 20 26 35 38 39 52 61 72 82
Denmark 75 83 95 118 133 140 150 160 166 180
Estonia 0 0 0 1 3 3 4 5 6 8
Finland 105 108 109 123 130 128 126 123 122 126
France 94 103 109 118 122 124 127 130 125 126
Germany 216 221 236 256 255 254 265 272 282 292
Greece 2 2 3 5 7 9 11 12 13 16
Hungary 5 7 9 13 15 18 30 41 47 49
Italy 137 141 148 158 162 162 164 157 153 155
Norway 34 37 38 41 43 42 43 44 44 44
Poland 3 4 6 9 10 12 15 16 19 22
Portugal 18 20 23 26 29 31 34 38 41 42
Romania 0 0 1 1 2 2 5 6 7 8
Slovakia 12 12 14 19 25 42 48 53 83 88
Slovenia 21 25 32 43 49 55 66 83 90 100
Spain 83 91 97 118 126 130 143 145 141 139
Sweden 119 121 129 153 154 152 164 169 174 190
Switzerland 56 56 59 63 63 63 71 75 79 85
Turkey 1 2 3 5 5 6 8 10 13 15
United Kingdom 53 57 60 64 61 59 58 63 66 71
South Africa 4 6 8 10 11 13 15 16 20 22
World Robotics Robot density: intsalled industrial robots per 10 000 factory workers per country
© University of Pretoria

MBA 2015.16 Industrial robot population density and the neoclassical growth model Johan le Roux
Industrial robot population density and the neoclassical growth model 27
An example of the data is as per Table 2. Due to the volume of data and the
impracticality of presenting all the raw data here, only data for ten countries for the
period of 2005 to 2010 is displayed here. The study was conducted using 38
countries and data spanning 2005 to 2014.
Table 2. Manufacturing value added data example
Source: Adapted from World Bank (2016) data.
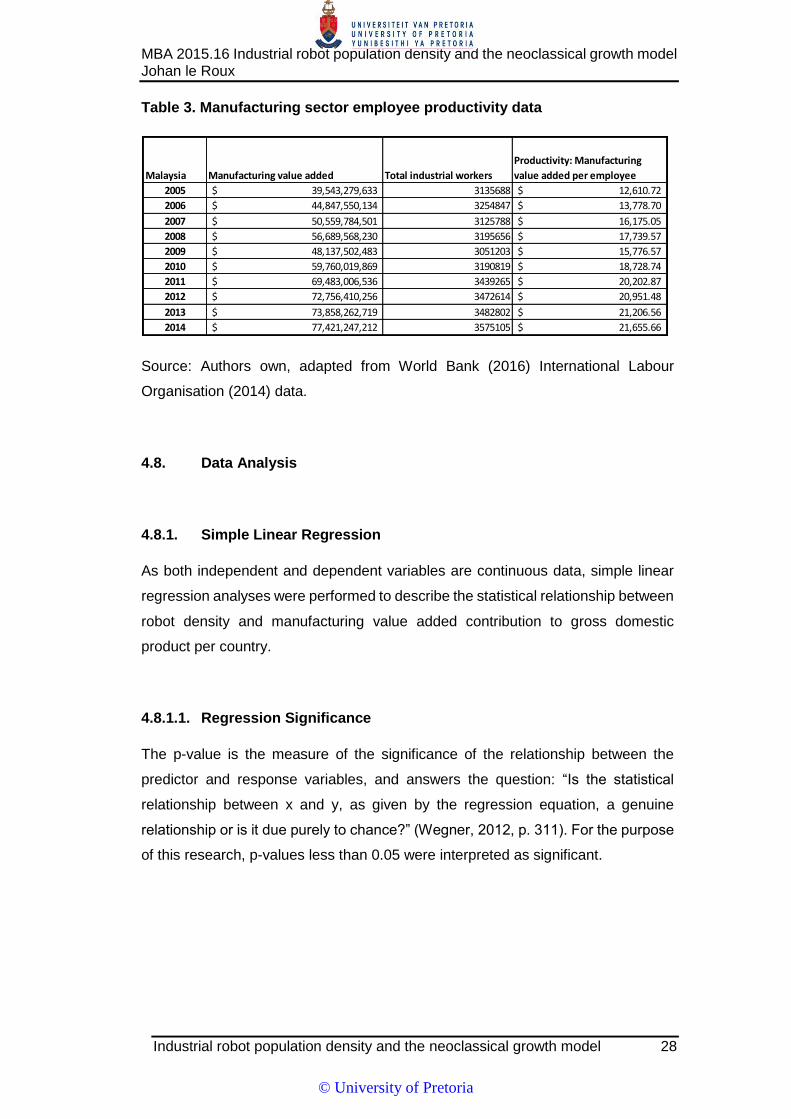
4.7.3. Manufacturing Sector Employee Productivity
This variable was represented by the manufacturing value added data (as above,
4.7.2) divided by the total number of industrial sector workers data, sourced from
the International Labour Organisation (2014) database. The manufacturing sector
employee productivity dependent variable per country will thus be presented by the
ten manufacturing value added per employee values for the corresponding periods
from 2005 to 2014. The data is continuous and time series by nature, as it is
reported annually.
An example of the manufacturing sector employee productivity data is as per Table
3. Again, due to the volume of data and the impracticality of presenting all the data,
only data for one country for the period of 2005 to 2014 was displayed here. The
study was conducted using 38 countries.
Country Name 2005 2006 2007 2008 2009 2010
Australia 71,777,928,131 74,072,327,044 79,507,733,375 97,362,578,335 78,490,649,389 91,722,892,627
Austria 55,042,022,137 59,844,762,263 70,522,803,175 74,778,877,984 65,343,803,834 64,878,264,901
Belgium 61,098,122,124 62,248,149,542 71,227,758,007 73,678,043,064 62,032,509,030 63,667,549,669
Switzerland 76,790,328,863 82,313,719,971 92,340,643,036 108,345,112,547 99,261,827,589 107,432,957,331
Estonia 2,063,959,707 2,456,793,376 3,108,431,426 3,337,219,862 2,410,238,955 2,675,218,543
Indonesia 78,349,463,192 100,393,875,817 116,907,767,203 141,916,385,387 142,208,892,017 166,412,396,916
Korea, Rep. 229,169,976,429 253,764,988,236 285,849,032,340 258,554,832,567 234,967,147,768 304,283,770,493
Malaysia 39,543,279,633 44,847,550,134 50,559,784,501 56,689,568,230 48,137,502,483 59,760,019,869
Netherlands 85,163,536,874 88,142,014,804 102,471,940,871 108,245,202,871 90,309,808,280 88,773,509,934
South Africa 41,909,486,893 39,838,874,636 43,005,482,315 41,361,666,586 40,319,789,572 48,994,610,501
© University of Pretoria
MBA 2015.16 Industrial robot population density and the neoclassical growth model Johan le Roux
Industrial robot population density and the neoclassical growth model 28
Table 3. Manufacturing sector employee productivity data
Source: Authors own, adapted from World Bank (2016) International Labour
Organisation (2014) data.
4.8. Data Analysis
4.8.1. Simple Linear Regression
As both independent and dependent variables are continuous data, simple linear
regression analyses were performed to describe the statistical relationship between
robot density and manufacturing value added contribution to gross domestic
product per country.
4.8.1.1. Regression Significance
The p-value is the measure of the significance of the relationship between the
predictor and response variables, and answers the question: “Is the statistical
relationship between x and y, as given by the regression equation, a genuine
relationship or is it due purely to chance?” (Wegner, 2012, p. 311). For the purpose
of this research, p-values less than 0.05 were interpreted as significant.
Malaysia Manufacturing value added Total industrial workers
Productivity: Manufacturing
value added per employee
2005 39,543,279,633$ 3135688 12,610.72$
2006 44,847,550,134$ 3254847 13,778.70$
2007 50,559,784,501$ 3125788 16,175.05$
2008 56,689,568,230$ 3195656 17,739.57$
2009 48,137,502,483$ 3051203 15,776.57$
2010 59,760,019,869$ 3190819 18,728.74$
2011 69,483,006,536$ 3439265 20,202.87$
2012 72,756,410,256$ 3472614 20,951.48$
2013 73,858,262,719$ 3482802 21,206.56$
2014 77,421,247,212$ 3575105 21,655.66$
© University of Pretoria

MBA 2015.16 Industrial robot population density and the neoclassical growth model Johan le Roux
Industrial robot population density and the neoclassical growth model 29
4.8.1.2. Regression Slope
Of specific interest will be the slope (β), or gradient of the regression line. The slope
is the least squares estimate of the slope associated with the predictor variable
(Baird & Bieber, 2016), and is the answer to the research question, how is industrial
robot density predictive of productivity and manufacturing value added respectively.
For the research propositions to agree with the neoclassical growth model theory
discussed in Chapter 2, positive slopes should be observed.
4.8.2. Correlation Analysis
Correlation analyses were performed to determine the strength of the statistical
relationships between robot densities and manufacturing value added contribution
to gross domestic product per country respectively, as both independent and
dependent variables are continuous data.
4.8.2.1. Pearson’s Correlation Coefficient
Of specific interest will be the Pearson’s correlation or R. Pearson’s correlation
coefficient is a measure of the strength of the linear association between two
variables, and can range from -1 ≤ r≤ +1, or from perfectly negative correlation (-1),
no correlation (0) or perfectly positive correlation (+1). For the purpose of this study,
correlation coefficient values greater than 0.3 were regarded as moderate,
correlation coefficient values greater than 0.5 large or strong linear associations
(Cohen, 1998).
The selection of the Pearson’s correlation method was consistent with the study
done by Mihai and Jivan (2012) as observed in the literature review (2.8.).
© University of Pretoria

MBA 2015.16 Industrial robot population density and the neoclassical growth model Johan le Roux
Industrial robot population density and the neoclassical growth model 30
4.8.2.2. Coefficient of Determination
The coefficient of determination or r squared was used to quantify the proportion of
the variance of the response variable accounted for by the variance in the predictor
variable. The selection of this method was based on the literature review (2.8.) as
proposed by Baird and Bieber (2016).
R squared values range from 0 ≤ r2 ≤ 1, or 0% ≤ r2 ≤ 100%. For the purpose of this
research Cohen’s (1998) guidelines were applied and r2 values greater than 0.09 or
9 per cent were regarded as moderate and r2 values greater than 0.25 or 25 per
cent were regarded as large or strong.
4.9. Limitations
While there is great potential to use the accurately monitored and reported figures
for industrial robot density as a metric or indicator for national and global
manufacturing output, the researcher has to highlight some limitations:
The extent to which the change in robot density correlates or influences
manufacturing activity growth depends on the installed base and rate of
change thereof per country. As an illustration, the installation of the first robot
in Iran would be irrelevant, but installing 1 000 robots per annum would be
significant. The implication was that those countries with a negligibly low
density of robots were not likely to show meaningful correlations as evaluated
according to the hypotheses. Countries with very low industrial robots
densities of two or less were Iran, the Russian Federation and India, and were
excluded from the sample.
There are vast numbers of factors that influence manufacturing contribution
to each country’s gross domestic product and total factor productivity, of which
operational efficiency discussed in the literature review is but one. The author
does not claim that robot density is the only independent variable and that
there is a clear, significant causality between industrial robot density and
productivity and sector value added. The intention is to determine whether a
strong correlation can be shown, and that industrial robot density is a valid
metric indicator of productivity and value added.
© University of Pretoria

MBA 2015.16 Industrial robot population density and the neoclassical growth model Johan le Roux
Industrial robot population density and the neoclassical growth model 31
It is unlikely that each and every industrial robot installation succeeds in
improving productivity to the extent that increased manufacturing output is
realized. It can however be reasonably argued that at a typical installation cost
of $75 000 per robot system (Frey & Osborne, 2013), proper project planning
and viability studies ensure a high project success rate.
Despite the identified limitations, this research aimed to support the findings of the
recent exploratory work done by Graetz and Michaels (2015) on the subject, and
may contribute in that it includes evaluation of the critically important developing
economies, while doing this with more recent data.
© University of Pretoria

MBA 2015.16 Industrial robot population density and the neoclassical growth model Johan le Roux
Industrial robot population density and the neoclassical growth model 32
5. Results
5.1. Introduction
This chapter will commence with a description of the sample obtained, followed by
data quality evaluation and data transformations. Results for the three propositions
will follow sequentially. Proposition one and two will each be divided into sections
where the null hypotheses could be rejected or not for the respective countries.
5.2. Description of Sample Obtained
Each of the 38 countries sampled contained datasets consisting of industrial robot
density, manufacturing value added and manufacturing value added per employee
(productivity). These datasets are in the form of continuous data, containing annual
values for the period 2005 to 2014.
While it might be interesting, a description of each countries’ datasets falls outside
the scope of this research. Results of the statistical analyses performed on all 38
countries (Tables 5-8) and graphical presentation of some results follows in this
chapter.
5.3. Data Quality Check for Normality
Normality was checked using the Ryan–Joiner test. For data to be deemed normal
or near normal, r-calculated should be greater than r-critical. Of the 38 countries’
data sets, two were found to have failed the normality test. These were Japan and
the Republic of Korea. The r-critical and r-calculated values are displayed in Table
4. The Ryan–Joiner test requirement for normality is that r-calculated is greater than
r-critical. The test for normality was not true for Japan and the Republic of Korea,
as r-calculated were less than r-critical in both cases as can be seen from the test
results in Table 4. This was substantiated by the observation of the normal
probability plots are shown in Figure 4 and 5. The normal probability plots for Japan
and the Republic of Korea were not close to linear, as opposed to the linear
properties observed in Figure 6, the normal probability plot for Estonia
manufacturing value added per employee added for illustration purposes.
© University of Pretoria

MBA 2015.16 Industrial robot population density and the neoclassical growth model Johan le Roux
Industrial robot population density and the neoclassical growth model 33
Table 4. Ryan-Joiner normality test, selected countries.
RYAN-JOINER TEST (FROM THE PLOT)
Japan r 0.91
r CRIT 0.92
Nearly Normal?
FALSE
South Korea r 0.91
r CRIT 0.92
Nearly Normal?
FALSE
Estonia r 0.99
r CRIT 0.92
Nearly Normal?
TRUE
Source: Authors own.
Figure 4. Japan, not normal data for total manufacturing value added
Source: Authors own.
© University of Pretoria
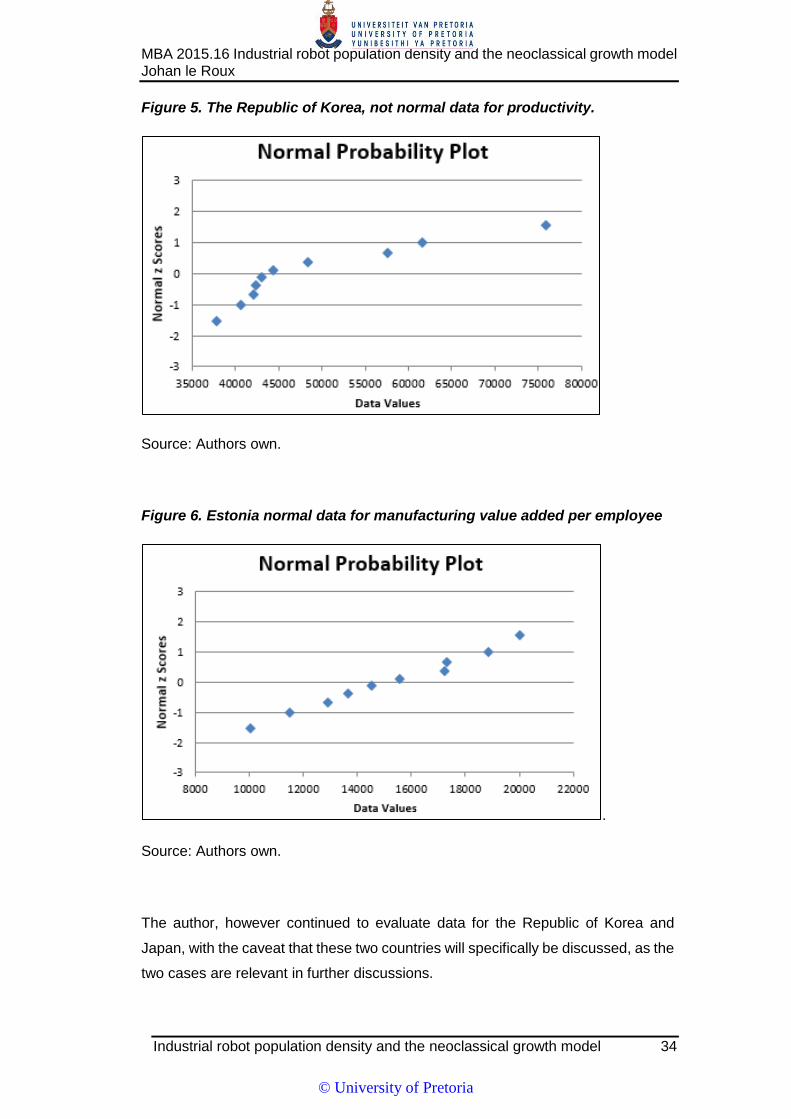
MBA 2015.16 Industrial robot population density and the neoclassical growth model Johan le Roux
Industrial robot population density and the neoclassical growth model 34
Figure 5. The Republic of Korea, not normal data for productivity.
Source: Authors own.
Figure 6. Estonia normal data for manufacturing value added per employee
.
Source: Authors own.
The author, however continued to evaluate data for the Republic of Korea and
Japan, with the caveat that these two countries will specifically be discussed, as the
two cases are relevant in further discussions.
© University of Pretoria
MBA 2015.16 Industrial robot population density and the neoclassical growth model Johan le Roux
Industrial robot population density and the neoclassical growth model 35
5.4. Data Transformations
No raw sourced data were altered in this research. The only transformations
executed were the following:
The total number of industrial sector workers data sourced from the
International Labour Organisation (2014) database were originally
represented under the label “Total employment in industry (thousands)”. For
statistical evaluation each data value per year and country were multiplied by
1000 to represent the intended true value.
The manufacturing sector productivity per employee values were calculated
from raw sourced data by dividing the manufacturing value added data (4.7.2)
by the total number of industrial sector workers data (4.7.3.). This was done
for all relevant corresponding country and year data.
5.5. Proposition one: Robot Density and Productivity
As the sample consisted of 38 countries, this section is divided into sub-sections
where the Null Hypothesis one could be rejected in favour of the management
Proposition one (31 countries), and another where the null hypothesis could not be
rejected at the 95 per interval (7 countries).
5.5.1. Null Hypothesis one Rejected: Robot Density and Productivity
H0: βn ≤ 0
Proposition one tested the statistical relationship between annual robot density
(independent variable) and industrial worker productivity (dependent variable) data
per country over the period from 2005 to 2014.
A total of 38 countries were tested, and the results for 31 countries that met all the
requirements to reject the null hypothesis of Proposition one, is presented in Table
5.
The 31 countries, all tested through correlation and linear regression, displayed a
positive productivity to industrial robot density slope (β), a strong Pearson’s
correlation and a strong coefficient of determination. The respective criteria for the
parameters followed the guidelines suggested by Cohen (1998). The results are
© University of Pretoria

MBA 2015.16 Industrial robot population density and the neoclassical growth model Johan le Roux
Industrial robot population density and the neoclassical growth model 36
statistically significant at the 95 per cent confidence interval, with p values less than
0.05.
The 31 countries for which Null Hypothesis one could be rejected in favour of the
proposed alternate hypothesis were:
Argentina, Brazil, Mexico, USA, China, Indonesia, Malaysia, Philippines, Thailand,
Australia, New Zealand, Belgium, Netherlands, Croatia, Czech Rep, Denmark,
Estonia, France, Germany, Greece, Hungary, Norway, Poland, Portugal, Romania,
Slovakia, Slovenia, Spain, Sweden, Switzerland and the United Kingdom.
Details of the industrial robot density to productivity relationship are summarised
according to measure of significance (p), slope (β), Pearson’s correlation (r) and
coefficient of determination (r2) in Table 5.
Correlation and regression results in Table 5 are for the respective countries
statistical evaluation results where the null hypothesis of Proposition one could be
rejected in favour of the management proposition. All p values were less than 0.05
and the slope, or β greater than zero.
© University of Pretoria
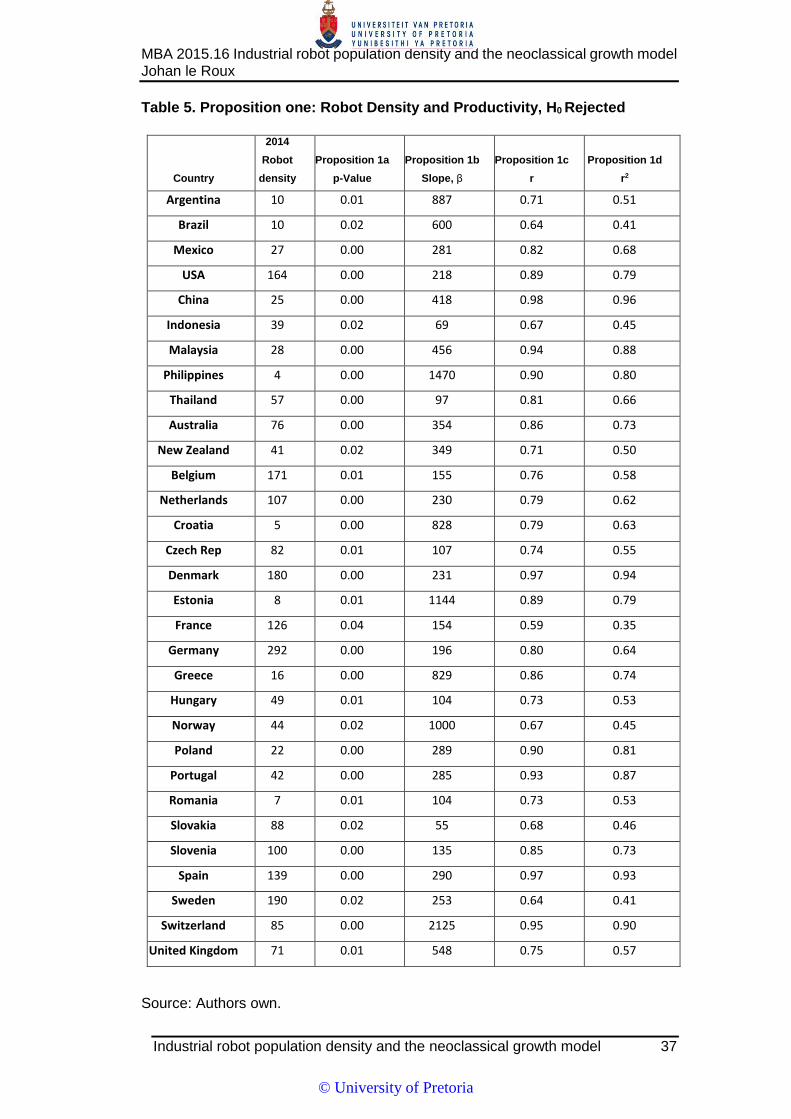
MBA 2015.16 Industrial robot population density and the neoclassical growth model Johan le Roux
Industrial robot population density and the neoclassical growth model 37
Table 5. Proposition one: Robot Density and Productivity, H0 Rejected
Country
2014
Robot
density
Proposition 1a
p-Value
Proposition 1b
Slope, β
Proposition 1c
r
Proposition 1d
r2
Argentina 10 0.01 887 0.71 0.51
Brazil 10 0.02 600 0.64 0.41
Mexico 27 0.00 281 0.82 0.68
USA 164 0.00 218 0.89 0.79
China 25 0.00 418 0.98 0.96
Indonesia 39 0.02 69 0.67 0.45
Malaysia 28 0.00 456 0.94 0.88
Philippines 4 0.00 1470 0.90 0.80
Thailand 57 0.00 97 0.81 0.66
Australia 76 0.00 354 0.86 0.73
New Zealand 41 0.02 349 0.71 0.50
Belgium 171 0.01 155 0.76 0.58
Netherlands 107 0.00 230 0.79 0.62
Croatia 5 0.00 828 0.79 0.63
Czech Rep 82 0.01 107 0.74 0.55
Denmark 180 0.00 231 0.97 0.94
Estonia 8 0.01 1144 0.89 0.79
France 126 0.04 154 0.59 0.35
Germany 292 0.00 196 0.80 0.64
Greece 16 0.00 829 0.86 0.74
Hungary 49 0.01 104 0.73 0.53
Norway 44 0.02 1000 0.67 0.45
Poland 22 0.00 289 0.90 0.81
Portugal 42 0.00 285 0.93 0.87
Romania 7 0.01 104 0.73 0.53
Slovakia 88 0.02 55 0.68 0.46
Slovenia 100 0.00 135 0.85 0.73
Spain 139 0.00 290 0.97 0.93
Sweden 190 0.02 253 0.64 0.41
Switzerland 85 0.00 2125 0.95 0.90
United Kingdom 71 0.01 548 0.75 0.57
Source: Authors own.
© University of Pretoria

MBA 2015.16 Industrial robot population density and the neoclassical growth model Johan le Roux
Industrial robot population density and the neoclassical growth model 38
5.5.2. Failed to Reject Null Hypothesis one: Robot Density and Productivity
Null Hypothesis one could not be rejected for 7 of the 38 countries evaluated. This
means that the management proposition for these countries cannot be accepted at
a confidence interval of 95 per cent.
The seven countries for which the management proposition could not be accepted
were: Japan, the Republic of Korea, Austria, Finland, Italy, Turkey and South Africa.
Results of the statistical evaluation performed are summarised in Table 6 below.
Table 6. Proposition one: Robot Density and Productivity, Failed to Reject H0
Country
2014
Robot
density
Proposition 1a
p-Value
Proposition 1b
Slope, β
Proposition 1c
r
Proposition 1d
r2
Japan 314 0.74 -97 0.23 0.05
Korea, Rep. 478 0.60 -10 0.09 0.01
Austria 122 0.06 151 0.53 0.28
Finland 126 0.71 -183 0.20 0.04
Italy 155 0.08 181 0.48 0.23
Turkey 15 0.06 144 0.52 0.27
South Africa 22 0.22 55 0.28 0.08
Source: Authors own.
Correlation and regression results highlighted in red are where the respective
countries statistical evaluation results could not reject the null hypothesis of
Proposition one in favour of the management proposition. All p values were greater
than 0.05, and three of the countries’’ regression slopes were less than zero.
5.6. Proposition two: Robot Density and Economic Contribution
This section is divided into sub-sections where the Null Hypothesis two could be
rejected in favour of Management Proposition two (19countries), and another where
the null hypothesis could not be rejected at the 95 per cent confidence interval (20
countries).
© University of Pretoria
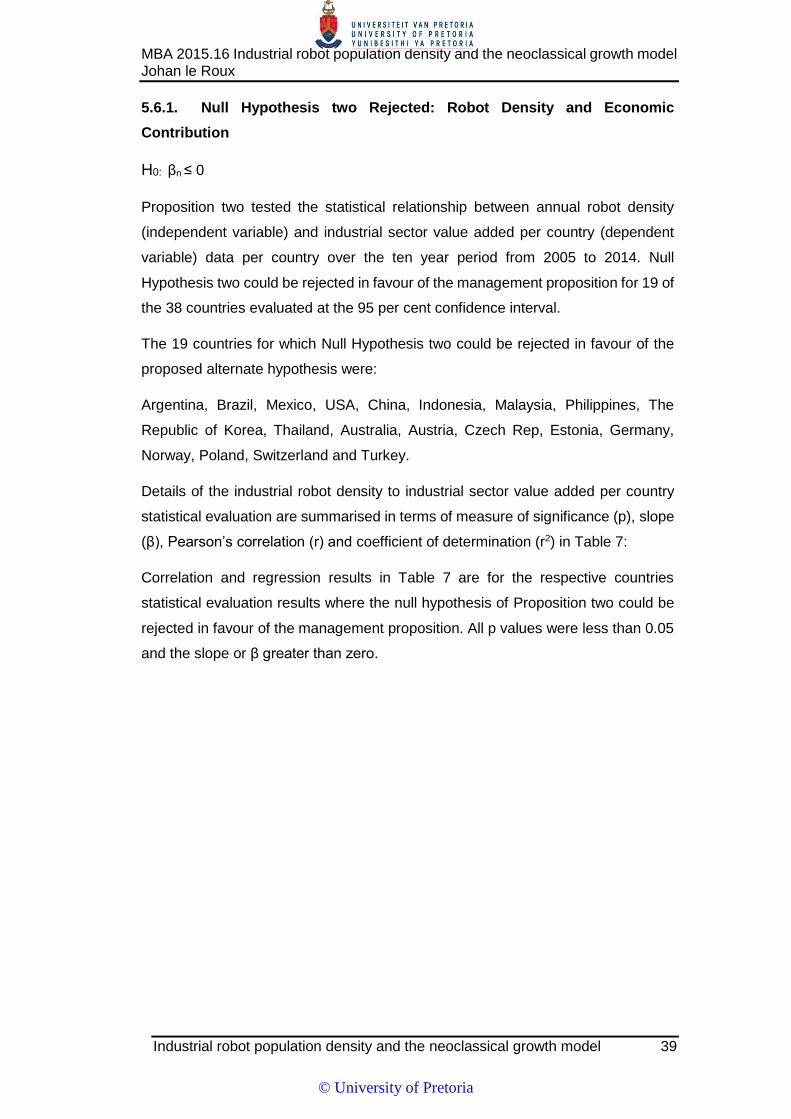
MBA 2015.16 Industrial robot population density and the neoclassical growth model Johan le Roux
Industrial robot population density and the neoclassical growth model 39
5.6.1. Null Hypothesis two Rejected: Robot Density and Economic
Contribution
H0: βn ≤ 0
Proposition two tested the statistical relationship between annual robot density
(independent variable) and industrial sector value added per country (dependent
variable) data per country over the ten year period from 2005 to 2014. Null
Hypothesis two could be rejected in favour of the management proposition for 19 of
the 38 countries evaluated at the 95 per cent confidence interval.
The 19 countries for which Null Hypothesis two could be rejected in favour of the
proposed alternate hypothesis were:
Argentina, Brazil, Mexico, USA, China, Indonesia, Malaysia, Philippines, The
Republic of Korea, Thailand, Australia, Austria, Czech Rep, Estonia, Germany,
Norway, Poland, Switzerland and Turkey.
Details of the industrial robot density to industrial sector value added per country
statistical evaluation are summarised in terms of measure of significance (p), slope
(β), Pearson’s correlation (r) and coefficient of determination (r2) in Table 7:
Correlation and regression results in Table 7 are for the respective countries
statistical evaluation results where the null hypothesis of Proposition two could be
rejected in favour of the management proposition. All p values were less than 0.05
and the slope or β greater than zero.
© University of Pretoria
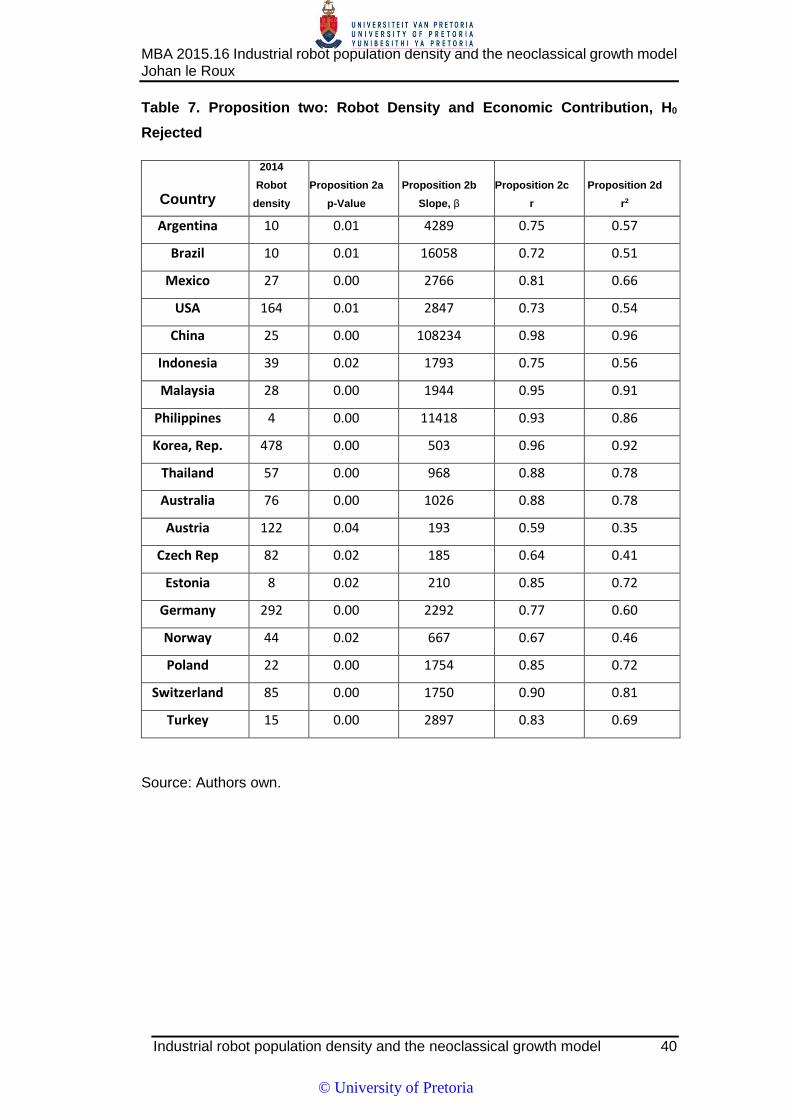
MBA 2015.16 Industrial robot population density and the neoclassical growth model Johan le Roux
Industrial robot population density and the neoclassical growth model 40
Table 7. Proposition two: Robot Density and Economic Contribution, H0
Rejected
Country
2014
Robot
density
Proposition 2a
p-Value
Proposition 2b
Slope, β
Proposition 2c
r
Proposition 2d
r2
Argentina 10 0.01 4289 0.75 0.57
Brazil 10 0.01 16058 0.72 0.51
Mexico 27 0.00 2766 0.81 0.66
USA 164 0.01 2847 0.73 0.54
China 25 0.00 108234 0.98 0.96
Indonesia 39 0.02 1793 0.75 0.56
Malaysia 28 0.00 1944 0.95 0.91
Philippines 4 0.00 11418 0.93 0.86
Korea, Rep. 478 0.00 503 0.96 0.92
Thailand 57 0.00 968 0.88 0.78
Australia 76 0.00 1026 0.88 0.78
Austria 122 0.04 193 0.59 0.35
Czech Rep 82 0.02 185 0.64 0.41
Estonia 8 0.02 210 0.85 0.72
Germany 292 0.00 2292 0.77 0.60
Norway 44 0.02 667 0.67 0.46
Poland 22 0.00 1754 0.85 0.72
Switzerland 85 0.00 1750 0.90 0.81
Turkey 15 0.00 2897 0.83 0.69
Source: Authors own.
© University of Pretoria

MBA 2015.16 Industrial robot population density and the neoclassical growth model Johan le Roux
Industrial robot population density and the neoclassical growth model 41
5.6.2. Failed to Reject Null Hypothesis two: Robot Density and Economic
Contribution
Null Hypothesis two could not be rejected for 19 of the 38 countries evaluated. This
means that the management proposition for these countries cannot be accepted
with a confidence interval at 95 per cent.
The 19 countries for which the null hypothesis could not be rejected in favour of the
management proposition were:
Japan, New Zealand, Belgium, Netherlands, Croatia, Denmark, Finland, France,
Greece, Hungary, Italy, Portugal, Romania, Slovakia, Slovenia, Spain, Sweden,
United Kingdom and South Africa.
Details of the industrial robot density to industrial sector value added per country
statistical evaluation are summarised in terms of measure of significance (p), slope
(β), Pearson’s correlation (r) and coefficient of determination (r2) as per Table 8.
Correlation and regression results highlighted in red in Table 8 are where the
respective countries statistical evaluation results could not reject the null hypothesis
of Proposition two in favour of Management Proposition two. All p values were
greater than 0.05, and six of the countries’ regression slopes were less than zero.
© University of Pretoria
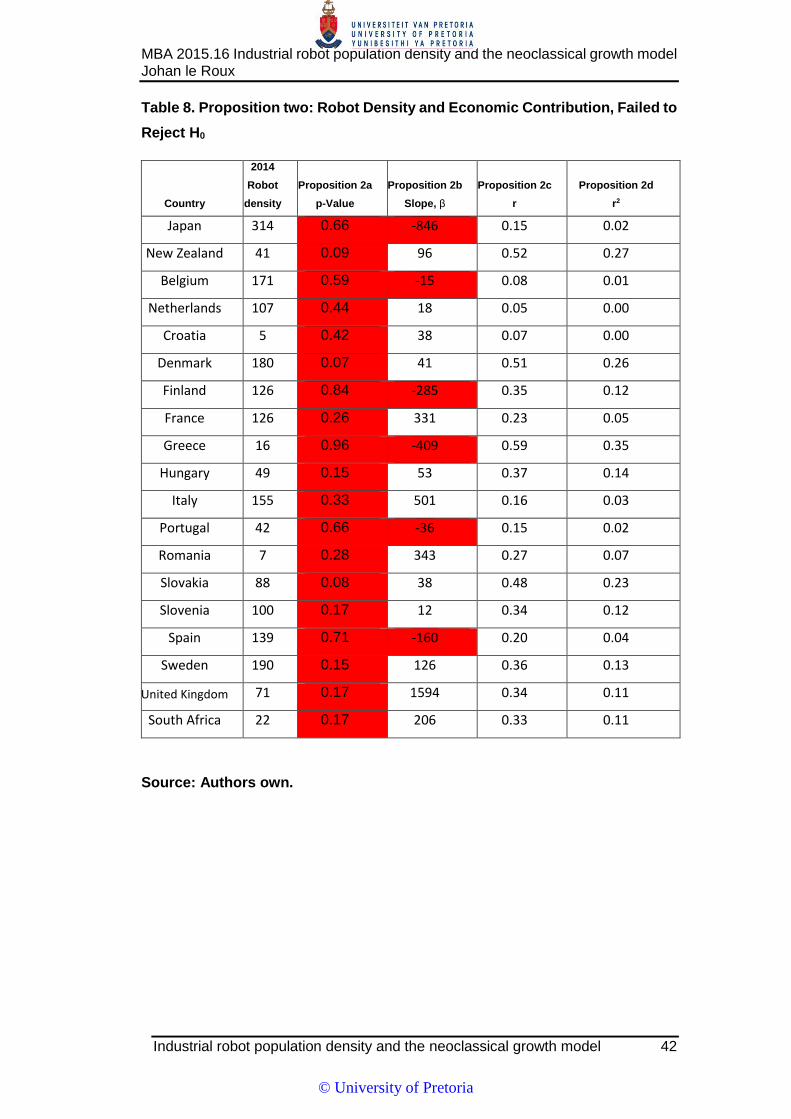
MBA 2015.16 Industrial robot population density and the neoclassical growth model Johan le Roux
Industrial robot population density and the neoclassical growth model 42
Table 8. Proposition two: Robot Density and Economic Contribution, Failed to
Reject H0
Country
2014
Robot
density
Proposition 2a
p-Value
Proposition 2b
Slope, β
Proposition 2c
r
Proposition 2d
r2
Japan 314 0.66 -846 0.15 0.02
New Zealand 41 0.09 96 0.52 0.27
Belgium 171 0.59 -15 0.08 0.01
Netherlands 107 0.44 18 0.05 0.00
Croatia 5 0.42 38 0.07 0.00
Denmark 180 0.07 41 0.51 0.26
Finland 126 0.84 -285 0.35 0.12
France 126 0.26 331 0.23 0.05
Greece 16 0.96 -409 0.59 0.35
Hungary 49 0.15 53 0.37 0.14
Italy 155 0.33 501 0.16 0.03
Portugal 42 0.66 -36 0.15 0.02
Romania 7 0.28 343 0.27 0.07
Slovakia 88 0.08 38 0.48 0.23
Slovenia 100 0.17 12 0.34 0.12
Spain 139 0.71 -160 0.20 0.04
Sweden 190 0.15 126 0.36 0.13
United Kingdom 71 0.17 1594 0.34 0.11
South Africa 22 0.17 206 0.33 0.11
Source: Authors own.
© University of Pretoria

MBA 2015.16 Industrial robot population density and the neoclassical growth model Johan le Roux
Industrial robot population density and the neoclassical growth model 43
5.7. Proposition three: Stages of Economic Development
This proposition suggests that cursory observation of the combination of all 38
countries’ data into one X-Y scatter plot indicates that the relationship between
industrial robot density and worker productivity holds across economies, regardless
of stage of development and economy size.
Applying the stages of development classification of the United Nations (2014), the
27 countries deemed as developed are:
The United States of America, Japan, Australia, New Zealand, Austria, Belgium,
Netherlands, Croatia, Czech Republic, Denmark, Estonia, Finland, France,
Germany, Greece, Hungary, Italy, Norway, Poland, Portugal, Romania, Slovakia,
Slovenia, Spain, Sweden, Switzerland and The United Kingdom.
The 11 developing countries are:
Argentina, Brazil, Mexico, China, Indonesia, Malaysia, Philippines, the Republic of
Korea, Thailand, Turkey South Africa.
From Table 5 it can be seen that 23 of the 27 developed countries (85 per cent),
and 8 of the 11 developing countries (73 per cent) met the requirements to reject
the null hypothesis of Proposition one. The proportion of developed and developing
countries are of the same order, and satisfies the requirements of the management
proposition, in that industrial robot density is positively correlated to industrial worker
productivity for both developed and developing countries.
Additionally, from Figure 7, the observation can be made that the general relation is
positive across countries, and that there is an evident general increase in value
added per worker associated with increases in industrial robot density. Take note
that the Y axis (Productivity: value added per worker) is in the logarithmic base ten
scale due to the large differences in values between the respective countries.
© University of Pretoria
MBA 2015.16 Industrial robot population density and the neoclassical growth model Johan le Roux
Industrial robot population density and the neoclassical growth model 44
Figure 7. Combined X-Y scatterplot of all 38 countries.
Source: Authors own.
© University of Pretoria

MBA 2015.16 Industrial robot population density and the neoclassical growth model Johan le Roux
Industrial robot population density and the neoclassical growth model 45
6. Discussion of Results
6.1. Introduction
In this chapter the results of the statistical analysis in Chapter 5 will be discussed.
The discussion will follow the order of discussion of the main propositions, followed
by specific interpretations of the relevant statistical parameters, namely correlation
significance, regression coefficient or slope, Pearson’s correlation and coefficient
of determination for each of the propositions respectively.
6.2. Proposition one: Robot Density and Productivity
The management proposition was that there was a moderate to strong positive
statistical correlation between annual robot density (independent variable) and
industrial worker productivity (dependent variable) data per country over the ten
year period from 2005 to 2014. From the results presented in Chapter 5, Table 5, it
was found that there was indeed a moderate to very strong and positive correlation
between robot density and worker productivity for 31 out of the 38 countries, and
that the correlation was significant at the 95 per cent confidence interval.
Of the 7 countries for which Null Hypothesis one could not be rejected, only three,
namely Japan, The Republic of South Korea and Finland displayed negative slopes,
and the statistical significance was outside the 95 per cent confidence interval. It is
possible that these highly developed industrial countries have reached a level of
automation at which the marginal returns have become negative, a phenomenon
referred to as overcrowding. The scope of this research is however not to make
findings of individual countries, but to establish industrial root density as an indicator
for manufacturing economic and productivity growth.
For these 31 countries, the findings concur with the views of Autor (2015), Krone
(2014) and Mokyr et al. (2015) in that industrial robots are increasingly being used
to substitute for labour and to increase productivity. From the analysis one can
conclude that the annual increases in industrial robot installations per country
moderately to strongly correlate with increased productivity. The outcome is also in
alignment with Crafts (2015), where he found that new technology improved
productivity in the United Kingdom over a period of 30 years.
© University of Pretoria
MBA 2015.16 Industrial robot population density and the neoclassical growth model Johan le Roux
Industrial robot population density and the neoclassical growth model 46
The significance of the findings is that the annually published industrial robot density
data can be interrogated as a valuable economic indicator for the manufacturing
sector. Industrial robot density was found to be an economic metric similar to the
Agricultural Machinery and Tractors metric (AGRMACH) reported by the World
Bank. The relevance of this metric as an economic indicator for the agricultural
sector was evident from the work by Alston and Pardey (2014) and Khan et al.
(2014), and from this research it seems likely that industrial root density could fulfil
a similar role in the manufacturing sector.
The potential application of this finding is that decision and policy makers at
organisational, regional and national levels could use the data and methodology
from this research to gain guidance and insight when making investment and
manufacturing productivity decisions and investments. Industrial robotics have
indeed been elevated to national policy level, referring back to Chapter 1, where
robotic was a topic of Chinese President Xi Jinping’s speech in 2014 where he
called for a "robot revolution" to raise productivity in China (Chan, 2015).
6.2.1. Proposition one: Statistical Significance
The confidence interval for this research was set at the 95 per cent, or p < 0.05.
The statistical significance requirement was met for 31 of the 38 countries required,
Null Hypothesis one was rejected in favour of the management proposition in all 31
cases (Chapter 5 Table 5).
Greenland et al. (2016) refers to the confidence level not as the chance of making
an error, but how often you would have incorrectly rejected a null hypothesis. It also
infers that it is not true that because the null hypothesis could not be rejected in the
cases of the discussed 7 countries, the management proposition is rejected, but
rather that a statistical determination at the 95 per cent confidence interval could
not be made.
It can thus be concluded that the statistical relationship between industrial robot
density and productivity is a genuine relationship, and not due to chance, at a
confidence interval of 95 per cent (Wegner, 2012, p. 311). Interpreters could thus
have 95 per cent confidence in these results for evaluation.
© University of Pretoria
MBA 2015.16 Industrial robot population density and the neoclassical growth model Johan le Roux
Industrial robot population density and the neoclassical growth model 47
6.2.2. Proposition one: Regression Coefficient or Slope
An overwhelming 35 of 38, or 92 per cent, of countries displayed a positive
regression coefficient, or slope (β), between industrial robot density and industrial
worker productivity. Of the 38 countries, 31 displayed positive slopes at a
confidence interval of 95 per cent.
According to Baird and Bieber (2016), the slope is essentially the answer to the
research question of how the independent variable is predictive of the dependent
variable. For the purpose of this research, it is the answer to Proposition one: How
is industrial robot density predictive of productivity and manufacturing value added
respectively?
The interpretation is that increases in the density of industrial robots per 10 000
workers is associated with increased worker productivity, or manufacturing value
added per employee. The exceptions to this finding were Japan, The Republic of
South Korea and Finland. Again, the author suggests that there are specific
structural factors such as technology overcrowding, shortage of manual labour due
to ageing populations and low unemployment levels in these developed countries.
This phenomenon is an area of the study that could be an opportunity for future
research.
The average regression coefficient for the 38 countries assessed was 397. This
relates to an average increase in manufacturing value added per employee of $397
per additional industrial robot per 10 000 workers. To put this into context, Malaysia
(with a slope of 456) will be used to illustrate the implication.
From 2005 to 2014 Malaysia increased their installed base of operational industrial
robots from 1695 to 5730, translating to a robot density increase from 9 to 28 per
10 000 workers. Over the corresponding period, manufacturing value added per
employee increased from $12 610 to $21 656, as graphically illustrated in Figure 8.
© University of Pretoria
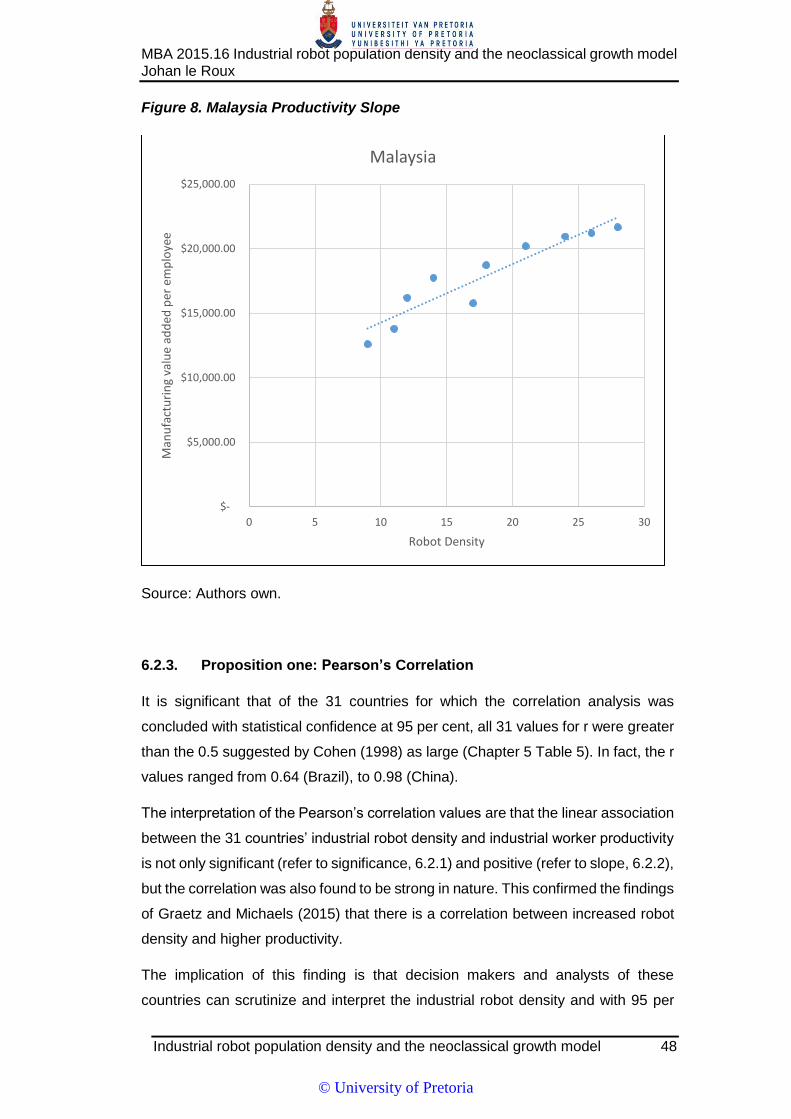
MBA 2015.16 Industrial robot population density and the neoclassical growth model Johan le Roux
Industrial robot population density and the neoclassical growth model 48
Figure 8. Malaysia Productivity Slope
Source: Authors own.
6.2.3. Proposition one: Pearson’s Correlation
It is significant that of the 31 countries for which the correlation analysis was
concluded with statistical confidence at 95 per cent, all 31 values for r were greater
than the 0.5 suggested by Cohen (1998) as large (Chapter 5 Table 5). In fact, the r
values ranged from 0.64 (Brazil), to 0.98 (China).
The interpretation of the Pearson’s correlation values are that the linear association
between the 31 countries’ industrial robot density and industrial worker productivity
is not only significant (refer to significance, 6.2.1) and positive (refer to slope, 6.2.2),
but the correlation was also found to be strong in nature. This confirmed the findings
of Graetz and Michaels (2015) that there is a correlation between increased robot
density and higher productivity.
The implication of this finding is that decision makers and analysts of these
countries can scrutinize and interpret the industrial robot density and with 95 per
$-
$5,000.00
$10,000.00
$15,000.00
$20,000.00
$25,000.00
0 5 10 15 20 25 30
Man
ufa
ctu
rin
g va
lue
add
ed p
er e
mp
loye
e
Robot Density
Malaysia
© University of Pretoria

MBA 2015.16 Industrial robot population density and the neoclassical growth model Johan le Roux
Industrial robot population density and the neoclassical growth model 49
cent confidence associate the variance with value added per industrial worker.
Industrial robot density as an economic indicator in the manufacturing sector has
great potential to be used by decision makers to motivate investment in the
application and installation of industrial robots.
6.2.4. Proposition one: Coefficient of Determination
The coefficient of determination, or r squared, applied to this study quantifies the
proportion of the variance of the industrial worker productivity, or response variable,
accounted for by the variance in industrial robot density, or predictor variable (Baird
& Bieber, 2016).
From Chapter 5 Table 5 it is remarkable to note that all of the 31 countries statistical
evaluations that presented with a confidence level at p < 0.05, or 95 per cent
interval, had r2 values exceeding the Cohen (1998) suggested criteria of 0.25 as a
large coefficient of determination.
The coefficient of determination values ranged from a large 0.41 in the case of
Brazil, to a very large 0.96 in the case of China. To illustrate the implication,
consider Figure 9, the X Y scatterplot for China with regression equation and r
squared values indicated.
© University of Pretoria
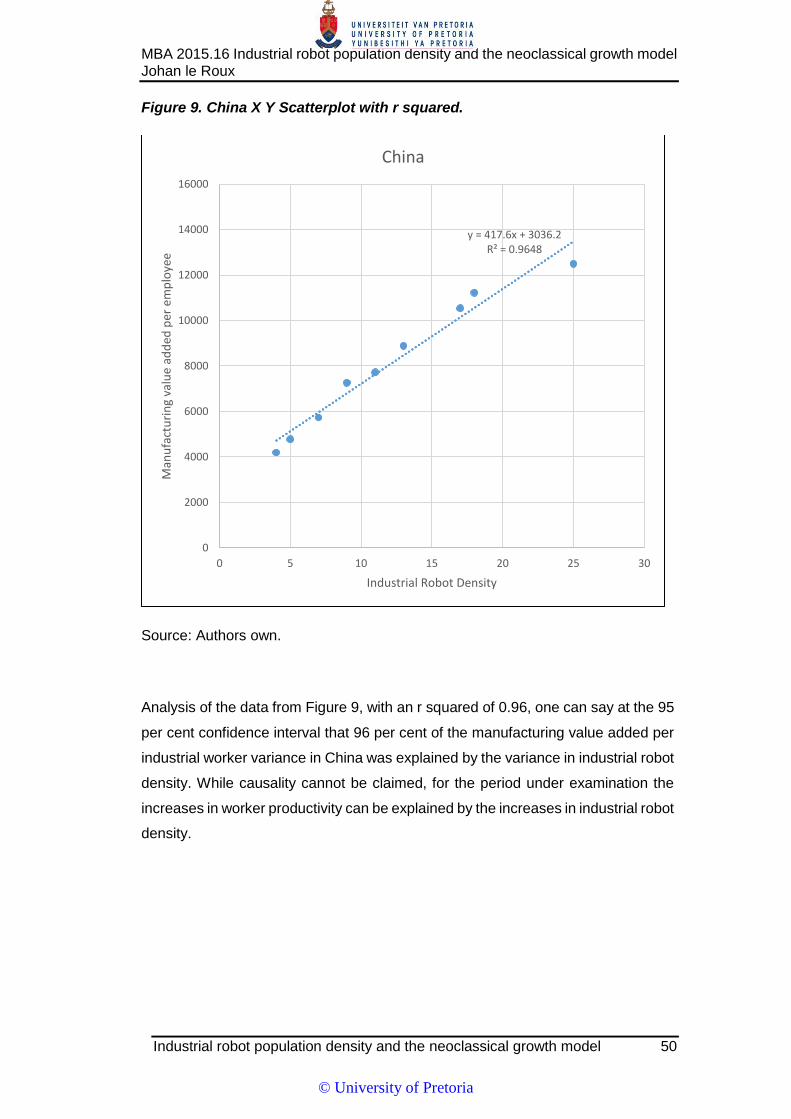
MBA 2015.16 Industrial robot population density and the neoclassical growth model Johan le Roux
Industrial robot population density and the neoclassical growth model 50
Figure 9. China X Y Scatterplot with r squared.
Source: Authors own.
Analysis of the data from Figure 9, with an r squared of 0.96, one can say at the 95
per cent confidence interval that 96 per cent of the manufacturing value added per
industrial worker variance in China was explained by the variance in industrial robot
density. While causality cannot be claimed, for the period under examination the
increases in worker productivity can be explained by the increases in industrial robot
density.
y = 417.6x + 3036.2R² = 0.9648
0
2000
4000
6000
8000
10000
12000
14000
16000
0 5 10 15 20 25 30
Man
ufa
ctu
rin
g va
lue
add
ed p
er e
mp
loye
e
Industrial Robot Density
China
© University of Pretoria

MBA 2015.16 Industrial robot population density and the neoclassical growth model Johan le Roux
Industrial robot population density and the neoclassical growth model 51
6.3. Proposition two: Robot Density and Industrial Sector Value Added
While proposition one dealt with labour productivity in the industrial sector,
proposition two statistically analysed the impact of industrial robot density on
economic growth, through looking at the economic contribution or manufacturing
valued added to gross domestic product per country. The distinction between the
two propositions is important. It is possible to achieve increased labour productivity
by simply replacing or substituting labour with capital, industrial robots in this case.
If this is done while output levels remain flat, labour productivity improved due to
lower workers employed, but no positive economic contribution was achieved.
Proposition two interrogates this in order to determine if increased industrial robot
densities are also associated with increased outputs, or manufacturing value
added.
The management proposition held that there was a moderate to strong positive
statistical correlation between annual robot density (independent variable) and
manufacturing valued added (dependent variable) data per country over the ten
year period from 2005 to 2014.
From the results presented in Chapter 5, Table 7, it was found that for the 19
countries for which statistical interpretations could be done at the 95 per cent
confidence interval, all 19 displayed a moderate to very strong and positive
correlation between robot density and manufacturing valued added to the
respective countries gross domestic product.
However statistically significant results for only 19 countries out of the population of
38 showed strong positive correlation between industrial robot density and
economic contributions. One could argue that this seems unremarkable in terms of
the second management proposition. Nonetheless, it is very important to
understand the context of the proposition. Manufacturing economic contribution to
national gross domestic product is influenced by a great number of factors, for
example macro-economic conditions, supply and demand, input and overhead
costs, exchange rate competitiveness, product sector competitiveness et cetera. It
would be simplistic to propose that by just installing thousands of industrial robots
indiscriminately economic output would be stimulated.
© University of Pretoria
MBA 2015.16 Industrial robot population density and the neoclassical growth model Johan le Roux
Industrial robot population density and the neoclassical growth model 52
Unsurprisingly, the answer to this conundrum lies in the neoclassical growth theory.
Solow (1956) proposed what became known as the Solow Residual, and identified
that labour could be substituted by capital, and that technology employed by capital
could lead to increased productivity. Ten Raa (2011) found not only is it possible for
technology to increase productivity, but that the growth rate in economic output can
exceed the growth rate of the inputs. Whether the capital employed is successful in
increasing economic output, depends on the design and care taken on a case by
case basis.
Notwithstanding the statistical support regarding the management proposition, that
the increased use of industrial robots is correlated with economic contribution, one
could also approach the argument logically. The relatively substantial cost and
complexity of installing each industrial robot, approximated at $75 000 for the
current decade (Frey & Osborne, 2013), implies that one should expect that a fairly
robust cost benefit exercise is carried out by the investing company prior to
installation. The deduction from this assumption is that one could expect only a
reasonably small number of unproductive or uneconomical robot installations.
This finding substantiates Graetz and Michaels’ (2015) finding that the increased
use of industrial robots were shown to have increased economic growth. The similar
findings are noteworthy, in that the fairly simple statistical methods employed by
this study were very different from the advanced models applied by Graetz and
Michaels. The different methods with similar findings gives further credibility to the
outcomes.
The potential application of this finding is that it is critical for investors and decision
makers, including governments, to consider the potential of increasing industrial
robotics investment in order to increase economic contribution from the
manufacturing sector. Moreover, industrial robot density as applied as a metric in
this study could be useful in making these investment decisions.
© University of Pretoria
MBA 2015.16 Industrial robot population density and the neoclassical growth model Johan le Roux
Industrial robot population density and the neoclassical growth model 53
6.3.1. Proposition two: Regression Significance
The confidence interval for this research was set at the 95 per cent interval, or p
<0.05. The statistical significance requirement for the regression between industrial
robot density and manufacturing value added was met for 19 of the 38 countries
required, Null Hypothesis two were rejected in favour of the management
proposition in all 19 cases (Chapter 5 Table 7).
The theoretical discussion around the statistical implication of the significance is
similar to the first proposition and can be referred to as per section 6.2.1 above to
prevent repetition.
It can be concluded that the statistical relationship between industrial robot density
and manufacturing value added for these countries is a genuine relationship, and
not due to chance, at a confidence interval of 95 per cent (Wegner, 2012, p. 311).
Evaluators of this data could thus have 95 per cent confidence in these results.
6.3.2. Proposition two: Regression Coefficient or Slope
A total of 32 of 38, or 84 per cent (Chapter 5 Table 7 and 8), of countries displayed
a positive regression coefficient, or slope (β), between industrial robot density and
manufacturing value added. However, of the 38 countries only 19 countries
displayed these positive slopes at a confidence interval of 95 per cent.
Applying Baird and Bieber’s (2016) definition to this research, the regression
coefficient or slope describes how industrial robot density is predictive of
manufacturing valued added per country. With regards to Proposition two, for the
19 countries for which statistical inference could be made at the 95 per cent
confidence interval, all of these countries displayed a positive slope.
The interpretation is that increases in the density of industrial robots per 10 000
workers is associated with increased manufacturing valued added, or
manufacturing contribution to gross domestic product growth. Astoundingly, not a
single country displayed negative manufacturing contribution slope when correlated
to industrial robot density at the 95 per cent confidence interval.
Even the Republic of South Korea displayed a positive slope for manufacturing
value added correlated to industrial robot density (Chapter 5 Table 7). Noteworthy
is that the Republic of South Korea, as well as Japan, displayed a negative slope
© University of Pretoria

MBA 2015.16 Industrial robot population density and the neoclassical growth model Johan le Roux
Industrial robot population density and the neoclassical growth model 54
in terms of worker productivity (Chapter 5 Table 6); note that this result is not
interpreted at the 95 per cent confidence interval. A possible interpretation in this
case is that the country is the most densely populated in terms of industrial robots,
and industrial worker productivity could not be shown with confidence to increase
with increases in robot density, possibly due to overcrowding and diminishing
returns. However, it could be shown with 95 per cent confidence that the
manufacturing value added did indeed increase along with increased robot density.
Figure 10. The Republic of Korea, scatterplot with slope.
Source: Authors own.
The average regression coefficient of the Republic of Korea was $503 million US
(from Figure 10) and the interpretation is that for each increment of industrial robot
density unit (number of industrial robots per 10 000 industrial workers), $503 million
US was contributed through manufacturing value added. In the case of the Republic
of Korea, one unit of industrial robot density increase comprises of approximately
370 additional industrial robots, at a cost of approximately $280 million US.
y = 0.5034x + 150.79R² = 0.9182
0
50
100
150
200
250
300
350
400
450
0 100 200 300 400 500 600
Man
ufa
ctyr
ing
Val
ue
Ad
ded
, l U
S$ B
n
Industrial Robot Density
Korea, Rep.
© University of Pretoria
MBA 2015.16 Industrial robot population density and the neoclassical growth model Johan le Roux
Industrial robot population density and the neoclassical growth model 55
6.3.3. Proposition two: Pearson’s Correlation
It is significant that of the 19 countries for which the correlation analysis was
concluded with the confidence interval at 95 per cent, all 19 values for the Pearson’s
correlation were greater than 0.5 (Chapter 5 Table 5). This exceeds the suggested
criteria of large by Cohen (1998). In fact, the r values ranged from 0.64 (Argentina),
to 0.98 (The Czech Republic).
The nature of the Pearson’s correlation values is that the linear association between
the 19 countries’ industrial robot density and manufacturing value added is not only
positive (refer to slope, 6.3.1) and significant (refer to significance, 6.3.2), but the
correlation was also found to be strong in nature. This confirmed the findings of
Graetz and Michaels (2015) that there is a correlation between increased robot
density and higher economic growth.
The implication of this finding is that decision makers and analysts of these
countries can scrutinize and interpret the industrial robot density and, at the 95 per
cent confidence interval, associate the variance with manufacturing value added,
or contribution to gross domestic product growth. Industrial robot density as an
economic indicator in the manufacturing sector has great potential to be used by
decision makers to motivate investment in the application and installation of
industrial robots.
6.3.4. Proposition two: Coefficient of Determination
The coefficient of determination, or r squared, applied to this study quantifies the
proportion of the variance of the manufacturing value added, or response variable,
accounted for by the variance in industrial robot density, or predictor variable (Baird
& Bieber, 2016).
From Chapter 5 Table 7 it is remarkable to note that all of the 19 countries with a
confidence level at p < 0.05, or 95 per cent confidence interval, had r2 values
exceeding the Cohen (1998) suggested criteria of 0.25 as a large coefficient of
determination. The coefficient of determination values ranged from a large 0.41 in
the case of the Czech Republic, to a very large 0.96 in the case of China. To
illustrate the implication, consider Figure 11, the X Y scatterplot for China with
regression equation and r squared values indicated.
© University of Pretoria
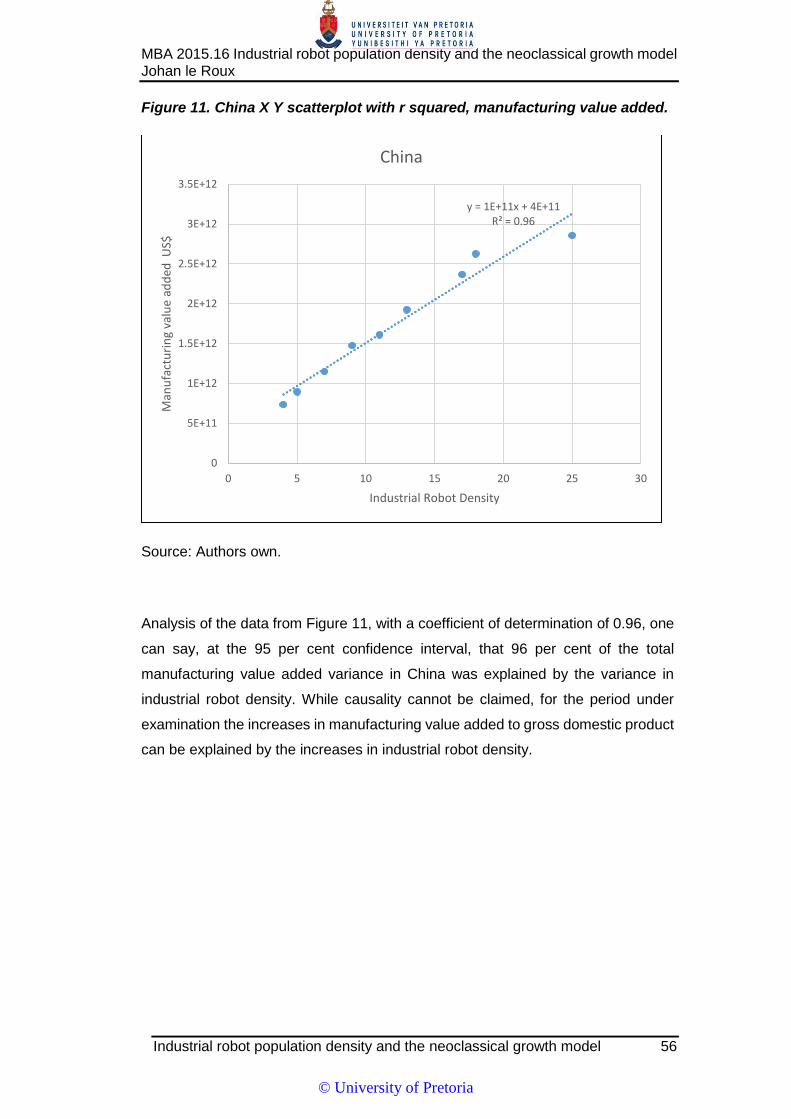
MBA 2015.16 Industrial robot population density and the neoclassical growth model Johan le Roux
Industrial robot population density and the neoclassical growth model 56
Figure 11. China X Y scatterplot with r squared, manufacturing value added.
Source: Authors own.
Analysis of the data from Figure 11, with a coefficient of determination of 0.96, one
can say, at the 95 per cent confidence interval, that 96 per cent of the total
manufacturing value added variance in China was explained by the variance in
industrial robot density. While causality cannot be claimed, for the period under
examination the increases in manufacturing value added to gross domestic product
can be explained by the increases in industrial robot density.
y = 1E+11x + 4E+11R² = 0.96
0
5E+11
1E+12
1.5E+12
2E+12
2.5E+12
3E+12
3.5E+12
0 5 10 15 20 25 30
Man
ufa
ctu
rin
g va
lue
add
ed U
S$
Industrial Robot Density
China
© University of Pretoria

MBA 2015.16 Industrial robot population density and the neoclassical growth model Johan le Roux
Industrial robot population density and the neoclassical growth model 57
6.4. Proposition three: Stages of Economic Development
Through observation of all 38 countries data combined into one X-Y scatter plot
(Figure 7) the finding was that the relationship between industrial robot density and
worker productivity did in fact hold across economies and countries, regardless of
stage of development and economy size.
This was also evident from analysing Table 5, where both developed and developing
countries met the requirements of Proposition one in similar proportions.
The observational finding can thus be made that the statistical relationship between
industrial robot density and industrial worker productivity is not only limited to
developed countries, but is also applicable to developed countries. This aligns with
the cross country convergence theory of Rodrik (2012) and Dowrick and Rogers
(2002).
This finding addresses one of the shortcomings identified by Graetz and Michaels
(2015), as the sample in their exploratory research only included developed
countries.
The implication of this finding is that the identified statistical relationship also holds
true for developing countries, and that the research is also of value to these
countries’ decision makers.
© University of Pretoria
MBA 2015.16 Industrial robot population density and the neoclassical growth model Johan le Roux
Industrial robot population density and the neoclassical growth model 58
7. Conclusion
7.1. Industrial Robot Density and Worker Productivity
Strong correlation was found between industrial robot density and industrial worker
value added per employee. The linear statistical relationship was proven for 31 out
of 38 countries at the 95 per cent confidence interval. This finding, that the use of
technologies such as industrial robotics, confirms previous research (Autor, 2015;
Graetz & Michaels, 2015; Mokyr et al., 2015; Krone, 2014). Furthermore, the role
of technology in productivity improvements finding aligns with the Solow residual
and neoclassical growth model theory (Burda & Severgnini, 2014, Solow, 1956, Ten
Raa, 2011).
The strong correlation showed that industrial robot density, as a promotor of
productivity, has potential to be used as a simple economic indicator or metric in
the manufacturing sector. This finding is in alignment with similar research by Alston
and Pardey (2014) and Khan et al. (2014), conducted in the agricultural sector. The
metric used in these studies as an indicator was agricultural machinery and tractors,
reported by the World Bank as AGRMACH. In both cases the capital investment in
measurable units of plant and equipment, tractors and agricultural machinery and
industrial robots, are used to increase productivity and output, and can be used as
an indicator for economic activity in the respective sectors.
It was also shown that these findings are not limited to developed countries only,
but for the first time also found to be applicable to developing countries.
7.2. Industrial Robot Density and Manufacturing Value Added
The conclusion on the finding of strong correlation between industrial robot density
and manufacturing value added is that increased industrial robot density is closely
associated with increased contribution, or value added, to gross domestic product
per country from the manufacturing sector.
This finding is consistent with neoclassical growth model theory and the Solow
residual research done by Bernard and Durlauf (1996), Crafts (2015) and Ten Raa
(2011) in terms of the use of technology as an enabler or promoter of long-run
economic growth. In terms of using industrial robot density as an economic indicator
or metric, this finding corresponds to the exploratory work done by Graetz and
© University of Pretoria

MBA 2015.16 Industrial robot population density and the neoclassical growth model Johan le Roux
Industrial robot population density and the neoclassical growth model 59
Michaels (2015). Where Graetz and Michaels did their research only on developed
OECD countries, this research confirmed the finding for a wider range of countries,
and found that the correlation is not only true for developed countries, but also for
developing countries.
7.3. Implications for Management
These findings can be very useful to management and decision makers from
company to national level, when considering capital investment or policy changes
regarding automation and robotics in the manufacturing sector. Industry role players
in both developed and developing countries can evaluate the statistical relationship
between industrial robot density and productivity and manufacturing value added
for the specific country under consideration.
The industrial robot density indicator or metric as researched in this paper can be
applied in economic analysis of productivity and growth potential, and assist in
making automation investment decisions in the specific countries.
While this research does not claim causality, few economists will claim that they
can predict future performance from past trends. However, it is worthwhile to
consider the optimal use of historical data and to identify correlations and trends,
such as in the case of this study. Moreover, this study is framed within the
neoclassical long-run growth theory, and based on numerous peer reviewed
articles. Still, the author emphasis that causality has not been proven or inferred
statistically.
Considering that the number of installed industrial robots increased at a year-on-
year rate of 29 per cent between 2013 and 2014, it is inconceivable to make slight
of the impact of industrial robots on the manufacturing sector of the world economy.
The author is in agreement with Chinese President Xi Jinping that a robot revolution
is underway (Chan, 2015), and this fusion of technologies was termed the fourth
industrial revolution by Klaus Schwab, speech as reported by Trudeau (2016),
during the World Economic Forum in Davos Switzerland. China is taking the lead
in accelerating investment in robotics in the industrial sector, increasing their
installed base at a rate of 56 per cent year-on-year by 2014 (International
Federation of Robotics, 2015). This increased their industrial robot density from 25
to 36 industrial robots per 10 000 industrial workers.
© University of Pretoria
MBA 2015.16 Industrial robot population density and the neoclassical growth model Johan le Roux
Industrial robot population density and the neoclassical growth model 60
Monitoring these and other trends from data supplied by the annual International
Federation of Robotics report will become increasingly important to role players in
the economic and manufacturing sectors, and while this research focussed mainly
on industrial robot density, as did Graetz and Michaels (2015), there are many more
datasets and trends available from the Federation of Robotics report that warrants
further research.
7.4. Limitations of the Research
The research methodology was intentionally based on only one independent
variable, namely industrial robot density. It is highly likely that stronger correlation
using multiple independent variables can be shown, such as supply and demand
conditions, political and macro-economic factors, restrictive labour legislation, cost
of capital et cetera. This would require a country by country analysis, and was not
within the scope of this research.
The dependent variable used to represent labour productivity, was industrial worker
value added per employee. While this is a simple to determine through dividing the
manufacturing value added per country by the reported total number of industrial
workers reported for the country, there are alternative indicators for productivity.
Total factor productivity, estimated as Tornqvist or Malmquist indices are
alternatives that are more comprehensive estimators of productivity than the
method employed in this study.
This research made use of secondary data sourced from the International Labour
Organisation (2014) and The World Bank (2016) databases. It would be of interest
to verify this data against independent or alternative sources, such as the World
Economic Forum databases amongst others.
While the statistical relationship between industrial robot density and productivity
and economic contribution was determined, causality was not determined.
However, long-run economic growth through productivity improvements enabled by
exogenous technology is covered extensively in literature (Autor, 2015; Bernard &
Durlauf, 1996; Krone, 2014; Mokyr et al., 2015). It is conceivable that Granger
causality, as used by Khan et al. (2014), might be proven empirically, but this was
not attempted or claimed by this study.
© University of Pretoria

MBA 2015.16 Industrial robot population density and the neoclassical growth model Johan le Roux
Industrial robot population density and the neoclassical growth model 61
The impact of automation and robotics on labour was included as part of the
literature review due to the contemporary discussions and academic interest.
However, this did not form part of the focus of the quantitative analysis.
Each countries’ statistical evaluation could merit individual research, however due
to the scope of this work and the fact that the sample consisted of 38 countries, only
salient comments regarding some of the countries were made.
7.5. Recommendations for Future Research
This research found strong, positive linear relationships between industrial robot
density and industrial worker productivity and manufacturing value added. Further
to these findings, value could be added to literature by investigating the covered
statistical relationships for causality, perhaps using Granger’s causality test and
variance decomposition. A comparable method could be used as was proposed in
a similar study in agriculture automation by Khan et al. (2014).
Although the scope of this research was limited to the industrial sector, it is likely
that a meaningful study covering the services sectors using similar data for service
robots could be conducted. Additionally, extensive literature and research is
available on the topic of the impact of automation and specifically robots on labour;
the International Federation of Robotics’ annual report could be a valuable source
of data to supplement this with a quantitative research on the subject.
A qualitative study could be done to investigate the suspected phenomenon of
diminishing marginal returns, or overcrowding, observed in the analysis of the
Republic of South Korea and Japan. These two countries have the highest and
second highest industrial robot density respectively (Figure 2 and Table 1), and it is
possible that the industries have been saturated with industrial robots, and that
additional robots are added due to labour shortages, and not necessarily to improve
productivity or increase value added.
Impacts of restrictive labour laws on the potential of industrial robotics to improve
productivity should be investigated. An example is South Africa, where it is
problematic to reduce labour when the installation of robotics have presented
opportunities to do so.
© University of Pretoria
MBA 2015.16 Industrial robot population density and the neoclassical growth model Johan le Roux
Industrial robot population density and the neoclassical growth model 62
Reference List
Alston, J. M., & Pardey, P. G. (2014). Agriculture in the global economy. The Journal
of Economic Perspectives, 28(1), 121-146. doi: 10.1257/jep.28.1.121
Autor, D. H. (2015). Why are there still so many jobs? The history and future of
workplace automation. The Journal of Economic Perspectives, 29(3), 3-30.
doi: 10.1257/jep.29.3.3
Baird, G. L., & Bieber, S. L. (2016). The Goldilocks Dilemma: Impacts of
Multicollinearity--A Comparison of Simple Linear Regression, Multiple
Regression, and Ordered Variable Regression Models. Journal of Modern
Applied Statistical Methods, 15(1), 18. Retrieved from
http://digitalcommons.wayne.edu/jmasm/vol15/iss1/18:
Baldwin, R., & Teulings, C. (2014). Secular stagnation: facts, causes and cures.
London: Centre for Economic Policy Research-CEPR. Retrieved from
http://www.tau.ac.il/~yashiv/Vox_secular_stagnation.pdf
Bernard, A. B., & Durlauf, S. N. (1996). Interpreting tests of the convergence
hypothesis. Journal of econometrics, 71(1), 161-173. doi: 10.1016/0304-
4076(94)01699-2
Brandt, L., Van Biesebroeck, J., & Zhang, Y. (2012). Creative accounting or creative
destruction? Firm-level productivity growth in Chinese manufacturing. Journal
of Development Economics, 97(2), 339-351. doi:
10.1016/j.jdeveco.2011.02.002
Brynjolfsson, E., & Hitt, L. M. (1998). Beyond the productivity paradox.
Communications of the ACM, 41(8), 49-55. doi: 10.1145/280324.280332
© University of Pretoria

MBA 2015.16 Industrial robot population density and the neoclassical growth model Johan le Roux
Industrial robot population density and the neoclassical growth model 63
Brynjolfsson, E., & McAfee, A. (2011). Race against the machine. Digital Frontier,
Lexington, MA. Retrieved from www.change-management.net
Brynjolfsson, E., & McAfee, A. (2012). Winning the race with ever-smarter
machines. MIT Sloan Management Review, 53.2 (2012): 53.
Burda, M. C., & Severgnini, B. (2014). Solow residuals without capital stocks.
Journal Of Development Economics, 109154-171.
doi:10.1016/j.jdeveco.2014.03.007
Calver, M. (2015). On the Relationship between Gross Output-based TFP Growth
and Value Added-based TFP Growth: An Illustration Using Data from
Australian Industries. International Productivity Monitor, (29), 68. Retrieved
from http://search.proquest.com/docview/1757275944?pq-origsite=gscholar
Chan, K. (2015). China's robot revolution is happening. Business Insider. Retrieved
from http://www.businessinsider.com/chinas-robot-revolution-is-happening-
2015-9
Cohen, J. (1988). Statistical power analysis for the behavioral sciences. (2nd
ed.). Hillsdale, NJ: Erlbaum. doi: 10.3758/BF03193146
Crafts, N. (2015). Economic growth: onwards and upwards? Oxford Review of
Economic Policy, 31(2), 217-241. doi: 10.1093/oxrep/grv014
de Souza, S. V., & Junqueira, R. G. (2005). A procedure to assess linearity by
ordinary least squares method. Analytica Chimica Acta, 552(1), 25-35. doi:
10.1016/j.aca.2005.07.043
Financial Times. (2016). Robots friend or foe? Retrieved from
http://www.ft.com/home/europe
© University of Pretoria
MBA 2015.16 Industrial robot population density and the neoclassical growth model Johan le Roux
Industrial robot population density and the neoclassical growth model 64
Frey, C. B., & Osborne, M. A. (2013). The future of employment: How susceptible
are jobs to computerisation. Retrieved from https://www.fhi.ox.ac.uk/wp-
content/uploads/The-Future-of-Employment-How-Susceptible-Are-Jobs-to-
Computerization.pdf
Gourinchas, P. O., & Jeanne, O. (2013). Capital flows to developing countries: The
allocation puzzle. The Review of Economic Studies, rdt004. doi:
10.1093/restud/rdt004
Graetz, G., & Michaels, G. (2015). Robots at work. CEP Discussion Paper No 1335.
Retrieved from http://eprints.lse.ac.uk/61155/
Greenland, S., Senn, S. J., Rothman, K. J., Carlin, J. B., Poole, C., Goodman, S.
N., & Altman, D. G. (2016). Statistical tests, P values, confidence intervals,
and power: a guide to misinterpretations. European journal of epidemiology,
1-14. doi: 10.1007/s10654-016-0149-3
Halsmayer, V. (2014). From exploratory modelling to technical expertise: Solow’s
growth model as a multipurpose design. History of Political Economy,
46(suppl. 1), 229-251. doi: 10.1215/00182702-2716181
Inklaar, R., & Diewert, W. E. (2015). Measuring industry productivity and cross-
country convergence. Journal of Econometrics. 191 (2), 426–433. doi:
10.1016/j.jeconom.2015.12.013
International Federation of Robotics (IFR). (2014). World robotics industrial robots
2015, ISBN 978-3-8163-0665-8. Frankfurt, Germany.
International Federation of Robotics (IFR). (2015). World robotics industrial robots
2015, ISBN 978-3-8163-0679-5. Frankfurt, Germany.
© University of Pretoria
MBA 2015.16 Industrial robot population density and the neoclassical growth model Johan le Roux
Industrial robot population density and the neoclassical growth model 65
International Labour Organisation (ILO). (2014). Global employment trends.
Retrieved from http://www.ilo.org/global/research/global-reports/global-
employment-trends/2014/WCMS_234879/lang--en/index.htm
ISO/IEC ISO 8373 (2012): Robots and robotic devices -- Vocabulary, International
Organization for Standardization, Geneva, Switzerland. Retrieved from
http://www.iso.org/iso/iso_catalogue/catalogue_tc/catalogue_detail.htm?csn
umber=55890
Khan, M. A., Khan, M. Z., Zaman, K., & Khan, M. M. (2014). The evolving role of
agricultural technology indicators and economic growth in rural poverty: has
the ideas machine broken down? Quality & Quantity, 48(4), 2007-2022. doi:
10.1007/s11135-013-9877-6
Kristal, T. (2013). The capitalist machine: computerization, workers’ power, and the
decline in labor’s share within U.S. industries. American Sociological Review,
78(3), 361-389. doi:10.1177/0003122413481351
Krone, R. M. (2014). Increasing workforce productivity: smarter people and
machines. International Journal of Human Resources Development &
Management, 14(1), 147-156. doi:10.1504/IJHRDM.2014.068076
Lieberman, M. B., & Kang, J. (2008). How to measure company productivity using
value-added: A focus on Pohang Steel (POSCO). Asia Pacific Journal of
Management, 25(2), 209-224. doi: 10.1007/s10490-007-9081-0
Mihai, I. A., & Jivan, A. (2014). A Comparative Analysis of Productivity
Measurements for Five European Countries. Journal of International Business
and Economics, 2(2), 33-60. Retrieved from http://jibe-
net.com/journals/jibe/Vol_2_No_2_June_2014/3.pdf
© University of Pretoria

MBA 2015.16 Industrial robot population density and the neoclassical growth model Johan le Roux
Industrial robot population density and the neoclassical growth model 66
Milkman, R. (1997). Farewell to the factory: Auto workers in the late twentieth
century. Berkeley: University of California Press.
Mokyr, J., Vickers, C., & Ziebarth, N. L. (2015). The history of technological anxiety
and the future of economic growth: Is this time different? The Journal of
Economic Perspectives, 29(3), 31-50. doi: 10.1257/jep.29.3.31
Oh, D., Heshmati, A., & Lööf, H. (2012). Technical change and total factor
productivity growth for Swedish manufacturing and service industries. Applied
Economics, 44(18), 2373-2391. doi:10.1080/00036846.2011.564147
Petrin, A., White, T. K., & Reiter, J. P. (2011). The impact of plant-level resource
reallocations and technical progress on US macroeconomic growth. Review
of Economic Dynamics, 14(1), 3-26. doi: 10.1016/j.red.2010.09.004
Pratt, G. A. (2015). Is a Cambrian Explosion Coming for Robotics? Journal Of
Economic Perspectives, 29(3), 51-60. doi:10.1257/jep.29.3.51
Rodrik, D. (2012). Unconditional Convergence in Manufacturing*. The Quarterly
Journal of Economics, qjs047. doi: 10.1093/qje/qjs047
Saunders, M., & Lewis, P. (2012). Doing research in business and management:
An essential guide to planning your project Upper Saddle River, NJ: Financial
Times Prentice Hall.
Schwab, K. (2016). The fourth industrial revolution: What it means, how to respond.
Opening of the 2016 World Economic Forum, Davos, Switzerland. Retrieved
from http://www. weforum. org/agenda/2016/01/the-fourth-industrial-
revolution-what-it-means-and-how-to-respond
© University of Pretoria

MBA 2015.16 Industrial robot population density and the neoclassical growth model Johan le Roux
Industrial robot population density and the neoclassical growth model 67
Solow, R. M. (1956). A contribution to the theory of economic growth. The
quarterly journal of economics, 65-94. Retrieved from
http://www.jstor.org/stable/1884513
Solow, R.M. (2008). The Concise Encyclopedia of Economics. Library of
Economics and Liberty. Retrieved from
http://www.econlib.org/library/Enc/bios/Solow.html
Solow, R.M. (2001). Applying growth theory across countries. The World Bank
Economic Review, 15(2), 283-288. Retrieved from
http://www.jstor.org/stable/3990266
Ten Raa, T. (2011). Benchmarking and industry performance. Journal of
Productivity Analysis, 36(3), 285-292. doi: 10.1007/s11123-011-0214-6
Trudeau, J. (2016). A Fourth Industrial Revolution? World Economic Forum 2016.
Davos, Switzerland. Vital Speeches International, 8(3), 76-77.
United Nations. (2014). World Economic Situation and Prospects. New York.
Retrieved from
http://www.un.org/en/development/desa/policy/wesp/wesp_current/2014w
esp_country_classification.pdf
United States Census Bureau. (2016). Retrieved from
https://www.census.gov/population/international/data/worldpop/Table_popul
ation. php
Waters, R. & Bradshaw, T. (2016). Rise of the robots is sparking an investment
boom. Financial Times. Retrieved from
© University of Pretoria
MBA 2015.16 Industrial robot population density and the neoclassical growth model Johan le Roux
Industrial robot population density and the neoclassical growth model 68
http://www.ft.com/intl/cms/s/2/5a352264-0e26-11e6-ad80-
67655613c2d6.html#axzz47aD9wMj0
Wegner, T. (2012). Applied Business Statistics: Methods and Excel-based
applications. (Third edit). Cape Town: Juta Academic
World Bank. (2015). Indicator: Agricultural machinery, tractors per 100 sq. km of
arable land. Retrieved from
http://data.worldbank.org/indicator/AG.LND.TRAC.ZS
World Bank. (2016). World Development Indicators: Manufacturing, value added
(current US$). Retrieved from
http://data.worldbank.org/indicator/AG.LND.TRAC.ZS
© University of Pretoria

MBA 2015.16 Industrial robot population density and the neoclassical growth model Johan le Roux
Industrial robot population density and the neoclassical growth model 69
APPENDIX 1 – ETHICAL CLEARANCE APPROVAL
© University of Pretoria

MBA 2015.16 Industrial robot population density and the neoclassical growth model Johan le Roux
Industrial robot population density and the neoclassical growth model 70
APPENDIX 2 – IFR APPROVAL LETTER
© University of Pretoria

MBA 2015.16 Industrial robot population density and the neoclassical growth model Johan le Roux
Industrial robot population density and the neoclassical growth model 71
APPENDIX 3 - TURNITIN ORIGINALITY REPORT
Turnitin Originality Report
LeRouxJ:Industrial robot population density and the neoclassical growth model by
Johan Le Roux
From Test your originality (GIBS Information Centre _99_1)
Processed on 04-Nov-2016 19:26 SAST ID: 670304335 Word Count: 18064
Similarity Index
16%
Similarity by Source
Internet Sources:
13%
Publications:
7%
Student Papers:
9%
sources:
1
< 1% match (Internet from 16-May-2016)
http://ec.europa.eu/newsroom/dae/document.cfm?doc_id=11165
2
< 1% match (Internet from 08-Jan-2015)
http://www.docstoc.com/docs/171161357/Applied-Business-Statistics_-Methods-
and-Excel-based-Applicationspdf
3
< 1% match (Internet from 23-Aug-2011)
http://www.nationmaster.com/compare/Canada/China/Industry
© University of Pretoria
MBA 2015.16 Industrial robot population density and the neoclassical growth model Johan le Roux
Industrial robot population density and the neoclassical growth model 72
4
< 1% match (Internet from 26-May-2014)
http://upetd.up.ac.za/thesis/available/etd-03092013-
154822/unrestricted/dissertation.pdf
5
< 1% match (Internet from 18-Nov-2012)
http://www.benettongroup.com/media-press/contacts/europe-and-middle-
east/croatia
6
< 1% match (publications)
Greenland, Sander, Stephen J. Senn, Kenneth J. Rothman, John B. Carlin, Charles
Poole, Steven N. Goodman, and Douglas G. Altman. "Statistical tests, P values,
confidence intervals, and power: a guide to misinterpretations", European Journal of
Epidemiology, 2016.
7
< 1% match (student papers from 02-Oct-2016)
Submitted to Swinburne University of Technology on 2016-10-02
8
< 1% match (publications)
Crafts, Nicholas. "Economic growth: onwards and upwards?", Oxford Review of
Economic Policy, 2015.
9
< 1% match (Internet from 11-Jun-2014)
http://www.anderson.ucla.edu/faculty/marvin.lieberman/docs/Lieberman_POSCO.pd
f
10
< 1% match (student papers from 09-Jun-2015)
Submitted to Laureate Higher Education Group on 2015-06-09
11
< 1% match (Internet from 04-Oct-2016)
https://www.scribd.com/document/176695070/Dissertation-m-as
© University of Pretoria
MBA 2015.16 Industrial robot population density and the neoclassical growth model Johan le Roux
Industrial robot population density and the neoclassical growth model 73
12
< 1% match (Internet from 19-Apr-2016)
http://nomorepotlucks.org/site/posthumanism-and-the-political-problem-of-risk-
robert-n-spicer/
13
< 1% match (student papers from 10-Jan-2016)
Submitted to Higher Education Commission Pakistan on 2016-01-10
14
< 1% match (student papers from 07-Jul-2016)
Submitted to University of South Florida on 2016-07-07
15
< 1% match (publications)
Bertrand, Olivier, and Laurence Capron. "Productivity enhancement at home via
cross-border acquisitions: The roles of learning and contemporaneous domestic
investments : Cross-Border Acquisitions and Domestic Productivity", Strategic
Management Journal, 2014.
16
< 1% match (student papers from 09-Sep-2016)
Submitted to Bowling Green State University on 2016-09-09
17
< 1% match (Internet from 24-May-2016)
https://aaltodoc.aalto.fi/bitstream/handle/123456789/19321/hse_ethesis_14220.pdf?i
sAllowed=y&sequence=1
18
< 1% match (student papers from 31-Jan-2016)
Submitted to DeVry University Onlline on 2016-01-31
19
< 1% match (student papers from 28-Dec-2014)
Submitted to American Public University System on 2014-12-28
20
< 1% match (student papers from 31-Oct-2012)
© University of Pretoria

MBA 2015.16 Industrial robot population density and the neoclassical growth model Johan le Roux
Industrial robot population density and the neoclassical growth model 74
Submitted to University of Pretoria on 2012-10-31
21
< 1% match (Internet from 08-Dec-2015)
http://robotenomics.com/
22
< 1% match (Internet from 26-Apr-2016)
https://www.springerprofessional.de/en/history-of-economic-development-in-south-
korea/4856036
23
< 1% match (student papers from 30-Nov-2014)
Submitted to American Public University System on 2014-11-30
24
< 1% match (student papers from 23-Aug-2016)
Submitted to University of Surrey on 2016-08-23
25
< 1% match (student papers from 06-Apr-2016)
Submitted to Kaplan College on 2016-04-06
26
< 1% match (student papers from 13-Jun-2016)
Submitted to University of Surrey on 2016-06-13
27
< 1% match (Internet from 04-Sep-2014)
http://www.voxeu.org/sites/default/files/Vox_secular_stagnation.pdf
28
< 1% match (Internet from 04-May-2016)
http://dspace.nwu.ac.za/bitstream/handle/10394/10738/Janse_van_Rensburg_L.pdf
?sequence=1
29
< 1% match (publications)
Arita, Shawn, and Kiyoyasu Tanaka. "Heterogeneous multinational firms and
productivity gains from falling FDI barriers", Review of World Economics, 2014.
© University of Pretoria

MBA 2015.16 Industrial robot population density and the neoclassical growth model Johan le Roux
Industrial robot population density and the neoclassical growth model 75
30
< 1% match (Internet from 21-May-2016)
http://cep.lse.ac.uk/pubs/download/CentrePiece_20_1.pdf
31
< 1% match (Internet from 16-Mar-2015)
http://pvmi.wharton.upenn.edu/publications/journal-articles-2/
32
< 1% match (student papers from 21-Apr-2016)
Submitted to University of Cape Town on 2016-04-21
33
< 1% match (Internet from 26-May-2016)
http://www.wrr.nl/fileadmin/nl/publicaties/PDF-
verkenningen/Verkenning_31_De_robot_de_baas_4-12-2015_def.pdf
34
< 1% match (Internet from 02-Mar-2016)
http://csls.ca/ipm/29/diewert.pdf
35
< 1% match (Internet from 15-May-2016)
http://digitalcommons.wayne.edu/jmasm/vol15/iss1/18/
36
< 1% match (Internet from 22-Mar-2016)
http://esa12thconference.eu/sites/esa12thconference.eu/files/esa_2015_book_of_ab
stracts.pdf
37
< 1% match (Internet from 24-May-2016)
http://irep.ntu.ac.uk/27720/1/27720_Jarvis.pdf
38
< 1% match (publications)
"US Economy: Auto Sector Buys Every Second Industrial Robot.", PR Newswire,
March 23 2016 Issue
© University of Pretoria

MBA 2015.16 Industrial robot population density and the neoclassical growth model Johan le Roux
Industrial robot population density and the neoclassical growth model 76
39
< 1% match (student papers from 23-Aug-2016)
Submitted to University of Surrey on 2016-08-23
40
< 1% match (student papers from 31-Oct-2016)
Submitted to University of Nairobi on 2016-10-31
41
< 1% match (student papers from 14-May-2015)
Submitted to University of Newcastle upon Tyne on 2015-05-14
42
< 1% match (student papers from 21-Aug-2016)
Submitted to Laureate Higher Education Group on 2016-08-21
43
< 1% match (Internet from 28-Oct-2010)
http://etd.lib.montana.edu/etd/2009/hooker/HookerD1209.pdf
44
< 1% match (publications)
de Souza, S.V.C.. "A procedure to assess linearity by ordinary least squares method",
Analytica Chimica Acta, 20051103
45
< 1% match (student papers from 26-May-2015)
Submitted to University of Hull on 2015-05-26
46
< 1% match (Internet from 10-Sep-2016)
http://publicaciones.eafit.edu.co/index.php/administer/article/view/3281
47
< 1% match (student papers from 30-Sep-2016)
Submitted to Anglia Ruskin University on 2016-09-30
48
< 1% match (student papers from 13-Apr-2016)
© University of Pretoria