industrial specialisation in the european union… · industrial specialisation in the european...
TRANSCRIPT

INDUSTRIAL SPECIALISATION IN THE EUROPEAN UNION: A TEST OF THE "NEW TRADE THEORY"
Trinity Economic Paper Series
Technical Paper No. 95/5 JEL Classification: F1, R12
Marius Brülhart Department of Economics Trinity College Dublin 2 email: [email protected]
Abstract
Industry location in the European Union is examined in order to explore the relevance of the "new" theories of trade and economic geography. The analysis is based on a set of highly disaggregated intra-industry trade indices for 1961-1990, complemented by sectoral employment statistics for EU countries and regions. It is found that, as predicted by the "new" theories, increasing-returns industries are strongly concentrated at the economic core of the EU and display low levels of intra-industry trade. High-tech industries are also highly localised, but show no centre-periphery gradient and no specific pattern of intra-industry trade. The main potential for future specialisation appears to remain in sectors sensitive to labour costs, which are still relatively dispersed and have high levels of intra-industry trade. Employment in these industries is shifting towards the EU periphery. "Classical" determinants of international specialisation are thus expected to dominate the impending adjustment process in EU manufacturing.
Acknowledgements
Special thanks to Dermot McAleese and Paul Walsh for valuable comments. This paper has also benefited from suggestions made by Bob Hine, Jacob Kol, Chris Milner, Christian Montet, Lucy O'Shea, Johan Torstensson and Leona Walker. Part of the research was financed by the Stimulation Plan for Economic Sciences of the European Union (SPES-CT91-0058). Earlier versions of the paper have been presented at the SPES Workshop, University of Nottingham, September 1994, and at the "Journées AFSE" in Nantes, June 1995.

2
Introduction
Economists generally agree that economic integration generates net welfare gains. International competition and specialisation increases efficiency in production and enhances consumption opportunities, which result in net gains of combined producer and consumer surplus. This is the economic rationale behind the successive measures of economic integration in the European Union, from the signing of the Treaty of Rome in 1957 to the implementation of the Single Market programme.
The distribution of these overall welfare gains, however, is subject to an
ongoing theoretical and empirical debate. One particular aspect of European economic integration is examined in this paper, namely the geographical location of manufacturing industry.1 Although integration generally stimulates industrial activity, this stimulative effect may not be spread evenly. Due to certain locational advantages, some countries tend to specialise into certain industries, while others specialise out of these industries. Both groups of countries may still be net gainers in terms of combined producer and consumer surplus, but the industry-specific welfare gains are greater for the countries specialising into a particular sector. The intensification of EU regional policies since 1992 implies that policy makers have recognised the potentially uneven distributive effects of the Single Market programme.
This paper investigates the pattern of industrial specialisation among EU
countries and tests the validity of recent developments in trade and location theory. As integration progresses, the question is whether EU industry concentrates around an industrial core, or whether its growth is dispersed evenly among the member states. Such trends are not expected a priori to affect all industrial sectors symmetrically. Thus, the analysis is carried out on a
1This is only one element of integration effects. We commonly distinguish between, on the one
hand, consumer gains from lower prices and more varied product ranges and, on the other hand, producer gains from specialisation. The location of manufacturing activity is often cited among the main production-related welfare aspects because of externalities such as industry's role as a technological catalyst. For a survey of current thinking on regional distribution effects see O'Donnell (1992). Note that this is not a study of income convergence among the countries or regions of the European Union. For a recent analysis of convergence of EU countries, see Ben-David (1993). Neven and Gouyette (1995) have studied convergence among EU regions.
3
disaggregate set of industrial statistics. Indices of intra-industry trade are used as a measure of industrial similarity or specialisation.
Some stylised facts drawn from the "new" theories of trade and economic
geography provide the background for this paper. These theories emphasise the role of scale economies, product differentiation and imperfect competition, rather than factor endowments, as determinants of specialisation and trade patterns. Four salient points of the "new" theories are identified in Brülhart (1995): 1. Plant-internal scale economies are positively related to locational
concentration. As a consequence, the level of intra-industry trade is expected to be low in industries subject to strongly increasing returns to scale.
2. Regionally contained external scale economies, arising mainly from technological spillovers, relate positively to locational concentration and negatively to the level of intra-industry trade.
3. When countries integrate, increasing-returns industries concentrate in the country with the largest market for the relevant products. This applies to industries with internal scale economies as well as to industries with external economies.
4. Sensitivity to factor costs can limit the centripetal forces in increasing-returns industries and result in industrial dispersion and high levels of intra-industry trade even in a highly integrated area.
It is attempted to make some progress on what Krugman (1994, p. 26) has
described as the "disappointing state of empirical work on the new trade theory". The paper also updates the much discussed study by Hufbauer and Chilas (1974), who were puzzled about the low levels of industrial specialisation among the countries of the European Economic Community in comparison to the degree of locational concentration of industry in the United States.
This paper is divided into three main parts. Section I examines sectoral
specialisation trends among EU countries using indices of intra-industry trade as a gauge. Section II, discusses centre-periphery patterns of intra-industry trade among EU countries. The trade analysis is complemented in Section III by a study of the sectoral distribution of employment, both for EU countries and for EU regions. The main findings of the paper are summarised in the Conclusion.
4
I Intra-Industry Trade and Industry Characteristics The "new" theories of trade and economic geography stress the
importance of scale economies and predict a continuous process of industrial concentration as economic transactions become less and less costly both between countries and between regions. As industries cluster geographically - given that the necessary time for firm relocation has elapsed - horizontal IIT gradually diminishes.
At first sight, the development of IIT levels in the EU appears to lend
support to this prediction. Figure 1 shows that the general rise of IIT levels observed in virtually all industrialised countries throughout the post-War era has in some instances slowed down, and even started to decline, during the 1980s.2
While the weighted average of intra-EU IIT in manufactured products was still on the increase, the unweighted average, calculated over 98 SITC 3-digit product groups slightly decreased between 1985 and 1990. Three major EU economies, France, Italy and the UK, displayed stagnating or decreasing IIT trends.3
While illustrating the break in the trend towards ever higher IIT levels in
the EU countries, Figure 1 also confirms that IIT is a real and significant phenomenon. In 1990, when the SITC product nomenclature distinguished between 2398 different industrial goods, 51.6% of intra-EU manufactures trade was IIT.
In the remainder of this Section, we endeavour to analyse the aggregate
trends in manufacturing IIT against the background of the stylised predictions of the "new" theories. The analysis is confined to manufacturing industry (SITC 5-8), which is the economic sector most modern trade theory is concerned with.
Scale Economies
As a first step in the analysis of intra-EU IIT developments, we investigate the effect of increasing returns both on the levels and on the trends of IIT. For this purpose, 94 industries of our SITC 3-digit data set are allocated to one of
2Information on the data and methods used throughout this paper is provided in the Appendix. 3Similar trend reversals have occurred in Denmark and Ireland.

5
three categories of scale economies: HIGH, INTERMEDIATE and LOW.4 This three-way partition is based on a study by Pratten (1988, p. 2-70), where manufacturing industries are ranked "in order of the importance of economies of scale for spreading development costs and for production costs", scale economies relating to the variables "products and production runs" and "size of the establishment". There is thus a clear correspondence between this empirical classification and the theoretical concept of internal scale economies.
The results reported in Figure 2 are unweighted averages of IIT levels in
SITC 3-digit industries, originally calculated at the 4- and 5-digit levels. Two features of the plotted IIT trends are noteworthy.
First, industries with low scale economies appear to exhibit consistently
higher levels of IIT than industries with intermediate or high economies of scale. This phenomenon runs counter to much of the common understanding of factors underlying IIT, but it confirms the predictions of the "new" trade theory, whereby some interval of decreasing costs is necessary for the emergence of IIT (which is true for nearly all industrial activities), but, as this interval grows beyond some lower threshold, IIT levels decline. Ray (1991, p. 169) has detected the same pattern in the United States, where IIT "occurs predominantly in product lines in which efficient production is small-scale".
Second, Figure 2 indicates that the reversal of the IIT trend occurred
earlier where increasing returns are important. IIT in the sectors of the HIGH category stagnated between 1977 and 1985, while the trend break in the INTERMEDIATE group occurred after 1985, and the LOW category experienced continued IIT growth until 1990. This pattern might reflect a process of industrial concentration fuelled by the exploitation of strong economies of scale, in the sense of the "new" theories. The greater the potential economies from industrial agglomeration, the greater would be the incentives to speed up the re-location process following the liberalisation of trade and the relocation of industrial activity.
The validity of these results might be called into doubt for a number of
reasons. For instance, the difference between the averages of the three industry
4Four of the 98 3-digit industries could not be allocated to any of the sectors contained in the
list by Pratten (1988) (see Appendix).

6
categories might be purely random. This would be the case if variances within categories were high relative to the differences between the calculated means. Analysis of variance (ANOVA) indicates that the differences between the categories HIGH and INTERMEDIATE are indeed not statistically significant. However, the differences between the means of all three categories are significant at the 1% level for all years except 1977 and 1985. This suggests that the difference between the LOW category and the two other groups is significant, and that the widening of IIT disparities between 1985 and 1990 was not a random event.
Another concern might arise due to the increase in the number of base
industries underlying the IIT calculations over the sample period. Since higher sectoral disaggregation biases IIT downwards, the trends depicted in Figure 2 could be due to a disproportionate rise in the number of underlying industries in the HIGH and INTERMEDIATE categories. We have tested this possibility by calculating the ratio between the number of base industries in 1961 (SITC Revision 1, 4-digit level) and the number of base industries in 1990 (SITC Revision 3, 5-digit level), separately for each category. The increase in the total number of manufacturing product groups from 365 in 1961 to 2169 in 1990 is reflected in high values of our calculated ratios. In the LOW category, the number of base industries was 5.29 times higher in 1990 than in 1961, in the INTERMEDIATE category, this ratio was 7.29, and in the HIGH category it stood at 4.46. While the rate of increase in product disaggregation was highest in the INTERMEDIATE category, it was lower in the HIGH group than in the LOW category. Hence, at least for the industries with high scale economies, increased statistical disaggregation cannot be the cause of the relatively pronounced IIT growth reversal.
Our calculations based on the product categorisation by Pratten (1988)
thus seem to have yielded statistically significant results. Nevertheless, they ought to be treated with caution. First, many 3-digit product groups are heterogeneous amalgams of goods with considerably different underlying production requirements. Hence, any categorisation according to certain production characteristics is bound to be somewhat arbitrary. Second, industry categories according to the importance of scale economies could happen to coincide with other distinguishing factors which might be a more important determinant of IIT patterns. One way of double-checking our results, is to apply

7
alternative categorisations and to compare the results with those obtained here. This will be undertaken in the following paragraphs. Third, the scope for interpreting our findings is narrow. A decline in IIT levels is likely, but not certain, to reflect a process of industrial concentration. In terms of welfare and policy, the most important question is where such concentration occurs. This issue will be dealt with in Section III.
Technology
A widely discussed though empirically elusive aspect of external scale economies are technological spillovers among firms producing sophisticated innovative products.5 If there were strong forces for the geographic clustering of high-technology industries, observed IIT in these sectors would be relatively low.
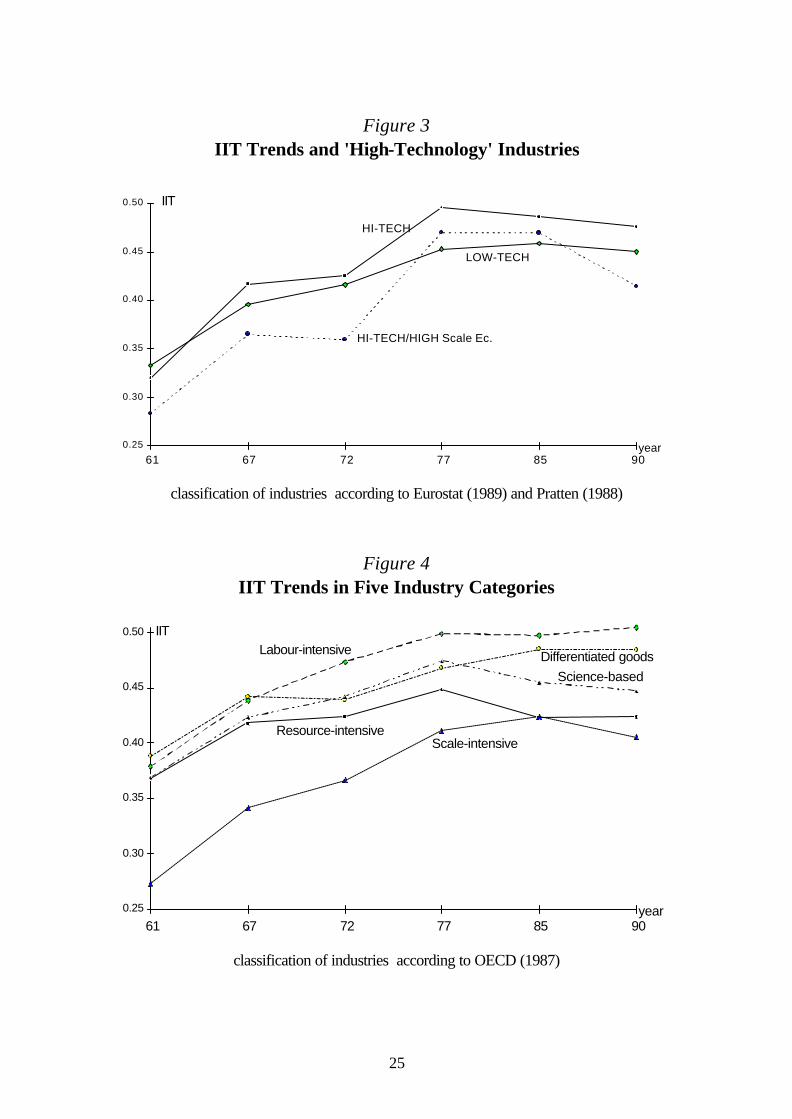
We have tested this proposition, by identifying 13 out of our 98 sample
industries as "hi-tech", following the classification suggested in Eurostat (1989), which earmarks these sectors based on the criterion of R&D intensities. Figure 3 reports the average IIT levels for both categories, as well as the IIT average for the four industries which belong to the high-tech category and are subject to scale economies (category HIGH).
The results illustrated in Figure 3 do not conform to expectations based
on theories predicting a locational clustering of high-technology industries. Indeed, average intra-EU IIT in high-tech products has been higher than the overall mean for most of our sample period, which indicates above-average geographic dispersion of these sectors. Only where advanced technology and high internal scale economies interact do the expected IIT patterns emerge. A detailed interpretation of these results, however, is pointless, since none of the differences in IIT means is statistically significant (ANOVA). This analysis therefore suggests no systematically different intra-EU patterns of IIT for high-tech industries.6
5For an extensive review see Dosi et al. (1988). 6Our results confirm doubts over the importance of technological spillovers for industrial
concentration voiced by Krugman (1991). At the same time, his caveat with regard to empirical studies also applies to this analysis: "The fact that the classification scheme is (...) antiquated means that quite small traditional industries still rate their own three-digit codes, while advanced sectors are buried in meaningless aggregates" (Krugman (1991, p. 59). Note that our IIT data set is classified

8
Other Industry Characteristics
Instead of categorising sectors according to a single aspect of the production process, researchers at the OECD (1987, p. 272ff.) have grouped all manufacturing industries "on the basis of the primary factors affecting the competitive process in each activity". Five categories are distinguished: 1. "Resource-intensive" industries, where the main competitive factor is "access
to abundant natural resources" (11 product groups of our sample), 2. "Labour-intensive" industries, where the main competitive factor is labour
costs (22 product groups), 3. "Scale-intensive" industries, where the main competitive factor is the "length
of production runs" (35 product groups), 4. "Differentiated goods", where the main competitive factor is "tailoring
products to highly varied demand characteristics" (13 product groups), and 5. "Science-based" industries, where the main competitive factor is "rapid
application of scientific advance" (17 product groups). This categorisation does not overlap perfectly with the commodity categories applied above, but the similarities are reassuring. Twelve of the 13 Eurostat (1989) "high-tech" industries are also part of the OECD's "science-based" product category, and of the OECD's 35 "scale intensive" industries, 30 belong to the HIGH and INTERMEDIATE categories of our classification based on Pratten (1988).
Figure 4 reports the calculated intra-EU IIT averages for the five industry
categories. These results are in line with our previous findings. First, they confirm the below-average levels of IIT in the industries characterised by high scale economies, as well as the IIT growth reversal. All six IIT averages of the "scale-intensive" category are significantly different from the total sample mean (ANOVA, see Table 1). Second, high-technology industries again do not appear to exhibit any particular IIT patterns; the divergence between the category averages and the total sample mean are statistically insignificant in all six years.
No significantly different IIT levels are detected for the "resource-
intensive" and "differentiated" categories either. The IIT means in the "labour-intensive" category, however, lie above the average for total manufacturing
according to SITC Revision 1, where mechanical typewriters are assigned to the same 3-digit group as desktop computers, and video recorders share a product group with harpsichords.

9
throughout the period of our investigation. These differences are statistically significant in all sample years except for 1985.
Our grouped analysis of intra-EU IIT has cast doubts on two dominant
aspects of conventional wisdom with regard to IIT, namely on the assumption that there is a positive relationship between the intensity of scale economies and IIT and that IIT is lower, the more production costs depends on the availability of factors such as (unskilled) labour. This rather strong result is qualified by inevitable difficulties of measurement and classification.
II Intra-Industry Trade and Industrial Location The low and stagnating levels of IIT in sectors subject to high scale
economies might reflect a centripetal process of industrial concentration as suggested by the "new economic geography", while high and growing IIT in labour-intensive sectors could result from a process of industrial dispersion in these industries. Furthermore, the absence of significantly distinct IIT patterns in the high-technology sectors might suggest that these industries are not, as some authors concerned with the economic fate of peripheral regions have feared, concentrating in Europe's economic core.7
To investigate these aspects we no longer look at IIT averages over all EU
countries, but we consider intra-EU IIT levels for each member state separately, relating them to the country's relative location in terms of economic geography.
Centrality and Peripherality of EU Countries
If we want to analyse the trade patterns of countries in terms of their location relative to the economic core regions, each country has to be assigned some coefficient value indicating its accessibility. This evidently has to be a somewhat arbitrary procedure, since the factors determining economic distance are different for various industries, and since regions within one country can vary considerably in terms of economic distance from the market core. Nevertheless, it does seem plausible even among the EU countries that
7see, for instance, O'Donnell (1992).

10
significant and systematic differences in terms of geographical market access exist.
The accessibility of 166 EU regions has been evaluated by Keeble et al.
(1986) using the following centrality index8:
PY
DYDi
j
ijj
i
ii
= +∑ ; i j≠ , (1)
where i is the relevant region, j stands for all other EU regions, Yi,j is 1983 regional gross domestic product, Dij measures the shortest road distance9 between the largest settlements in regions i and j, and Dii, the "intra-regional distance cost", is defined as "one-third of the radius of a circle of the same area as region i". We have aggregated these indices for the 12 EU countries, weighting them by 1983 regional population.10 The calculated values are listed in Table 2.
Intra-Industry Trade and Centrality
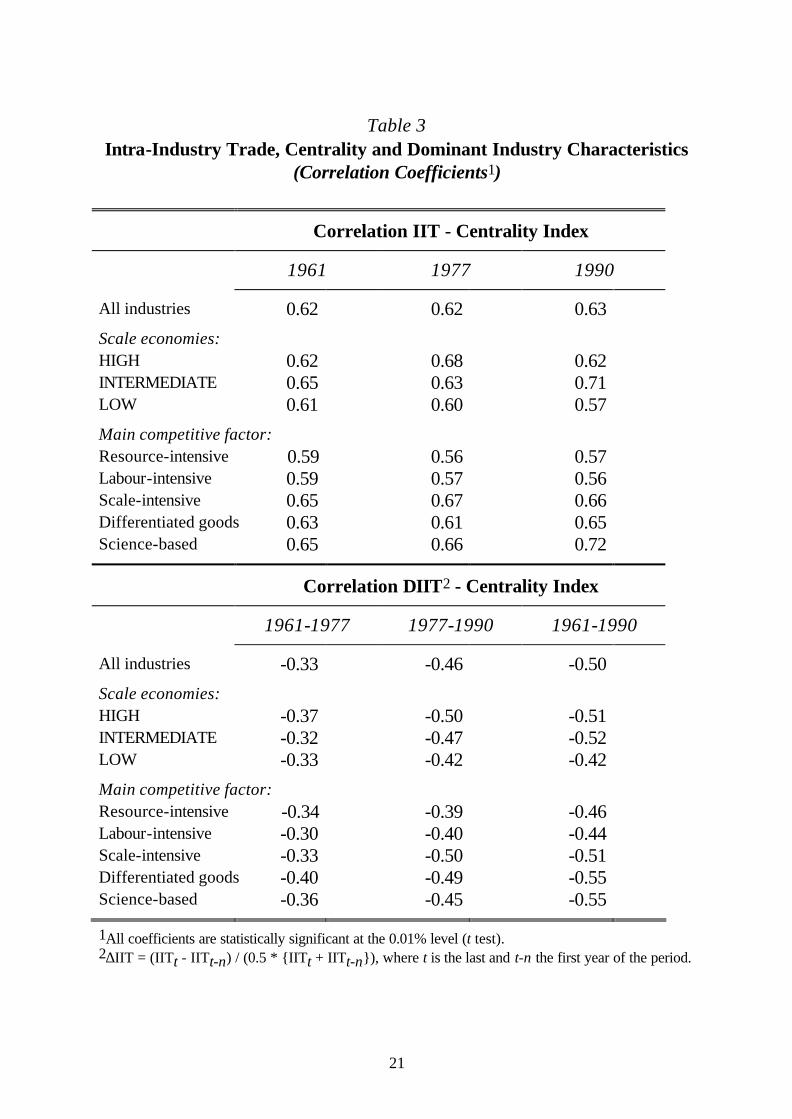
The centrality indices were combined with the IIT data set in order to test whether any centre-periphery gradients underlie the IIT patterns described in Section I. We have computed correlation coefficients between, on one hand, the values of the centrality index, and, on the other hand, IIT and changes in IIT. This exercise was conducted for all manufacturing industries as well as separately for each of the categories based on the Pratten (1988) and OECD (1987) classifications. The results are reported in Table 3.
The positive relationship between centrality and IIT, detected in many
previous studies, emerges clearly from the coefficients reported in the top half of Table 3. Central EU countries tend to exhibit considerably higher levels of IIT than peripheral countries. Calculated for the entire set of manufacturing sectors, this relationship has remained roughly stable between 1961 and 1990.
8Keeble et al. (1986) have referred to this coefficient as the "peripherality index". Since this
measure relates negatively to the peripherality of a region, we term it "centrality index" for clarity. 9Where regions are separated by water, weighted values of ferry costs were applied. 10Since we apply the same centrality indices to a number of years spanning a period of three
decades, it might be argued that the analysis is invalid because it does not take account of shifts in relative peripherality. However, there are strong indications that the relative peripherality of European regions has remained remarkably stable. Begg and Mayes (1994) have reported centrality indices of the EU regions for 1977, 1983, 1985, 1989 and 1990, and they detected only marginal changes over time.

11
While the absolute levels of the coefficients for different manufacturing sub-categories cannot be compared, because they are based on samples of unequal sizes, the changes in these indices over time provide some scope for interpretation. It appears that the correlation in the LOW group declined slightly. On the other hand, the indices for the HIGH and INTERMEDIATE categories show increasing tendencies. This pattern might indicate that the periphery's employment shares in LOW industries approached the levels of central countries, while the centre-periphery gradient steepened in sectors with more important scale economies.
In 1990, IIT was still higher in central countries than at the EU periphery,
but the gap had narrowed since 1961. This is the main message conveyed by the correlation coefficients reported in the lower part of Table 3. Consistently negative and statistically significant coefficients mean that IIT generally increased more (or decreased less) where the centrality index was low. This finding could reflect a process of industrial dispersion towards the periphery leading to an increase in IIT of peripheral countries, as their trade in originally net importing sectors became gradually more balanced.
Rising IIT at the periphery, however, does not necessarily signify a shift
from deficit to balanced sectoral trade. It can also reflect a narrowing of sectoral trade surpluses, and the reverse evidently applies to falling IIT (at the core). Hence, there is no straightforward interpretation of the correlations reported in the lower half of Table 3. Take, for instance, the strongly negative relationship between ∆IIT and the centrality index in the HIGH category. This indicates that the growth (decline) in IIT was more (less) pronounced at the periphery than in the central countries. Intuitively, one might conclude that this reflects a catching-up of the periphery in industries subject to high scale economies, thus reducing their sectoral trade deficits. However, the negative correlation coefficient could also reflect the exact opposite pattern, where industrial concentration of the HIGH category in the economic core regions further increased. In this scenario, sectoral trade surpluses of the central countries widen, IIT falls, and, given a not-too-rapid decline of IIT at the periphery, the correlation index turns out negative. It is this indeterminacy in the interpretation of IIT changes which has led to the development of certain measures of marginal IIT.11 Unfortunately, we do not avail of a comprehensive set of such data for the EU, hence we cannot
11The measure of interest in this context would be the B index developed in Brülhart (1994).

12
resolve the ambiguity left by the analysis of IIT changes without referring to production figures.
Even if we did avail of marginal IIT indices, however, it would still be
useful to test the validity of the locational inferences derived from trade flows on results derived from the study of production patterns. The simple reason for this is that changes in a country's production structure do not necessarily result in equiproportional shifts in its external trade flows. The popular research strategy of drawing conclusions on industrial adjustment and specialisation from the study of trade is based in many cases on data constraints rather than on methodological preference. We now reverse this methodology and undertake a study of industrial employment patterns in the EU in view of guiding the interpretation of our trade analysis.
III The Spatial Distribution of Industrial Employment in the EU The relative scarcity of production and employment figures compared to
the detailed coverage of trade statistics forces us to conduct the locational analysis at a considerably higher level of statistical aggregation. In most of what follows, we distinguish between only 18 NACE 2-digit industries. Similar to our IIT analysis, we shall first investigate overall specialisation patterns, and, in a second step, describe the centre-periphery structures.
Industry Concentration
In order to capture the degree of concentration or dispersion of EU industrial sectors, we have calculated "locational Gini indices" measuring the locational structure of manufacturing employment, as suggested by Krugman (1991). These indices can take values between 0 and 1. The higher the Gini index, the stronger is the locational divergence between the particular industry and manufacturing overall. A high Gini index thus suggests a high degree of inter-industry specialisation. Where the Gini index is (close to) zero, a sector is not localised, but spread out in line with total manufacturing employment. The latter situation could reflect both intra-industry specialisation, where countries exchange different varieties of similar products, or it could occur in non-traded
13
sectors, where the same industry exists in each country to serve its home market.12
Table 4 reports locational Gini indices for the distribution of 18 industries
among 11 EU countries. One result to note is that, in line with the predictions of Hufbauer and Chilas (1974), industrial specialisation in Europe appears to have increased significantly during the 1980s. First, total manufacturing employment has become more concentrated, relative to the distribution of population among the EU member states. This can be verified in the last row of Table 4, which shows a 21% increase of the Gini index for overall manufacturing between 1980 and 1990. Second, within total manufacturing the indices suggest a considerable amount of inter-industry specialisation, since the Gini index increased in 14 out of our 18 sectors.
Having observed that, in the 1980s, aggregate EU manufacturing has
become increasingly localised, it is interesting to analyse how this general tendency is reflected in the specialisation patterns of individual industries. At the top of the list of Table 4 (which is in decreasing order of the percentage change in Gini coefficients) appear three related sectors: textiles, clothing and footwear, and leather goods. These industries appear at the bottom of the industry ranking by economies of scale in Pratten (1988), and are attributed in OECD (1987) to the "labour-intensive" (textiles, clothing) and "resource-intensive" (leather goods) categories. In the 1980s, the most powerful force for industrial specialisation in the EU thus seems to have been the "classical" exploitation of lower factor costs. However, Table 4 also suggests that scale economies have driven some of the increased specialisation. The industries with highest potential scale economies according to Pratten (1988), namely motor vehicles, other vehicles, and chemicals, appear in the top half of our list, all displaying above-average increases in localisation. No clear impact of high technological requirements emerges once again. According to both OECD (1987) and Eurostat (1989), typical high-tech sectors are chemicals, data processing and instrument engineering. There are wide differences in the localisation of these industries. For instance, while localisation of the chemicals sector increased
12The calculation of locational Gini indices is described by Krugman (1991b, pp. 55 ff.).

14
quite considerably, the employment pattern in the instrument engineering sector dispersed slightly.13
If we consider absolute levels of the Gini indices instead of their change
over time, a quite different picture emerges. All high-technology sectors are among the most localised. The industries characterised by high scale economies also figure in the top half of an industry ranking by Gini index. The three sectors with the most significant increases in localisation (textiles, clothing, leather), however, were still among the most dispersed industries by 1990.
Columns (1) and (2) of Table 4 show that the three particularly factor-
sensitive industries at the top of the list accounted for a declining share of EU manufacturing employment (12,4% in 1980, 10.5% in 1990). The three typically scale-sensitive industries account for a roughly stable proportion of manufacturing employment (19.2% in 1980, 19.5% in 1990), while the three high-tech sectors expanded their share of EU manufacturing jobs from 9.4% in 1980 to 10.5% in 1990.
The story suggested by these summary calculations is that much of the
scale and technology driven localisation process in the EU has already taken place, while specialisation induced by factor endowments is only starting to gather steam. Interestingly, the locational Gini indices calculated for the United States by Krugman (1991) present a starkly different picture: "The thing that leaps out from the table is not the localization of high technology industries, but the cluster of textile-related industries".14 After its long history as an economically integrated area, the American economy has produced some highly localised sectors. Apart from some well-known industry clusters such as aircraft in Seattle and silicon valley in California, the group of most highly localised industries consists of many traditional labour and resource intensive sectors
13It should be remembered that our data are highly aggregated, and that they might conceal
increased localisation of some more narrowly defined high-technology sectors. Furthermore, even if we availed of more disaggregate sectoral statistics, it might be near impossible to disentangle the different stages in the production process of multinational firms. If, say, a computer firm develops new software in its Italian plant and manufactures blank diskettes in its French subsidiary, the employment in both plants is likely to enter the same statistical category, even though the former is evidently more knowledge intensive.
14Krugman (1991, p. 58). No indication is made of the year for which the Gini indices were computed, but, given the date of the publication, it seems plausible to assume that the U.S. data refer to a year in the second half of the 1980s.

15
such as carpets, hats, handbags and jewellery. If the American experience is a suitable yardstick, a considerable amount of further inter-industry specialisation has to be expected in the EU; not in the high-technology and increasing-returns industries, but in traditional sectors where factor endowments dominate the localisation process.
Industry Location and Centrality
Having investigated the general specialisation patterns in the EU, we now analyse the centre-periphery dimension of these findings. Some preliminary comments in this respect can be derived from Table 4. Columns (5) and (6) list the countries which are specialised most and least strongly in the particular sectors, compared to the other EU countries. The last row of Table 4 shows that, in terms of overall manufacturing employment, Germany, at the EU's economic core, is most strongly specialised, whereas the population share of manufacturing employment is smallest in Greece, the Union's most peripheral member. On the other hand, the industries where localisation has increased most over our sample period are sectors which are most important for relatively peripheral countries (Portugal, Italy).
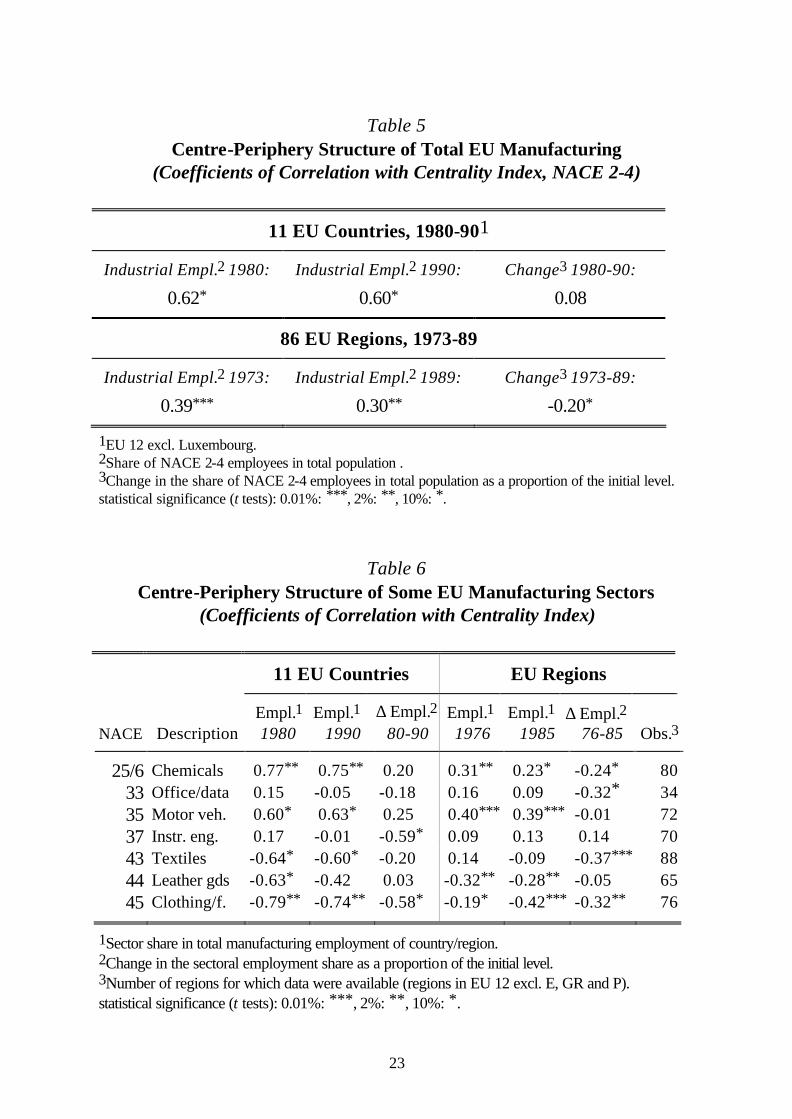
The results of a somewhat more sophisticated analysis of the aggregate
industrial centre-periphery pattern are reported in Table 5. The upper part of the table contains coefficients of correlation between, on the one hand, total manufacturing employment by country, and, on the other hand, the centrality indices of Table 2, both for 1980 and for 1990. As expected, the share of population engaged in manufacturing employment is positively related to a country's centrality. No significant relationship emerges between centrality and the change in the relative sizes of manufacturing sectors in the 11 countries.
However, entire countries are ill-suited locational units on which to base
our analysis. First, they are few in number, so that they provide us with a very limited set of observations, and second, they differ greatly in size and structure, so that it must be assumed that intra-country differences in economic accessibility in many instances exceed inter-country differentials. We have therefore supplemented our analysis by calculations on a regional data set. No regional employment figures were available for the EU's southern periphery - Greece, Portugal and Spain - and the numbers of regions covered within the remaining sample of 9 EU countries varied considerably among industrial

16
sectors. Regional centrality indices could be taken straight from Keeble et al. (1986).
Regional correlation indices for employment shares of total manufacturing
are reported in the lower part of Table 5. (Note that the regional calculations for 1973 and 1989 cover a wider time span than the computations based on country data.) The regional correlation indices confirm the finding that manufacturing employment is concentrated in the central EU areas. In addition, the analysis of regional data suggests that the degree of this concentration has diminished since 1973. The intensity of the positive correlation was significantly lower in 1989, and the correlation between changes in the share of industrial employment and the centrality index was negative. Hence, the gap in the size of regional manufacturing sectors between the core and the periphery appears to have narrowed. This result does not contradict the finding of increased localisation of aggregate industry, reported in the bottom row of Table 4. Apart from the fact that different time periods are covered, the results can be perfectly compatible, since increased localisation does not have to be concentrated at either pole of the centre-periphery spectrum.15 It thus seems that, while inter-industry specialisation continues, the centre-periphery distinction is losing some of its importance for the location of manufacturing activity.
We have also investigated the centre-periphery structure of EU
manufacturing at a sectoral level, again using data for NACE 2-digit industries. Table 6 lists the correlations computed for 7 of the 18 sectors both at the level of countries and of regions. For reasons of data availability, the regional analysis was conducted for the years 1976 and 1985.
Comparing Table 6 with Table 4, we find three broad types of industries.
The first type is highly localised (high Gini) and concentrated at the EU's core (strong positive correlation). This configuration applies to the chemicals and the
15As an illustrating example, imagine a world of three regions, P (Periphery), I (Intermediate)
and C (Core), and three economic sectors, m (Manufacturing), s (Services) and a (Agriculture). Each region has the same population and income, and the distance separating I and P is equal to the distance between I and C. In the initial year, there is some m in all three regions, but (m/{m+s+a})C > (m/{m+s+a})I > (m/{m+s+a})P. The initial Gini index is thus relatively low, and the correlation between centrality and the share of manufacturing is high. If, by the time of the final year, P has specialised entirely in a, I has concentrated exclusively on m, and C provides only s, then the locational Gini index will have increased to the maximum value of 1, while the correlation index between industry share and centrality will have fallen to zero.
17
motor vehicles sectors - both are typically scale-sensitive industries. A second type of industry is relatively dispersed (low Gini) but represents a significantly higher share of total manufacturing employment in peripheral regions (strong negative correlation). The textile-related industries fit into this category.16 Third, there appears to be a type of sector which is highly localised (high Gini) but is not clustered at either the centre or the periphery (weak correlation). This pattern applies to the sectors office and data processing, and instrument engineering, which are both attributed to the high-technology category.
If we look at the changes in the centre-periphery structure of
manufacturing sectors, Table 6 lends support to the conclusion that the locational centre-periphery gradient in the EU is diminishing. In most industries of our sample, the absolute value of the correlation coefficient fell, and most correlation coefficients between the centrality index and changes in the sectoral employment share are negative. The results of Table 6 do not suggest a further concentration in the central regions of the increasing-returns industries, which are already highly clustered at the EU core. They do, however, indicate a further concentration of activities in the textile-related industries at the periphery. For the high-tech sectors, there is some indication of a dispersion towards the periphery.
16No significant correlation coefficients emerge for the employment share in the textile
industry at a regional level (Table 6). It has to be suspected that a strongly negative coefficients would result, if we availed of the regional figures for the missing countries Greece, Portugal and Spain.

18
Conclusion The countries of the European Union provide an interesting case study
against which to compare the stylised results of the "new" theories. Our main findings can be related to the four generalisations of the "new" models of trade and economic geography (in italics): 1. Internal scale economies relate positively to localisation and negatively to
IIT. This paper finds that EU industries characterised by strong internal scale economies are highly localised and have low intra-industry trade.
2. Regionally contained externalities from technological spillovers relate positively to localisation and negatively to IIT. High-tech industries in the EU are highly localised, but no particular pattern of intra-industry trade emerges.
3. Integration exacerbates the concentration of increasing-returns sectors near the largest markets. It is found that sectors subject to strong internal scale economies have concentrated increasingly at the geographical core of the EU, starting from an already high degree of localisation. The growth reversal of intra-industry trade was particularly pronounced in these industries. However, there is some evidence that high-tech industries disperse towards the periphery rather than clustering at the core.
4. Sensitivity to factor costs can result in industrial dispersion and high IIT. Labour-intensive industries are found to be relatively dispersed over the area of the EU. They also display high levels of intra-industry trade. Yet, it is in these sectors that the strongest tendency towards localisation is detected, as labour-intensive activities are concentrating at the EU periphery.
The empirical analysis thus confirmed that, in spite of their high degree of
abstraction, the "new" theories are relevant. However, the typical increasing-returns sectors are not where most of the action is likely to take place over the future course of European integration. This study finds that, over the last decade, it was the labour-cost sensitive industries which experienced the most pronounced process of industrial re-location. Since, overall, these are relatively declining sectors, the detected re-location must reflect particularly high job losses at the EU core. The increase in localisation, however, started from relatively low levels, so that geographical concentration of these sectors was still below average in 1990. It seems plausible to assume that this observation explains to some extent why increased localisation of production has not yet led to a decrease of IIT in the labour-cost sensitive sectors. There appears to

19
remain much scope for specialisation driven by input costs and input requirements, so that inter-industry trade seems poised to re-emerge in these sectors. This scenario would gain particular relevance if the EU were to extend its internal trading regime to some of its Eastern neighbours.
In 1974, Hufbauer and Chilas had already detected considerable potential
for inter-industry specialisation. Their prediction was partly validated by the fact that industrial specialisation in the EU, measured by locational Gini indices, rose in the 1980s. However, this process fed through to trade statistics in a very diluted form. The growth of manufacturing IIT among EU countries stagnated in the 1980s. Some sectors and countries did exhibit clearly decreasing IIT trends, but it would be premature to diagnose a generalised and irreversible IIT turnaround.
It must be kept in mind that our empirical findings are subject to inevitable
statistical limitations. The industry definitions underlying our trade and employment data are much broader than the theoretical concept of a horizontally diversified industry. This caveat applies particularly to the employment figures. Furthermore, time and geographical coverage differs for the various part of our analysis. Another difficulty encountered in our empirical study is the limited usefulness of traditional IIT indices for the analysis of changes in specialisation over time. It would thus be desirable to complete this study in due course by a more disaggregated investigation of sectoral employment patterns and by an analysis of marginal IIT.
In conclusion, this paper found that, in the EU, increasing-returns
industries tend to be highly concentrated relative to sectors more sensitive to factor conditions. There appears to remain some scope for further localisation of the latter industries. The strongest driving forces for future industrial specialisation, therefore, are likely to be "classical" factor-cost considerations, and not the exploitation of scale economies emphasised by the "new" theories.

20
Table 1 ANOVA F-Ratios Underlying Figure 4
Industry Categories 1961 1967 1972 1977 1985 1990
Resource-intensive 1.6 0.4 0.0 0.1 1.9 1.2 Labour-intensive 6.6* 4.8* 8.0** 4.1* 3.4 8.5** Scale-intensive 21.0** 22.3** 13.8** 11.8** 8.4** 15.9** Differentiated goods 4.9* 2.9 0.6 0.1 0.7 1.5 Science-based 2.4 1.2 0.9 1.0 0.7 0.4 ALL 7.4** 5.7** 4.2** 2.9* 2.8* 5.2**
**significant at the 1% level, *significant at the 5% level.
Table 2 Peripherality Indices for EU Countries
Rank Country Index Value Rank Country Index Value
1 Belgium 10,252 7 Italy 5,873 2 Netherlands 9,805 8 Denmark 4,721 3 West Germany 9,546 9 Ireland 3,617 4 United Kingdom 8,931 10 Spain 3,522 5 France 8,000 11 Portugal 2,648 6 Luxembourg 7,857 12 Greece 2,293
21
Table 3 Intra-Industry Trade, Centrality and Dominant Industry Characteristics
(Correlation Coefficients1)
Correlation IIT - Centrality Index
1961 1977 1990
All industries 0.62 0.62 0.63
Scale economies: HIGH 0.62 0.68 0.62 INTERMEDIATE 0.65 0.63 0.71 LOW 0.61 0.60 0.57
Main competitive factor: Resource-intensive 0.59 0.56 0.57 Labour-intensive 0.59 0.57 0.56 Scale-intensive 0.65 0.67 0.66 Differentiated goods 0.63 0.61 0.65 Science-based 0.65 0.66 0.72
Correlation ∆IIT2 - Centrality Index
1961-1977 1977-1990 1961-1990
All industries -0.33 -0.46 -0.50
Scale economies: HIGH -0.37 -0.50 -0.51 INTERMEDIATE -0.32 -0.47 -0.52 LOW -0.33 -0.42 -0.42
Main competitive factor: Resource-intensive -0.34 -0.39 -0.46 Labour-intensive -0.30 -0.40 -0.44 Scale-intensive -0.33 -0.50 -0.51 Differentiated goods -0.40 -0.49 -0.55 Science-based -0.36 -0.45 -0.55
1All coefficients are statistically significant at the 0.01% level (t test). 2∆IIT = (IITt - IITt-n) / (0.5 * {IITt + IITt-n}), where t is the last and t-n the first year of the period.

22
Table 4
Dispersion of Industrial Employment in the EU, 1980 and 1990
NACE Industry Description
Employment Share (%)
Locational Gini Coefficients
Speciali-sation1
(1) (2) (3) (4) (5) (6) (7) 1980 1990 1980 1990 1980-90
(%change) Highest (1990)
Lowest (1990)
43 Textiles 6.2 4.9 0.106 0.170 60 P NL 45 Clothing/footw. 5.7 5.1 0.096 0.148 54 P NL 44 Leather goods 0.5 0.5 0.150 0.212 42 I DK 48 Rubber/plastics 4.0 4.9 0.174 0.226 29 F P
25/6 Chemicals 7.2 7.8 0.178 0.230 29 NL P 22 Metals 5.4 3.6 0.188 0.242 29 B IRL 35 Motor vehicles 8.2 8.3 0.270 0.344 28 D GR 34 Electr. engin. 11.2 12.0 0.254 0.316 25 D GR 36 Other transp. eq. 3.8 3.4 0.238 0.288 21 UK IRL 24 N.-metal. miner. 5.0 4.5 0.100 0.122 20 P D 31 Misc. metal art. 9.3 9.6 0.192 0.228 19 E IRL 32 Mech. engin. 10.2 10.5 0.320 0.370 15 DK GR 33 Office/data proc. 0.8 1.2 0.312 0.328 5 IRL P 49 Misc. manufact. 1.1 1.1 0.194 0.198 2 DK P 46 Timber/furniture 4.2 4.1 0.206 0.202 -2 E IRL 37 Instrum. engin. 1.4 1.5 0.402 0.392 -3 IRL GR 47 Paper/printing 5.8 6.5 0.208 0.192 -7 NL D
41/2 Food/drink/toba. 10.0 10.6 0.176 0.162 -8 IRL D
ALL 100.0 100.0 0.156 0.188 21 D2 GR2 1Specialisation ratio = ({ / } / { / })E E E Eij ij
jij
iij
ji∑ ∑ ∑∑ , where Eij denotes employment in the
manufacturing sector i of EU country j. 2Based on the ratio between the share in EU manufacturing employment and the share in EU population.
23
Table 5 Centre-Periphery Structure of Total EU Manufacturing
(Coefficients of Correlation with Centrality Index, NACE 2-4)
11 EU Countries, 1980-901
Industrial Empl.2 1980: Industrial Empl.2 1990: Change3 1980-90:
0.62* 0.60* 0.08
86 EU Regions, 1973-89
Industrial Empl.2 1973: Industrial Empl.2 1989: Change3 1973-89:
0.39*** 0.30** -0.20*
1EU 12 excl. Luxembourg. 2Share of NACE 2-4 employees in total population . 3Change in the share of NACE 2-4 employees in total population as a proportion of the initial level. statistical significance (t tests): 0.01%: ***, 2%: **, 10%: *.
Table 6 Centre-Periphery Structure of Some EU Manufacturing Sectors
(Coefficients of Correlation with Centrality Index)
11 EU Countries EU Regions
Empl.1 Empl.1 ∆ Empl.2 Empl.1 Empl.1 ∆ Empl.2 NACE Description 1980 1990 80-90 1976 1985 76-85 Obs.3
25/6 Chemicals 0.77** 0.75** 0.20 0.31** 0.23* -0.24* 80 33 Office/data 0.15 -0.05 -0.18 0.16 0.09 -0.32* 34 35 Motor veh. 0.60* 0.63* 0.25 0.40*** 0.39*** -0.01 72 37 Instr. eng. 0.17 -0.01 -0.59* 0.09 0.13 0.14 70 43 Textiles -0.64* -0.60* -0.20 0.14 -0.09 -0.37*** 88 44 Leather gds -0.63* -0.42 0.03 -0.32** -0.28** -0.05 65 45 Clothing/f. -0.79** -0.74** -0.58* -0.19* -0.42*** -0.32** 76
1Sector share in total manufacturing employment of country/region. 2Change in the sectoral employment share as a proportion of the initial level. 3Number of regions for which data were available (regions in EU 12 excl. E, GR and P). statistical significance (t tests): 0.01%: ***, 2%: **, 10%: *.

24
Figure 1 Intra-EU IIT in Manufactured Goods, 1961-1990
0.35
0.40
0.45
0.50
0.55
0.60
0.65
0.70
61 67 72 77 85 90
EU 12
Italy
United Kingdom
FranceIIT
year
calculated from SITC 4-digit (1961, 67) and 5-digit (1972, 77, 85, 90) trade data (unweighted averages of 4/5-digit figures aggregated to SITC Rev. 1 3-digit level,
see Appendix)
Figure 2 IIT Trends and the Importance of Scale Economies
0.30
0.35
0.40
0.45
0.50
61 67 72 77 85 90
IIT
year
LOW
All
INTERMEDIATE
HIGH
classification of industries according to Pratten (1988)
25
Figure 3 IIT Trends and 'High-Technology' Industries
0.25
0.30
0.35
0.40
0.45
0.50
61 67 72 77 85 90
HI-TECH/HIGH Scale Ec.
HI-TECH
LOW-TECH
IIT
year
classification of industries according to Eurostat (1989) and Pratten (1988)
Figure 4 IIT Trends in Five Industry Categories
0.25
0.30
0.35
0.40
0.45
0.50
61 67 72 77 85 90
Scale-intensiveResource-intensive
Labour-intensive Differentiated goodsScience-based
IIT
year
classification of industries according to OECD (1987)

26
Appendix: Data Sources and Transformations The main statistical source for our empirical analysis is the IIT database created
by the participants of the SPES research network on "Trade, Specialisation and Market Structure in the EC" between 1992 and 1994. This database contains unadjusted Grubel-Lloyd indices for 11 EU countries (Belgium and Luxembourg form one trading entity). The indices are calculated separately for total, intra-EU and non-EU trade for the years 1961, 1967, 1972, 1977, 1985 and 1990. The distinctive feature of these indices compared to previous research results is that they are calculated from highly disaggregated trade data, namely SITC 4-digit figures for 1961 and 1967 and SITC 5-digit figures for 1972 to 1990. The underlying trade statistics were provided by the OECD.
In the SPES database, the IIT indices are aggregated to and reported at the SITC 3-
digit level. Since the SITC product classification was revised twice over the period covered in our study, we re-arranged all the SPES indices into SITC Revision 1 product groups, based on United Nations concordance tables, so that changes in the IIT indices over time could be investigated industry by industry. Since this paper is concerned with the manufacturing sector, we retained only the indices pertaining to SITC Sections 5 to 8. Thus an IIT data set for intra-EU trade in 98 industries was compiled.
In Figure 1, the trade-weighted averages for France, Italy and the United
Kingdom are based on summary IIT indices for SITC 5-8 as calculated by the SPES researchers. The EU average is the unweighted mean of the indices calculated for the 11 sample countries.
In order to calculate the results reported in Figure 2, four of the 98 industries of
our data set had to be eliminated, because they could not be allocated to any of the three categories of scale economies. The eliminated industries are (SITC Group in brackets): Fur Skins (613), Pearls and Precious Stones (667), Developed Cinematographic Film (863) and Works of Art (896). The categories are based on the "Ranking of Manufacturing Industry Groups by Economies of Scale" in Pratten (1988, p. 2-70). Our HIGH category contains the first four of the 20 industries in Pratten's table (Motor Vehicles, Other Vehicles, Chemicals and Man-Made Fibres). Our INTERMEDIATE category consists of the sectors ranked 5 to 9 (Metals, Office Machinery, Mechanical Engineering, Electrical Engineering and Instrument Engineering). The remaining 11 industries are attributed to the LOW category. Since the industries in Pratten's table are based on the NACE classification, they had to be identified among our SITC sectors using a NACE-SITC concordance table. An analysis of variance on the null hypothesis that the differences between the three category averages reported in Table 6.2 are random yielded the following F-ratios: 13.1 (1961), 10.0 (1967), 7.5 (1972) 2.9 (1977), 2.0 (1985) and 5.3 (1990). The relevant critical values are 3.1 (5% level) and 4.9 (1% level).

27
The high-tech industries underlying the analysis of Figure 3 are listed in Eurostat (1988, pp. 107ff.) according to SITC Rev. 2 5-digit product headings. Based on this list, we identified the following 13 industries of our IIT data set as high-tech sectors (SITC Group in brackets): Radioactive Materials (515), Medicinal and Pharmaceutical Products (541), Plastic Materials (581), Chemical Materials n.e.s. (599), Non-Electric Power Generating Machinery (711), Office Machines (714), Electric Power Machinery and Switch Gear (722), Telecommunications Apparatus (724), Electro-Medical and Radiological Apparatus (726), Other Electrical Machinery and Apparatus (729), Aircraft (734), Scientific Instruments and Apparatus (861), and Watches and Clocks (864). The four sectors which belong both to this set of hi-tech industries and to the HIGH category of scale economies are SITC Groups 515, 541, 599 and 734. An analysis of variance on the null hypothesis that the differences between the high-tech and the "low-tech" category averages reported in Figure 3 are random yielded the following F-ratios: 0.2 (1961), 0.5 (1967), 0.1 (1972) 1.9 (1977), 0.8 (1985) and 0.8 (1990). The relevant critical value at the 5% confidence level is 3.9.
Underlying Figure 4 is the classification in ISIC 2-digit and 3-digit product
groups compiled by the OECD (1987, p. 283). The results of our analysis of variance on the calculated category means are reported in Table 1.
The centrality indices listed in Table 2 are calculated from the regional indices
reported by Keeble et al. (1986, pp. 29ff.). We chose the indices adjusted by the authors for purchasing-power parity exchange rates and aggregated them over countries, weighting the indices by 1983 regional population taken from Eurostat regional statistics.
For the correlation analysis reported in Table 3, five of the 98 industries were
dropped from the original IIT data set. These were the four sectors which could not be attributed to any of the three categories based on Pratten (1988) as well as SITC Group 515 (Radioactive Materials), for which the country coverage of our IIT data set is very patchy. Thus, the reported correlations are based on 930 observations (93 industries, 10 countries) for each of the three sample years.
The employment figures for the 18 NACE sectors underlying the results of
Table 4 were taken from Eurostat's annual industrial structure statistics. Gaps in these data were filled with estimates based largely on industry statistics published by the OECD. Sectoral employment figures could be compiled for 11 EU countries. Not enough data were available for Luxembourg.
The same statistical sources apply to the correlation coefficients reported in the
upper half of Table 5, where sectoral employment figures are summed for each countries, and the correlations thus relate to only 11 observations. The results listed in the lower half of Table 5 and in Table 6 are calculated from regional employment figures published as part of Eurostat's regional statistics.

28
References
Begg, Iain and Mayes, David (1994) "The Implications of Peripherality for Northern Ireland". Northern Ireland Economic Council, Report 111, Belfast.
Ben-David, Dan (1993) "Equalizing Exchange: Trade Liberalization and Income Convergence". Quarterly Journal of Economics, vol. 108, pp. 653-679.
Brülhart, Marius (1994) "Marginal Intra-Industry Trade: Measurement and Relevance for the Pattern of Industrial Adjustment". Weltwirtschaftliches Archiv, vol. 130, pp. 600-613.
Brülhart, Marius (1995) "Scale Economies, Intra-Industry Trade and Industry Location in the 'New Trade Theory'", Trinity Economic Papers, No. 95/4, Trinity College, Dublin.
Dosi, G., Pavitt, K. and Soete, L. (1988) The Economics of Technological Change and International Trade. Harvester Wheatsheaf, London.
Eurostat (1989) Statistical Analysis of Extra-EUR 12 Trade in Hi-Tech Products. Theme 6, Series D, Luxembourg.
Hufbauer, Gary C. and Chilas, John G. (1974) "Specialization by Industrial Countries: Extent and Consequences". In: Giersch, H. (ed.) The International Division of Labour. J.C.B. Mohr, Tübingen.
Keeble, David; Offord, John and Walker, Sheila (1986) Peripheral Regions in a Community of Twelve Member States. Commission of the European Communities, Luxembourg.
Krugman, Paul (1991b) Geography and Trade. Cambridge (Mass.), MIT Press.
Neven, Damien and Gouyette, Claudine (1995) "Regional Convergence in the European Community". Journal of Common Market Studies, vol. 33, pp. 47-65.
O'Donnell, Rory (1992) "Policy Requirements for Regional Balance in Economic and Monetary Union". In: Hannequart, A. (ed.) Economic and Social Cohesion in Europe, Routledge, London.
Organisation for Economic Co-operation and Development (1987) Structural Adjustment and Economic Performance. OECD, Paris.
Pratten, Cliff (1988) "A Survey of the Economies of Scale. In: Commission of the European Communities". Research on the "Cost of Non-Europe", Volume 2: Studies on the Economics of Integration, Luxembourg.

29
Ray, Edward John (1991) "U.S. Protection and Intra-Industry Trade: The Message to Developing Countries". Economic Development and Cultural Change, vol. 40, pp. 169-187.