industrial symbiosis, ecoefficiency, sustainability a case
TRANSCRIPT

DOI 10.1515/pesd-2015-0012 PESD, VOL. 9, no. 1, 2015
INDUSTRIAL SYMBIOSIS, ECOEFFICIENCY,
SUSTAINABILITY A CASE STUDY
Cristian Teodorescu1, Mirela Danubianu
2,
Key words: sustainability metrics, ecoefficiency index, industrial symbiosis.
Abstract In the last decade, international organizations have expressed their concern
about the capacity of classical economical indicators to encompass the whole story
of the developing processes, especially in their relationship with the environment. A
comprehensive environmental metrics has been adopted (states and organizations
reports indicators like greenhouse gas emissions, ozone concentrations, surface of
contaminated land, number of threatened species, etc.) and operates in parallel with
the traditional industrial indicators. But it seems not enough since this
complementary metrics does not illustrate the entire complexity of development
processes, in the 21st Century. Recent EU documents stress the importance of
sustainable development, of the importance of industrial symbiosis as a tool to better
manage material, energy and human resources and evaluate the possibility of
generating and reporting new, synthetic, composite indicators that could include
both the information in the classical economical indicators but also the
environmental impact and the quality of life.
The paper is a contribution in this respect and, starting from the results of the
implementation of the Industrial Symbiosis paradigm in the case of a power plant, it
presents how the EU recommendations about a more sophisticated metrics of
ecoefficiency works, for the first time at the level of a Romanian enterprise. An
original, new metrics is generated, that takes into account whether and how the
technological and economical processes are accompanied by a favourable trend for
the environment, A new, composite index for ecoefficiency and sustainability is
presented in its structure and dynamic evolution, enabling local managers not only to
assess their sustainable development trend, but also to identify where should their
action be directed in the short term to correct unfavourable trends. The study was a
part of the PAZEWAIA Project financed by Innovation Norway.
1 GEC-Bucovina, Suceava, [email protected] 2 ”Ştefan cel Mare” University-Suceava, [email protected]

Cristian Teodorescu, Mirela Danubianu
170
1. Metrics for development
The growing concern about a bunch of indicators difficult to infer but telling
almost nothing to common people led, in the last decade, EU structures, as well as
EU states to initiate a critical evaluation of existing indicators for economic
development and suggest possible approaches to a new metrics that should include
also the environmental concerns and the quality of life (Beyond GDP, 2014;
GDP&Beyond, 2009; Stiglitz et al, 2008, EU-JRC, 2010). Essential findings are
presented below.
The gap between traditional measures of socio-economic variables (GDP,
productivity, growth, inflation, inequalities etc.) and their perception by the general
public becomes wider and wider and cannot be explained only on a monetary basis,
by education or by cultural differences.
Cited documents do not recommend a tabula rasa of the existing metrics of
socio-economic development but try to identify complementary measures, more
complex indicators that goes beyond the economic performance.
The main objective is to devise indicators that could include all the three
perspectives of the sustainable development (economic, environmental, and social
sustainability). A critical analysis of the limits of the existing system of indicators
and their public perception points to several possible causes:
a. The metrics could be fundamentally correct, but the characteristics of the
measuring processes are flawed;
b. Errors and misjudgments in the conceptual framework can be also
accepted, sending economists to the drawing board. As long as GDP says nothing
about atmospheric pollution or water quality, aspects that confronts general public
at every moment, the GDP and other statistical measures that does not include
pollution are intrinsically biased and may become irrelevant;
c. Industrial performance and products available on the market must be
accompanied by some more information than the price of the goods (does this
furniture or this book come from sustainably managed forests? Has children work
been used to produce these cloths? Production of this car has led to increasing
pollution of soil, water and air?);
d. Adding eco-indicators (air or water quality, rate of waste generation,
resource availability, ecosystems under risk, etc.) to the existing metrics, though
having its merits, complicates the statistics and make it more confusing and less
straightforward and understandable;
e. Sustainability must govern and be monitored not only inside companies
themselves but also in their interaction in the competition process (Schwab, 2014);
f. Successive economic crisis led to a dramatic increase in inequalities and
this reduces the relevance of statistical averages. GDP per capita, productivity,

Industrial symbiosis, ecoefficiency, sustainability a case study
171
average income and other intensive indicators can neither produce a fair account of
the world, at the beginning of the 21st Century.
g. What if the construction of a new, better metrics would start not from the
central administration and national statistical institutes (top-down) but from the
industry, business community or even from common people (bottom-up)? In this
respect, some encouraging results are already available. The business community
already uses more complex metrics for assessing the performance of companies
demonstrating not only financial success but also strong environmental, social and
governance sustainability (FTSE4GOOD, 2014; DJSI, 2014).
The paper has no ambition to challenge the business community or already
established metrics like the mentioned Financial Times of Dow Jones approaches.
It intends to demonstrate that complex metrics may be devised at enterprise level to
monitor its progress toward sustainability. Complex metrics can be easily devised
starting from existing company metrics and from available documents detailing
best practices.
The study is a part of the Partnerships with Zero-Waste Industrial Activities
(PAZEWAIA, 2014) Project financed by the Norwegian Government through
Innovation Norway. The Norwegian partner (International Development Norway)
involvement in the Project with technical and scientific support, expertize in
calculus and analysis is hereby graciously acknowledged.
2. The case of the termica power plant
Previous papers (Danubianu et al, 2013, 2014) have detailed the sustainability
analysis for the TERMICA Power Plant in Suceava.
The Company applied the principles of Industrial Symbiosis (Agarwal and
Strachan, 2008) in trying to better manage its environmental footprint and a special
appointed multi-disciplinary team carried out a thorough benchmark and material
and energy flow accounting analysis, along the lines of ISO14051-2011. Main
conclusions:
a. Some 30000tons of virgin soil were preserved by using inert demolition
waste to cover the ash field of the power plant;
b. modern techniques like data-mining prove useful to analyze data existing
at the Company, recorded in many years of operation; updated databases can show
to managers, in real time, what are the trends in the technological processes but
also in the environmental footprint;
c. external facilitators (Norwegian, Romanian) and Company’s specialists
derived more objective estimates for their environmental costs that amounted even
to 18-24% of total Company expenses, in the period analyzed, 2007-2011;

Cristian Teodorescu, Mirela Danubianu
172
d. more important, the intrinsic structure of these costs indicated points where
costs are excessively high (more specific, internal consumption of electric power
generated and the costs associated to flue gas);
e. The material and energy flow cost accounting should remain in place as it
ascertain best what the environmental footprint of TERMICA is. Measures should
be directed to reduce this footprint by acting where the environmental costs are the
higher;
f. correlation analysis showed what operational parameters correlate best.
Acting upon one of them will result in a corresponding improvement in all other
strongly correlated parameters;
g. an internal benchmarking analysis was carried out and indicated the year
2008 as the best one in the recent history of the power plant. By simply
reproducing the conditions valid in 2008, TERMICA could improve by 6-12%
level of efficiency, without any additional investment.
h. Using regression analysis showed that, excepting the internal electric
energy consumptions, all other important operational parameters tend to approach
the levels specified by the best available techniques documents, in the short or
medium term.
3. A composite index to assess sustainability
The team of Norwegian and Romanian experts working with the local
specialists have concluded that such an index should include:
a. Technical performances of the power plant. E.g.:
1. Internal losses of electric energy produced
2. Internal losses of thermal energy produced
3. Heat losses with the flue gases
b. Environmental consequences of the plant operation in all 3 media. E.g.:
Ash management costs (soli pollution)
Greenhouse gases (carbon dioxide) emitted (atmospheric pollution)
Water losses (loss of water resources).
Table 1 includes the relative dynamics of these parameters in the period 2007-
2011.
As the table shows, in the 5 year period studied, there is a decreasing trend in
negative products (as defined by ISO14051). This qualitative remark should be
turned into a quantified, numerical value and this will be done by using a
Composite Index measuring the power plant performance.
Industrial symbiosis, ecoefficiency, sustainability a case study
173
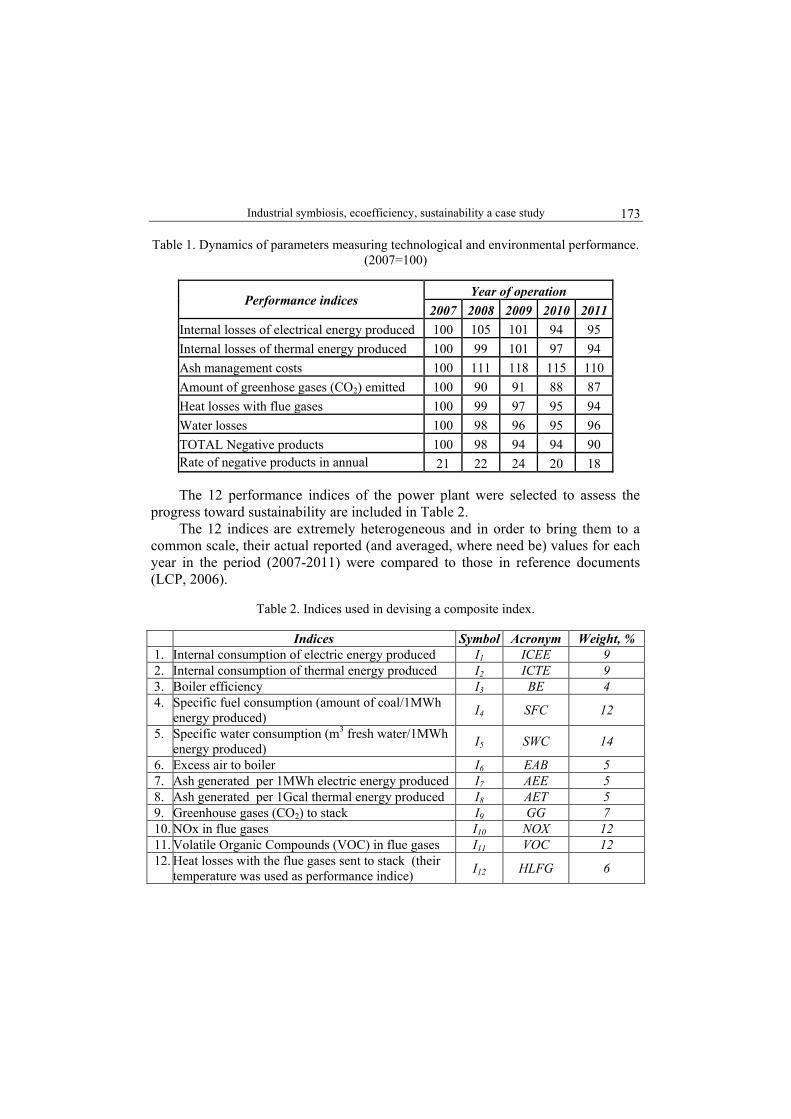
Table 1. Dynamics of parameters measuring technological and environmental performance.
(2007=100)
Performance indices Year of operation
2007 2008 2009 2010 2011
Internal losses of electrical energy produced 100 105 101 94 95
Internal losses of thermal energy produced 100 99 101 97 94
Ash management costs 100 111 118 115 110
Amount of greenhose gases (CO2) emitted 100 90 91 88 87
Heat losses with flue gases 100 99 97 95 94
Water losses 100 98 96 95 96
TOTAL Negative products 100 98 94 94 90
Rate of negative products in annual
expenses,% 21 22 24 20 18
The 12 performance indices of the power plant were selected to assess the
progress toward sustainability are included in Table 2.
The 12 indices are extremely heterogeneous and in order to bring them to a
common scale, their actual reported (and averaged, where need be) values for each
year in the period (2007-2011) were compared to those in reference documents
(LCP, 2006).
Table 2. Indices used in devising a composite index.
Indices Symbol Acronym Weight, %
1. Internal consumption of electric energy produced I1 ICEE 9
2. Internal consumption of thermal energy produced I2 ICTE 9
3. Boiler efficiency I3 BE 4
4. Specific fuel consumption (amount of coal/1MWh
energy produced) I4 SFC 12
5. Specific water consumption (m3 fresh water/1MWh
energy produced) I5 SWC 14
6. Excess air to boiler I6 EAB 5
7. Ash generated per 1MWh electric energy produced I7 AEE 5
8. Ash generated per 1Gcal thermal energy produced I8 AET 5
9. Greenhouse gases (CO2) to stack I9 GG 7
10. NOx in flue gases I10 NOX 12
11. Volatile Organic Compounds (VOC) in flue gases I11 VOC 12
12. Heat losses with the flue gases sent to stack (their
temperature was used as performance indice) I12 HLFG 6

Cristian Teodorescu, Mirela Danubianu
174
Fig.1 illustrates how some of these indices compare to the Best Available
Reference Documents (BAT) levels (relative values: BAT level=1.00; acronyms
used are those in Table 2)
Fig. 1. Power plant performances in 2010 against Best Available
Techniques documents.
The structure of a Composite Index for sustainability is inspired by the well-
known aver-all mass and heat transfer coefficients (series of resistances to transfer
and an analytical form of such a Composite Index is:
The sum at the denominator has 12 terms, one for each of the 12 indices
mentioned in Table 2. The denominator of each fraction at the denominator of the
expression is less than unity and should be increased in order that the power plant
performances align to those in BAT documents. This can be achieved by reducing
power plants consumptions, losses or increasing the boiler efficiency. The most
important property of such a calculation is that the resulting analytical Composite
Index is less than the smallest of the ratios (Ik,BAT/Ik,Termica) and remains so as long as
this smallest ratios is not increased. In this way, managers have an indication of
where to act with priority in order to increase the power plant performance.
Industrial symbiosis, ecoefficiency, sustainability a case study
175
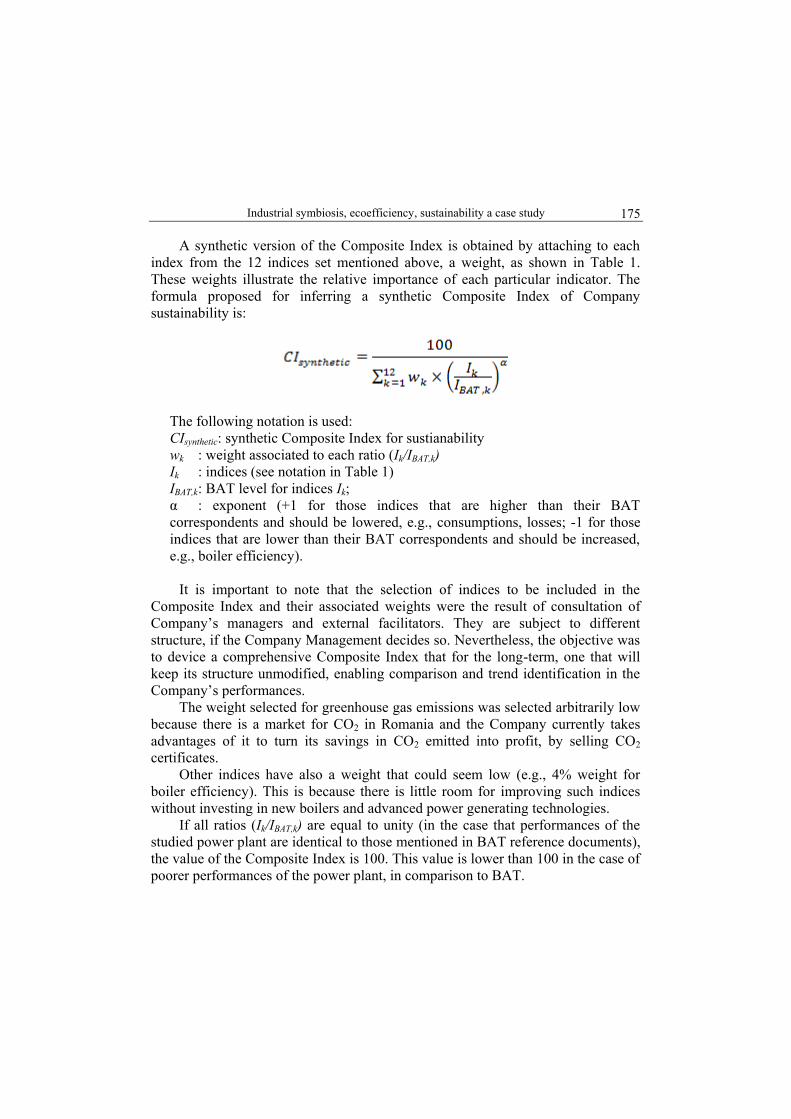
A synthetic version of the Composite Index is obtained by attaching to each
index from the 12 indices set mentioned above, a weight, as shown in Table 1.
These weights illustrate the relative importance of each particular indicator. The
formula proposed for inferring a synthetic Composite Index of Company
sustainability is:
The following notation is used:
CIsynthetic: synthetic Composite Index for sustianability
wk : weight associated to each ratio (Ik/IBAT,k)
Ik : indices (see notation in Table 1)
IBAT,k : BAT level for indices Ik;
α : exponent (+1 for those indices that are higher than their BAT
correspondents and should be lowered, e.g., consumptions, losses; -1 for those
indices that are lower than their BAT correspondents and should be increased,
e.g., boiler efficiency).
It is important to note that the selection of indices to be included in the
Composite Index and their associated weights were the result of consultation of
Company’s managers and external facilitators. They are subject to different
structure, if the Company Management decides so. Nevertheless, the objective was
to device a comprehensive Composite Index that for the long-term, one that will
keep its structure unmodified, enabling comparison and trend identification in the
Company’s performances.
The weight selected for greenhouse gas emissions was selected arbitrarily low
because there is a market for CO2 in Romania and the Company currently takes
advantages of it to turn its savings in CO2 emitted into profit, by selling CO2
certificates.
Other indices have also a weight that could seem low (e.g., 4% weight for
boiler efficiency). This is because there is little room for improving such indices
without investing in new boilers and advanced power generating technologies.
If all ratios (Ik/IBAT,k) are equal to unity (in the case that performances of the
studied power plant are identical to those mentioned in BAT reference documents),
the value of the Composite Index is 100. This value is lower than 100 in the case of
poorer performances of the power plant, in comparison to BAT.

Cristian Teodorescu, Mirela Danubianu
176
Such a Composite Index has the following advantages:
1. It includes only measures familiar to the Company’s managers since they
are monitored permanently and, some of them, reported to the local Environmental
Protection Agency;
2. It uses BAT documents for reference, also accessible and familiar to
managers since the power sector in Romania must align to the stringencies of
cleaner production and BAT, as soon as possible;
3. By studying each separate ratio (Ik/IBAT,k), managers straightforwardly
identify where is the lowest performance of the Company (highest than unity ratio
that should be decreased in all cases, with the exception of the ratio of boiler
efficiencies that is currently lower than unity and should be increased);
4. The dynamics of this composite index show, if it increases the favorable
progress of the company toward sustainability and eco-efficiency. Fig. 2 illustrates
this dynamics.
Fig. 2. Dynamics of the Composite Index (relative values; 2007=100).
Fig. 2 indicates, again, the year 2008 as the best in the recent history of the
power plant (result obtained also via the internal benchmarking analysis). Yet it is
clear that the power plant has recovered from the economic crisis period and it is
on a good, uphill trend, as shows the regression line in the figure.
Conclusions
The paper presents a continuation of exploiting on a scale as large and
comprehensive as possible the operating data existing at a Romanian power plant.
Previous implementation of the Industrial Symbiosis principles has reduced
dramatically the costs of ecologization of the ash deposit of the power plant.

Industrial symbiosis, ecoefficiency, sustainability a case study
177
This is of particular importance since Romania has a poor performance in
waste recycling (ANPM, 2014). Material and energy flow cost accounting along
the lines of ISO 14051 has also showed, in a previous study, the importance of
having a correct image of what the real environmental costs of a company are.
Further developments (e.g., use of Life Cycle Assessment) will further deepen
the knowledge the power plant system structure and behavior (Teodorescu, 2010)
In the present study, managers were given a tool to assess the sustainability of
the power plant from the technological and environmental perspectives, by
devising a Composite Index.
It includes only measures and indices already familiar to the Company’s
managers (including reference to Best Available Techniques) but aggregates all
this indices into a single, synthetic value, easy to monitor. The structure of the
Composite Index enables managers to identify where the managerial action should
be directed, where to allocate resources with priority in order to improve the power
plant performances in the short term. Once the Composite Index shows a limit in
its evolution, it could be an indication that further improving the performances
requires something more than good housekeeping or professional maintenance
(probably investments in new technology is needed).
The Composite Index adopted includes 12 indices (technological but also
environmental and resource-connected), turn them into dimensionless ratios by
using BAT reference values and allocates specific weights to each such ratios.
The set of indices and the associated weights were discussed and approved by
the Company’s managers and experts and they could be subject of further
improvement.
The evolution of the Composite Index shows a favorable, increasing trend in
the last 3 years of operation, in the period under scrutiny.
Coupled with the Industrial Symbiosis approach and the ISO14051 material
and energy flow cost accounting, the generation of the Composite Index constitutes
a pattern of assessing the sustainability of a Company and showed the following
benefits:
- Industrial Symbiosis is a valuable tool to turn waste into resource and to
reduce environmental costs;
- Material and energy flow cost accounting should become a permanently
used tool to monitor Company’s performances and to direct action toward hot
points;
- Together with other economic analyses, the material and energy flow cost
accounting lead to an objective evaluation of investments needed for a better
technology and reduced environmental footprint;
- By calculating the components of the suggested Composite Index, the
personnel is motivated to improve the value of a given component – if this has an

Cristian Teodorescu, Mirela Danubianu
178
unfavorable value – by preventive maintenance and good housekeeping, by strictly
observing operational procedures. Losses are reduced and consumptions are
lowered;
During the study, a set of recommendations were suggested to Company’s
managers, Excerpts:
1. A better selection of fuel providers;
2. An optimal fuel management system;
3. A permanent study of the BAT documents by all Company’s managers;
4. Implement preventive maintenance procedures at every working place, for
every equipment;
5. Critical analysis of internal processes that consumes excessive electric and
thermal energy;
6. A cost-benefit analysis to reduce the temperature of flue gases sent to
stack. Reducing their temperature would lead to better plant efficiency;
7. Reducing water losses at the cooling tower (by taking into account even
investing in a closed water circuit);
8. Better ash management. Selling ash to cement and concrete producers, in a
symbiotic partnership, could be a solution to reduce waste to landfill.
The study generated expertize at Company’s level, enabling local managers to
carry on the procedures for monitoring environmental costs, for calculating the
Composite Index and to identify potential symbiotic partnerships in order to turn
plant’s waste into resources.
References Agarwal, A. and Strachan, P. (2008). Is Industrial Symbiosis only a Concept for
Developed Countries?, The Journal for Waste & Resource Management
Professionals, The Chartered Institution of Wastes Management; 42;
ANPM (2012), Reports on the State of the ENVIRONMENT 2002 – 2013, available at
http://www.anpm.ro/Mediu/raport_privind_starea_mediului_in_romania-15 , accessed
Oct 1, 2014.
Beyond GDP (2014), The Beyond GDP Initiative, available at
http://ec.europa.eu/environment/beyond_gdp/index_en.html accessed Sep 3-, 2014;
Danubianu, D. et al (2013), A New Fate for the Demolition Waste-A Case Study, Present
Environment and Sustainable Development 7(1), 127-137;
Danubianu, Mirela, et al (2014), Data-mining – a valuable managerial tool for improving
power plants efficiency, Present Environment and Sustainable Development, 8(2),
205-216;
DJSI (2014), Dow Jones Sustainability Indices, information available at
http://www.sustainability-indices.com/ accessed Oct 6, 2014;

Industrial symbiosis, ecoefficiency, sustainability a case study
179
EU-JRC (2010), EU-JRC (2010). Monitoring Progress in Sustainable Consumption
and Production in the EU – Decoupling Indicators, EU Joint Research Center,
Trieste, Italy.
FTSE4GOOD (2104), FTSE4Good Index Series, available at
http://www.ftse.com/products/indices/FTSE4Good accessed , accessed on Oct 6,
2014;
GDP&Beyond (2009), GDP and Beyond – Measuring Progress In A Changing World,
COM(2009) 433 Final, European Commission, Brussels;
LCP (2006), Reference document on best available techniques for large combustion plants,
available at http://eippcb.jrc.ec.europa.eu/reference/lcp.html , accessed Sep 30, 2014
PAZEWAIA (2014), News about the Project is available at http://www.id-
norway.com/2014/09/successful-pazewaia-workshop-in-suceava-22-9-2014/ ,
accessed Oct 15, 2014
Schwab, K.(editor), (2014), The Global Competitiveness Report 2014-2015, World
Economic Forum, Geneva, Switerland;
Stiglitz, J. et al (2008), Commission On The Measurement Of Economic Performance And
Social Progress, Commission on the Measurement of Economic Performance and
Social Progress (CMEPSP), Issues paper 25/07/08-1;
Teodorescu, C. et al (2010). Applying The Life Cycle Assessment At A Macro-Economical
Level, paper presented at the 31st National Conference in Chemistry, Ramnicu-Valcea,
Oct 6-8, 2010.

Cristian Teodorescu, Mirela Danubianu
180