industrials m&a report - hyde park capital · 08/01/13 avis budget car rental, llc...
TRANSCRIPT
IndustrialsM&A Report
Q3 2013
HYDE PARK CAPITAL
Member FINRA/SIPC
Investment Banking | Mergers & Acquisitions | Capital Raising
Hyde Park Capital Advisors, LLC701 N. Franklin StreetTampa, FL 33602Tel: 813-383-0202www.hydeparkcapital.com
John Hill Senior Managing Director [email protected](813) 383-0205John McDonaldSenior Managing [email protected](813) 383-0206Keith HodgdonSenior Vice [email protected](813) 383-0208Jeffrey Bridge Vice President [email protected](813) 383-0204Michael [email protected](813) 597-2649Charlie HendrickSenior [email protected](813) 383-0207

HYDE PARK CAPITALInvestment Banking | Mergers & Acquisitions | Capital Raising
Offer Date Issuer Industry SectorTransaction
Type Transaction
Value07/22/13 Lockheed Martin Corp. Aerospace and Defense Fixed-Income $1,32708/16/13 Union Pacific Corp. Transportation Fixed-Income $1,13909/24/13 The ADT Corp. Industrial Services Fixed-Income $1,00008/01/13 Avis Budget Car Rental, LLC Transportation Fixed-Income $80008/13/13 Burlington Northern Santa Fe, LLC Transportation Fixed-Income $79709/10/13 Armstrong World Industries, Inc. Materials Secondary $62209/24/13 Aviation Capital Group Corp. Industrial Services Fixed-Income $60008/08/13 Iron Mountain, Inc. Industrial Services Fixed-Income $60007/22/13 Gardner Denver, Inc. Machinary Fixed-Income $57508/08/13 Stock Building Supply Holdings, Inc. Industrial Services IPO $98
80%90%
100%110%120%130%
Sep-12 Dec-12 Mar-13 Jun-13 Sep-13S&P 500 S&P Global Industrials Sector Index Nasdaq
Industry Sector 3 Months 12 months Revenue EBITDAConstruction 8.8% 34.9% 1.2x 11.3xElectrical Equipment 11.2% 33.3% 1.9x 11.7xMachinery 9.8% 33.3% 1.4x 9.9xIndustrial Services 5.3% 22.4% 1.7x 11.4xTransportation 6.2% 34.8% 1.3x 7.6xIndustrial Conglomerates 7.6% 16.6% 1.7x 11.0xMaterials 7.8% 2.0% 1.9x 9.8x
MedianChange in Stock Price Enterprise Value / LTM
Capital Markets Overview
2
Public Market Performance (LTM)
Select Public Offerings – Industrials (Q3 2013)
Public Company Market Performance by Sector
Source: S&P Capital IQ
As of September 30, 2013 major market indices including the S&P500, S&P Global Industrials Sector Index and Nasdaq increasedapproximately 16%, 15% and 21%, respectively, over the 12-month period.As illustrated in the table on the right, there were several notablefixed-income offerings during the quarter as companies capitalizedon low interest rates. IPO activity in the Industrial sector was veryquiet as Stock Building Supply Holdings, Inc. (NasdaqGS:STCK) wasthe only notable IPO during the quarter.The Electrical Equipment and Industrial Services sectors were theindustry’s strongest performers in terms of valuation during the 3rdquarter, trading at 11.7x and 11.4x LTM EBITDA, respectively.
Commentary($ in millions)
21.1%
14.8%
16.4%

HYDE PARK CAPITALInvestment Banking | Mergers & Acquisitions | Capital Raising
Deal Size Volume Value Volume Value Volume Value Less than $100M 197 $6.6 151 $5.1 (23%) (22%)$100 - $499M 65 $14.9 51 $11.2 (22%) (25%)$500 - $1,000M 17 $11.8 20 $12.6 18% 7%Total Middle Market 279 $33.3 222 $28.9 (20%) (13%)
% of Middle MarketLess than $100M 71% 20% 68% 18%$100 - $499M 23% 45% 23% 39%$500 - $1,000M 6% 35% 9% 43%Total Middle Market 100% 100% 100% 100%
YTD 2012 YTD 2013 % Change
Middle Market M&A Transactions by Deal Size
U.S. Middle Market M&A Activity – Annual Trends: VOLUME U.S. Middle Market M&A Activity – Annual Trends: VALUE
Total Transac
tion Volume
Total Transac
tion Value ($ i
n bi
llion
s)
Annual Middle Market M&A Activity – Industrials
3
As detailed in the charts below, overall U.S. middle market M&Aactivity, or deal volume, in the Industrials industry for the year-to-date period as of September 30, 2013 declined approximately 20%to 222 closed deals, down from 279 in the prior year period.The total value of completed M&A transactions in the Industrialsindustry fell by 13% to $28.9 billion even though transaction valueof deals between $500 million and $1 billion increased 7% over theprior year period.Like most areas in the M&A market, the Industrial industry hasseen significant declines in volume and value of transactionscompared to 2012.
Commentary
Source: S&P Capital IQ (middle market includes all closed deals with disclosed deal value between $10 million and $1 billion)Less than $100M $100 - $499M $500 - $1,000M Less than $100M $100 - $499M $500 - $1,000M
($ in billions)

HYDE PARK CAPITALInvestment Banking | Mergers & Acquisitions | Capital Raising
Deal Size Volume Value Volume Value Volume Value Less than $100M 81 $2.7 51 $1.7 (37%) (37%)$100 - $499M 23 $5.6 17 $4.2 (26%) (25%)$500 - $1,000M 5 $3.6 9 $5.4 80% 52%Total Middle Market 109 $11.8 77 $11.3 (29%) (4%)
% of Middle MarketLess than $100M 74% 23% 66% 15%$100 - $499M 21% 47% 22% 37%$500 - $1,000M 5% 30% 12% 48%Total Middle Market 100% 100% 100% 100%
Q3 2012 Q3 2013 % Change
Quarterly Middle Market M&A Activity – Industrials
U.S. Middle Market M&A Activity – Quarterly Trends: VALUEU.S. Middle Market M&A Activity – Quarterly Trends: VOLUME
Middle Market M&A Transactions by Deal Size
($ in billions)
Total Transac
tion Volume
Total Transac
tion Value ($ i
n bi
llion
s)
4
As detailed in the table on the right, Industrials M&A transactionvolume and value decreased in Q3 2013 compared to Q3 2012.The number of completed Industrials deals declined 29% in Q32013 to 77, down from 109 in Q3 2012, while total deal value fell4% over the same period to $11.3 billion.During Q3 2013, transactions valued between $500 million and $1billion saw dramatic increases over Q2 2012 as strategic buyersmade a number of key acquisitions.Transactions smaller than $500 million showed significant declinesfrom the prior year as uncertainty in the economy has muted dealactivity.
Commentary
Source: S&P Capital IQ (middle market includes all closed deals with disclosed deal value between $10 million and $1 billion)Less than $100M $100 - $499M $500 - $1,000MLess than $100M $100 - $499M $500 - $1,000M
HYDE PARK CAPITALInvestment Banking | Mergers & Acquisitions | Capital Raising
Announced Date Target Buyer Industry Enterprise
Value ($mm)EV /
RevenueEV /
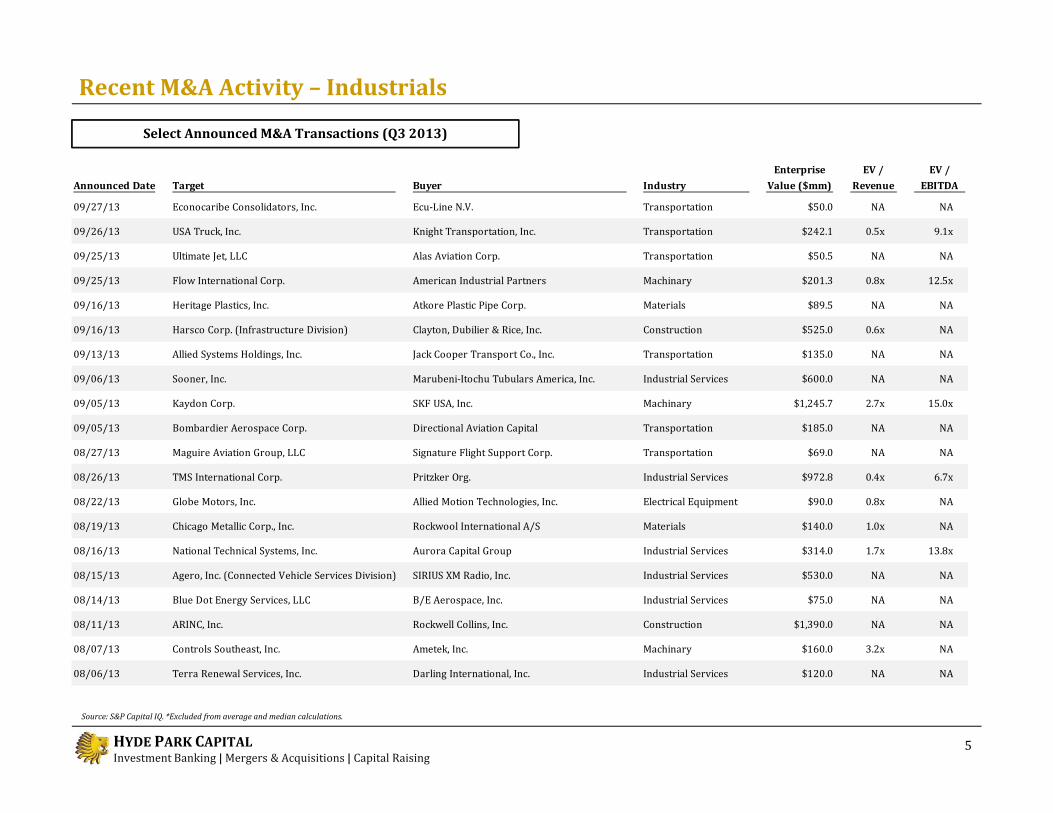
EBITDA09/27/13 Econocaribe Consolidators, Inc. Ecu-Line N.V. Transportation $50.0 NA NA09/26/13 USA Truck, Inc. Knight Transportation, Inc. Transportation $242.1 0.5x 9.1x09/25/13 Ultimate Jet, LLC Alas Aviation Corp. Transportation $50.5 NA NA09/25/13 Flow International Corp. American Industrial Partners Machinary $201.3 0.8x 12.5x09/16/13 Heritage Plastics, Inc. Atkore Plastic Pipe Corp. Materials $89.5 NA NA09/16/13 Harsco Corp. (Infrastructure Division) Clayton, Dubilier & Rice, Inc. Construction $525.0 0.6x NA09/13/13 Allied Systems Holdings, Inc. Jack Cooper Transport Co., Inc. Transportation $135.0 NA NA09/06/13 Sooner, Inc. Marubeni-Itochu Tubulars America, Inc. Industrial Services $600.0 NA NA09/05/13 Kaydon Corp. SKF USA, Inc. Machinary $1,245.7 2.7x 15.0x09/05/13 Bombardier Aerospace Corp. Directional Aviation Capital Transportation $185.0 NA NA08/27/13 Maguire Aviation Group, LLC Signature Flight Support Corp. Transportation $69.0 NA NA08/26/13 TMS International Corp. Pritzker Org. Industrial Services $972.8 0.4x 6.7x08/22/13 Globe Motors, Inc. Allied Motion Technologies, Inc. Electrical Equipment $90.0 0.8x NA08/19/13 Chicago Metallic Corp., Inc. Rockwool International A/S Materials $140.0 1.0x NA08/16/13 National Technical Systems, Inc. Aurora Capital Group Industrial Services $314.0 1.7x 13.8x08/15/13 Agero, Inc. (Connected Vehicle Services Division) SIRIUS XM Radio, Inc. Industrial Services $530.0 NA NA08/14/13 Blue Dot Energy Services, LLC B/E Aerospace, Inc. Industrial Services $75.0 NA NA08/11/13 ARINC, Inc. Rockwell Collins, Inc. Construction $1,390.0 NA NA08/07/13 Controls Southeast, Inc. Ametek, Inc. Machinary $160.0 3.2x NA08/06/13 Terra Renewal Services, Inc. Darling International, Inc. Industrial Services $120.0 NA NA
Recent M&A Activity – Industrials
Select Announced M&A Transactions (Q3 2013)
5Source: S&P Capital IQ. *Excluded from average and median calculations.
HYDE PARK CAPITALInvestment Banking | Mergers & Acquisitions | Capital Raising
Announced Date Target Buyer Industry Enterprise
Value ($mm)EV /
RevenueEV /
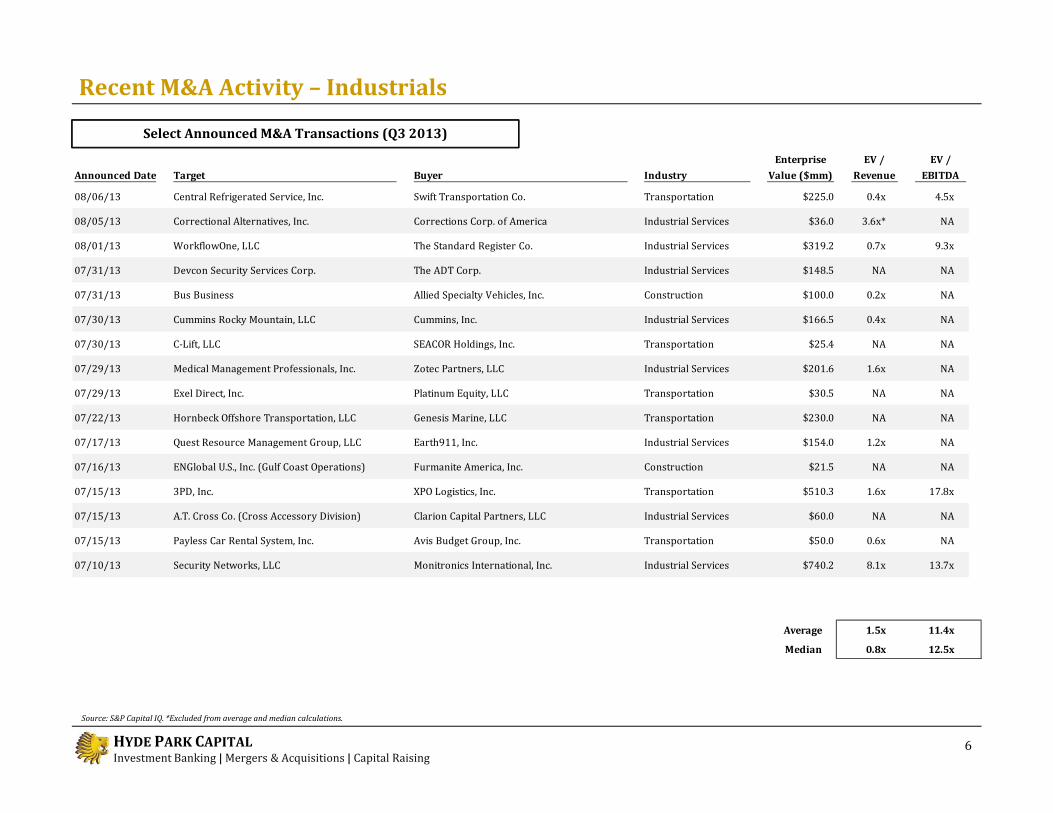
EBITDA08/06/13 Central Refrigerated Service, Inc. Swift Transportation Co. Transportation $225.0 0.4x 4.5x08/05/13 Correctional Alternatives, Inc. Corrections Corp. of America Industrial Services $36.0 3.6x* NA08/01/13 WorkflowOne, LLC The Standard Register Co. Industrial Services $319.2 0.7x 9.3x07/31/13 Devcon Security Services Corp. The ADT Corp. Industrial Services $148.5 NA NA07/31/13 Bus Business Allied Specialty Vehicles, Inc. Construction $100.0 0.2x NA07/30/13 Cummins Rocky Mountain, LLC Cummins, Inc. Industrial Services $166.5 0.4x NA07/30/13 C-Lift, LLC SEACOR Holdings, Inc. Transportation $25.4 NA NA07/29/13 Medical Management Professionals, Inc. Zotec Partners, LLC Industrial Services $201.6 1.6x NA07/29/13 Exel Direct, Inc. Platinum Equity, LLC Transportation $30.5 NA NA07/22/13 Hornbeck Offshore Transportation, LLC Genesis Marine, LLC Transportation $230.0 NA NA07/17/13 Quest Resource Management Group, LLC Earth911, Inc. Industrial Services $154.0 1.2x NA07/16/13 ENGlobal U.S., Inc. (Gulf Coast Operations) Furmanite America, Inc. Construction $21.5 NA NA07/15/13 3PD, Inc. XPO Logistics, Inc. Transportation $510.3 1.6x 17.8x07/15/13 A.T. Cross Co. (Cross Accessory Division) Clarion Capital Partners, LLC Industrial Services $60.0 NA NA07/15/13 Payless Car Rental System, Inc. Avis Budget Group, Inc. Transportation $50.0 0.6x NA07/10/13 Security Networks, LLC Monitronics International, Inc. Industrial Services $740.2 8.1x 13.7xAverage 1.5x 11.4x
Median 0.8x 12.5x
Recent M&A Activity – Industrials
Select Announced M&A Transactions (Q3 2013)
6Source: S&P Capital IQ. *Excluded from average and median calculations.

HYDE PARK CAPITALInvestment Banking | Mergers & Acquisitions | Capital Raising
($ in millions)LTM
Income Statement 7/31/13Revenue $185.0 Purchase Price (Equity) $269.1EBITDA $22.7 Net Assumed Liabilities $37.3Net Income $3.2 Implied Enterprise Value $306.4
As ofBalance Sheet 9/12/13 Implied Purchase MultiplesCash $9.7 Revenue 1.7xDebt $47.6 EBITDA 13.5xNet Debt $37.9 Net Income NM
Financial Profile Transaction Analysis
($ in millions)LTM
Income Statement 6/30/13Revenue $462.4 Purchase Price (Equity) $1,144.8EBITDA $83.0 Net Assumed Liabilities $94.8Net Income NM Implied Enterprise Value $1,239.5
As ofBalance Sheet 7/25/13 Implied Purchase MultiplesCash $69.9 Revenue 2.7xDebt $164.7 EBITDA 14.9xNet Debt $94.8 Net Income NM
Financial Profile Transaction Analysis
Recent M&A Transactions Profiled – Industrials
Transaction DetailsNational Technical Systems, Inc.
Transaction Details
7
Kaydon Corp.Kaydon Corp. (NYSE:KDN) engages in the design, manufacture, andsale of custom engineered, performance-critical products aroundthe globe.On September 5, 2013 SKF USA, Inc., a subsidiary of AB SKF(OMX:SKF B), announced it entered into a definitive agreement toacquire all the outstanding shares of Kaydon for $35.50 per share incash in a transaction valued at approximately $1.25 billion.The offer price of $35.50 per share represents a 22% premium toKaydon’s share price based on September 4, 2013.SKF USA Inc. produces seals, lubrication systems, linear motionproducts, actuation systems, and rolling bearings.National Technical Systems, Inc. (NasdaqGS:NTSC) is a leadingprovider of engineering services to the aerospace, defense,telecommunications, automotive and high technology markets.On August 16, 2013 the Company announced that it entered into adefinitive agreement to be acquired by Aurora Capital Group forapproximately $270.The offer price of $23.00 per share represents a 39% premium toNTSC’s share price on August 15.Aurora Capital Group is a private equity firm based in Los Angeles,California managing over $2 billion in capital. The firm invests inmiddle market companies across a wide array of industries.

HYDE PARK CAPITALInvestment Banking | Mergers & Acquisitions | Capital RaisingYTD 2012 YTD 2013
YTD 2012 YTD 2013
4619
7720
512
6723
8330
1714
0 10 20 30 40 50 60 70 80 90Materials
TransportationIndustrial Services
MachineryElectrical Equipment
Construction
$6.6$2.6
$6.9$4.0
$0.1$1.0
$9.2$3.3
$5.7$4.8
$1.3$1.5
$0.0 $1.0 $2.0 $3.0 $4.0 $5.0 $6.0 $7.0 $8.0 $9.0 $10.0Materials
TransportationIndustrial Services
MachineryElectrical Equipment
Construction
M&A Activity by Industrial Sector
% Change
% Change
U.S. Middle Market M&A Activity by Industrial Sector: VALUE
8Source: S&P Capital IQ (includes all closed deals with disclosed deal value between $10 million and $1 billion); Note: Industrial conglomerates had no transactions with disclosed values in this range during the period.
U.S. Middle Market M&A Activity by Industrial Sector: VOLUME
93%17%
70%7%33%
33%
14%
20%21%28%
17%31%
($ in billions)

HYDE PARK CAPITALInvestment Banking | Mergers & Acquisitions | Capital Raising
Announced Date Target Buyer Industry Enterprise
Value 09/27/13 ChemEOR, Inc. TPG Capital, LP Materials NA09/25/13 Flow International Corp. American Industrial Partners Machinary $20109/24/13 Apache Industrial Services, Inc. GoldPoint Partners / MML Capital Partners Construction NA09/17/13 R·O·M Corp. The Sterling Group Construction NA09/16/13 Harsco Corp. (Infrastructure Division) Clayton, Dubilier & Rice, Inc. Construction $52509/09/13 DSA Mission Critical Services, LLC Seaport Capital Industrial Services NA09/06/13 Fulfillment Technologies, LLC Bregal Sagemount Industrial Services NA09/05/13 Bombardier Aerospace Corp. Directional Aviation Capital Transportation $18509/03/13 Rutland Plastic Technologies, Inc. The Riverside Co. Materials NA08/30/13 Control Devices, LLC Goldner Hawn Johnson & Morrison, Inc. Machinary NA08/26/13 TMS International Corp. Pritzker Organization Industrial Services $97308/19/13 Nordco, Inc. Greenbriar Equity Group, LLC Machinary NA08/16/13 National Technical Systems, Inc. Aurora Capital Group Industrial Services $31408/08/13 SolmeteX, Inc. Gemini Investors / Riveria Investment Group Machinary NA08/07/13 Bridge Terminal Transport, Inc. Platinum Equity, LLC Transportation NA08/05/13 Worldwide Express Operations, LLC Audax Group, Inc. Transportation NA08/01/13 Blackhawk Specialty Tools, LLC Bain Capital, LLC Machinary NA07/29/13 Exel Direct, Inc. Platinum Equity, LLC Transportation $3007/15/13 A.T. Cross Co. (Cross Accessory Division) Clarion Capital Partners Industrial Services $6007/15/13 Tecta America Corp. Oaktree Capital Management Construction NA07/08/13 Multi Packaging Solutions, Inc. Madison Dearborn Partners Materials NA
With plenty of committed undeployed capital, or “dry powder”sitting on the sidelines, financial sponsors continued to activelyinvest across all sectors of the Industrials industry in Q3 2013, asshown in the table on the right.Several notable private equity backed transactions wereannounced during the 3rd quarter including Pritzker Org.’sproposed purchase of TMS Management Corp. for $975 millionand Aurora Capital Group’s announced acquisition of NationalTechnical Systems, Inc. for $300 million.During YTD 2013 financial sponsors participated in 11% of thecompleted deals and accounted for approximately 14% of totaltransaction value, down from 12% and 17%, respectively, in YTD2012.
Select Private Equity Transactions – Industrials (Q3 2013)
Financial Sponsors vs. Strategic Buyers
Private Equity Activity – Industrials
Financial Sponsor Strategic Buyer Financial Sponsor Strategic Buyer
Total Transac
tion Value ($ i
n billions)
9
($ in millions)
Commentary
Source: S&P Capital IQ (includes all closed deals with disclosed deal value between $10 million and $1 billion)
Total Transac
tion Volume
HYDE PARK CAPITALInvestment Banking | Mergers & Acquisitions | Capital Raising
90%100%110%120%130%140%
Sep-12 Dec-12 Mar-13 Jun-13 Sep-13S&P 500 Machinery90%
100%110%120%130%140%
Sep-12 Dec-12 Mar-13 Jun-13 Sep-13S&P 500 Electrical Equipment
90%100%110%120%130%140%
Sep-12 Dec-12 Mar-13 Jun-13 Sep-13S&P 500 Construction
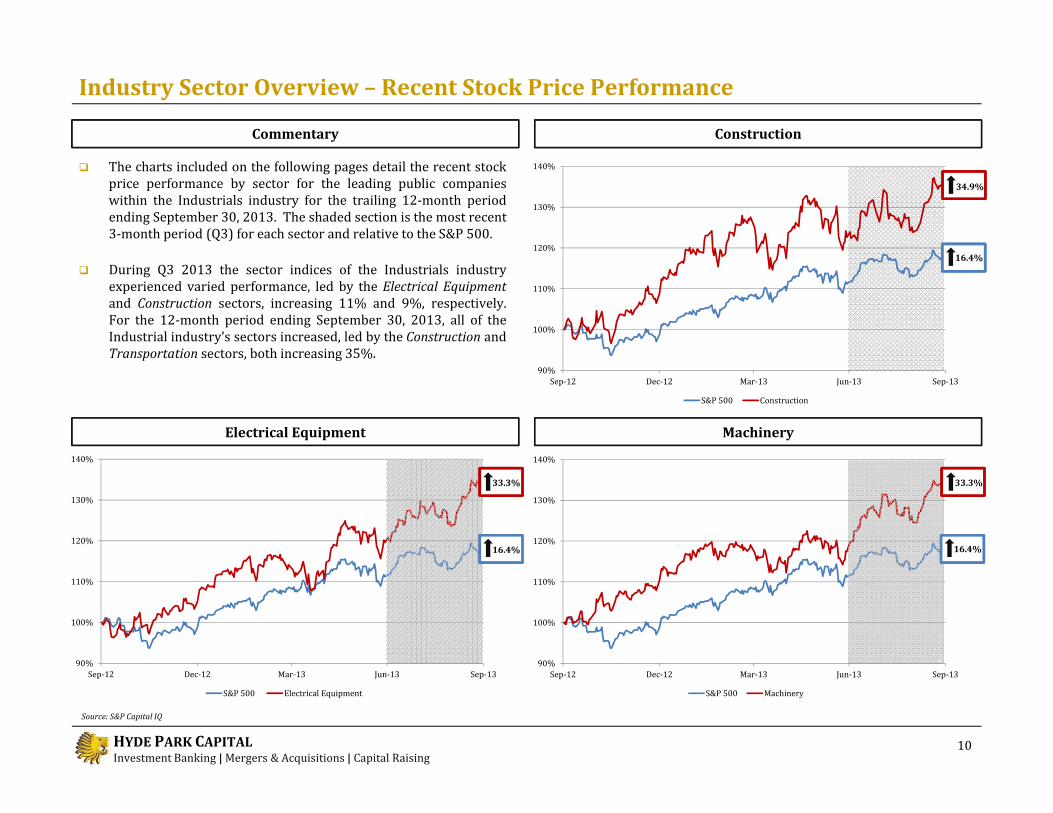
Industry Sector Overview – Recent Stock Price Performance
Electrical Equipment
Commentary
10
Construction
Machinery
Source: S&P Capital IQ
The charts included on the following pages detail the recent stockprice performance by sector for the leading public companieswithin the Industrials industry for the trailing 12-month periodending September 30, 2013. The shaded section is the most recent3-month period (Q3) for each sector and relative to the S&P 500.During Q3 2013 the sector indices of the Industrials industryexperienced varied performance, led by the Electrical Equipmentand Construction sectors, increasing 11% and 9%, respectively.For the 12-month period ending September 30, 2013, all of theIndustrial industry’s sectors increased, led by the Construction andTransportation sectors, both increasing 35%.
33.3%
16.4%
34.9%
16.4%
33.3%
16.4%

HYDE PARK CAPITALInvestment Banking | Mergers & Acquisitions | Capital Raising
80%90%
100%110%120%130%
Sep-12 Dec-12 Mar-13 Jun-13 Sep-13S&P 500 Materials80%90%
100%110%120%130%
Sep-12 Dec-12 Mar-13 Jun-13 Sep-13S&P 500 Industrial Conglomerates
90%100%110%120%130%140%
Sep-12 Dec-12 Mar-13 Jun-13 Sep-13S&P 500 Transportation90%
100%110%120%130%140%
Sep-12 Dec-12 Mar-13 Jun-13 Sep-13S&P 500 Industrial Services
Industry Sector Overview – Recent Stock Price Performance
Industrial Conglomerates
Industrial Services
11
Transportation
Source: S&P Capital IQ
Materials
34.8%
16.4%
16.6%
16.4%
16.4%
22.4%
16.4%
2.0%

HYDE PARK CAPITALInvestment Banking | Mergers & Acquisitions | Capital Raising
Closing Price % of 52 Equity EnterpriseCompany Ticker 9/30/13 Week High Value Value Revenue Gross Profit EBITDA Gross Profit EBITDA Revenue EBITDA Fluor Corp. FLR $70.96 95% $11,690 $12,212 $28,083 $1,014 $1,080 3.6% 3.8% 0.4x 11.3xJacobs Engineering Group, Inc. JEC $58.18 93% $7,578 $6,758 $11,462 $1,814 $765 15.8% 6.7% 0.6x 8.8xURS Corp. URS $53.75 96% $4,004 $5,999 $11,515 $868 $843 7.5% 7.3% 0.5x 7.1xKBR, Inc. KBR $32.64 89% $4,863 $4,015 $7,387 $557 $383 7.5% 5.2% 0.5x 10.5xAECOM Technology Corp. ACM $31.27 89% $3,240 $3,937 $8,157 $468 $475 5.7% 5.8% 0.5x 8.3xEMCOR Group, Inc. EME $39.13 89% $2,662 $2,636 $6,366 $811 $293 12.7% 4.6% 0.4x 9.0xTutor Perini Corp. TPC $21.32 99% $1,025 $1,663 $4,260 $448 $245 10.5% 5.8% 0.4x 6.8x
Average 93% $5,009 $5,317 $11,033 $854 $583 9.1% 5.6% 0.5x 8.8x
Median 93% $4,004 $4,015 $8,157 $811 $475 7.5% 5.8% 0.5x 8.8x
Enterprise Value /LTM LTM Margins LTM
Closing Price % of 52 Equity EnterpriseCompany Ticker 9/30/13 Week High Value Value Revenue Gross Profit EBITDA Gross Profit EBITDA Revenue EBITDA Masco Corp. MAS $21.28 93% $7,459 $9,809 $8,256 $2,170 $782 26.3% 9.5% 1.2x 12.5xFortune Brands Home & Security, Inc. FBHS $41.63 95% $7,102 $7,304 $4,003 $1,365 $409 34.1% 10.2% 1.8x 17.9xOwens Corning OC $37.98 83% $4,498 $6,668 $5,176 $962 $696 18.6% 13.4% 1.3x 9.6xUSG Corp. USG $28.58 92% $3,146 $4,938 $3,470 $515 $361 14.8% 10.4% 1.4x 13.7xLennox International, Inc. LII $75.26 99% $3,829 $4,227 $3,134 $822 $326 26.2% 10.4% 1.3x 13.0xArmstrong World Industries, Inc. AWI $54.96 94% $3,274 $4,219 $2,671 $624 $268 23.3% 10.0% 1.6x 15.8xAO Smith Corp. AOS $45.20 98% $4,207 $3,958 $2,119 $760 $306 35.8% 14.4% 1.9x 12.9xSimpson Manufacturing Co., Inc. SSD $32.57 95% $1,582 $1,367 $691 $302 $103 43.8% 14.9% 2.0x 13.3x
Average 94% $4,387 $5,311 $3,690 $940 $406 27.9% 11.7% 1.6x 13.6x
Median 94% $4,018 $4,583 $3,302 $791 $344 26.3% 10.4% 1.5x 13.1x
LTM MarginsEnterprise Value /
LTM LTM
Industry Sector Overview – Public Company Analysis
Building Products
($ in millions, except per share)
12
Construction and Engineering
Construction
Source: S&P Capital IQ

HYDE PARK CAPITALInvestment Banking | Mergers & Acquisitions | Capital Raising
Closing Price % of 52 Equity EnterpriseCompany Ticker 9/30/13 Week High Value Value Revenue Gross Profit EBITDA Gross Profit EBITDA Revenue EBITDARockwell Automation, Inc. ROK $106.94 97% $15,103 $14,831 $6,300 $2,531 $1,149 40.2% 18.2% 2.4x 12.9xAmetek, Inc. AME $46.02 96% $11,306 $12,352 $3,493 $1,235 $908 35.4% 26.0% 3.5x 13.6xHubbell, Inc. HUB.B $104.74 93% $6,240 $6,204 $3,130 $1,054 $563 33.7% 18.0% 2.0x 11.0xGenerac Holdings, Inc. GNRC $42.64 96% $2,971 $4,062 $1,452 $550 $367 37.9% 25.3% 2.8x 11.1xAcuity Brands, Inc. AYI $92.02 98% $3,911 $3,905 $2,089 $846 $279 40.5% 13.4% 1.9x 14.0xBelden Inc. BDC $64.05 97% $2,879 $3,718 $2,037 $700 $304 34.3% 14.9% 1.8x 12.2xWoodward, Inc. WWD $40.83 95% $2,848 $3,372 $1,906 $552 $288 29.0% 15.1% 1.8x 11.7xPolypore International, Inc. PPO $40.97 85% $1,933 $2,616 $707 $242 $177 34.2% 25.0% 3.7x 14.8xBrady Corp. BRC $30.50 84% $1,566 $1,788 $1,152 $606 $188 52.6% 16.4% 1.6x 9.5xGrafTech International, Ltd. GTI $8.45 75% $1,146 $1,711 $1,229 $219 $174 17.8% 14.1% 1.4x 9.8xColeman Cable, Inc. CCIX $21.11 92% $367 $673 $919 $142 $89 15.4% 9.7% 0.7x 7.5x
Average 92% $4,570 $5,021 $2,220 $789 $408 33.7% 17.8% 2.1x 11.7x
Median 95% $2,879 $3,718 $1,906 $606 $288 34.3% 16.4% 1.9x 11.7x
Enterprise Value /LTM LTM Margins LTM
Industry Sector Overview – Public Company Analysis
13Source: S&P Capital IQ
Electrical Equipment($ in millions, except per share)
HYDE PARK CAPITALInvestment Banking | Mergers & Acquisitions | Capital Raising
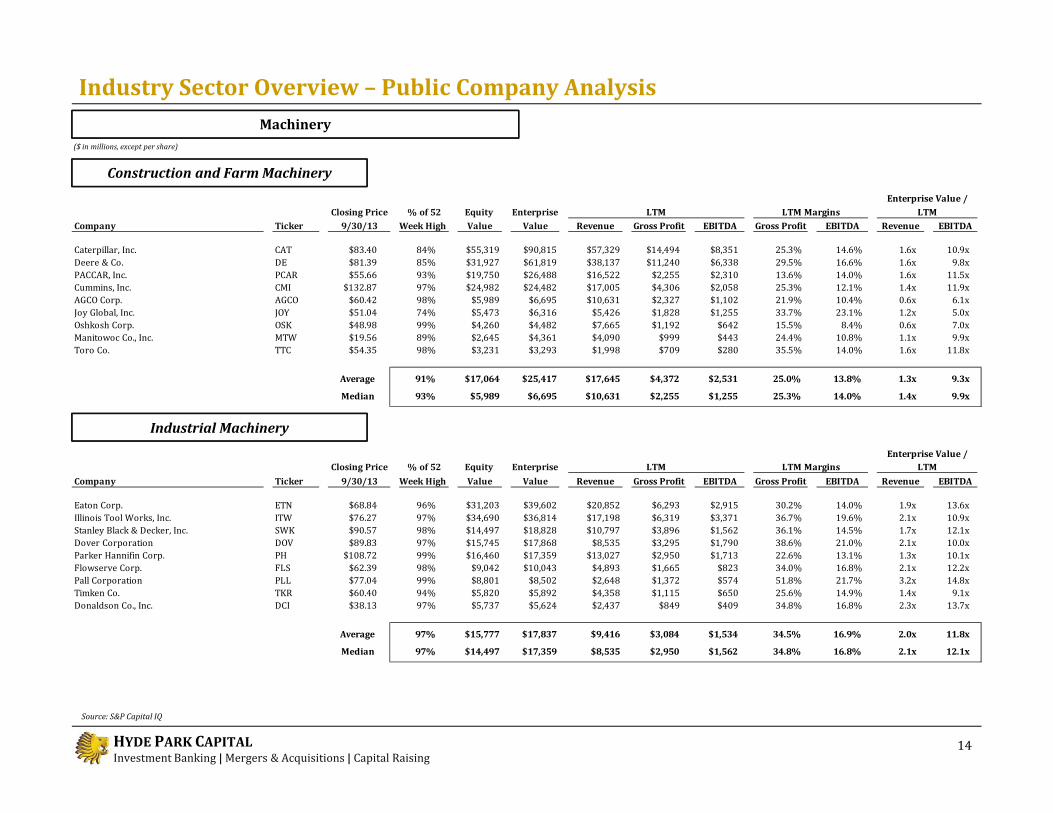
Closing Price % of 52 Equity EnterpriseCompany Ticker 9/30/13 Week High Value Value Revenue Gross Profit EBITDA Gross Profit EBITDA Revenue EBITDA Eaton Corp. ETN $68.84 96% $31,203 $39,602 $20,852 $6,293 $2,915 30.2% 14.0% 1.9x 13.6xIllinois Tool Works, Inc. ITW $76.27 97% $34,690 $36,814 $17,198 $6,319 $3,371 36.7% 19.6% 2.1x 10.9xStanley Black & Decker, Inc. SWK $90.57 98% $14,497 $18,828 $10,797 $3,896 $1,562 36.1% 14.5% 1.7x 12.1xDover Corporation DOV $89.83 97% $15,745 $17,868 $8,535 $3,295 $1,790 38.6% 21.0% 2.1x 10.0xParker Hannifin Corp. PH $108.72 99% $16,460 $17,359 $13,027 $2,950 $1,713 22.6% 13.1% 1.3x 10.1xFlowserve Corp. FLS $62.39 98% $9,042 $10,043 $4,893 $1,665 $823 34.0% 16.8% 2.1x 12.2xPall Corporation PLL $77.04 99% $8,801 $8,502 $2,648 $1,372 $574 51.8% 21.7% 3.2x 14.8xTimken Co. TKR $60.40 94% $5,820 $5,892 $4,358 $1,115 $650 25.6% 14.9% 1.4x 9.1xDonaldson Co., Inc. DCI $38.13 97% $5,737 $5,624 $2,437 $849 $409 34.8% 16.8% 2.3x 13.7x
Average 97% $15,777 $17,837 $9,416 $3,084 $1,534 34.5% 16.9% 2.0x 11.8x
Median 97% $14,497 $17,359 $8,535 $2,950 $1,562 34.8% 16.8% 2.1x 12.1x
Enterprise Value /LTM LTM Margins LTM
Closing Price % of 52 Equity EnterpriseCompany Ticker 9/30/13 Week High Value Value Revenue Gross Profit EBITDA Gross Profit EBITDA Revenue EBITDA Caterpillar, Inc. CAT $83.40 84% $55,319 $90,815 $57,329 $14,494 $8,351 25.3% 14.6% 1.6x 10.9xDeere & Co. DE $81.39 85% $31,927 $61,819 $38,137 $11,240 $6,338 29.5% 16.6% 1.6x 9.8xPACCAR, Inc. PCAR $55.66 93% $19,750 $26,488 $16,522 $2,255 $2,310 13.6% 14.0% 1.6x 11.5xCummins, Inc. CMI $132.87 97% $24,982 $24,482 $17,005 $4,306 $2,058 25.3% 12.1% 1.4x 11.9xAGCO Corp. AGCO $60.42 98% $5,989 $6,695 $10,631 $2,327 $1,102 21.9% 10.4% 0.6x 6.1xJoy Global, Inc. JOY $51.04 74% $5,473 $6,316 $5,426 $1,828 $1,255 33.7% 23.1% 1.2x 5.0xOshkosh Corp. OSK $48.98 99% $4,260 $4,482 $7,665 $1,192 $642 15.5% 8.4% 0.6x 7.0xManitowoc Co., Inc. MTW $19.56 89% $2,645 $4,361 $4,090 $999 $443 24.4% 10.8% 1.1x 9.9xToro Co. TTC $54.35 98% $3,231 $3,293 $1,998 $709 $280 35.5% 14.0% 1.6x 11.8x
Average 91% $17,064 $25,417 $17,645 $4,372 $2,531 25.0% 13.8% 1.3x 9.3x
Median 93% $5,989 $6,695 $10,631 $2,255 $1,255 25.3% 14.0% 1.4x 9.9x
Enterprise Value /LTM LTM Margins LTM
Industry Sector Overview – Public Company Analysis
Construction and Farm Machinery
($ in millions, except per share)
14
Industrial Machinery
Machinery
Source: S&P Capital IQ

HYDE PARK CAPITALInvestment Banking | Mergers & Acquisitions | Capital Raising
Closing Price % of 52 Equity EnterpriseCompany Ticker 9/30/13 Week High Value Value Revenue Gross Profit EBITDA Gross Profit EBITDA Revenue EBITDA W.W. Grainger, Inc. GWW $261.71 95% $18,511 $18,600 $9,287 $4,100 $1,485 44.1% 16.0% 2.0x 12.5xFastenal Co. FAST $50.27 94% $14,961 $14,868 $3,270 $1,699 $775 52.0% 23.7% 4.5x 19.2xUnited Rentals, Inc. URI $58.29 97% $6,174 $13,405 $4,866 $1,915 $1,254 39.4% 25.8% 2.8x 10.7xGATX Corp. GMT $47.52 88% $2,251 $5,777 $1,296 $685 $499 52.9% 38.5% 4.5x 11.6xMSC Industrial Direct Co., Inc. MSM $81.35 93% $5,126 $5,363 $2,458 $1,119 $435 45.5% 17.7% 2.2x 12.3xWESCO International, Inc. WCC $76.53 95% $3,988 $5,505 $7,278 $1,507 $438 20.7% 6.0% 0.8x 12.6xWatsco, Inc. WSO $94.27 97% $3,038 $3,703 $3,682 $884 $284 24.0% 7.7% 1.0x 13.0xEnerSys ENS $60.63 99% $2,962 $2,916 $2,281 $561 $300 24.6% 13.2% 1.3x 9.7xApplied Industrial Technologies, Inc. AIT $51.50 96% $2,193 $2,116 $2,457 $688 $198 28.0% 8.1% 0.9x 10.7xTitan Machinery, Inc. TITN $16.07 50% $338 $1,195 $2,296 $356 $107 15.5% 4.7% 0.5x 11.1x
Average 90% $5,954 $7,345 $3,917 $1,351 $578 34.7% 16.1% 2.0x 12.3x
Median 95% $3,513 $5,434 $2,864 $1,001 $437 33.7% 14.6% 1.6x 11.9x
Enterprise Value /LTM LTM Margins LTM
Industry Sector Overview – Public Company Analysis
Trading Companies and Distributors
($ in millions, except per share)
15
Machinery
Source: S&P Capital IQ

HYDE PARK CAPITALInvestment Banking | Mergers & Acquisitions | Capital Raising
Closing Price % of 52 Equity EnterpriseCompany Ticker 9/30/13 Week High Value Value Revenue Gross Profit EBITDA Gross Profit EBITDA Revenue EBITDAIron Mountain, Inc. IRM $27.02 68% $5,126 $8,993 $3,016 $1,725 $832 57.2% 27.6% 3.0x 10.8xCintas Corp. CTAS $51.20 98% $6,330 $7,356 $4,385 $1,809 $759 41.2% 17.3% 1.7x 9.7xPitney Bowes, Inc. PBI $18.19 97% $3,688 $6,856 $4,843 $2,387 $935 49.3% 19.3% 1.4x 7.3xKAR Auction Services, Inc. KAR $28.21 98% $3,941 $6,298 $2,068 $883 $468 42.7% 22.6% 3.0x 13.4xR.R. Donnelley & Sons Co. RRD $15.78 81% $2,859 $6,034 $10,279 $2,315 $1,198 22.5% 11.7% 0.6x 5.0xAvery Dennison Corp. AVY $43.52 93% $4,390 $5,146 $6,211 $1,652 $665 26.6% 10.7% 0.8x 7.7xCorrections Corp. of America CXW $34.55 83% $3,566 $4,678 $1,741 $500 $399 28.7% 22.9% 2.7x 11.7xCopart, Inc. CPRT $31.79 83% $4,126 $4,454 $1,046 $424 $335 40.5% 32.0% 4.3x 13.3xUnited Stationers, Inc. USTR $43.44 99% $1,751 $2,229 $5,106 $796 $260 15.6% 5.1% 0.4x 8.6xRitchie Bros. Auctioneers, Inc. RBA $20.18 86% $2,159 $2,124 $440 $391 $153 88.9% 34.8% 4.8x 13.9xHerman Miller, Inc. MLHR $29.18 98% $1,722 $1,851 $1,793 $627 $161 35.0% 9.0% 1.0x 11.5xThe Brink's Co. BCO $28.30 92% $1,382 $1,741 $3,991 $739 $328 18.5% 8.2% 0.4x 5.3x
Average 90% $3,420 $4,813 $3,743 $1,187 $541 38.9% 18.4% 2.0x 9.9x
Median 92% $3,627 $4,912 $3,503 $839 $434 37.7% 18.3% 1.5x 10.3x
Enterprise Value /LTM LTM Margins LTM
Closing Price % of 52 Equity EnterpriseCompany Ticker 9/30/13 Week High Value Value Revenue Gross Profit EBITDA Gross Profit EBITDA Revenue EBITDAWaste Management, Inc. WM $41.24 95% $19,307 $29,547 $13,917 $4,848 $3,400 34.8% 24.4% 2.1x 8.7xRepublic Services, Inc. RSG $33.36 94% $12,140 $19,084 $8,304 $3,070 $2,218 37.0% 26.7% 2.3x 8.6xStericycle, Inc. SRCL $115.40 96% $10,093 $11,449 $2,079 $987 $624 47.5% 30.0% 5.5x 18.4xWaste Connections, Inc. WCN $45.41 99% $5,630 $7,668 $1,892 $839 $632 44.4% 33.4% 4.1x 12.1xCovanta Holding Corp. CVA $21.38 98% $2,763 $4,968 $1,643 $653 $418 39.7% 25.4% 3.0x 11.9xClean Harbors, Inc. CLH $58.66 95% $3,382 $4,514 $2,815 $792 $403 28.1% 14.3% 1.6x 11.2xRollins, Inc. ROL $26.51 95% $3,874 $3,757 $1,319 $645 $225 48.9% 17.1% 2.8x 16.7xSims Metal Management, Ltd. ASX:SGM $8.92 84% $1,823 $1,957 $6,594 $503 ($5) 7.6% (0.1%) 0.3x NMTetra Tech, Inc. TTEK $25.89 82% $1,671 $1,738 $2,030 $268 $124 13.2% 6.1% 0.9x 14.0xSchnitzer Steel Industries, Inc. SCHN $27.50 83% $733 $1,106 $2,622 $207 $96 7.9% 3.7% 0.4x 11.5xCasella Waste Systems, Inc. CWST $5.75 99% $214 $714 $466 $136 $79 29.2% 16.9% 1.5x 9.1x
Average 93% $5,603 $7,864 $3,971 $1,177 $747 30.8% 18.0% 2.2x 12.2x
Median 95% $3,382 $4,514 $2,079 $653 $403 34.8% 17.1% 2.1x 11.7x
Enterprise Value /LTM LTM Margins LTM
Industry Sector Overview – Public Company Analysis
Environmental and Facilities Services
($ in millions, except per share)
16
Industrial Services
Source: S&P Capital IQ
Diversified Support Services

HYDE PARK CAPITALInvestment Banking | Mergers & Acquisitions | Capital Raising
Closing Price % of 52 Equity EnterpriseCompany Ticker 9/30/13 Week High Value Value Revenue Gross Profit EBITDA Gross Profit EBITDA Revenue EBITDAUnion Pacific Corp. UNP $155.34 94% $72,796 $80,885 $21,583 $9,813 $8,970 45.5% 41.6% 3.7x 9.0xCSX Corp. CSX $25.74 96% $26,326 $34,678 $11,910 $4,590 $4,590 38.5% 38.5% 2.9x 7.6xNorfolk Southern Corporation NSC $77.35 95% $24,528 $32,603 $11,048 $4,006 $4,001 36.3% 36.2% 3.0x 8.1xKansas City Southern KSU $109.36 92% $12,059 $14,056 $2,322 $933 $933 40.2% 40.2% 6.1x 15.1xJB Hunt Transport Services, Inc. JBHT $72.93 93% $8,727 $9,409 $5,448 $940 $812 17.3% 14.9% 1.7x 11.6xGenesee & Wyoming, Inc. GWR $92.97 97% $5,689 $7,324 $1,405 $503 $456 35.8% 32.5% 5.2x 16.1xRyder System, Inc. R $59.70 92% $3,079 $7,042 $6,385 $1,310 $1,438 20.5% 22.5% 1.1x 4.9xAMERCO UHAL $184.13 96% $3,596 $4,670 $2,638 $790 $761 29.9% 28.8% 1.8x 6.1xOld Dominion Freight Line, Inc. ODFL $45.99 97% $3,963 $4,157 $2,255 $626 $451 27.8% 20.0% 1.8x 9.2xCon-way, Inc. CNW $43.09 93% $2,454 $3,197 $5,479 $997 $423 18.2% 7.7% 0.6x 7.6xLandstar System, Inc. LSTR $55.98 93% $2,597 $2,610 $2,681 $598 $218 22.3% 8.1% 1.0x 12.0xWerner Enterprises, Inc. WERN $23.33 92% $1,716 $1,748 $2,021 $466 $296 23.1% 14.7% 0.9x 5.9x
Average 94% $13,961 $16,865 $6,265 $2,131 $1,946 29.6% 25.5% 2.5x 9.4x
Median 94% $4,826 $7,183 $4,065 $937 $787 28.9% 25.7% 1.8x 8.6x
LTMEnterprise Value /
LTM Margins LTM
Closing Price % of 52 Equity EnterpriseCompany Ticker 9/30/13 Week High Value Value Revenue Gross Profit EBITDA Gross Profit EBITDA Revenue EBITDAUnited Parcel Service, Inc. UPS $91.37 99% $87,236 $93,043 $55,033 $8,606 $4,199 15.6% 7.6% 1.7x 22.2x*FedEx Corp. FDX $114.11 96% $36,258 $34,155 $44,519 $11,402 $5,716 25.6% 12.8% 0.8x 6.0xCH Robinson Worldwide, Inc. CHRW $59.59 88% $9,578 $9,793 $12,134 $1,018 $777 8.4% 6.4% 0.8x 12.6xExpeditors International of Washington, Inc. EXPD $44.06 97% $9,200 $7,826 $5,976 $745 $589 12.5% 9.9% 1.3x 13.3xAtlas Air Worldwide Holdings, Inc. AAWW $46.03 84% $1,212 $2,422 $1,643 $456 $321 27.8% 19.5% 1.5x 7.6xHub Group, Inc. HUBG $39.23 95% $1,453 $1,391 $3,290 $369 $139 11.2% 4.2% 0.4x 10.0xForward Air Corp. FWRD $40.33 96% $1,227 $1,129 $627 $167 $107 26.7% 17.0% 1.8x 10.6x
Average 94% $20,881 $21,394 $17,603 $3,252 $1,693 18.3% 11.1% 1.2x 10.0x
Median 96% $9,200 $7,826 $5,976 $745 $589 15.6% 9.9% 1.3x 10.3x
LTMEnterprise Value /
LTM Margins LTM
Industry Sector Overview – Public Company Analysis
Air Freight and Logistics
($ in millions, except per share)
17
Transportation
Road and Rail
Source: S&P Capital IQ *Excluded from average and median calculation.
HYDE PARK CAPITALInvestment Banking | Mergers & Acquisitions | Capital Raising
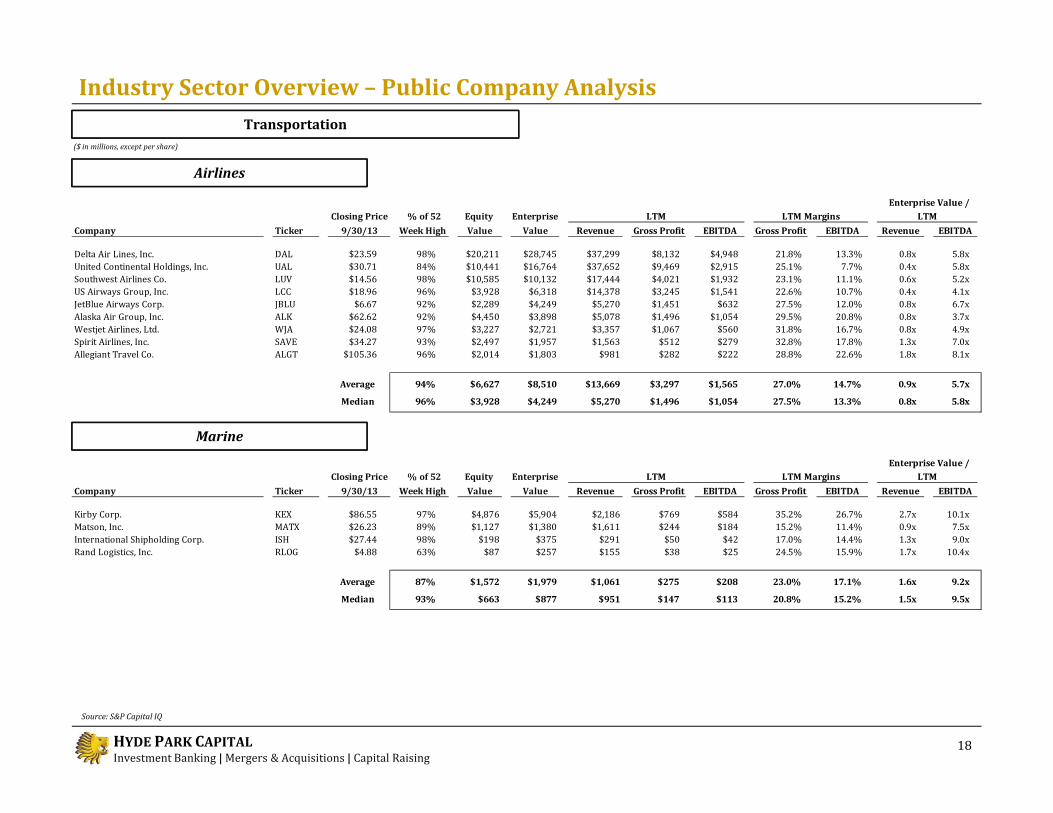
Closing Price % of 52 Equity EnterpriseCompany Ticker 9/30/13 Week High Value Value Revenue Gross Profit EBITDA Gross Profit EBITDA Revenue EBITDAKirby Corp. KEX $86.55 97% $4,876 $5,904 $2,186 $769 $584 35.2% 26.7% 2.7x 10.1xMatson, Inc. MATX $26.23 89% $1,127 $1,380 $1,611 $244 $184 15.2% 11.4% 0.9x 7.5xInternational Shipholding Corp. ISH $27.44 98% $198 $375 $291 $50 $42 17.0% 14.4% 1.3x 9.0xRand Logistics, Inc. RLOG $4.88 63% $87 $257 $155 $38 $25 24.5% 15.9% 1.7x 10.4x
Average 87% $1,572 $1,979 $1,061 $275 $208 23.0% 17.1% 1.6x 9.2x
Median 93% $663 $877 $951 $147 $113 20.8% 15.2% 1.5x 9.5x
Enterprise Value /LTM LTM Margins LTM
Closing Price % of 52 Equity EnterpriseCompany Ticker 9/30/13 Week High Value Value Revenue Gross Profit EBITDA Gross Profit EBITDA Revenue EBITDADelta Air Lines, Inc. DAL $23.59 98% $20,211 $28,745 $37,299 $8,132 $4,948 21.8% 13.3% 0.8x 5.8xUnited Continental Holdings, Inc. UAL $30.71 84% $10,441 $16,764 $37,652 $9,469 $2,915 25.1% 7.7% 0.4x 5.8xSouthwest Airlines Co. LUV $14.56 98% $10,585 $10,132 $17,444 $4,021 $1,932 23.1% 11.1% 0.6x 5.2xUS Airways Group, Inc. LCC $18.96 96% $3,928 $6,318 $14,378 $3,245 $1,541 22.6% 10.7% 0.4x 4.1xJetBlue Airways Corp. JBLU $6.67 92% $2,289 $4,249 $5,270 $1,451 $632 27.5% 12.0% 0.8x 6.7xAlaska Air Group, Inc. ALK $62.62 92% $4,450 $3,898 $5,078 $1,496 $1,054 29.5% 20.8% 0.8x 3.7xWestjet Airlines, Ltd. WJA $24.08 97% $3,227 $2,721 $3,357 $1,067 $560 31.8% 16.7% 0.8x 4.9xSpirit Airlines, Inc. SAVE $34.27 93% $2,497 $1,957 $1,563 $512 $279 32.8% 17.8% 1.3x 7.0xAllegiant Travel Co. ALGT $105.36 96% $2,014 $1,803 $981 $282 $222 28.8% 22.6% 1.8x 8.1x
Average 94% $6,627 $8,510 $13,669 $3,297 $1,565 27.0% 14.7% 0.9x 5.7x
Median 96% $3,928 $4,249 $5,270 $1,496 $1,054 27.5% 13.3% 0.8x 5.8x
Enterprise Value /LTM LTM Margins LTM
Industry Sector Overview – Public Company Analysis
Airlines
($ in millions, except per share)
18
Transportation
Marine
Source: S&P Capital IQ

HYDE PARK CAPITALInvestment Banking | Mergers & Acquisitions | Capital Raising
Closing Price % of 52 Equity EnterpriseCompany Ticker 9/30/13 Week High Value Value Revenue Gross Profit EBITDA Gross Profit EBITDA Revenue EBITDAGeneral Electric Co.* GE $23.89 96% $137,043 $144,466 $102,201 $28,465 $20,466 27.9% 20.0% 1.4x 7.1xSiemens Aktiengesellschaft SIE $120.73 98% $103,764 $121,135 $100,044 $27,895 $10,995 27.9% 11.0% 1.2x 11.0xUnited Technologies Corp. UTX $107.82 96% $98,461 $116,494 $62,310 $17,281 $11,088 27.7% 17.8% 1.9x 10.5x3M Company MMM $119.41 98% $83,426 $85,892 $30,689 $14,568 $7,867 47.5% 25.6% 2.8x 10.9xDanaher Corp. DHR $69.32 98% $49,214 $50,786 $18,827 $9,825 $4,235 52.2% 22.5% 2.7x 12.0xTyco International, Ltd. TYC $34.98 97% $16,248 $17,156 $10,614 $3,850 $1,381 36.3% 13.0% 1.6x 12.4x
Average 97% $81,359 $89,322 $54,114 $16,981 $9,339 36.6% 18.3% 1.9x 10.7x
Median 97% $90,944 $101,193 $46,500 $15,925 $9,431 32.1% 18.9% 1.7x 11.0x
Enterprise Value /LTM LTM Margins LTM
Industry Sector Overview – Public Company Analysis
($ in millions, except per share)
19
Industrial Conglomerates
Source: S&P Capital IQ* Note: General Electric Co. enterprise value and LTM financials excludes GE Capital

HYDE PARK CAPITALInvestment Banking | Mergers & Acquisitions | Capital Raising
Closing Price % of 52 Equity EnterpriseCompany Ticker 9/30/13 Week High Value Value Revenue Gross Profit EBITDA Gross Profit EBITDA Revenue EBITDAFreeport-McMoRan Copper & Gold, Inc. FCX $33.08 77% $32,551 $56,324 $19,549 $7,905 $7,236 40.4% 37.0% 2.9x 7.8xBarrick Gold Corp. ABX $18.64 46% $18,645 $34,183 $13,887 $6,037 $6,905 43.5% 49.7% 2.5x 5.0xSouthern Copper Corp. SCCO $27.24 65% $23,003 $25,081 $6,069 $3,255 $3,103 53.6% 51.1% 4.1x 8.1xGoldcorp, Inc. GG $26.01 55% $21,110 $22,745 $4,694 $2,230 $1,824 47.5% 38.9% 4.8x 12.5xNewmont Mining Corp. NEM $28.10 49% $13,948 $21,927 $8,629 $3,697 $2,799 42.8% 32.4% 2.5x 7.8xAlcoa Inc. AA $8.12 87% $8,816 $19,206 $23,345 $3,808 $2,589 16.3% 11.1% 0.8x 7.4xUnited States Steel Corp. X $20.59 78% $2,975 $6,219 $17,642 $1,343 $731 7.6% 4.1% 0.4x 8.5xWalter Energy, Inc. WLT $14.03 34% $878 $3,368 $1,849 $235 $75 12.7% 4.0% 1.8x 45.0x*
Average 61% $15,241 $23,632 $11,958 $3,564 $3,158 33.1% 28.6% 2.5x 8.1x
Median 60% $16,297 $22,336 $11,258 $3,476 $2,694 41.6% 34.7% 2.5x 7.8x
Enterprise Value /LTM LTM Margins LTM
Closing Price % of 52 Equity EnterpriseCompany Ticker 9/30/13 Week High Value Value Revenue Gross Profit EBITDA Gross Profit EBITDA Revenue EBITDAThe Dow Chemical Co. DOW $38.40 93% $48,425 $67,105 $56,611 $9,281 $6,789 16.4% 12.0% 1.2x 9.9xE.I. du Pont de Nemours and Co. DD $58.56 96% $54,737 $62,884 $35,547 $9,798 $5,580 27.6% 15.7% 1.8x 11.3xMonsanto Company MON $104.37 95% $56,328 $54,827 $14,861 $7,653 $4,186 51.5% 28.2% 3.7x 13.1xPraxair, Inc. PX $120.21 97% $35,990 $45,537 $11,714 $5,086 $3,585 43.4% 30.6% 3.9x 12.7xPotash Corp. of Saskatchewan, Inc. TSX:POT $31.31 71% $27,428 $30,451 $6,858 $2,916 $3,110 42.5% 45.3% 4.4x 9.8xAir Products & Chemicals, Inc. APD $106.57 93% $22,625 $28,981 $10,180 $2,708 $2,475 26.6% 24.3% 2.8x 11.7xThe Sherwin-Williams Co. SHW $182.18 94% $18,877 $19,821 $9,950 $4,488 $1,271 45.1% 12.8% 2.0x 15.6xEastman Chemical Co. EMN $77.90 94% $12,223 $16,511 $9,254 $2,311 $1,824 25.0% 19.7% 1.8x 9.1xCelanese Corp. CE $52.79 100% $8,442 $10,405 $6,395 $1,253 $956 19.6% 14.9% 1.6x 10.9xW.R. Grace & Co. GRA $87.40 97% $6,760 $6,335 $3,082 $1,152 $602 37.4% 19.5% 2.1x 10.5x
Average 93% $29,183 $34,286 $16,445 $4,665 $3,038 33.5% 22.3% 2.5x 11.5x
Median 95% $25,026 $29,716 $10,065 $3,702 $2,793 32.5% 19.6% 2.0x 11.1x
Enterprise Value /LTM LTM Margins LTM
Industry Sector Overview – Public Company Analysis
20
Materials($ in millions, except per share)
Chemicals
Metals and Mining
Source: S&P Capital IQ *Excluded from average and median calculation.

HYDE PARK CAPITALInvestment Banking | Mergers & Acquisitions | Capital Raising
Closing Price % of 52 Equity EnterpriseCompany Ticker 9/30/13 Week High Value Value Revenue Gross Profit EBITDA Gross Profit EBITDA Revenue EBITDAInternational Paper Co. IP $44.80 89% $20,023 $30,114 $28,906 $7,767 $3,677 26.9% 12.7% 1.0x 8.2xMeadWestvaco Corp. MWV $38.38 97% $6,902 $8,569 $5,540 $1,051 $778 19.0% 14.0% 1.5x 11.0xDomtar Corp. UFS $79.42 91% $2,706 $3,629 $5,359 $1,021 $568 19.1% 10.6% 0.7x 6.4xResolute Forest Products Inc. RFP $13.22 75% $1,255 $1,600 $4,439 $1,014 $387 22.8% 8.7% 0.4x 4.1x
Average 88% $7,722 $10,978 $11,061 $2,713 $1,353 21.9% 11.5% 0.9x 7.4x
Median 90% $4,804 $6,099 $5,450 $1,036 $673 20.9% 11.7% 0.9x 7.3x
Enterprise Value /LTM LTM Margins LTM
Industry Sector Overview – Public Company Analysis
21Source: Capital IQ
Materials($ in millions, except per share)
Paper and Forest Products
HYDE PARK CAPITALInvestment Banking | Mergers & Acquisitions | Capital RaisingMember FINRA/SIPC
Recent Transactions
HYDE PARK CAPITAL Investment Banking | Mergers & Acquisitions | Capital RaisingIntegrity | Expertise | Results
Hyde Park Capital Advisors, LLC701 N. Franklin StreetTampa, FL 33602Tel: 813-383-0202www.hydeparkcapital.com
John Hill Senior Managing Director [email protected](813) 383-0205John McDonaldSenior Managing [email protected](813) 383-0206Keith HodgdonSenior Vice [email protected](813) 383-0208Jeffrey Bridge Vice President [email protected](813) 383-0204Michael [email protected](813) 597-2649Charlie HendrickSenior [email protected](813) 383-0207