industry and trade summary, gloves · textiles and apparel sector. us itc publication number 2543...
TRANSCRIPT


PREFACE
In 1991 the United States International Trade Commission initiated its current Industry and Trade Summary series of informational reports on the thousands of products imported into and exported from the United States. Each summary addresses a different commodity/industry area and contains information on product uses, U.S. and foreign producers, and customs treatment. Also included is an analysis of the basic factors affecting trends in consumption, production, and trade of the commodity, as well as those bearing on the competitiveness of U.S. industries in domestic and foreign markets. I
This report on gloves generally covers the period 1987-1991 and represents 1 of approximately 250 to 300 individual reports to be produced in this series during the first half of the 1990s. This summary report is the second of the individual reports to be issued covering the textiles and apparel sector.
US ITC publication number
2543 (TX-1) 2580 (TX-2)
Publication date
August 1992 .......... . December 1992 ........ .
1itle
Nonwoven Fabrics Gloves
1 The information and analysis provided in this report are for the purpose of this report only. Nothing in this report should be construed to indicate how the Commission would find in an investigation conducted under statutory authority covering the same or similar subject matter.


CONTENTS
Page
Preface.............................................................................. 1
Introduction . . . . . . . . . . . . . . . . . . . . . . . . . . . . . . . . . . . . . . . . . . . . . . . . . . . . . . . . . . . . . . . . . . . . . . . . . 1
U.S. industry profile .... _.................. . . . . . . . . . . . . . . . . . . . . . . . . . . . . . . . . . . . . . . . . . . . . 1 Industry structure . . . . . . . . . . . . . . . . . . . . . . . . . . . . . . . . . . . . . . . . . . . . . . . . . . . . . . . . . . . . . . . . . . . . 1
Work gloves . . . . . . . . . . . . . . . . . . . . . . . . . . . . . . . . . . . . . . . . . . . . . . . . . . . . . . . . . . . . . . . . . . . . . . 3 Dress gloves . . . . . . . . . . . . . . . . . . . . . . . . . . . . . . . . . . . . . . . . . . . . . . . . . . . . . . . . . . . . . . . . . . . . . 4 Medical gloves . . . . . . . . . . . . . . . . . . . . . . . . . . . . . . . . . . . . . . . . . . . . . . . . . . . . . . . . . . . . . . . . . . . 4
Consumer characteristics and factors affecting demand . . . . . . . . . . . . . . . . . . . . . . . . . . . . . . . . . . . . . 7 Consumer and market description . . . . . . . . . . . . . . . . . . . . . . . . . . . . . . . . . . . . . . . . . . . . . . . . . . . . 7 Factors affecting demand . . . . . . . . . . . . . . . . . . . . . . . . . . . . . . . . . . . . . . . . . . . . . . . . . . . . . . . . . . . 7
Work gloves . . . . . . . . . . . . . . . . . . . . . . . . . . . . . . . . . . . . . . . . . . . . . . . . . . . . . . . . . . . . . . . . . . . . 7 Medical gloves . . . . . . . . . . . . . . . . . . . . . . . . . . . . . . . . . . . . . . . . . . . . . . . . . . . . . . . . . . . . . . . . . 7 Dress gloves . . . . . . . . . . . . . . . . . . . . . . . . . . . . . . . . . . . . . . . . . . . . . . . . . . . . . . . . . . . . . . . . . . . 7 Sports gloves . . . . . . . . . . . . . . . . . . . . . . . . . . . . . . . . . . . . . . . . . . . . . . . . . . . . . . . . . . . . . . . . . . . 7
Foreign industry profile . . . . . . . . . . . . . . . . . . . . . . . . . . . . . . . . . . . . . . . . . . . . . . . . . . . . . . . . . . . . . . . 9 China . . . . . . . . . . . . . . . . . . . . . . . . . . . . . . . . . . . . . . . . . . . . . . . . . . . . . . . . . . . . . . . . . . . . . . . . . . . . . 9 Malaysia . . . . . . . . . . . . . . . . . . . . . . . . . . . . . . . . . . . . . . . . . . . . . . . . . . . . . . . . . . . . . . . . . . . . . . . . . . . 10
U.S. trade measures . . . . . . . . . . . . . . . . . . . . . . . . . . . . . . . . . . . . . . . . . . . . . . . . . . . . . . . . . . . . . . . . . . 10 Tariff measures . . . . . . . . . . . . . . . . . . . . . . . . . . . . . . . . . . . . . . . . . . . . . . . . . . . . . . . . . . . . . . . . . . . . . 10 Nontariff measures . . . . . . . . . . . . . . . . . . . . . . . . . . . . . . . . . . . . . . . . . . . . . . . . . . . . . . . . . . . . . . . . . . 11
Foreign trade measures . . . . . . . . . . . . . . . . . . . . . . . . . . . . . . . . . . . . . . . . . . . . . . . . . . . . . . . . . . . . . . . 12 Tariff measures . . . . . . . . . . . . . . . . . . . . . . . . . . . . . . . . . . . . . . . . . . . . . . . . . . . . . . . . . . . . . . . . . . . . . 12 Nontariff measures . . . . . . . . . . . . . . . . . . . . . . . . . . . . . . . . . . . . . . . . . . . . . . . . . . . . . . . . . . . . . . . . . . 12
U.S. market . . . . . . . . . . . . . . . . . . . . . . . . . . . . . . . . . . . . . . . . . . . . . . . . . . . . . . . . . . . . . . . . . . . . . . . . . 13 Total U.S. glove consumption . . . . . . . . . . . . . . . . . . . . . . . . . . . . . . . . . . . . . . . . . . . . . . . . . . . . . . . . . 13 U.S. consumption of work gloves . . . . . . . . . . . . . . . . . . . . . . . . . . . . . . . . . . . . . . . . . . . . . . . . . . . . . . 13
Work glove shipments . . . . . . . . . . . . . . . . . . . . . . . . . . . . . . . . . . . . . . . . . . . . . . . . . . . . . . . . . . . . . . 13 U.S. imports of worlc gloves . . . . . . . . . . . . . . . . . . . . . . . . . . . . . . . . . . . . . . . . . . . . . . . . . . . . . . . . 13
U.S. consumption and imports of dress gloves .................................. ·.......... 15 U.S. consumption and imports of medical gloves . . . . . . . . . . . . . . . . . . . . . . . . . . . . . . . . . . . . . . . . . 15 U.S. consumption and imports of sports gloves . . . . . . . . . . . . . . . . . . . . . . . . . . . . . . . . . . . . . . . . . . . 17
Foreign markets.......................... . . . . . . . . . . . . . . . . . . . . . . . . . . . . . . . . . . . . . . . . . . . . 17 Foreign market profile . . . . . . . . . . . . . . . . . . . . . . . . . . . . . . . . . . . . . . . . . . . . . . . . . . . . . . . . . . . . . . . 17 U.S. Exports .... .'. . . . . . . . . . . . . . . . . . . . . . . . . . . . . . . . . . . . . . . . . . . . . . . . . . . . . . . . . . . . . . . . . . 17
Products exported . . . . . . . . . . . . . . . . . . . . . . . . . . . . . . . . . . . . . . . . . . . . . . . . . . . . . . . . . . . . . . . . . 17 Export trends . . . . . . . . . . . . . . . . . . . . . . . . . . . . . . . . . . . . . . . . . . . . . . . . . . . . . . . . . . . . . . . . . . . . . 17
U.S. trade balance . . . . . . . . . . . . . . . . . . . . . . . . . . . . . . . . . . . . . . . . . . . . . . . . . . . . . . . . . . . . . . . . . . . . 17
Figures 1. U.S. consumption of gloves by types, 1991 . . . . . . . . . . . . . . . . . . . . . . . . . . . . . . . . . . . . . . . . . . . . 2 2. End users in 1991 . . . . . . . . . . . . . . . . . . . . . . . . . . . . . . . . . . . . . . . . . . . . . . . . . . . . . . . . . . . . . . . . . 8 3. I>emand factors in work glove market . . . . . . . . . . . . . . . . . . . . . . . . . . . . . . . . . . . . . . . . . . . . . . . . 8
Tables 1. Structure of the U.S. fabric and leather glove industry.
SICs 2381 and 3151, 1972, 1977, 1982, 1987. 1990 . . . . . . . . . . . . . . . . . . . . . . . . . . . . . . . . 2 2. Distribution of shipments by establishment-size classes,
SICs 2381 and 3151, 1987, 1982, 1977 . . . . . . . . . . . . . . . . . . . . . . . . . . . . . . . . . . . . . . . . . . . 3
iii

CONTENTS-Continued
Tables-Continued 3. Comparison of new capital expenditures per employee for
fabric and leather glove sectors (SICs 2381 and 3151) apparel industry (SIC 23) and textile mill products
Page
industry (SIC 22), 1983-89 .. _ ....... _ ....................... ,....... . . . . . . . . . . . . . 5 4. New capital expenditures, SICs 2381 and 3151 combined.
1977, 1982, 1987 or net investment . . . . . . . . . . . . . . . . . . . . . . . . . . . . . . . . . . . . . . . . . . . . . . 5 5. Productivity analysis of U.S. fabric glove industry,
(SIC 2381), 1985-89 . . . . . . . . . . . . . . . . . . . . . . . . . . . . . . . . . . . . . . . . . . . . . . . . . . . . . . . . . . 6 6. Productivity analysis of U.S. leather glove industry,
(SIC 3151). 1985-89 . . . . . . . . . . . . . . . . . . . . . . . . . . . . . . . . . . . . . . . . . . . . . . . . . . . . . . . . . . 6 7. Comparison of trends in the U.S. industrial production index
and U.S. shipments and imports of work gloves, by quantity 1972-1990 . . . . . . . . . . . . . . . . . . . . . . . . . . . . . . . . . . . . . . . . . . . . . . . . . . . . . . . . . . . . . . . . . . . 9
8. Countries covered by binding quotas, quota year 1991 . . . . . . . . . . . . . . . . . . . . . . . . . . . . . . . . . . . 12 9. Tariffs on gloves, by country, by type, 1991 . . . . . . . . . . . . . . . . . . . . . . . . . . . . . . . . . . . . . . . . . . . 13 10. Gloves: U.S. shipments, exports of domestic merchandise,
imports for consumption, and apparent U.S. consumption, 1987-91 . . . . . . . . . . . . . . . . . . . . . . . . . . . . . . . . . . . . . . . . . . . . . . . . . . . . . . . . . . . . . . . . . . . . . 14
11. Work gloves: U.S. shipments, exports of domestic merchandise, imports for consumption, and apparent U.S. con-sumption, 1989-91 . . . . . . . . . . . . . . . . . . . . . . . . . . . . . . . . . . . . . . . . . . . . . . . . . . . . . . . . . . . . 14
12. Rubber unsupported work gloves: U.S. shipments, exports of domestic merchandise, imports for consumption, and apparent U.S. consumption. 1987-91 . . . . . . . . . . . . . . . . . . . . . . . . . . . . . . . . . . . . . . . . . . . . . . . . . . . . . 14
13. Dress gloves: U.S. shipments, exports of domestic merchandise, imports for consumption, and apparent U.S. consump-tion, 1989-91 . . . . . . . . . . . . . . . . . . . . . . . . . . . . . . . . . . . . . . . . . . . . . . . . . . . . . . . . . . . . . . . . 16
14. U.S. shipments of dress gloves by type, by quantity, 1976-89 . . . . .. . . . . . . .. . . .. . . . . . . . .. . . 16 15. Surgical and medical gloves: U.S. shipments, exports of
domestic merchandise, imports for consumption, and apparent U.S. consumption, 1987-91 . . . . . . . . . . . . . . . . . . . . . . . . . . . . . . . . . . . . . . . . . . . . . . . . . . . . . 16
B-1. Gloves: Harmonized Tariff Schedule subheading; description; U.S. col. 1 rate of duty as of Jan. 1, 1991; U.S. exports, 1991; and U.S. imports, 1991 . . . . . . . . . . . . . . . . . . . . . . . . . . . . . . . . . . . . . . . . . . . . . . . . . . . B-2
B-2. Gloves, including gloves for sports: U.S. exports of domestic · merchandise, imports for consumption, and merchandise trade balance, by selected countries and country groups, 1987-91 . . . . . . . . . . . . . . . . . . . . . . . . . . B-7
Appendixes A. Explanation of tariff and trade agreement terms . . . . . . . . . . . . . . . . . . . . . . . . . . . . . . . . . . . . . . . . A-1 B. Statistical tables . . . . . . . . . . . . . . . . . . . . . . . . . . . . . . . . . . . . . . . . . . . . . . . . . . . . . . . . . . . . . . . . . . B-1
iv

INTRODUCTION
Overseas sourcing has been the primary factor influencing production and trade trends in the U.S. glove industry . during th_e past decade. To a large extent, production has shifted to low-wage countries. Imports now account for slightly more than one-half of the U.S. glove market and for even higher shares in certain sectors - about 60 percent of the quantity in the work glove market and an estimated 90 percent in the sports glove market.· · U.S. ·dress and· sports glove producers began moving production operations as early as the 1950s to low-wage countries, chiefly in Asia. By the late 1970s, U.S. work glove producers also began to face competition from imports and many began sourcing from overseas operations. Even U.S. producers of rubber and plastic gloves have shifted production to countries such as Malaysia that also have large supplies of natural rubber. The manufacture of rubber and plastic gloves tends to be more capital-intensive than the production of other gloves.
Most companies that have maintained manufacturing facilities in the United States produce work gloves. Approximately 135 establishments produce work gloves, compared with fewer than 25 making dress gloves. In addition, less than 5 facilities produce sports gloves and about 15 make rubber and plastic gloves, 10 of which make medical gloves. For the most part, U.S. producers specialize in market nic~es,_ use the I:atest manufacturing technology, and mamtam product10n-sharing arrangements offshore or otherwise import gloves to complement their domestic output.
Domestic glove 1 producers are classified in the U.S. Standard Industrial Oassification (SIC) system primarily under SIC 2381, Fabric Dress and Work Gloves and Mittens, and SIC 3151, Leather Gloves and Mittens. Together these two industries, which make gloves by cutting and sewing fabrics and leather, produce roughly two-thirds of the gloves made in the United States, in terms of value. Other glove-producing facilities are classified in "basket" or residual SICs. Establishments that knit gloves from yam or make gloves from knit fabric made in the same facility are included in SIC 2259, Knitting Mills, and those that make rubber or plastic surgical, medical, and household gloves are classified in SIC 3069 Fabricated Rubber Products, or SIC 3089, Plasti~ Products. Producers of sports gloves are reported in SIC 3949, Sporting and Athletic Goods.
Industry data are not separately reported for glove firms classified in the residual SICs, because such
i The scope of this report includes gloves, mittens, and mitts of all types of materials ranging from textiles to fur to metal. Most of the discussion, however, focuses on gloves of textile materials, rubber, plastic, and leather. Data on domestic production and trade in gloves of less frequently used materials such as fur and metals are not available. In this report, the term "gloves" refers to gloves, mittens, and mitts.
producers often represent a small portion of manufacturing activity in these SIC industries. Therefore, this report will focus mainly on SICs 2381 and 3151 and on work gloves, which account for about 80 percent of the combined sales of SICs 2381 and 3151 and for slightly less than one-half the total domesti~ gl~ve market, as. shown in figure 1. Special emphasis _wdl also be given .to the medical glove sector, which underwent dynamic market events during the past 5 years.
U.S. INDUSTRY PROFILE
Industry Structure
_The U.S. glove industry declined considerably dunng the past two decades, as shown in table 1. Between 1972 and 1990, at least 70 companies and an estimated 88 establishments went out of business. Employment dropped by one-half, and shipments, in real terms, fell by 54 percent. Although the contraction of the industry was widespread, affecting small and large producers alike, the larger firms were particularly affected. Establishments employing at least 100 workers decreased in number by almost two-thirds since 1977, and their share of industry shipments declined by one-third, as shown in table 2. In contrast establishments each with a workforce of between 20 and 49 workers, although having declined slightly in number, expanded their share of industry shipments substantially. The industry now operates on a much small~r scale than it did two decades ago, with estabhshments, on average, employing 50 workers each, versus about 70 during the 1970s.
The domestic industry had few options for cost saving adjustments, other than overseas sourcing in response to competition from lower priced imports. The high labor intensity of most production processes is a major characteristic of the industry, placing U.S. producers at a significant cost disadvantage. Labor costs account for approximately one-third of the value added in glove production and U.S. wage rates are often 5 to 10 times higher than those in the low-cost glove-producing countries, such as China, which reportedly bas wage rates as low as 35e an hour in some provinces.
The potential has been limited for cost savings through upstream or horizontal integration. In general, the scale of manufacturing in the glove industry is too small to justify investment in upstream operations such as fabric weaving. The only known vertically integrated firm is a large U.S. work glove producer that ow~s. and operates its own U.S. leather tannery. In addition, glove producers generally specialize in work dress, medical, or sports gloves because of difference~ in production, materials, and channels of distribution for each glove type. The principal exception is the rubber and plastic glove segment, where the major producers of unsupported rubber and plastic gloves
1

Figure 1 U.S. Consumption of gloves by types, 1991
Medical gloves $324 20%
(In millions of dollars)
Work gloves $725 45%
Sport gloves $314 20%
Dress gloves $246 15%
Source: Estimated from U.S. Department of Commerce data.
Table 1 Structure of the U.S. fabric and leather glove industry, SICs 2381 and 3151,1 1972, 1977, 1982, 1987,1990
Item 1972 1977 1982 1987 1990
Number of companies ........... 201 184 158 129 (2) Number of establishments ....... 243 233 198 159 3155 Number of employees (1,000) .... 16.8 16.4 10.7 7.9 37.2 Number of production
(2) workers (1,000) .............. 15.2 14.6 9.4 7.0 Value of shipments
4406.6 million dollars) ............... 297.0 490.4 386.0 365.6 Value of shipments (constant
1972 dollars)5 ................ 297.0 296.3 159.4 137.7 4135.7
1 The work glove sector accounted for 84 percent of combined shipments of SICs 2381 and 3151 during 1972-86, and the dress glove sector accounted for the remaining 16 percent.
2 Not available. 3 Estimated based on trends compiled by the U.S. Department of Labor. 4 Data from Current Industrial Report, "Gloves and Mittens," 1990, MA23D(90)-1, and may not be comparable to
previous years since survey was revised for 1990. 5 Data are partially estimated using the Producer Price Index for SIC 2381. Producer Price Index data for SIC
3151 are not available for years before 1985. Shipments of fabric gloves classified in SIC 2381 accounted for approximately two-thirds of the total value of combined shipments of SICs 2381 and 3151.
Source: Compiled from official statistics of the U.S. Department of Commerce.
2
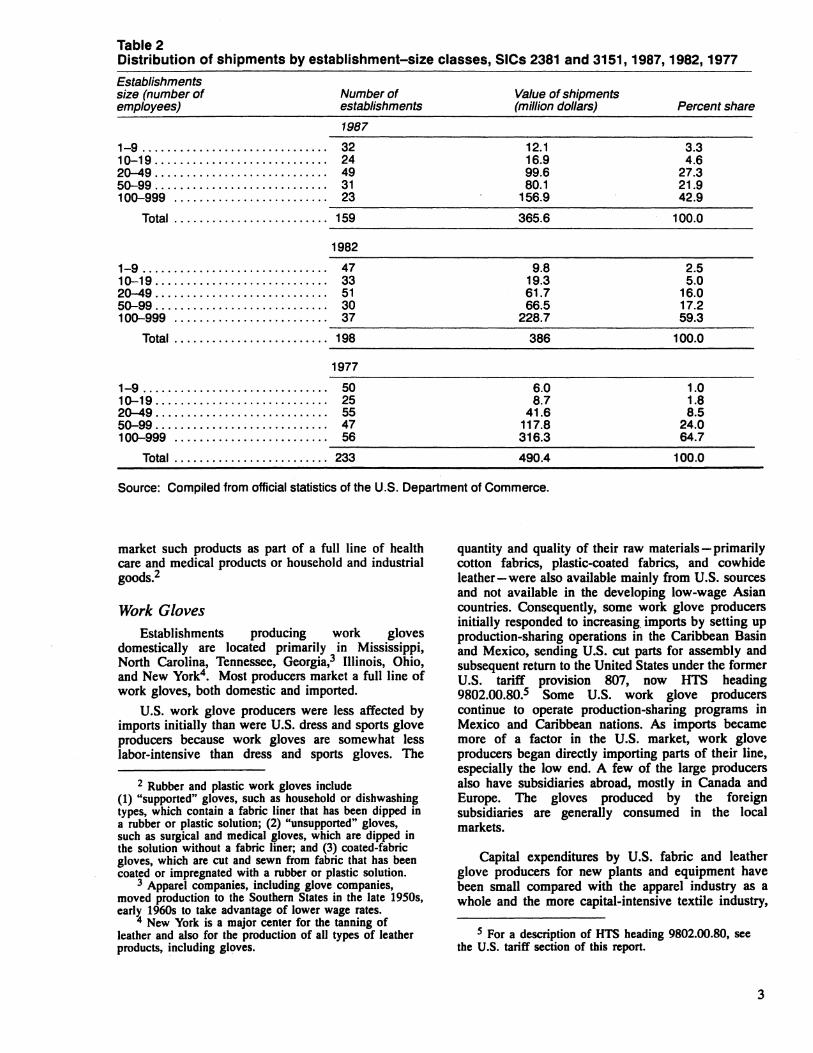
Table 2 Distribution of shipments by establishment-size classes, SICs 2381 and 3151, 1987, 1982, 1977
Establishments size (number of employees)
Number of establishments
1987
1-9.............................. 32 10-19............................ 24 2Q-49............................ 49 50-99............................ 31 100-999 . . . . . . . . . . . . . . . . . . . . . . . . . 23
Value of shipments (million dollars) Percent share
12.1 3.3 16.9 4.6 99.6 27.3 80.1 21.9
156.9 42.9 ~~~~~~~~~~~~~~~~~~~~~~~~~~-
To ta I ......................... 159
1982
1-9.............................. 47 10-19............................ 33 2Q-49............................ 51 50-99............................ 30 100-999 . . . . . . . . . . . . . . . . . . . . . . . . . 37
365.6
9.8 19.3 61.7 66.5
228.7
100.0
2.5 5.0
16.0 17.2 59.3
~~~~~~~~~~~~~~~~~~~~~~~~~~-
To ta I ......................... 198
1977
1-9.............................. 50 10-19............................ 25 2Q-49............................ 55 50-99............................ 47 100-999 . . . . . . . . . . . . . . . . . . . . . . . . . 56
386
6.0 8.7
41.6 117.8 316.3
100.0
1.0 1.8 8.5
24.0 64.7
~~~~~~~~~~~~~~~~~~~~~~~~~~-
To ta I ......................... 233 490.4 100.0
Source: Compiled from official statistics of the U.S. Department of Commerce.
market such products as part of a full line of health care and medical products or household and industrial goods.2
Work Gloves Establishments producing work gloves
domestically are located primarily in Mississippi, North Carolina, Tennessee, Georgia, 3 Illinois, Ohio, and New York4• Most producers market a full line of work gloves, both domestic and imported.
U.S. work glove producers were less affected by imports initially than were U.S. dress and sports glove producers because work gloves are somewhat less labor-intensive than dress and sports gloves. The
2 Rubber and plastic work gloves include (1) "supported" gloves, such as household or dishwashing types, which contain a fabric liner that has been dipped in a rubber or plastic solution; (2) "unsupported" gloves, such as surgical and medical gloves, which are dipped in the solution without a fabric liner; and (3) coated-fabric gloves, which are cut and sewn from fabric that has been coated or impregnated with a rubber or plastic solution.
3 Apparel companies, including glove companies, moved production to the Southern States in the late 1950s, earlY. 1960s to take advantage of lower wage rates.
" New York is a major center for the tanning of leather and also for the production of all types of leather products, including gloves.
quantity and quality of their raw materials-primarily cotton fabrics, plastic-coated fabrics, and cowhide leather-were also available mainly from U.S. sources and not available in the developing low-wage Asian countries. Consequently, some work glove producers initially responded to increasing_ imports by setting up production-sharing operations in the Caribbean Basin and Mexico, sending U.S. cut parts for assembly and subsequent return to the United States under the former U.S. tariff provision 807, now HTS heading 9802.00.80.s Some U.S. work glove producers continue to operate production-sharing programs in Mexico and Caribbean nations. As imports became more of a factor in the U.S. market, work glove producers began directly importing parts of their line, especially the low end. A few of the large producers also have subsidiaries abroad, mostly in Canada and Europe. The gloves produced by the foreign subsidiaries are generally consumed in the local markets.
Capital expenditures by U.S. fabric and leather glove producers for new plants and equipment have been small compared with the apparel industry as a whole and the more capital-intensive textile industry,
s For a description of HTS heading 9802.00.80, see the U.S. tariff section of this report.
3

as shown in table 3.6 As seen in table 4, new capital expenditures declined by more than one-half during 1977-87 to $2.1 million, due in part to the overall contraction of the industry. Companies drew down on assets, as evidenced by the negative net investment in 1982 and 1987. In the latter year, depreciation charges were $1.5 million higher than new investment.
Technology in the work glove sector has remained basically unchanged. A major exception has been the development of computer-controlled knitting machines by the Japanese during the past decade. Only recently, however, has demand for this type of glove been sufficient enough to justify substantial investment in these machines. 7 The increased automation has provided domestic producers with an avenue to compete with the lower cost imports.
There are other research and development efforts underway to further automate the production of work gloves. However, most of this sector's research and development efforts are concentrated in creating new and differentiated products for industrial use. Examples are the developments of seamless knit Kevlar gloves used by the automobile industry, (for worker protection in areas where cutting, abrading, scraping, and slashing of arms and hands are a problem), and of seamless gloves knitted of stainless steel yarns used in meat cutting and other applications where sharp blades are involved but not high heat.8
At least partially as a result of the technological change, worker productivity increased somewhat in the fabric work glove sector during 1985-89, as shown in table 5. Not only did the output per production worker hour go up from 2.1 dozen pairs in 1985 to 3.3 dozen pairs in 1989, but the average price of a dozen pairs of fabric gloves dropped from $12.33 in 1985 to $7.85 in 1989.9 Some productivity gains were also seen in the leather glove area as shown in table 6. However, these were not influenced by increased automation, since automation is very difficult in the leather glove area because of the materials used. Industry sources reported streamlining production operations and increased overall efficiency as contributing to the increased productivity in . this sector.
6 Although data in tables 3 and 4 cover both the fabric and leather areas of the work and dress glove sectors of the U.S. glove industry, the data are generalized to apply to the work glove sector, which dominated in terms of production, accounting for approximately 80 percent during 1989.
7 Industry sources report that it took considerable marketing efforts to gain consumer acceptance of the gloves knitted on these machines.
8 Smith, William C., "Golden Needles Finds Its Silver Threads In Gloves," Textile World, Feb. 1989, pp. 56-57.
9 The drop in the average price also reflects changes in the product mix as work gloves made of rubber and plastic coated or partially coated fabrics were classified as fabric gloves in SIC 2381 only in 1985 and 1986.
4
Dress Gloves The U.S. dress glove sector is concentrated in
Wisconsin, New York, and the New England States. The sector shrank in size more than three decades ago primarily because of the highly labor-intensive production of sewn dress gloves. Many companies operate either production facilities or assembly operations in the Philippines and other low-cost Asian countries. Dress glove producers were initially attracted to the Philippines during the 1950s by preferential U.S. duty rates that existed at that time and by an abundance of skilled low-cost labor. The remaining domestic dress glove producers tend to specialize in the production of high-priced leather dress gloves and knitted dress gloves made on knitting machines. The production of knitted dress gloves has been automated for some time.
Medical Gloves The medical glove sector is located primarily in
Alabama, Ohio, Texas, and California. It went through a period of restructuring during 1989 and 1990 when several of the dominant firms moved production to the Far East, mainly Malaysia, and others ceased operations altogether. Demand for surgical and medical examination gloves escalated rapidly during 1987 and 1988 as concern grew over AIDS and other infectious diseases. By late 1987 and 1988, U.S. demand exceeded supply, resulting in a "shortage"IO or a stockpiling of the gloves by distributors and ultimate end users. Responding to expectations that U.S. demand would remain strong and that demand would increase in other countries, established U.S. and foreign producers expanded capacity and new producers entered the market-a few in the United States and many in the Far East. Consequently, world capacity increased dramatically. Some U.S. producers expanded primarily in the Far East, particularly Malaysia, the world's primary source of natural latex. The worldwide rush to meet the demand resulted in a large number of poor-quality gloves arriving in the U.S. market. Responding to these quality problems, the Food and Drug Administration (FDA) issued product standards that set minimum quality requirements on both the domestic and imported latex medical exam gloves. (FDA minimum quality requirements were already in place on latex surgeons' gloves.) By 1989, when most of the new capacity became operational, the "shortage" ended, leaving many distributors and ultimate consumers in the medical community with large inventories of the gloves. U.S. wholesale prices for the medical exam gloves (both imported and domestic), which had escalated from approximately an average of $4 per 100 in 1986 to a high of $8 to $10 in 1988, dropped to reported lows of $4 per 100 in 1989 and to $2.50 in 1990.11 Many of the newly created
10 In this report, the word "shortage" means that the product cannot always be purchased at traditional prices in desired quantities, but does not mean that supplies are not available at the prevailing market price.
11 The 1990 prices were published in "Still Bouncing with Potential," by Ngam Su May, Malaysian Business, Feb. 16-28, 1990, p. 44.
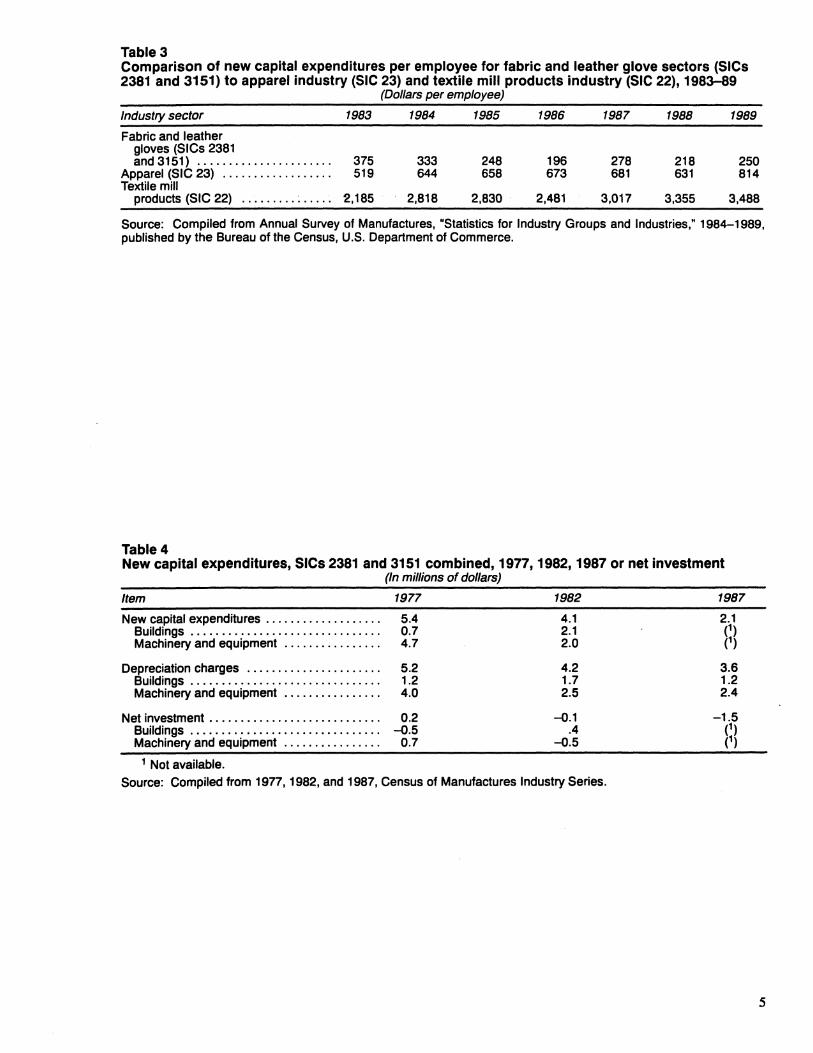
Table3 Comparison of new capital expenditures per employee for fabric and leather glove sectors (SICs 2381 and 3151) to apparel industry (SIC 23) and textile mill products industry (SIC 22), 1983-89
Industry sector
Fabric and leather gloves (SICs 2381 and 3151) ..................... .
Apparel (SIC 23) ................. . Textile mill
products (SIC 22) ......... ~ .... .
1983
375 519
2,185
(Dollars per employee)
1984 1985
333 644
2,818
248 658
2,830
1986
196 673
2,481
1987
278 681
3,017
1988
218 631
3,355
1989
250 814
3,488
Source: Compiled from Annual Survey of Manufactures, ustatistics for Industry Groups and Industries," 1984-1989, published by the Bureau of the Census, U.S. Department of Commerce.
Table4 New capital expenditures, SICs 2381 and 3151 combined, 1977, 1982, 1987 or net investment
(In millions of dollars)
Item
New capital expenditures .................. . Buildings .............................. . Machinery and equipment ............... .
1977
5.4 0.7 4.7
Depreciation charges . . . . . . . . . . . . . . . . . . . . . . 5.2 Buildings . . . . . . . . . . . . . . . . . . . . . . . . . . . . . . . 1.2 Machinery and equipment . . . . . . . . . . . . . . . . 4.0
Net investment . . . . . . . . . . . . . . . . . . . . . . . . . . . . 0.2 Buildings . . . . . . . . . . . . . . . . . . . . . . . . . . . . . . . -0.5 Machinery and equipment . . . . . . . . . . . . . . . . 0.7
1 Not available.
1982
4.1 2.1 2.0
4.2 1.7 2.5
-0.1 .4
-0.5
Source: Compiled from 19n, 1982, and 1987, Census of Manufactures Industry Series.
1987
3.6 1.2 2.4
-1.5 (1) (1)
s
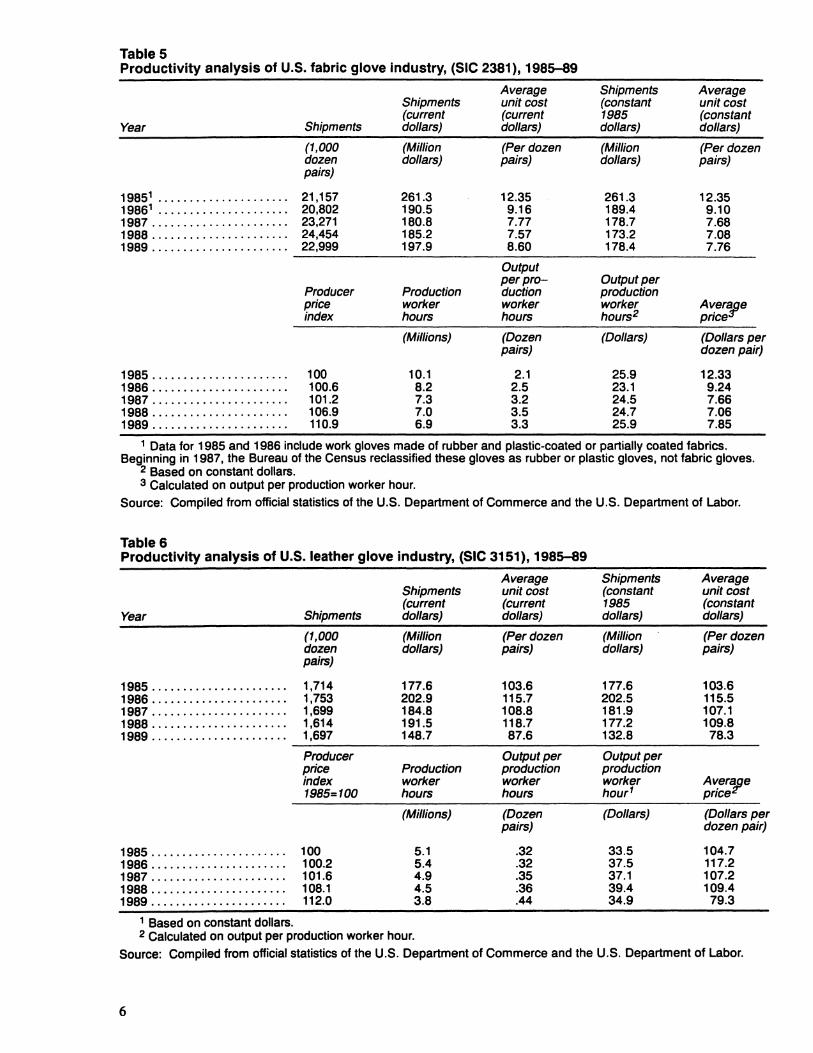
Table 5 Productivity analysis of U.S. fabric glove industry, (SIC 2381), 1985-89
Shipments Average unit cost
(current (current Year Shipments dollars) dollars)
(1,000 (Million (Per dozen dozen dollars) pairs) pairs)
19851 ..•.................. 21,157 261.3 12.35 19861 ......•.............. 20,802 190.5 9.16 1987 ...................... 23,271 180.8 7.77 1988 ...................... 24,454 185.2 7.57 1989 ...................... 22,999 197.9 8.60
Output per pro-
Producer Production duction price worker worker index hours hours
(Millions) (Dozen pairs)
1985 ...................... 100 10.1 2.1 1986 ...................... 100.6 8.2 2.5 1987 .......•.............. 101.2 7.3 3.2 1988 ...................... 106.9 7.0 3.5 1989 ........•........•.... 110.9 6.9 3.3
Shipments (constant 1985 dollars)
(Million dollars)
261.3 189.4 178.7 173.2 178.4
Output per production worker hours2
(Dollars)
25.9 23.1 24.5 24.7 25.9
Average unit cost (constant dollars)
(Per dozen pairs)
12.35 9.10 7.68 7.08 7.76
Av_erape pnce
(Dollars per dozen pair)
12.33 9.24 7.66 7.06 7.85
1 Data for 1985 and 1986 include work gloves made of rubber and plastic-coated or partially coated fabrics. Beginning in 1987, the Bureau of the Census reclassified these gloves as rubber or plastic gloves, not fabric gloves.
2 Based on constant dollars. 3 Calculated on output per production worker hour.
Source: Compiled from official statistics of the U.S. Department of Commerce and the U.S. Department of Labor.
Table& Productivity analysis of U.S. leather glove Industry, (SIC 3151), 1985-89
Average Shipments Average Shipments unit cost (constant unit cost (current (current 1985 (constant
Year Shipments dollars) dollars) dollars) dollars)
(1,000 (Million (Per dozen (Million (Per dozen dozen dollars) pairs) dollars) pairs) pairs)
1985 ............•......... 1,714 177.6 103.6 177.6 103.6 1986 ....•............•.... 1,753 202.9 115.7 202.5 115.5 1987 ................•..... 1,699 184.8 108.8 181.9 107.1 1988 ...•.....•............ 1,614 191.5 118.7 177.2 109.8 1989 ...................... 1,697 148.7 87.6 132.8 78.3
Producer Output per Output per price Production production production index worker worker worker Av_erape 1985=100 hours hours hour1 pnce
(Millions) (Dozen (Dollars) (Dollars per pairs) dozen pair)
1985 ...................... 100 5.1 .32 33.5 104.7 1986 ..•................... 100.2 5.4 .32 37.5 117.2 1987 ...................... 101.6 4.9 .35 37.1 107.2 1988 .................•.... 108.1 4.5 .36 39.4 109.4 1989 ...................... 112.0 3.8 .44 34.9 79.3
1 Based on constant dollars. 2 Calculated on output per production worker hour.
Source: Compiled from official statistics of the U.S. Department of Commerce and the U.S. Department of Labor.
6

foreign suppliers, especially those producing low-quality gloves, dropped out of the market. The U.S. industry was left with approximately 10 firms. Two of the largest producers, Baxter International, Inc. and Ansell, closed some of their domestic operations during 1989 and 1990, moving production to the Far East. Baxter built the largest latex glove-making plant in Malaysia in 1988.12 Ansell owns one plant in Thailand and three in Malaysia, and built a new plant in Sri Lanka.13 Other U.S. producers, namely Smith and Nephew Perry, Tillitson Rubber Co., Aladan, and Phoenix Medical Supply Co. were forced to lay off employees as they cut back production of the gloves. Smith and Nephew Perry ceased all U.S. production of medical examination gloves and focused its domestic production on surgical gloves.14
1\vo of the ten U.S. producers are foreign owned; Ansell is a subsidiary of the Australian conglomerate Pacific Dunlop, Ltd., and Smith and Nephew Perry is a division of the British company, Smith and Nephew, Ltd. Most members of the U.S. industry produce both domestically and abroad. Only three companies are believed to produce in the United States exclusively.
Consumer Characteristics and Factors Affecting Demand
Consumer and Market Description
Consumers and markets for the major types of gloves (work, dress, medical, and sports) are distinct. Work gloves are sold directly or through distributors to three consumer end-user groups (retail establishments, industrial users, and the U.S. Government) as shown in the figure 2 on the following page. Distributors have a well-defined position in the U.S. work glove market, especially in the industrial segment. Many of these market entire lines of safety equipment. Distributors hold inventory and automatically restock for end-user industries. The role of distributors in the retail market has diminished somewhat as manufacturers of work gloves are more efficiently able to perform distributor services with the aid of computers.
Dress and sports gloves are sold primarily through retail establishments. Medical gloves are sold either directly or through medical supply houses to medical facilities such as hospitals and doctors' offices.
Factors Affecting Demand
Work gloves
Demand for work gloves in the industrial market and for work gloves purchased by the retail consumer
12 Appleby, Charles R., "Dearth of Medical Gloves Tums Into an Oversupply," HealthWeek, Mar. 26, 1990, p. 41.
13 "U.S. Latex Glove Makers Struggle to Keep Up," Rubber and Plastics News, Oct. 1, 1990, pp. 9, 28.
14 Ibid.
for use on the job is directly related to the level of activity in major end-user industries. Figure 3 and table 7 show the relationship between the level of U.S. industrial activity and U.S. consumption of work gloves over the past 20 years. The chart clearly shows that for most of 1979-90, the trend in U.S. consumption closely tracks the trend in U.S. industrial production. Demand for work gloves is also affected by the needs of the U.S. military, Federal inspectors, and State and county employees, such as police and fire fighters.
Industry sources report that demand for work gloves sold in the retail market is also significantly affected by weather conditions, with considerably more work gloves being sold in colder weather. Sales of work gloves at the retail level are also boosted by advertising and attractive styling displays.
U.S. work glove producers work closely with U.S. industry in the development of high quality, specialty gloves and in glove usage, providing technical advice and service.
Medical gloves
The demand for medical gloves has been greatly influenced by the spread of AIDS and other infectious diseases, as discussed previously in the section on the U.S. medical glove sector in this report.
Dress gloves
The principal factors influencing consumer purchases of dress gloves are price, quality, style, and the weather. In the dress glove market, fashion, brand name recognition, and advertising diminish somewhat the influence of price on consumer purchasing decisions. U.S. Government purchases for the U.S. military are also important to the few remaining domestic dress glove producers. Trade literature reported in 1991 that Rubin Gloves, Inc. of Gloversville, NY, was awarded a $4 million contract with the U.S. Defense Department to produce 300,000 pairs of black dress gloves.15 To implement the program, a spokesman for Rubin Gloves predicted employment to increase from 50 to 150 people in its glove-manufacturing facility. Another U.S. glove producer, Hawkin Fabrics, also of Gloversville, NY, was awarded a Government contract to produce cold weather inserts for the U.S. armed forces.16
Sports gloves
The demand for sports gloves is largely influenced by consumer interest in different sports activities, such as skiing, golf, and bicycling. Sales are also boosted by sty le, fashion, and advertising.
15 "Rubin Glove Gets Military Contract," Daily News Record, Jan. 30, 1991, p. 10.
16 "Glove Company Receives Military Contract," Capital District Business Review, Albany, NY, Jan. 6, 1991, p. 6.
7

Figure 2 End users in 1991
Work Gloves I I
I I I Industrial Market .. Retail Market U.S. Government
65% (30%) (5%) I I I
Automobile manufacture Home use Military personnel
I I I
Mining I
Job use I Federal inspectors
I I
Building construction Food inspectors
I
Nuclear power plants
Source: Compiled by USITC staff.
Figure 3 Demand factors in work glove market
• • IPI I .. , __ ,.., U.S. Consumption . •---
-20 1979 1980 1981 1982 1983 1984 1985 1986 1987 1988 1989 1990
Source: U.S. Government statistics. IPI = Industrial Production Index. U.S. Consumption = U.S. shipments plus U.S. imports.
8

Table 7 Comparison of trends in the U.S. industrial production index and U.S. shipments and imports of work gloves,1 by quantity, 1972-1990
Industrial U.S. Year production index U.S. shipments U.S. imports consumption2
1972 ..................... . 1973 ..................... . 1974 ..................... . 1975 ..................... . 1976 ....... : .............. -1977 ..................... . 1978 ..................... . 1979 ................... ~ .. 1980 ..................... . 1981 ..................... . 1982 ..................... . 1983 ..................... . 1984 ..................... . 1985 ..................... . 1986 ..................... . 1987 ..................... . 1988 ..................... . 1989 ..................... . 1990 ..................... .
(1987=100) 68.3 73.8 72.7 66.3 72.4 78.2 82.6 85.7 84.1 85.7 81.9 84.9 92.8 94.4 95.3
100.0 105.4 108.1 109.2
31,759 33,428 33,173 25,456 26,569 33,247 34,271 35,299
428,482 28,344 22,103 19,265 22,320 20,970 22,437
524,559 25,060 24,757 25,385
1,000 dgzen pairs ----(-3)---(3) 3 (3) ( ) (3) (3) (3) (3)
~3~ ~;~ 11,818 46,089 14,559 49,858 13,795 42,277 15,403 43,747 14, 738 36,841 16,568 35,833 22,336 44,656 23,018 43,988 22,631 45,068 25,556 50, 115 29,535 54,595 32,052 56,809 32, 724 58, 109
1 Rubber and plastic coated and dipped supported gloves are included as work gloves. Rubber and plastic dipped unsupported gloves are not included.
2 U.S. consumption, in this case, consists of U.S. shipments plus U.S. imports. 3 Not available. 4 Data from 1980 on may not be comparable to previous years because of changes in recording methods.
However, staff attempted to correct inconsistencies. 5 Beginning in 1987, data for rubber and plastic-dipped supported gloves were officially included under work
gloves in the Current Industrial Report (CIR), "Gloves and Mittens." ITC staff added these gloves to shipment data in previous years.
Source: Industrial production index taken from Federal Reserve Board, "Federal Reserve statistical release," G.17(419), Dec. 16, 1991, p. 10. U.S. work glove shipments data compiled from Bureau of the Census, U.S. Department of Commerce, Current Industrial Reports, Gloves and Mittens, 1973-1990 issues. U.S. import data compiled from official statistics of the U.S. Department of Commerce.
FOREIGN INDUSTRY PROFILE
China Reportedly, over 100 factories in China
manufacture gloves. These factories generally fall into two types: (1) those owned and operated by the Chinese Government, and (2) those owned by the Chinese Government, but operated by Hong Kong companies, which formerly manufactured gloves in Hong Kong. Most of the latter are set up as joint ventures, with the Hong Kong companies supplying the equipment and management and Chinese locals supplying the buildings and production workers.
U.S. glove companies have also set up joint ventures either directly with the Chinese Government or with those Hong Kong companies operating in China. U.S. companies use contractual arrangements when dealing with those factories directly owned and operated by the Chinese Government. For example, in 1987, Fownes, a large U.S. dress glove company that sources virtually all of its gloves overseas, signed a 15-year agreement with the Chinese Government. The agreement included a fixed rental lease on a factory
and fixed wage rates, which when adjusted to include the cost of benefits came to $0.35 per hour for the first 5 years.17 A spokesman for Fownes reported that these Chinese production costs were one-third less than in the Philippines, its primary Asian source for gloves.
China competes in the world market for gloves with its abundance of low cost labor, although wage rates have reportedly increased substantially since 1987. Also, the quality of Chinese gloves has improved considerably since the Chinese first began producing gloves for export. Its work glove industry is not involved in research and development in the high-technology, specialized area. Consequently, China focuses its work glove production on labor-intensive leather and fabric work gloves. Most of the cowhide leather used in Chinese glove production comes from the United States and Australia through Hong Kong. Most of the pigskin used in Chinese glove production is domestic. The Chinese glove industry also manufactures dress gloves, usually in the lower price ranges, and some rubber and plastic work gloves. Its
17 "Fownes: Making the glove fit in China," Womens Wear Daily, Feb. 27, 1987, p. 64.
9

production of medical gloves declined significantly after 1988 when the FDA began regulating the quality of these gloves and when the U.S. market became saturated.
Malaysia Malaysia had always been an important source of
rubber gloves (both work and medical) to the U.S. market, but not until 1988, during the U.S. medical glove "shortage,'' did it emerge as -the· largest world producer of latex medical gloves. U.S. imports of latex medical gloves from Malaysia totaled only $2.2 million in 1985; by 1990, the value of these shipments increased to almost $79.6 million. When other foreign suppliers virtually dropped out of the U.S. latex medical glove market in 1989 after the 1988 shortage ended, Malaysia remained as the dominant U.S. and world supplier of latex gloves.
Malaysia's dominance in the latex medical glove sector occurred for several reasons. Malaysia offers an abundant supply of natural rubber and latex, l8 as well as the infrastructure for distributing latex to end-user industries in Malaysia. Malaysia also has low labor costs. Some industry members consider the workforce there to be among the best in the world, 19 especially in the middle management area, even though Malaysian factories compete for production workers. Among these workers are young Malaysian women who are reluctant to leave the plantations to travel or live 15 to 20 miles from their homes to where the factories are. Malaysian companies also face competition from Singapore, where wages are higher and demand for young women workers is high.
Another important factor in the development of Malaysia's medical glove industry was the Government of Malaysia's investment incentive program for the manufacture of rubber-based products, such as medical gloves. The Malaysian Government offered (1) discounts on the price of latex purchased from Malaysian Government sources and on electricity bills; (2) research and development assistance; (3) rebates on export duties for latex gloves, but not for latex concentrate; and (4) certain tax relief measures. Because of the export duty on latex and the latex price discount mentioned above, companies manufacturing in the United States must pay more for Malaysian latex concentrate than established glove manufacturers in Malaysia.20
Like the U.S. industry, Malaysia's latex medical glove sector went through a period of restructuring after the dynamic events in the U.S. medical glove market. The number of companies producing these
18 Malaysian Industrial Development Authority (MIDA), "Investment Opportunities," Malaysia, Your Profjt Centre In Asia, p. 23.
19 "Labor-Skills Fine, But Too Few Malaysians," Rubber and Plastic News, Dec. 12, 1988, p. 11.
20 Akin, Gump, Strauss, Hauer & Feld, Posthearing Brief of Aladan Corp., ... , in Opposition to the Petition ... , submitted to the USTR [United States Trade Representative], p. 16.
10
gloves dropped dramatically from 85 in 1988 to 25 in 1990.21 Of the remaining 25 firms, 10 are large multinational companies, including several of the world's largest latex glove producers. Among these are Ansell (producing medical and rubber work gloves), Baxter (producing medical gloves), Kendall Co. (producing medical gloves), Mapa SNC, a unit of France's Hutchinson Group (producing rubber work gloves), and London International Group (producing medical gloves). Many of the local Malaysian manufacturers, -which · had rushed to set up factories with little production and marketing experience, ceased production or closed down. The surviving local companies produce quality gloves but are having difficulty competing with the multinationals, primarily because of the latter's well-established distribution networks in the United States. The local Malaysian producers of medical gloves are attempting to expand into the European Community (EC). They compete through product differentiation and by producing and marketing multicolored, scented, and even decorative medical gloves - all sold at conventional prices.
U.S. TRADE MEASURES
Tariff Measures
The tariff classification of gloves in the Harmonized Tariff Schedule of the United States (HTS)22 is based primarily on the constituent material. Gloves of plastics are classified in Chapter 39, Plastics and Articles Thereof; gloves of rubber in Chapter 40, Rubber and Articles Thereof; and gloves of leather in Chapter 42, Articles of Leather. Gloves of textile materials are classified in Chapter 61, Articles of Apparel and Clothing Accessories, Knitted or Crocheted or Chapter 62, Articles of Apparel and Clothing Accessories, Not Knitted or Crocheted, depending on whether the gloves are made of knitted or woven fabric. In general, gloves of textile materials, coated, covered, or impregnated with rubber or plastics are specifically provided for in chapters 61 and 62.23 Work and dress gloves are not specifically provided for in the HTS, even though the industry has made that distinction based on the presence or absence of
21 Ngam Su May, "Still Bouncing with Potential," Mala~sian Business, Feb. 16-28, 1990, p. 44.
2 Appendix A, "Explanation of Tariff and Trade Agreement Terms," includes a description of the HTS.
23 For tariff purposes, gloves of fur are classified with other fur apparel in Chapter 43, Furskins and Artificial Fur, Manufactures Thereof; and gloves of metal are classified along with other metal products in Chapters 73, Articles of Iron and Steel; 74, Copper and Articles Thereof; and 76, Aluminum and Articles Thereof, depending upon the type of metal the gloves are made from. Gloves of textile materials made for babies are classified for tariff purposes with other babies' garments and clothing accessories in chapters 61 and 62, depending upon whether they are made of knitted fabric or woven fabric.

fourchettes24 or sidewalls. 25 Sports gloves are specifically provided for in all the applicable chapters-39, 40, 42, 61, and 62. The conversion of the Tariff Schedules of the United States (TSUS) to the HTS in 1989 reclassified all sports gloves from an end-use basis to a constituent material basis. Consequently, sports gloves of textile materials were classified in chapters 61 and 62, subjecting them to considerably higher tariffs and to quotas. Tariff legislation passed in 1990 provided for separate legal breakouts for these sport gloves, thereby removing . them from quota and either re-establishing previous rates or lowering the duty on a majority of these items.
The provisions of the HTS applicable to gloves are shown in appendix B, table 1. The table lists those HTS subheadings by glove sector26_work, medical, dress, and sports. The duties on gloves range from 3. 7 percent ad valorem to 25 percent with an average rate of duty based on 1991 trade of 7.7 percent ad valorem. Negotiations on duty reductions that may affect the duties on gloves are currently underway in the Uruguay Round of the Multilateral Trade Negotiations (MTN).
As stated previously, some U.S. work glove producers take advantage of U.S. tariff provision HTS heading 9802.00.80, formerly known as the TSUS 807 provision. Subheading 9802.00.80.10 specifically provides for apparel assembled in designated Caribbean Basin countries or Mexico from fabric made and cut in the United States. Apparel assembled from fabric that has only been cut in the United States, along with other products made from U.S. components, are provided for under subheading 9802.00.80.60. During 1991, approximately 4 percent of the total value of U.S. glove imports entered under HTS subheading 9802.00.80.
Nontariff Measures The majority of all cotton and manmade fiber
glove and some wool glove imports from low-cost producing countries are subject to restraint through quotas (specific limits) or designated consultation levels (DCLs),27 a more flexible import control
24 A fourchette is a strip of material that is sewn-in between the finger of the palm-side and backside of a glove; a sidewall is a strip sewn-in on the side from the end of the little finger to the wrist. Fourchettes and sidewalls allow for a closer and more comfortable fit.
25 Commission staff used this distinction in collecting and analyzing the data on work and dress gloves. Those HTS subheadings that do not differentiate between gloves with fourchettes and those without fourchettes were grouped with the dress gloves. Staff realizes that a certain amount of work gloves are imported under these HTS item numbers and, therefore, work glove imports are somewhat understated.
26 Work and dress gloves were differentiated wherever the description of absence or presence of fourchettes was available in the HTS. Staff recognizes that this method allows for rough estimates and understates the number of HTS subheadings covering work gloves.
27 DCLs are usually somewhat above existing trade levels and once reached cannot be exceeded unless the United States agrees to further shipments. They normally apply to categories in which trade is not as great as those for which specific limits are set.
negotiated under the Arrangement Regarding International Trade in Textiles, commonly known as the Multifiber Arrangement (MFA). Created under the aegis of the General Agreement on Tariffs and Trade (GAIT), the MFA allows signatories to place quantitative limits, or quotas, on imports of textiles and apparel, including gloves.28 Quotas can be established through negotiation of bilateral agreements29 or, in the absence of mutually agreeable limits, imposed unilaterally by importing countries for up to two years, provided that ·the limits are not below actual import levels during the 12 of the previous 14 months preceding the date of the request for negotiations. Negotiations are underway in the Uruguay Round to ultimately phase out the MFA.
To administer the U.S. textile and apparel trade agreements program under the MFA, imports of textiles and apparel are grouped into three-digit category numbers according to their fiber content (cotton, wool, manmade fibers, or silk and vegetable fibers other than cotton). Quota levels are also set sometimes for product groups (yam, fabric, apparel, or home furnishings). Imports of gloves are classified under categories 331 (cotton), 431 (wool), 631 (manmade fibers), and 831 (silk and noncotton vegetable fiber blends).
During 1991, the United States had bilateral agreements containing specific limits (quantitative quotas) and designated consultation levels with the four largest foreign suppliers of primarily cotton and manmade fiber gloves to the U.S. market- China, Korea, the Philippines, and Taiwan - and 11 other smaller suppliers.30 Table 8 shows foreign glove suppliers whose imports were restricted by binding quotas31 during the 1991 quota period.
About 70 percent of the total quantity of imports of gloves covered by the MFA was restricted by binding quotas during 1991. As shown in table 8, imports from virtually all the major suppliers were restricted by quotas. Since most of these countries have the potential to increase exports of fabric gloves to the United States, these quotas act as protection for those members of the U.S. industry that produce comparable gloves.
Imports are also affected by the Berry Amendment, which has been attached to all U.S. Department of Defense appropriation acts since 1954. The Berry Amendment requires the U.S. Government to purchase its textile and apparel items, including gloves, from domestic sources. This requirement has been important
28 The MFA covers products of cotton, wool, manmade fibers, and since August 1986, silk blends, linen, and ramie. It replaced GATI programs developed in the 1960s that controlled trade in cotton goods.
29 U.S. authority to enter into agreements or establish quotas with MFA and non-MFA signatories is provided under sec. 204 of the Agricultural Act of 1956.
30 These countries are Hong Kong, Pakistan, Sri Lanka, Malaysia, Jamaica, Thailand, Bangladesh, Indonesia, Mauritius, Singapore, and Macau.
31 Quota utilization rate was 75 percent or higher during the agreement year.
11

Table 8 Countries covered by binding quotas, quota year 1991
MFA Country category Quota Percent filled
(Dozen pairs)
China........................................... 331 4,448,375 100.0 631 812,865 100.0
Hong Kong . . . . .. . . .. . . . . . . . .. . . .. . . . . . . . . . . . . . . . 331 3,691,975 97.5 Sri Lanka1 .. . .. .. .. .. . •.. • .. • .... .. .. .. .. .. • . .. .. . 2331/631 1,881,805 100.0 Pakistan .. . . . .. . . . .. .. .. .. . . .. . .. . . .. . . . . . . . . . . . 2331/631 1,430,901 98.6 Malaysia .. .. . .. . .. . . . . . . .. .. .. . .. .. . . . . . . . .. . . . . 2331/631 1,376,106 88.3 Bangladesh3 ..................................... 331 701,307 100.0 lndonesia1 . .. . .. . . .. . . • .. . .. . . . . .. . .. . . . . .. . .. .. . 331 597,399 95.6
631 919,648 100.0 Taiwan.......................................... 331 519,202 97.3
631 4,691, 117 92.2 Macau . . .. . .. .. . . . .. .. . .. .. .. . .. . . . . . .. . .. . . . . . . 4331/831 300,000 84.5 Singapore . . .. .. .. . .. . . . .. . .. .. .. . . .. . .. . . . . . . . . . 631 425,002 83.9
1 The quota year for this country runs from July 1, 1990 - June 31, 1991. 2 This is a combined quota limit on cotton and manmade fiber gloves. 3 The quota year for this country runs from Feb. 1, 1991 - Jan. 31, 1992. 4 This is a combined quota limit on gloves of cotton and silk and noncotton vegetable fiber blends.
Source: Compiled from official statistics of the U.S. Department of Commerce.
to several U.S. producers of work and dress gloves that depend on U.S. Government contracts for business.
FDA regulations on surgical and m~dical examination gloves also affect imports as well as domestic products. Both U.S. and foreign producers of surgical and medical examination gloves that market their gloves in the United States must certify that their products meet FDA regulations.
FOREIGN TRADE MEASURES
Tariff Measures Tariffs of the European Community assessed on
plastic, rubber, and leather glove imports from the United States are very similar to U.S. tariffs. However, EC tariffs on textile gloves are considerably lower than U.S. tariffs. Canadian tariffs, on the other. hand, are generally higher than U.S. tariffs, except for textile gloves, as shown in table 9.
Nontariff Measures Members of the EC and Canada are signatories to
the MFA and some have quotas on imports of textile gloves, primarily from the major Asian suppliers. However, there are no quotas on gloves imported from the United States. Members of the EC and Canada have "buy national" or "buy local" policies applied to their governments' procurement. However, these government procurement policies are not considered to be significant barriers to the U.S. glove industry, which does not target this market niche. ·
The EC 1992 program calls for the establishment of product standards for most work gloves and for
12
surgical and medical examination gloves. All work gloves used in potentially dangerous environments, such as in the presence of chemicals, high or low temperatures, or for protection from impact will have to meet EC standards for personal protective equipment. (Gardening gloves would not be required to meet these standards). Gloves (both work and medical gloves) affected by EC product standards will need labels with a "CE" mark, which indicates that such gloves meet the standards. The product standards and certification procedures for work gloves are outlined in the EC directive relating to personal protective equipment. 32 The directive outlining certification procedures for surgical and medical devices under which medical gloves are covered was formally proposed in 1991 and is due to be adopted by the end of 1992.33 Trade sources report the likelihood that U.S.-made work gloves would meet the EC's minimum requirements for personal protective equipment because the U.S. industry produces primarily high-quality gloves. The added costs for the certification procedure is unlikely to affect the large work glove producers that already export to the EC, but they could be a burden on those small U.S. producers attempting to compete in the EC market.
32 "Council Directive of 21 December 1989 on the Approximation of the Laws of the Member States Relating to Personal Protective Equipment," Dir 89/686/EEC, Official Journal of the European Communities, No. L 399 (Dec. 21, 1989). p. 18.
33 "Proposal for Council Directive Concerning Medical Devices," COM (91 287 Final - SYN 353), Official Journal of the European Communities, No. C 237, (Sept 12, 1991), p. 3.

Table 9 Tariffs on gloves, by country, by type, 1991
(Percent ad valorem)
EC tariffs Canadian tariffs U.S. tariffs
Item MFN MFN FTA 1 MFN FTA 1
Plastic gloves .............. 8.4 25-25.5 17.5-17.8 3.7-14 2.5-9.8 2.7 25 17.5 3.7-14 2.5-9.8 Rubber gloves .............
Leather gloves ............. 10 11.3-25 7.9-17.5 3-14 2.1-9.8 Textile gloves .............. 7.6--8.9 25 17.5 5.5-25 2.5-17.5
1 Duty ·rates in this column are those negotiated under the United States-Canada-Free Trade Agreement. Staged duty reductions for gloves under the agreement began in 1989 and will be completely phased out by Jan. 1, 1998. Source: Compiled from official statistics of the Governments of the EC, Canada, and the United States.
U.S. MARKET
Total U.S. Glove Consumption Table 10 shows total glove consumption34 in the
United States during 1987-91. Apparent U.S. consumption peaked in 1988 at almost $1.8 billion, before falling to $1.6 billion in 1990. This trend reflected mostly the rise and fall in demand for the surgical and medical examination gloves.
U.S. Consumption of Work Gloves There has been little growth in the U.S. work glove
market during the past 3 years, as shown in table 11.35 U.S. consumption of work gloves hovered around 54 million dozen pairs, while the value of consumption declined by an estimated 8 percent in 1991 from the 1989 level, reflecting soft demand for work gloves, especially in the industrial market. Imports supply a considerable share of the U.S. market-about 60 percent in terms of quantity and approximately 35 percent36 in terms of value.
Because many end-user industries purchase large volumes of work gloves for their employees and base their purchasing decisions primarily on price, imports have captured increasing shares of the U.S. market over the years. The industrial market for work gloves is especialJy competitive because of the high importance placed on price, while the retail market is less so. In the retail market, two U.S. work glove companies account for at least 60 percent of the U.S. retail business. The
34 Total U.S. glove consumption is understated, as U.S. shipments of plastic unsupported gloves are not included in the table. Data on shipments of these gloves are not available except for 1988, when they totaled $54 million; and 1990, when they totaled almost $28 million. Data on U.S. exports and U.S. imports of plastic uns~ported gloves are included in table 10.
Because import data on work gloves for 1987 and 1988 would have to be estimated from a different classification system, data for these years were not included in table 11.
36 Imports would supply a considerably higher share of the U.S. market in terms of value if the duty, the value of freight and insurance, and importers' mark up were added to the values shown in the work glove consumption table (table 11).
effects of product differentiation, advertising, and modem marketing methods diminish somewhat the price factor at the retail level.
U.S. apparent consumption of rubber unsupported gloves not used for medical purposes is analyzed separately from other work gloves in table 12 because quantity data for these gloves are not available. Table 12 shows that imports in this market segment account for a growing and considerable share, 54 percent, of the value of U.S. apparent consumption of these gloves in 1991. Imports have increased their share considerably in this market that was once thought to be import-resistant because of the capital-intensive nature of production.
Work Glove Shipments U.S. shipments of work gloves remained relatively
stable during 1989-91 at approximately 25 million dozen pairs, as shown in table 11. The value of these shipments fell slightly, by 6 percent during this period, reflecting the shift in product mix by some work glove producers to the knitted gloves made on computerized knitting machines. These glove!! are priced lower than the sewn gloves. Downward pressure on prices due to the recession also contributed to the decreasing value of shipments.
U.S. Imports of Work Gloves As shown in table 11, imports of work gloves rose
in 1990 from 1989, but declined in 1991, reflecting the soft industrial market. Imports declined considerably more in value terms (10 percent) than in quantity terms (1 percent). This likely represents a downward pressure on prices due to the recession. Imports are priced approximately one-third lower than U.S. shipments. The unit value of a dozen pairs of imported work gloves ave~ed $6.2837 during 1989-91, compared with $16.81 for a dozen pairs of the U.S.-made
37 An average wholesale price for imported gloves would be higher than the average unit value stated here since the unit value does not include duties, insurance and frei~t costs, and importers' markup.
8 The unit value for domestic shipments is comparable to a wholesale cost.
13

Table 10 Gloves: U.S. shipments, exports of domestic merchandise, imports for consumption, and apparent U.S. consumption, 1987-91
Ratio of U.S. U.S. U.S. Apparent U.S. imports to
Year shipments 1 2 exports imports consumption consumption
Million dollars Percent 1987 ...................... 845 132 630 1,343 47 1988 ...................... 890 190 1,097 1,797 61 1989 ...................... 914 182 890 1,622 55 1990 ....................... 864 158 871 1·,577 55 1991 ...................... 862 165 912 1,609 57
1 Estimated by staff of the U.S. International Trade Commission. 2 Includes data on all gloves except for plastic unsupported gloves. Data on U.S. shipments of these items are
not available.
Source: Compiled from official statistics of the U.S. Department of Commerce, except as noted.
Table 11 Work gloves1: U.S. shipments, exports of domestic merchandise, imports for consumption2, and apparent U.S. consumption2, 1989-91
Year
1989 .................... . 1990 .................... . 1991 .................... .
1989 .................... . 1990 .................... . 1991 .................... .
U.S. shipments
U.S. U.S. exports imports
Apparent U.S. consumption
------- Quantity (1,000 dozen pairs)------32,932 32,052 353,577 24,757
25,385 325,000
U.S. shipments
33, 768 32, 724 354,341 33,741 32,685 353,944
U.S. U.S. exports imports
Apparent U.S. consumption
------- Value (million dollars)--------3435 335 207 3505 3417 344 213 3555 3410 343 192 3559
Ratio of imports to consumption
Percent 359 360 361
Ratio of imports to consumption
Percent 334 336 334
1 The work gloves included in this table are made of textile fabrics, leather, and fabric that has been coated, covered, dipped, or impregnated with rubber and plastic. Rubber and plastic unsupported work gloves are not included. See table 12 for data on U.S. consumption of rubber unsupported work gloves. No data are available on U.S. shipments of plastic unsupported work gloves.
2 Following data on U.S. imports and apparent U.S. consumption may be understated by 5 to 10 percent. Not all work glove imports are separately provided for in the U.S. tariff schedules. Therefore, not all imports of work gloves were accounted for.
3 Estimated by staff of the U.S. International Trade Commission.
Source: Compiled from official statistics of the U.S. Department of Commerce, except as noted.
Table 12 Rubber unsupported work gloves: U.S. shipments, exports of domestic merchandise, imports for consumption, and apparent U.S. consumption, 1989-91
Ratio of U.S. U.S. U.S. Apparent U.S. imports to
Year shipments exports imports consumption consumption
Million dollars Percent 1989 ....................... 96 12 79 163 48 1990 ....................... 100 17 86 169 51 1991 ....................... 199 22 89 1166 154
1 Estimated by the staff of the U.S. International Trade Commission.
Source: Compiled from official statistics of the U.S. Department of Commerce, except as noted.
14

work gloves. U.S. importers of work gloves include distributors of work gloves, U.S. work glove manufacturers, and retail stores that import their gloves directly.
China, with one of the lowest labor rates in the world, is, by far, the largest foreign supplier of work gloves, accounting for 4 7 percent of the total value of these imports in 1991. Other large suppliers included Taiwan and Hong Kong. Malaysia was the largest supplier of rubber unsupported work gloves.
Approximately 8 percent of the value of imported work gloves in 1991 was made in overseas production-sharing arrangements and entered the United States under HTS heading 9802.00.80. Guatemala, Haiti, China, and Mexico .were the largest foreign suppliers of these imports. Primarily as a result of political unrest, imports from Haiti dropped by 40 percent in 1991 from the 1990 level.
U.S. Consumption and Imports of Dress Gloves
U.S. apparent consumption of dress gloves declined an estimated 10 percent to $246 million in 1991, as shown in table 13, reflecting a soft retail market due to the recession. U.S. imports of dress gloves fell by 17 percent during 1990-91, compared with an estimated 4-percent decline for U.S. shipments. Consequently, U.S. imports' share of the U.S. dress glove market dropped to 50 percent during 1991 from 53 percent in 1990.
U.S. shipments of dress gloves have been increasing over the past 15 years, as shown in table 14. Most of this growth occurred in knitted seamless gloves made on knitting machines. 39
Leather dress glove imports accounted for two-thirds of the value of total dress gloves imported during 1991 and one-third of the total quantity. The largest nonleather dress glove item was manmade-fiber knitted gloves. The Philippines is the largest foreign supplier of medium-priced dress gloves; China is the largest foreign supplier of inexpensive dress glove imports; and Italy is the largest foreign supplier of high-priced dress gloves to the U.S. market. In 1991, the unit value of the gloves imported from the Philippines averaged $52.30 per dozen pairs, compared with $14.26 per dozen pairs from China, and $104.19 per dozen pairs from Italy.
Almost 12 percent of the value of U.S. imports of dress gloves entered under HTS heading 9802.00.80 during 1991. The largest suppliers of these gloves were Mexico and the Philippines.
39 Unfortunately, data on shipments of knitted and woven dress gloves are not consistently, separately provided for during the period.
U.S. Consumption and Imports of Medical Gloves
Apparent U.S. consumption of surgical and medical examination gloves reached an all time high of $584 million in 1988, responding to the high demand levels in the market, as shown in table 15. Consumption then declined considerably to $251 million in 1990 when demand became overfilled, leaving many distributors itnd ultimate consumers in the medical community with large inventories of gloves. In 1991, the market recovered somewhat as consumers used up inventory.
The market for medical gloves is very responsive to supply and demand factors. The U.S. market tends to be highly concentrated with three firms (Baxter, Ansell, and Johnson and Johnson) dominating with approximately 80 percent of total sales.40
Imports supplied a large part of the increased demand in 1988, accounting for an all time high of 67 percent of U.S. apparent consumption.41 When the U.S. market became oversupplied in 1989, imports dropped by 54 percent. The 1991 recovery in the market was supplied largely by imports, with a major portion coming from U.S. subsidiaries primarily in Malaysia and to a lesser extent in Sri Lanka.
The major foreign supplier of surgical and medical examination gloves is, by far, Malaysia,42 which accounted for 66 percent of the value of these glove imports in 1991. Other important suppliers include Thailand, Sri Lanka, China, and Indonesia. Import increases from these smaller suppliers, except for Sri Lanka, reflect mostly increased purchases by independent U.S. importers, not the large U.S. producers. Increased imports from Sri Lanka, however, reflect the opening of a new plant there by Ansell.
Import increases of medical gloves continued into 1992 and are further indications of recovery of U.S. demand for these gloves. It is possible that the recent Center for Disease Control guidelines and the 1991 Occupational Safety and Health Administration (OSHA) regulations, requiring the use of gloves by workers who have the potential to come into contact with human blood, have stimulated purchases by hospitals, dentists, nursing homes, and other members of the medical community.
40 "Market for Surgeons' Gloves to Escalate, Study Predicts," Rubber and Plastics News, June 5, 1989, p. 2.
41 For more information on what occurred in the U.S. medical glove marke! during 1987-91, see _the .med~cal glove section of the mdustry structure section m this report on pp. 4, 7.
42 U.S. imports of latex surgical and medical gloves from designated beneficiary countries are eligible for duty-free treahnent under the Generalized System of Preferences (GSP). Malaysia lost its GSP eligibility for these gloves in 1990, when it exceeded the competitive-need limit (i.e., it supplied more than half the total value of imports in a given year).
15

Table 13 Dress gloves: U.S. shipments, exports of domestic merchandise, imports for consumption, and apparent U.S. consumption, 1989-91 ·
Ratio of U.S. shipments
U.S. U.S. Apparent U.S. imports to exports 1 imports consumption consumption Year
Million dollars -------- Percent 1989 ....................... 1136 10 137 1263 152 1990 ....................... 1140 11 147 1276 153 1991 ....................... 1135 11 122 1245 150
1 Estimated by staff of the U.S. International Trade Commission.
Source: Compiled from official statistics of the U.S. Department of Commerce, except as noted.
Table 14 U.S. shipments of dress gloves by type, by quantity, 1976-89
(Thousand dozen pairs)
All Year leather
1976......................... 407 1977 ......................... 406 1978......................... 409 1979......................... 382 1980......................... 281 1981 . . . . . . . . . . . . . . . . . . . . . . . . . 343 1982......................... 374 1983......................... 248 1984......................... 259 1985......................... 227 1986......................... 201 1987......................... 245 1988......................... 207 1989......................... 288
Leather and fabric combination
159 189 295 290 272 203 199 142 146 212 163 159
BO 143
Other (knit and woven)
1,442 1,542 1,877 2,110 2,512 2,582 1,326 1,615 2,180 2,690 2,904 4,760 5,591 6,370
Total
2,008 2,137 2,581 2,782 3,065 3,128 1,899 2,005 2,585 3,129 3,268 5,164 5,878 6,801
Source: Compiled from data in Bureau of the Census, U.S. Department of Commerce, Current Industrial Reports, Gloves and Mittens, 1976-90 issues.
Table 15 Surgical and medical gloves: U.S. shipments, exports of domestic merchandise, Imports for consumption, and apparent U.S. consumption, 1987-91
Ratio of U.S. U.S. U.S. Apparent U.S. imports to
Year shipments 1 exports2 imports3 consumption4 consumptions
Million dollars Percent 1987 ..................... 6235 44 36 6221 616 1988 ..................... 6269 77 392 6584 667 1989 ..................... 236 92 181 325 56 1990 ..................... 196 65 120 251 48 1991 ..................... 6200 63 187 6324 658
1 U.S. shipments data are for surgical and medical gloves of rubber. Data on U.S. shipments of plastic medical gloves are not available.
2 U.S. export data include both rubber and plastic medical gloves. Plastic medical gloves accounted for an average of 27 percent of the value of total U.S. exports of medical gloves during 1989-90.
a U.S. imports include both rubber and plastic medical gloves. 4 Apparent U.S. consumption is understated since U.S. shipments of plastic medical gloves are not included. 5 The ratio of imports to consumption is overstated since the plastic medical gloves are included in the import
data, but not in the U.S. shipments data. 6 Estimated by staff of the U.S. International Trade Commission.
Source: Compiled from official statistics of the U.S. Department of Commerce, except as noted.
16

U.S. Consumption and Imports of Sports Gloves
Apparent U.S. consumption of sports gloves grew by approximately 25 percent from about $250 million in 1989 to an estimated $314 million in 1991. Imports supply virtually all of this market. Only a handful of U.S. companies produce sports gloves domestically today. Originally, U.S. companies began to order sports gloves out of Korea, which remains the largest foreign supplier of these gloves.- However, as labor and other operating costs are increasing in Korea, production of these labor-intensive, high-volume products is moving to countries with lower labor costs, such as China and, more recently, smaller emerging suppliers, such as the Philippines, Indonesia, and Thailand. Imports of sports gloves from China stabilized at about $43 million in 1990 and 1991, while imports from the Philippines, Indonesia, Thailand, Pakistan, and Sri Lanka, together, grew by 175 percent during 1989-91.
Leather baseball and softball mitts and golf gloves are the largest types of sports gloves imported. Ski gloves of manmade fibers and leather batting gloves also make up a large segment of imported gloves.
FOREIGN MARKETS
Foreign Market Profile The major foreign markets for U.S. gloves are the
EC and Canada. As shown in table B-2 in appendix B, the EC accounts for approximately 37 percent of the total value of U.S. exports, and Canada accounts for 9 percent. The competitive situation in the EC and Canadian markets for gloves is similar to that existing in the United States. Generally, low-cost imports from the less developed countries supply a large part of the market at the low end and a growing share of the medium- to high-priced segment. The demand factors found in these foreign markets are similar to those found in the U.S. market. The demand for U.S. work gloves in the EC and Canada is affected by the level of industrial activity; the relationship between the prices of domestically produced work gloves, imports from the United States, and imports from the Far East; the concern for quality; and specialty needs the U.S. work glove industry may excel in meeting. The demand for U.S. surgical and medical gloves in these foreign markets is affected by the level of concern in these countries over the spread of infectious diseases like AIDS, the price of domestic products and imports, and concern over quality.
U.S. Exports
Products Exported Approximately 18 percent of the total value of U.S.
glove exports during 1991 consisted of glove parts, not
finished gloves, shipped primarily to Mexico and the Caribbean Basin countries for subsequent return to the United States under HTS heading 9802.00.80. About one-half of these exports consisted of work gloves and one-half dress gloves. An additional 15 percent of the total value of gloves exported in 1991, or $25 million, shipped to Mexico is believed to consist of medical gloves sent to Mexico for further processing other than assembly. Trade literature reported in 1990 that Ansell had transferred the labor-intensive latex glove inspection and packing activities from the United States to facilities in Mexico.43 Consequently, exports of finished gloves for sale in foreign markets were valued closer to $110 million in 1991 than the $165 million shown in table B-2 in appendix B. Exports of finished gloves represented about 13 percent of the value of U.S. producers' shipments in 1991.
Approximately 50 percent of the total value of U.S. glove exports during 1991 consisted of work gloves and almost one-half of these were unsupported rubber and plastic work gloves. An additional 40 percent of the total value was surgical and medical gloves, and the remaining 10 percent consisted of dress gloves and a few sports gloves.
Export Trends
U.S. exports of gloves rose by 44 percent to $190 million in 1988 from the level in 1987, before dropping by approximately 10 percent to $165 million in 1991, as shown in table B-2 in appendix B. This trend was influenced by the events in the U.S. medical glove market as exports of these gloves shipped to Mexico for further processing peaked in 1988 and then fell each year thereafter. U.S. exports to the EC increased overall by 154 percent during 1987-91, while those to Canada fluctuated considerably, averaging about $14 million annually. Most U.S.- exporters are U.S. manufacturers and distributors of gloves.
U.S. TRADE BALANCE
The United States experienced a deficit in glove trade during 1987-91 as shown in table B-2 in appendix B. The deficit closely tracked the events in the surgical and medical glove market during this period, peaking in 1988 at $907 million, as imports of the medical gloves increased rapidly attempting to satisfy the heightened demand between 1987 and 1988. When the market became saturated, the deficit fell as import levels declined.
43 "U.S. Latex Glove Makers Struggle to Keep Up," Rubber and Plastic News, Oct. 1, 1990, pp. 9,28.
17


APPENDIX A EXPLANATION OF TARIFF AND TRADE AGREEMENT TERMS

TARIFF AND TRADE AGREEMENT TERMS
The Harmonized Tariff Schedule of the United States (HTS) replaced the Tariff Schedules of the United States (TSUS) effective January 1, 1989. Chapters 1 through 97 are based on the internationally adopted Harmonized Commodity Description and Coding System through the 6-digit level of product description, with additional U.S. product subdivisions at the 8-digit level. Chapters 98 and 99 contain special U.S. classification provisions and temporary rate provisions, respectively.
Rates of duty in the general subcolumn of HTS column 1 are most-favored-nation (MFN) rates; for the most part, they represent the final concession rate from the Tokyo Round of Multilateral Trade Negotiations. Column 1-general duty rates are applicable to imported goods from all countries except those enumerated in general note 3(b) to the HTS, whose products are dutied at the rates set forth in column 2. Goods from Armenia, Bulgaria, the People's Republic of China, Czechoslovakia, Estonia, Hungary, Latvia, Lithuania, Moldova, Mongolia, Poland, Russia, the Ukraine and Yugoslavia are currently eligible for MFN treatment. Among articles dutiable at column 1-general rates, particular products of enumerated countries may be eligible for reduced rates of duty or for duty-free entry under one or more preferential tariff programs. Such tariff treatment is set forth in the special subcolumn of HTS column 1. Where eligibility for special tariff treatment is not claimed or established, goods are dutiable at column 1-general rates.
The Generalized System of Preferences (GSP) affords nonreciprocal tariff preferences to developing countries to aid their economic development and to diversify and expand their production and exports. The U.S. GSP, enacted in title V of the Trade Act of 1974 and renewed in the Trade and Tariff Act of 1984, applies to merchandise imported on or after January 1, 1976, and before July 4, 1993. Indicated by the symbol "A" or "A*" in the special subcolumn of column 1, the GSP provides duty-free entry to eligible articles the product of and imported directly from desig-
A-2
nated beneficiary developing countries, as set forth in general note 3(c)(ii) to the HTS.
The Caribbean Basin Economic Recovery Act (CBERA) affords nonreciprocal tariff preferences to developing countries in the Caribbean Basin area to aid their economic development and to diversify and expand their production and exports. The CBERA, enacted in title II of Public Law 98-67, implemented by Presidential Proclamation 5133 of November 30, 1983, and amended by the Customs and Trade Act of 1990, applies to merchandise entered, or withdrawn from warehouse for consumption, on or after January 1, 1984; this tariff preference program has no expiration date. Indicated by the symbol "E" or "E*" in the special subcolumn of column 1, the CBERA provides duty-free entry to eligible articles the product of and imported directly from designated countries, as set forth in general note 3(c)(v) to the HTS.
Preferential rates of duty in the special subcolumn of column 1 followed by the symbol "IL" are applicable to products of Israel under the United States-Israel Free-Trade Area Implementation Act of 1985, as provided in general note 3(c)(vi) of the HTS. When no rate of duty is provided for products of Israel in the special subcolumn for a particular provision, the rate of duty in the general subcolumn of column 1 applies.
Preferential rates of duty in the special duty rates subcolumn of column 1 followed by the symbol "CA" are applicable to eligible goods originating in the territory of Canada under the United States-Canada Free-Trade Agreement, as provided in general note 3(c)(vii) to the HTS.
Preferential nonreciprocal duty-free or reducedduty treatment in the special subcolumn of column 1 followed by the symbol "J" or "J*" in parentheses is afforded to eligible articles the product of designated beneficiary countries under the Andean Trade Preferences Act (ATPA), enacted in title II of Public Law 102-182 and implemented by Presidential Proclamation 6455 of July 2, 1992 (effective July 22, 1992), as set forth in general note 3(c)(ix) to the HTS.
Other special tariff treatment applies to particular products of insular possessions (general note 3(a)(iv)), goods covered by the Automotive Products Trade Act (general note 3(c)(iii)) and the Agreement on Trade in Civil Aircraft (general note 3(c)(iv)), and articles imported from freely associated states (general note 3(c)(viii)).

The General Agreement on Tariffs and Trade (GAIT) (61 Stat. (pt. 5) A58; 8 UST (pt. 2) 1786) is the multilateral agreement setting forth basic principles governing international trade among its more than 90 signatories. The GAIT's main obligations relate to most-favored-nation treatment, the maintenance of scheduled concession rates of duty, and national (nondiscriminatory) treatment for imported products. The GAIT also provides the legal framework for customs valuation standards, "escape clause" (emergency) actions, antidumping and countervailing duties, and other measures. Results of GAIT-sponsored multilateral tariff negotiations are set forth by way of separate schedules of concessions for each participating contracting party, with the U.S. schedule designated as schedule XX.
Officially known as "The Arrangement Regarding International Trade in Textiles," the Multifiber Arrangement (MFA) provides a framework for the negotiation of bilateral agreements between importing and producing countries, or for unilateral action by importing countries in the absence of an agreement. These bilateral agreements establish quantitative limits on imports of textiles and apparel, of cotton and other vegetable fibers, wool, manmade fibers, and silk blends, in order to prevent market disruption in the importing countries - restrictions that would otherwise be a departure from GAIT provisions. The United States has bilateral agreements with more than 30 supplying countries, including the four largest suppliers: China, Hong Kong, the Republic of Korea, and Taiwan.
A-3


APPENDIXB STATISTICAL TABLES

tp N
Table B-1 Gloves: Harmonized Tariff Schedule subheading; description; U.S. col. 1 rate of duty as of Jan. 1, 1991; U.S. exports, 1991; and U.S. Imports, 1991
Col. 1 rate of duty as of U.S. U.S. HTS Jan. 11 1991 exports, imports, subheading Description General Special' 1991 1991
Million dollars Work Gloves: 3926.20.1 O(pt) Of plastic and seamless ............................. 3.7o/o Free (A,E,IL) 10;5 28.4
3926.20.40 Of plastic and seamed ........••.................... 2.5o/o \fA)
14o/o Free ( ), 4.2"/o 8.3 5.0
4015.19.10 Of rubber and seamless ............................. ~L), 9.8o/o (CA)
(2) 3.7o/o ree (A,E), 1.1 o/o 87.5
4015.19.50 Of rubber and seamed .•.........•.................. ~L), 2.5o/o (CA)
(2) 14o/o ree (E), 4.2"/o 1.3
4203.29.08 Wholly of horsehide and cowhide, without (IL), 9.8o/o (CA)
fourchettes .•...........•..••..•..•.•.....•........ 14o/o 4.2o/o (IL), 9.8o/o (3) 32.3 (CA)
4203.29.18 Not wholly of horsehide or cowhide, without fourchettes .••......••.•.•••....•...•.............. 14o/o 4.2o/o (IL), 9.8o/o (3) 44.8
(CA) 6116.10.18 Cut and sewn of knitted fabric, without fourchettes, of vege-
table fibers, coated with plastics or rubber . . . . . . . . . . . . . 25o/o Free (E~, 7.5o/o (4) 4.4 (IL), 17. o/o (CA)
6116.10.45 Cut and sewn of knitted fabric, without fourchettes, of fibers other than vegetable, coated with plastics or
19.8o/o 5.9o/o (I~ (4) 8.0 rubber ..............•...........••................ 13.8o/o ( A)
6116.10.70 Other than cut and sewn of knitted fabric, without fourchettes, of all fibers, coated with plastics
14o/o Free (E*), 4.2o/o (4) 12.6 or rubber ...........•...•.......................... ~L), 9.8o/o (CA)
(5) 25.4 6116.92.60(pt) Of cotton, knitted, without fourchettes ................. 25o/o o/o (IL) 17 .5o/o (CA)
6116.93.60(pt) Of synthetic fibers, with 23o/o or more by weight of wool, 33.1¢i1<g + 1 0¢'1<~ + 2.2o/o (6) .4 knitted, without fourchettes ..•....................... 7.4o/o (IL), 2 .1 ¢i1<g
+ 5.1o/o (CA) 6116.93.90(pt) Of synthetic fibers, less than 23o/o percent by
19.8o/o 5.9o/o (ILJ (6) 34.3 weight of wool, knitted, without fourchettes ............. 13.8o/o ( A)
Footnotes are at the end of the table.

tJ:l I w
Table B·1-Contlnued Gloves: Harmonized Tariff Schedule subheading; description; U.S. col. 1 rate of duty as of Jan. 1, 1991; U.S. exports, 1991; and U.S. Imports, 1991
HTS subheading
6116.99.50(pt)
6216.00.12
6216.00.18
6216.00.28
6216.00.39(pt)
6216.00.52(pt)
Description
Of other textile materials, knitted, without fourchettes ........................................
Cut and sewn of vegetable fibers coated with plastics or rubber, not knit, without fourchettes .................
Cut and sewn of fibers other than vegetable fibers coated with plastics or rubber, not knit, without fourchettes .....
Other than cut and sewn of all fibers coated with plastics or rubber, not knit, without fourchettes ...................
Of cotton, not knit, without fourchettes ................
Of manmade fibers, not knit, without fourchettes ........
Medical gloves: 3926.20.10(pt) Of plastic and seamless, used for medical and surgical
purposes ..•.......•..............................
4015.11.00 Of rubber, used for surgical and medical purposes ......
Dress gloves: Wholly of horsehide and cowhide, with fourchettes ...... 4203.29.05
4203.29.15 Not wholly of horsehide and cowhide, with fourchettes ........................................
4203.29.20 Of leather, not horsehide or cowhide, not seamed ......
4203.29.30 Of leather, not horsehide or cowhide, seamed, for men ..
4203.29.40 Of leather, not horsehide or cowhide, seamed, for persons other than men, not lined ............................
Footnotes are at the end of the table.
Col. 1 rate of duty as of Jan. 1, 1991 General SpeeiiiP
20% 1.1% ~L) 14% ( A)
25% Free (E*), 7.5% (IL), 17.5% (CA)
22¢/kg + 11% 6.6¢/kg + 3.3% (IL), 15.4¢/kg + 7.7% (CA)
14% Free (E*), 4.2% (IL), 9.8% (CA)
25% 4.2% (I~
22¢/kg + 11% 17.5%( A) 6.6¢/kg + 3.3% (IL), 15.4¢/kg + 7.7% (CA)
3.7% Free (A,E,IL), 2.5% (CAJ
3.7% Free (A*, ,IL) 2.5% (CA)
14% Free (E), 4.2"k (IL), 9.8% (CA)
14% Free (E), 4.2% ~L), 9.8% (CA)
14% ree (E), 4.2% ~L), 9.8% (CA)
14% ree (E), 4.2%, (IL), 9.8% (CA)
14% Free (E), 4.2"/o (IL), 9.8% (CA)
U.S. U.S. exports, imports, 1991 1991
Million dollars
(7) .6
(8) 2.2
(B) .4
(B) 1.5
(9) 21.2
(10) 4.4
13.1 19.2
49.6 168.0
(3) 22.7
(3) 11.2
(3) .4
(3) 21.3
(3) 1.6
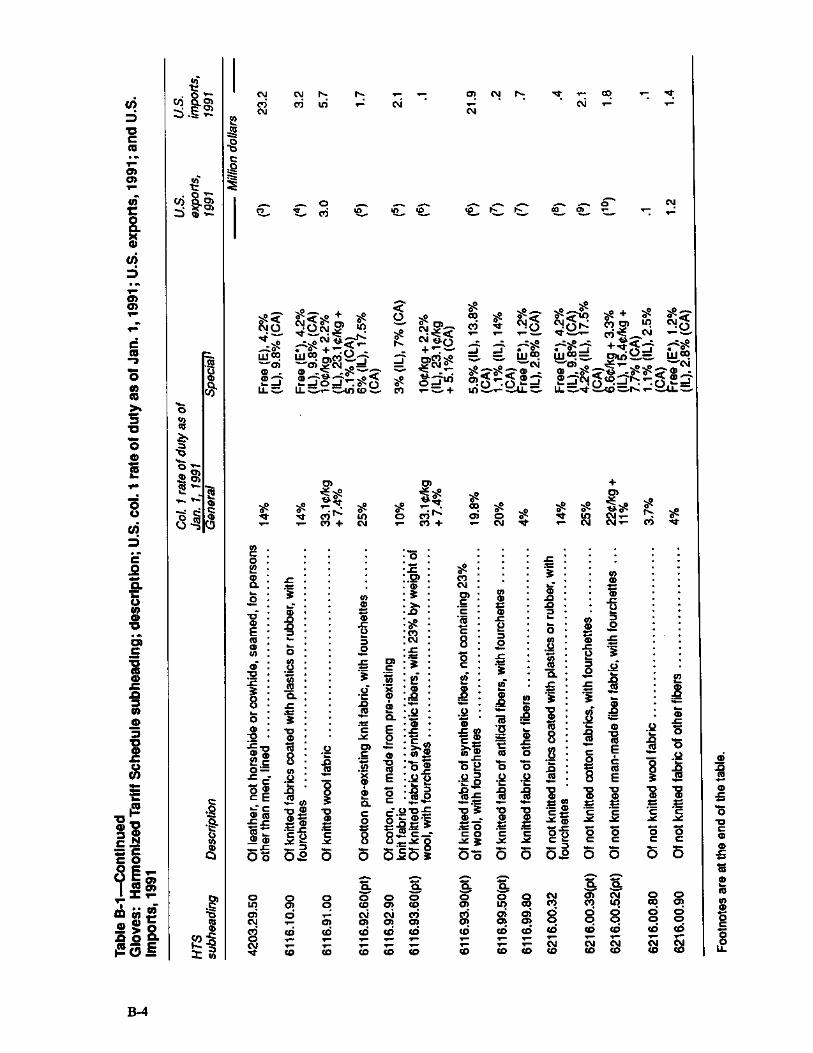
ui 6
ea 1 0) rn
CO.
1 0) co
co
O O cu
5
O
0
C
O .0
cn
0
2 r4
O
g a .0 0 As
a)
0 O
f kni
tted
fabr
ic o
f oth
er fi
bers
Of k
nitt
ed fa
bric
of a
rtifi
cial
fibe
rs, w
ith fo
urch
ette
s
Of n
ot k
nitte
d w
ool f
abric
Of n
ot kn
itted
fabr
ic o
f oth
er fi
bers
Of n
ot k
nitte
d co
tton
fabr
ics,
with
four
chet
tes
Of n
ot kn
itted
man
-mad
e fib
er fa
bric
, with
four
chet
tes
(N N. c°. CI CO
vf. 4
▪
1.7 rs t."7". or
e e e N o h.: co 9) NV
oR=J 26 0=1 ricia3
..Flall o to_i_.!--- 0 El; v() T
0)
N —
0) + ..: ... 0) .4 .4 vz
O e e e co g: e e .64: .4- .4-
Cc ) n co o oi h: 01 0 ' h: ,- CO + N 1- CO 4. .- It
'Cr LO CV g- 1- N NT CI 'V
Foot
note
s ar
e at
the
end
of th
e ta
ble.
O c)
C')
3% (
IL),
7% (
CA)
_c
.o
.0 2 O
as
-.= CC1
8 8
fD
▪
) E
..)c *6
3 O °
C■1 C,) O O CD
co
.0
2 8
"775
-a.
8 CO . Co
e
0.2
o co o
o o) 0.
a; r0
O) N '13. ei c6 co o ,- cm .4- ZO- CD
5 z e ..0 co a) cm 3 co
c >. _o c
Ts ile C Cc) N 8 .0 := '6 0) 3 c c
-7,73 d. e x a, .0 2 I' 2 .2 .52 CL
115 11).. E _c _c 1,0 O 2 ..— >.— >.--- co co co v) 0
..- = .0 al 0 _c 41) 5 2 E .22 .9 15 = I .9 15 , ,...2 co .c ,.0.. = do -0 -c -0 o " w - - a) = 1:3,1 ..-- To o..- ....z. CO 6 c 6 i,,
6 13
Ss_ o o o) co
ONE ONE 01 cci co .- ..-
o. 0 0 LO CO • a; el a' co CD
CO
a a
CO
COD
CO L0 CO 0) • a ci 0. 0 0. 0 CD Co CD tO Iczi c.71 CD CO CD CD
Of k
nitt
ed w
ool f
abric
6116
.92.
60(p
t) O
f c
otto
n p
re-e
xist
ing
knit
fabr
ic, w
ith fo
urch
ette
s
611
6.93
.90(
pt)
B-4

t:J:j I
VI
Table B-1-Contlnued Gloves: Harmonized Tariff Schedule subheading; description; U.S. col. 1 rate of duty as of Jan. 1, 1991 ; U.S. expons, 1991 ; and U.S. lmpons, 1991
Col. 1 rate of duty as of U.S. U.S. HTS Jan. 11 1991 exports, imports, subheading Description General Specialt 1991 1991
Million dollars
Sports gloves: 3926.20.20 Plastic baseball and softball gloves and mitts .......... 6% Free (A,E,IL), (11) 4.6
3926.20.30 Other than for baseball and softball, of plastic .......... 4.2% (CA)
(11) 3% Free (A,E,IL), 4.5
4203.21.20 Leather batting gloves .............................. 2.1% (CA)
(12) 3% Free (A,E,IL), 27.3
4203.21.40 Leather baseball and softball mitts .................... 2.1% (CA)
(12) 6% Free (A,E,IL), 81.0
4203.21.55 Leather cross-country ski gloves and mittens .......... 4.2% (CA)
(12) 3.5% Free (A,E,IL), 1.0
4203.21.60 2.4% (CA)
(12) Other leather ski and snowmobile gloves and mittens ... 5.5% Free (A,E, IL), 9.2
4203.21.70 3.8% (CA)
(12) Leather ice hockey gloves ........................... Free Free 2.9 4203.21.80 Other leather sports gloves, including goH gloves ....... 4.9% Free (A,E, IL), (12) 95.7
3.4% (CA) 6116.10.05 Ice and field hockey gloves of knitted fabrics coated with
J>lastics or rubber ...•............................... Free Free (4) (13) 6116.10.08 Other sports riloves of knitted fabrics coated with plastics
or rubber, inc uding ski .............................. 5.5% Free (A,E, IL), (4) 8.3 3.8% (CA)
(5) 6116.92.05 Ice and field hockey ~loves of knitted cotton fabric ...... Free Free 0 6116.92.08 Other sports gloves, including ski, of knitted
cotton fabric ....................................... 5.5% Free (A,E,IL), (5) .3 3.8% (CA)
6116.93.05 Ice and field hockey gloves of knitted fabric of (6) (13) synthetic fibers ..................................... Free Free
6116.93.08 Other s~rts gloves, including ski, of knitted fabric of (6) synthetic fibers ..................................... 5.5% Free (A,E,IL), 3.1
3.8% (CA) 6116.99.20 Ice and field hockey gloves of knitted fabric of
artificial fibers ...................................... Free Free (7) (13)
6116.99.35 ~~~i:fffb~:'.o.~~~· .i~~~~i~~. ~~~· .~f. ~~i~.~ ~~~~i~.~f ..... Free (A,E,IL), (7) (13) 5.5% 3.8% (CA)
6216.00.05 Ice and field hockey gloves, of not knitted fabric coated with plastics or rubber................................... Free Free (8) .1
Footnotes are at the end of the table.
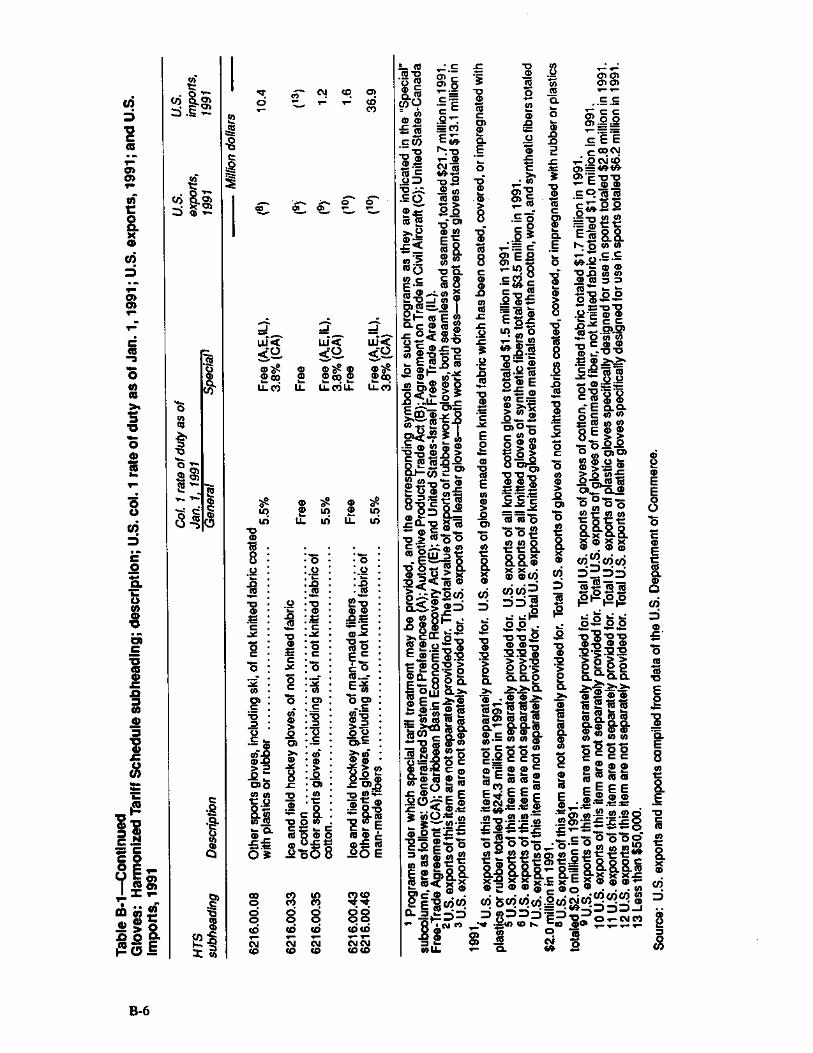
of rj 0.! CO cb
T CO
0
J j j LLIZe uf.."f 114 ."? <-0 < 0 <0 me 0 04 0 drat F. CO 2 e CO F. ° CO
Li- Cr) LL. LL. CO LL. Li.: Cr)
zrs.. Ln
O 8
-o
co C) C
C.)
ec.0 0 -a > 2
C)
▪
0̀ 0 0
ma _0= o
a. ea. o ;as!
ti m's Lel U, U. 10
-6 "6
P a
o a)
.0 -o e ̀m
m 7;5 -0 n
C :.... 0
-V 0 .-V
o '5 Ta 5 M c c
..v o O
"6 1 as ..•
c co El o a) 6 a) c c cri '6 Ni)- a) 0 o = > > -. o .2 o 2 co CA--
>. a >. a O 0 0
-V > -V > 0 o 82 ZIT,
0) .c 0).0 • tr) -0 en 4=
v - v 0 8.1
-a o 0 2 ' E Flhig ..6,
co ...... .... 2"60 8 .20E
CO CI LO qW 0 Ci C.3 .4.
0 6 o d d o o o o o
Co cci co co cc; N & Tm- && CO CO CO CO CO
co 6 'OC
Ctt
0)
U)
wax
ma)
C ess
5 mu'
'5
clo
132
C6" 1:103
.0
U)
2 2 Pi 0 cf 131 aS
g .0 0 _ccs E
E.- 0 '
c
.0 -C -o 0 . . ..-- as -o o 0 130 'c 71 c a) o u). os co a) ..- . -0 *5 -- am c = (I) a cc co 0 . E ri
en' c 1.1 8 .c
.c -
0, a, •
0 '.-- C e 0'0,22 _o 5' , 0 EZ4. 0_ o
-..7... .o
o cEE -o rs:-o .2 o 2 C C°. CI Om ,-- CD -C
0) ..-, NTS 8 c = co.) .a.444.9. -C . 0 CV CD
ri .0 EA...-. >. 0 = .0 0 -6 • 0 07) .° - Co 76 76
77) 1Z 10 .:-: a 0 2 _SO as e e a) g - .6 C .5 > 132 = .....g 8
;Tp 2
as p_s .cz si, 1:2-0 co 0 -0 0 .- ao = v
), 2 CD co) '0 g a E To a a _ca) < E -- t °
0 E N. 5 co co
0 = •.- = C
(0 , 8 0,E _ • ..•cc ..-
os ..-• Ci3 0 -o a c •-11) 8
.12, -CI .6 coCD -
CD 0 m = N 0 4_3) CD C Cr)..-
.-5 -0CD -IA f -,„°' .. -01 29 1 li -9-- -9.` ciri-e ---:-,1; , 2 I la 8 - =-0-0 .2.E a) a)
-6 1,-.1c 0 c 0- C :1..) CC cn -C E N O CO3) 0 0 ... - . . 12.0 = o a) 2 o
o E < co-o :0 475-= ✓ ..- 0 0 ca -0 c ca o = cp CD .0 -0
.2 1:14,„ w._ 8 0 o---'::r° 'Elii2s
t :8 -->"7-6)% ... co- as -e. 13$1-cii-; .0 wa2 8 _sc.= 5 .0 co'--cpoo = "6 Ts E .o •-• mu
2-L..=
-. 0 cm o-0.---0 cCm `-1̀) >a
o
. LI- -_0... 2 CA c.:- C co 8 #2 E cji w . a) ... -0
> u) o e E o.o- c o 0
0)5 >ial 2E oc vi, co: 1.5
= o 0 c° u' = 03 N(11 : milli CO t 1- 0 -le 0) 0 •!•,-_ 0
-V 0E ° 0 > > "5 0 -52
c 2 pil as .0°' 0 -52 " T30 > C ° COM M
co a) o 8J-6 2 _ To -o -c) cD 6 0 > o
0 >-.... ° ca-c
CO to Ira mai E M a. la cp 2 -5)-13
M > 0) 0.2
==t).1-e, s,) 0 0• 0 0-8 ' 81 > ..le _1c c o) " 6 ° "615
.Y (I) "M 0 0 .5 cf) = In co
0 ataa Cx 0 x
0
.c 0- 12 rid 5) ca u3 -6 0 as > as"6 75 6 co co 0 cs. c=
O 0 0 co 0 cp
al = = v 'M 'C M X E-----,.. yam 8. )01 0 6066 -o o .i.; , a a x x • 6 6 o so../x X 0. c p u)
:2 < as 0 al Fs 4 T3 To > •-e6 i 6 u vi vi? ..- - 2........._. 5 (31'05
7)14>:
•
4)1'
,r3 s- 1-1- 0....s > 2D n .5 • az1-- 1- ...: 'a0
E
..: o
O -0-g-2•00 -10 -0 914 >.cCC
•
16- -co -cs E 0 V, .0
.2 111 0 .2. t) 6 2
2 2'5 :
•
o > > > 2 lia 2 EG, ct...._ § 5.); ci..- ._ 0_ 0. e 2 0..„._ n.
- o uj o.›, > ,.>. 0. a. ›.. -=-- >,>.
. 0 o 0 ase E .2.. 0 uv>. >. 271) a) ,,,„ - ..._..,-. . 0 0.a - e U, CD .■ 1. ..''. tj
V; GI .m . ;g m .3 0 3 as 1 ael tdr,
In I . .e ,fa:".--: Ft a Sal s ..0::....q. ....g.
<Du, .6. .
.
a, a,
71 , 15 1.1Q0-6 ocoo C CC . .. , •6 0
c c:--005_ "g e .0.. , , .-em- 2-' e e.. 33,-; to- 0 -. ..E.,5 rd e e , to .3 c.
elE0 ' E EEE ..c a) E _.0. E E ,,.. CD 0 0 20•^E 0 ON co e • ..g=..=:. :c < a):= := 0),. ,== 0 ID •-• • „, . • NV ,:w co fo .0 a) co- a, a) co ...c .42 .P2 8
.06- fi..! ..45.-c- r..):E.- -bEtsi ....1.- .7c : In us°- c.- E 0 0 C 0 .= t' t' fa
7°Vig if iiiiirilk?"151 E 0 0) fa63.ccx x-Sxx x .cE ox0 0 0._. 0 0 0._ 00 o c oo • .. co
meca • • • - • • oo • a) 2 Emuico a) tiocqui.9.cocmu) • • 0 • • • •_ • te •m nm,_, a. 0 ._ m n connm•-n M -1- 0 2 12m o...-cmcvs .-- R . c4 a) ,--a ....--0 co vs co la .....,-,-- .5 S o) co o - . as = CD .L° (NI p 0 LL, I-- 0. EA ..-•
E O
C.) "6 C E
vi
O ca 51 0 E
0.
C
8
N
a cri
'a)
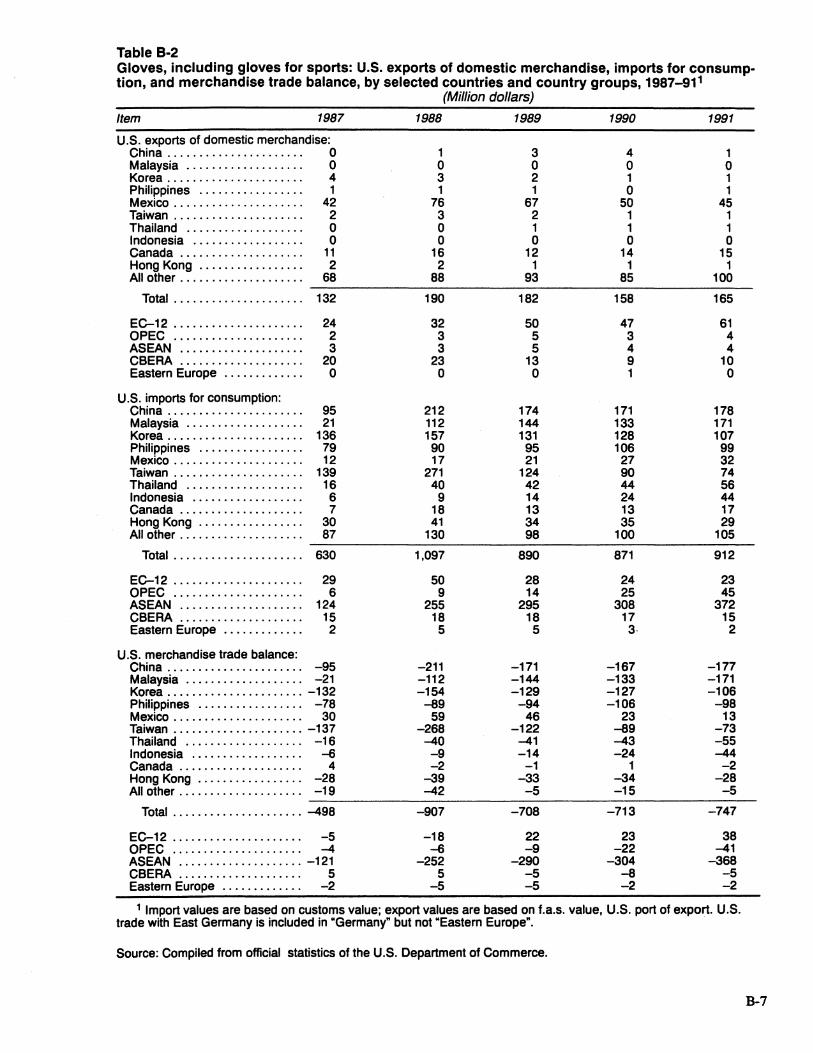
Table B-2 Gloves, including gloves for sports: U.S. exports of domestic merchandise, imports for consumption, and merchandise trade balance, by selected countries and country groups, 1987-911
(Million dollars)
Item 1987 1988 1989 1990 1991
U.S. exports of domestic merchandise: China ...................... 0 1 3 4 1 Malaysia ................... 0 0 0 0 0 Korea ...................... 4 3 2 1 1 Philippines ................. 1 1 1 0 1 Mexico ..................... 42 76 67 50 45 Taiwan ..................... 2 3 2 1 1 Thailand ................... 0 0 1 1 1 Indonesia .................. 0 0 0 0 0 Canada .................... 11 16 12 14 15 Hong Kong ................. 2 2 1 1 1 All other .................... 68 88 93 85 100
Total ..................... 132 190 182 158 165
EC-12 ..................... 24 32 50 47 61 OPEC ..................... 2 3 5 3 4 ASEAN .................... 3 3 5 4 4 CB ERA .................... 20 23 13 9 10 Eastern Europe ............. 0 0 0 1 0
U.S. imports for consumption: China ...................... 95 212 174 171 178 Malaysia ................... 21 112 144 133 171 Korea ...................... 136 157 131 128 107 Philippines ................. 79 90 95 106 99 Mexico ..................... 12 17 21 27 32 Taiwan ..................... 139 271 124 90 74 Thailand ................... 16 40 42 44 56 Indonesia .................. 6 9 14 24 44 Canada .................... 7 18 13 13 17 Hong Kong ................. 30 41 34 35 29 All other .................... 87 130 98 100 105
Total ..................... 630 1,097 890 871 912
EC-12 ..................... 29 50 28 24 23 OPEC ..................... 6 9 14 25 45 A SEAN .................... 124 255 295 308 372 CB ERA .................... 15 18 18 17 15 Eastern Europe ............. 2 5 5 3- 2
U.S. merchandise trade balance: China ...................... -95 -211 -171 -167 -177 Malaysia ................... -21 -112 -144 -133 -171 Korea ...................... -132 -154 -129 -127 -106 Philippines ................. -78 -89 -94 -106 -98 Mexico ..................... 30 59 46 23 13 Taiwan ..................... -137 -268 -122 -89 -73 Thailand ................... -16 -40 -41 -43 -55 Indonesia .................. --6 -9 -14 -24 -44 Canada .................... 4 -2 -1 1 -2 Hong Kong ................. -28 -39 -33 -34 -28 All other .................... -19 -42 -5 -15 -5
Total ..................... -498 -907 -708 -713 -747
EC-12 ..................... -5 -18 22 23 38 OPEC ..................... -4 --6 -9 -22 -41 A SEAN .................... -121 -252 -290 -304 -368 CBERA .................... 5 5 -5 -8 -5 Eastern Europe ............. -2 -5 -5 -2 -2
1 Import values are based on customs value; export values are based on f.a.s. value, U.S. port of export. U.S. trade with East Germany is included in "Germany" but not "Eastern Europe".
Source: Compiled from official statistics of the U.S. Department of Commerce.
B-7
