industry outlook 2016 - listed companyptt.listedcompany.com/...industry-outlook-am3q2015.pdf ·...
TRANSCRIPT
PTT Auditorium17 November 2015
Industry Outlook 2016

Speakers
2
Economics
Oil & Refining
LNG & Gas
Petrochemical
Contents
Economics Oil & Refining LNG & Gas Petrochemical
3
Economics
Presented By:
Jittinan AukayanagulAnalyst
Economics and Industry Research Department

Economics Oil & Refining LNG & Gas Petrochemical
5
US Economy: inventories and a strong dollar dragging down growth
Economics Oil & Refining LNG & Gas Petrochemical
6
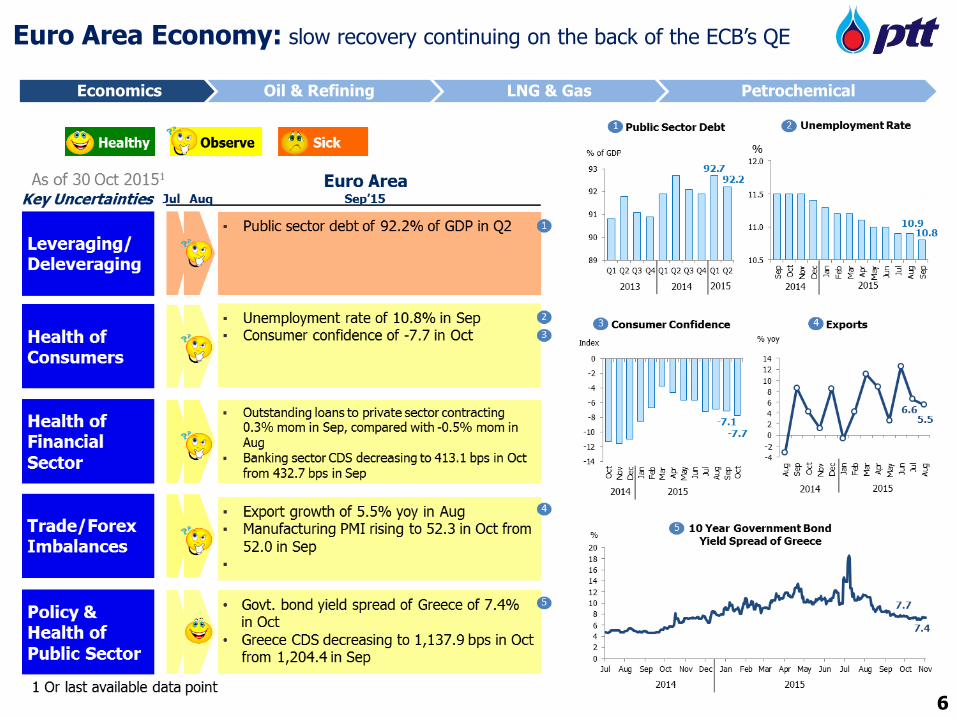
Euro Area Economy: slow recovery continuing on the back of the ECB’s QE
Economics Oil & Refining LNG & Gas Petrochemical
7
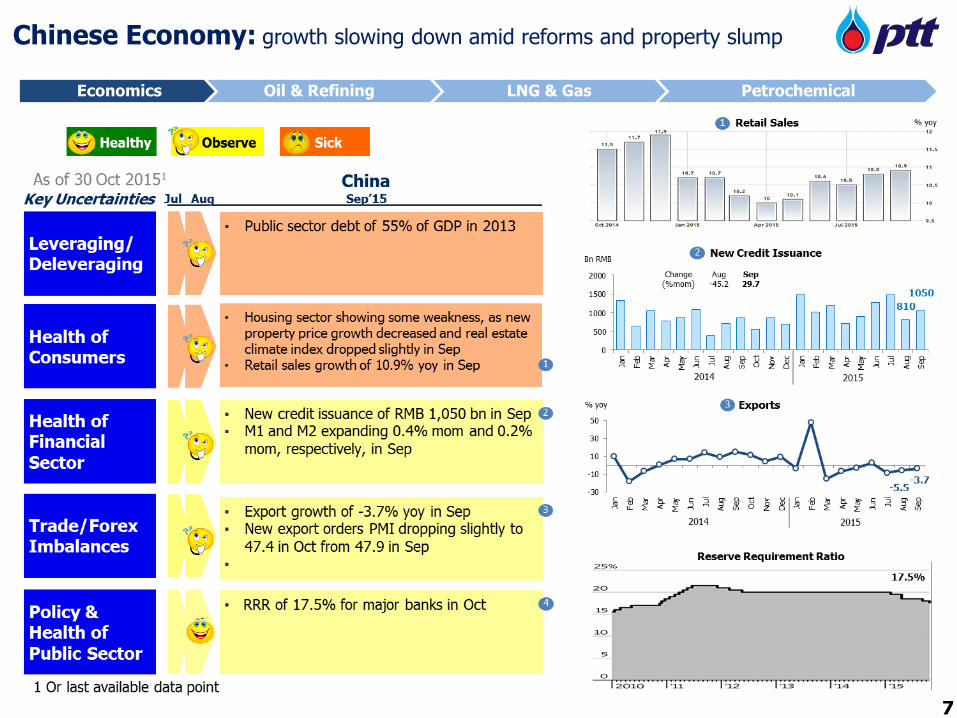
Chinese Economy: growth slowing down amid reforms and property slump
Economics Oil & Refining LNG & Gas Petrochemical
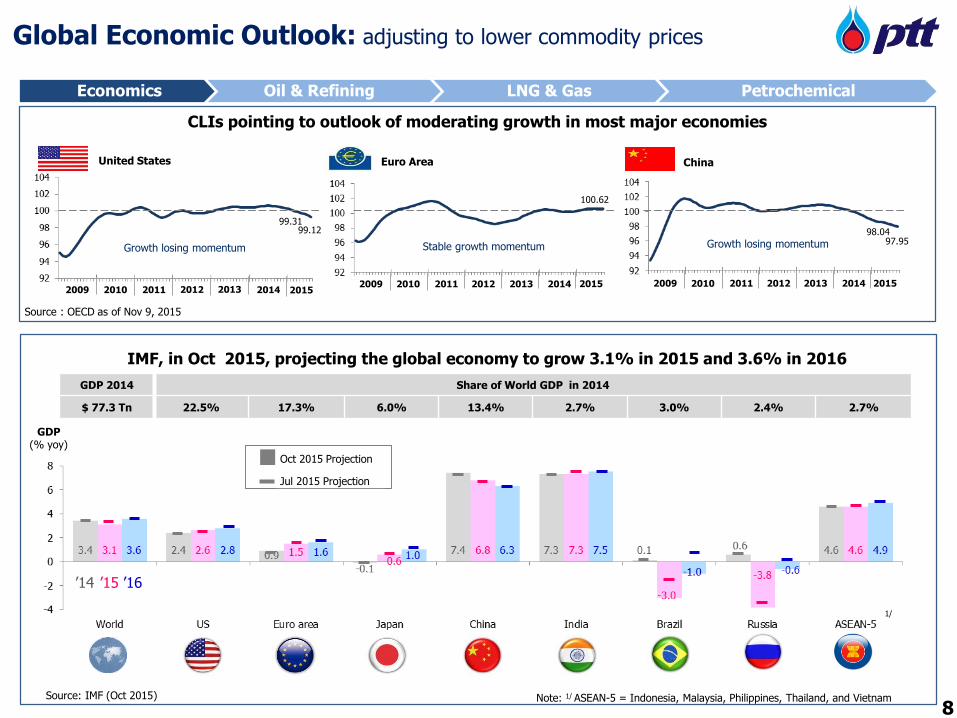
Global Economic Outlook: adjusting to lower commodity prices
GDP 2014 Share of World GDP in 2014
$ 77.3 Tn 22.5% 17.3% 6.0% 13.4% 2.7% 3.0% 2.4% 2.7%
China
2012201120102009 20132012201120102009 2013
Growth losing momentum98.04
United States Euro Area
Stable growth momentum
2012201120102009 2013
100.62
20142014 2014
99.1297.95
20152015 2015
99.31
CLIs pointing to outlook of moderating growth in most major economies
Source : OECD as of Nov 9, 2015
GDP(% yoy)
IMF, in Oct 2015, projecting the global economy to grow 3.1% in 2015 and 3.6% in 2016
1/
Source: IMF (Oct 2015) Note: 1/ ASEAN-5 = Indonesia, Malaysia, Philippines, Thailand, and Vietnam
’14 ’15 ’16
Apr 2015 Projection
Jul 2015 Projection Oct 2015 Projection
Jul 2015 Projection
Growth losing momentum
8
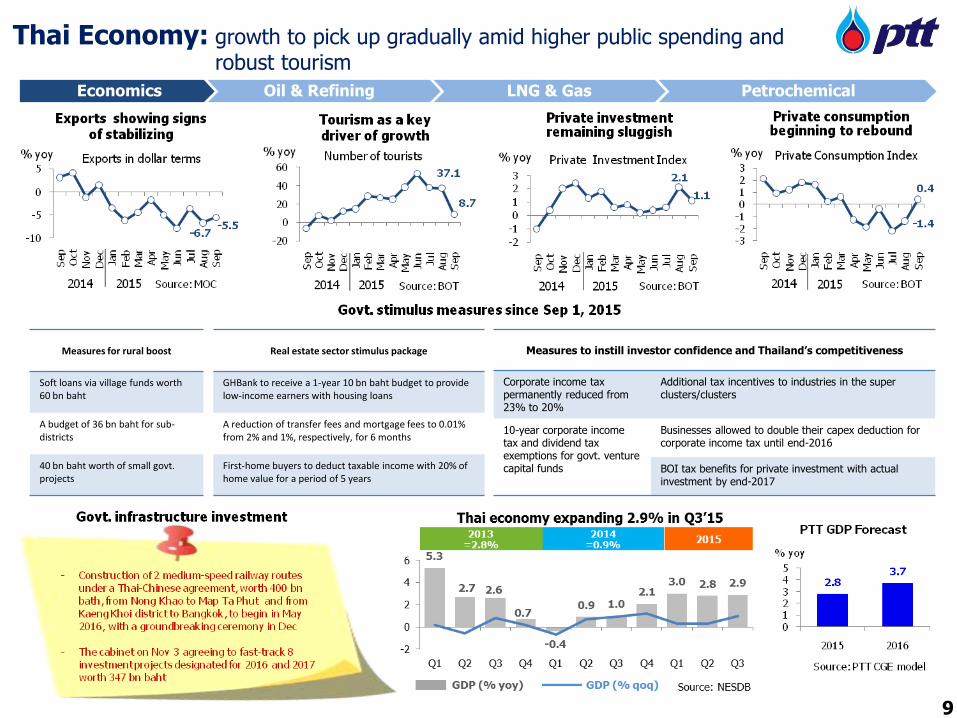
Thai Economy: growth to pick up gradually amid higher public spending and robust tourism
Economics Oil & Refining LNG & Gas Petrochemical
Measures for rural boost
Soft loans via village funds worth 60 bn baht
A budget of 36 bn baht for sub-districts
40 bn baht worth of small govt.projects
Real estate sector stimulus package
GHBank to receive a 1-year 10 bn baht budget to provide low-income earners with housing loans
A reduction of transfer fees and mortgage fees to 0.01% from 2% and 1%, respectively, for 6 months
First-home buyers to deduct taxable income with 20% of home value for a period of 5 years
Measures to instill investor confidence and Thailand’s competitiveness
Corporate income tax permanently reduced from 23% to 20%
Additional tax incentives to industries in the super clusters/clusters
10-year corporate income tax and dividend tax exemptions for govt. venture capital funds
Businesses allowed to double their capex deduction for corporate income tax until end-2016
BOI tax benefits for private investment with actual investment by end-2017
9
Economics
Oil & Refining
LNG & Gas
Petrochemical
Economics Oil & Refining LNG & Gas Petrochemical
Contents
10
Oil & Refining
Presented By:
Anintita PraokaewTeam Leader
Business Planning and Subsidiary Management Department
Economics Oil & Refining LNG & Gas Petrochemical
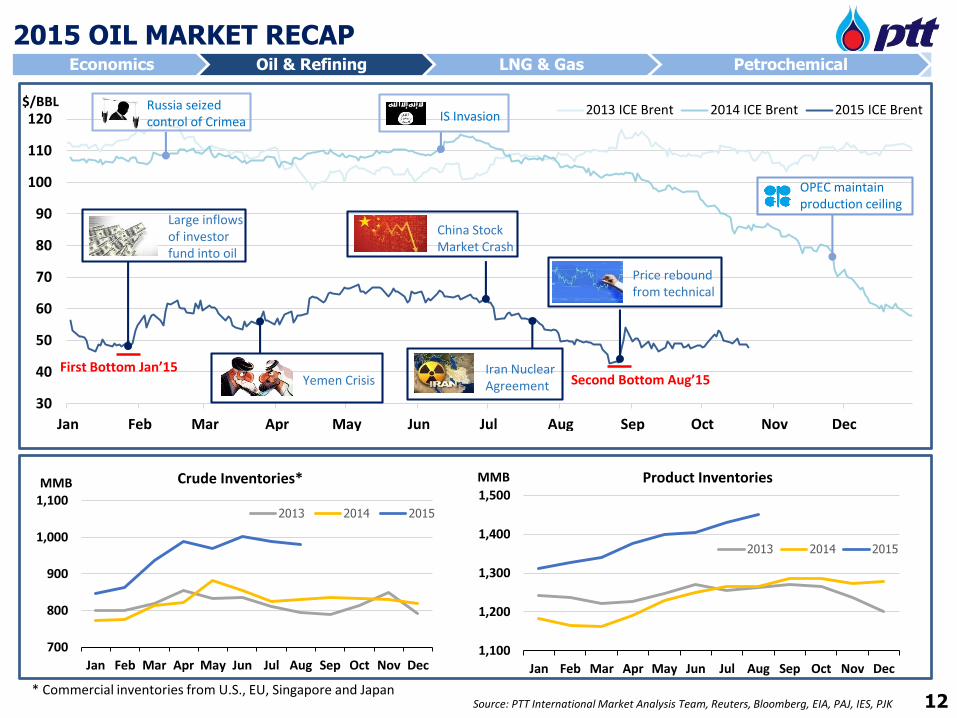
2015 OIL MARKET RECAP
30
40
50
60
70
80
90
100
110
120
Jan Feb Mar Apr May Jun Jul Aug Sep Oct Nov Dec
2013 ICE Brent 2014 ICE Brent 2015 ICE BrentIS InvasionRussia seized control of Crimea
OPEC maintain production ceiling
First Bottom Jan’15
Large inflows of investor fund into oil
Yemen Crisis
China Stock Market Crash
Iran Nuclear Agreement Second Bottom Aug’15
Price rebound from technical
$/BBL
Source: PTT International Market Analysis Team, Reuters, Bloomberg, EIA, PAJ, IES, PJK
700
800
900
1,000
1,100
Jan Feb Mar Apr May Jun Jul Aug Sep Oct Nov Dec
MMB Crude Inventories*
2013 2014 2015
1,100
1,200
1,300
1,400
1,500
Jan Feb Mar Apr May Jun Jul Aug Sep Oct Nov Dec
MMB Product Inventories
2013 2014 2015
* Commercial inventories from U.S., EU, Singapore and Japan12
Economics Oil & Refining LNG & Gas Petrochemical
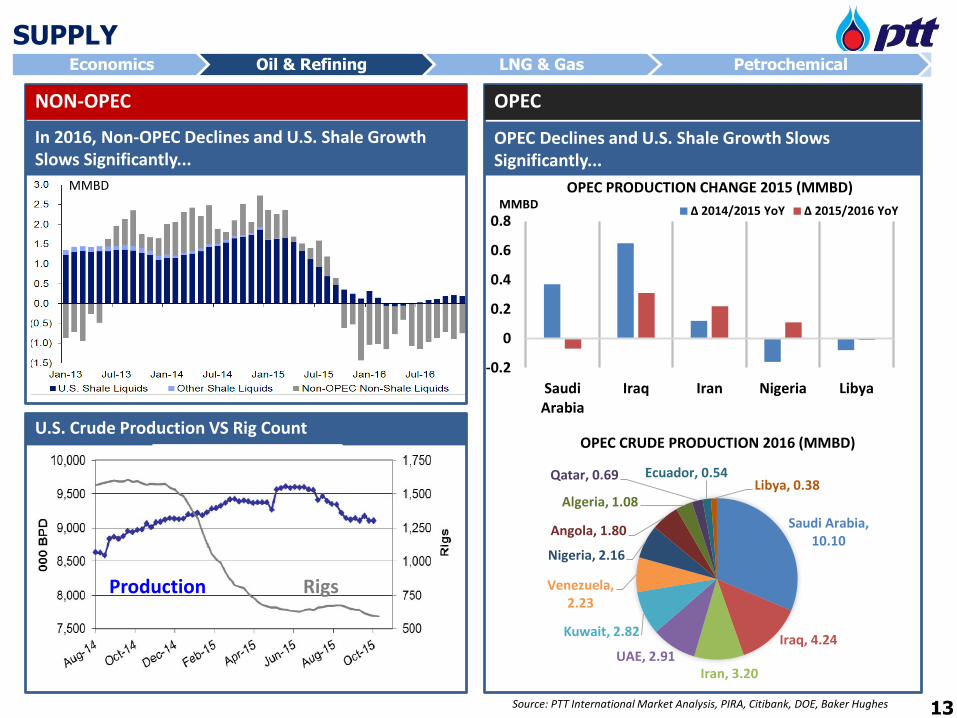
SUPPLY
Source: PTT International Market Analysis, PIRA, Citibank, DOE, Baker Hughes
-0.2
0
0.2
0.4
0.6
0.8
SaudiArabia
Iraq Iran Nigeria Libya
MMBDOPEC PRODUCTION CHANGE 2015 (MMBD)
∆ 2014/2015 YoY ∆ 2015/2016 YoY
Production Rigs
U.S. Crude Production VS Rig Count
In 2016, Non-OPEC Declines and U.S. Shale Growth Slows Significantly...
NON-OPEC
Saudi Arabia, 10.10
Iraq, 4.24
Iran, 3.20UAE, 2.91
Kuwait, 2.82
Venezuela, 2.23
Nigeria, 2.16
Angola, 1.80
Algeria, 1.08
Qatar, 0.69 Ecuador, 0.54Libya, 0.38
OPEC CRUDE PRODUCTION 2016 (MMBD)
OPEC Declines and U.S. Shale Growth Slows Significantly...
OPEC
MMBD
13
Economics Oil & Refining LNG & Gas Petrochemical
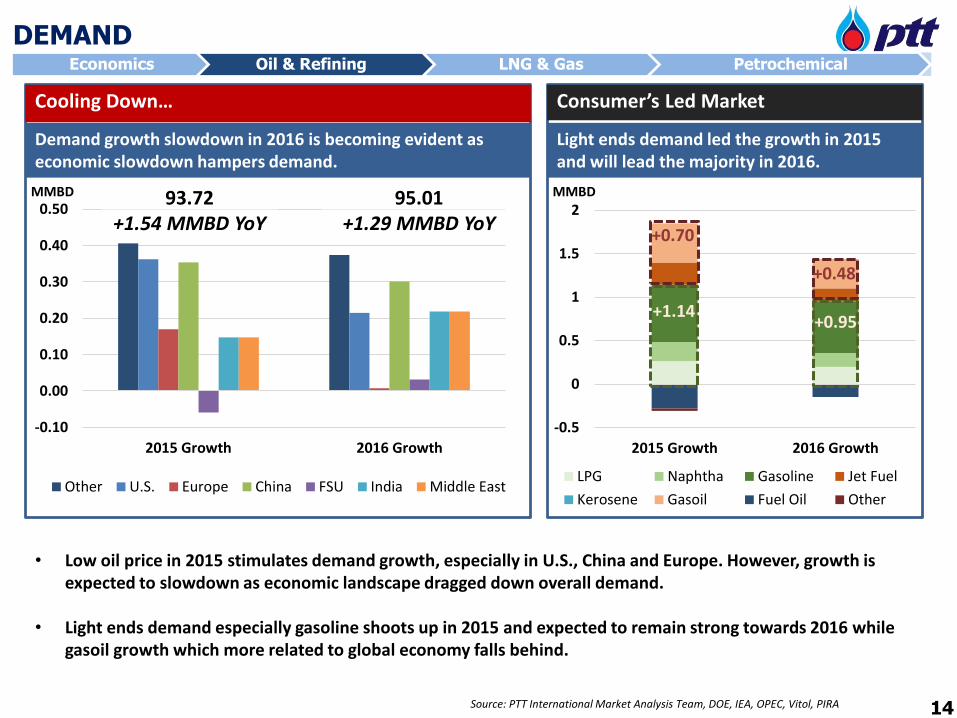
DEMAND
Source: PTT International Market Analysis Team, DOE, IEA, OPEC, Vitol, PIRA
-0.10
0.00
0.10
0.20
0.30
0.40
0.50
2015 Growth 2016 Growth
Other U.S. Europe China FSU India Middle East
95.01+1.29 MMBD YoY
93.72+1.54 MMBD YoY
Demand growth slowdown in 2016 is becoming evident as economic slowdown hampers demand.
Cooling Down…
-0.5
0
0.5
1
1.5
2
2015 Growth 2016 Growth
LPG Naphtha Gasoline Jet Fuel
Kerosene Gasoil Fuel Oil Other
+0.95+1.14
+0.70
+0.48
Light ends demand led the growth in 2015 and will lead the majority in 2016.
Consumer’s Led Market
• Low oil price in 2015 stimulates demand growth, especially in U.S., China and Europe. However, growth is expected to slowdown as economic landscape dragged down overall demand.
• Light ends demand especially gasoline shoots up in 2015 and expected to remain strong towards 2016 while gasoil growth which more related to global economy falls behind.
MMBD MMBD
14
Economics Oil & Refining LNG & Gas Petrochemical
REFINING BUSINESS
Source: PTT International Market Analysis Team, Energy Aspects, IEA
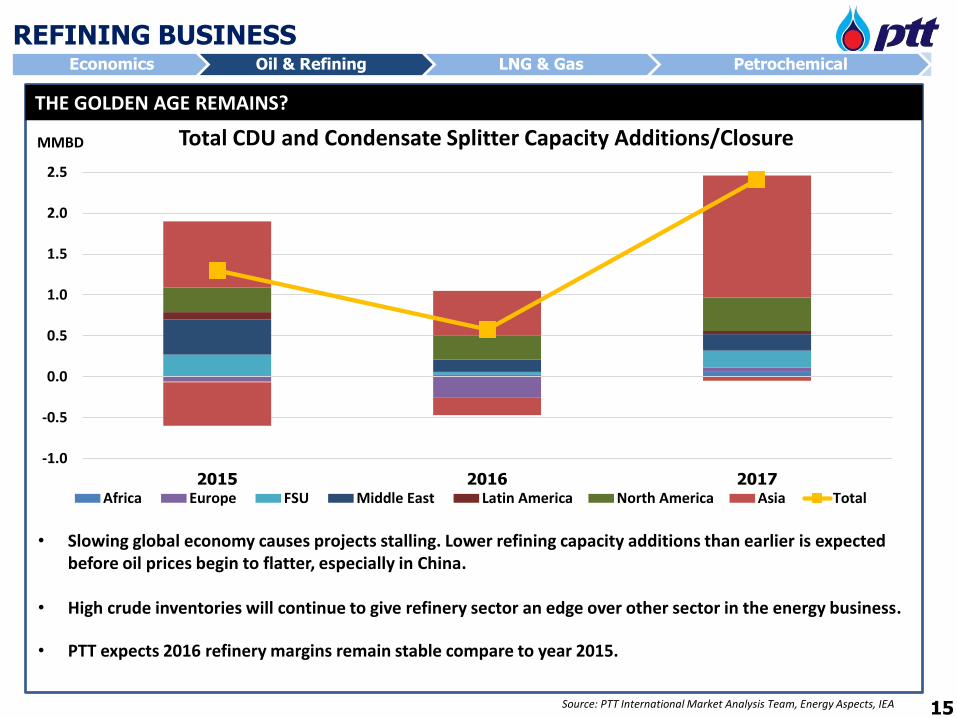
Total CDU and Condensate Splitter Capacity Additions/Closure
• Slowing global economy causes projects stalling. Lower refining capacity additions than earlier is expected before oil prices begin to flatter, especially in China.
• High crude inventories will continue to give refinery sector an edge over other sector in the energy business.
• PTT expects 2016 refinery margins remain stable compare to year 2015.
-1.0
-0.5
0.0
0.5
1.0
1.5
2.0
2.5
2015 2016 2017Africa Europe FSU Middle East Latin America North America Asia Total
MMBD
THE GOLDEN AGE REMAINS?
15
90
91
92
93
94
95
96
97
2014 1Q15 2Q15 3Q15 4Q15 1Q16 2Q16 3Q16 4Q16
Demand Supply
Economics Oil & Refining LNG & Gas Petrochemical
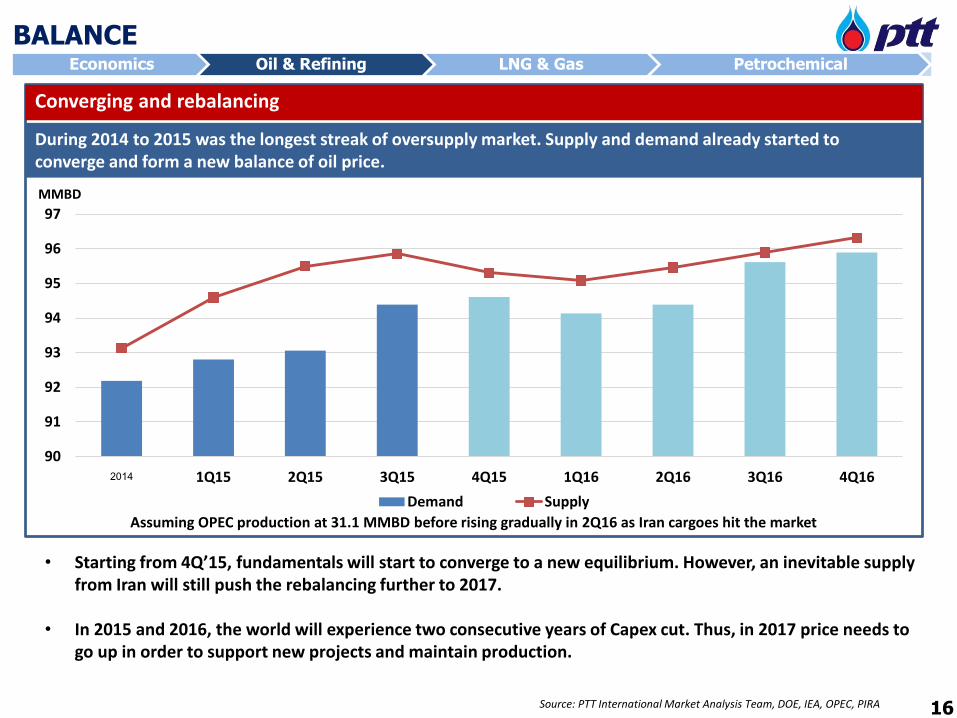
BALANCE
Source: PTT International Market Analysis Team, DOE, IEA, OPEC, PIRA
During 2014 to 2015 was the longest streak of oversupply market. Supply and demand already started to converge and form a new balance of oil price.
Converging and rebalancing
Assuming OPEC production at 31.1 MMBD before rising gradually in 2Q16 as Iran cargoes hit the market
MMBD
• Starting from 4Q’15, fundamentals will start to converge to a new equilibrium. However, an inevitable supply from Iran will still push the rebalancing further to 2017.
• In 2015 and 2016, the world will experience two consecutive years of Capex cut. Thus, in 2017 price needs to go up in order to support new projects and maintain production.
16
16
Economics Oil & Refining LNG & Gas Petrochemical
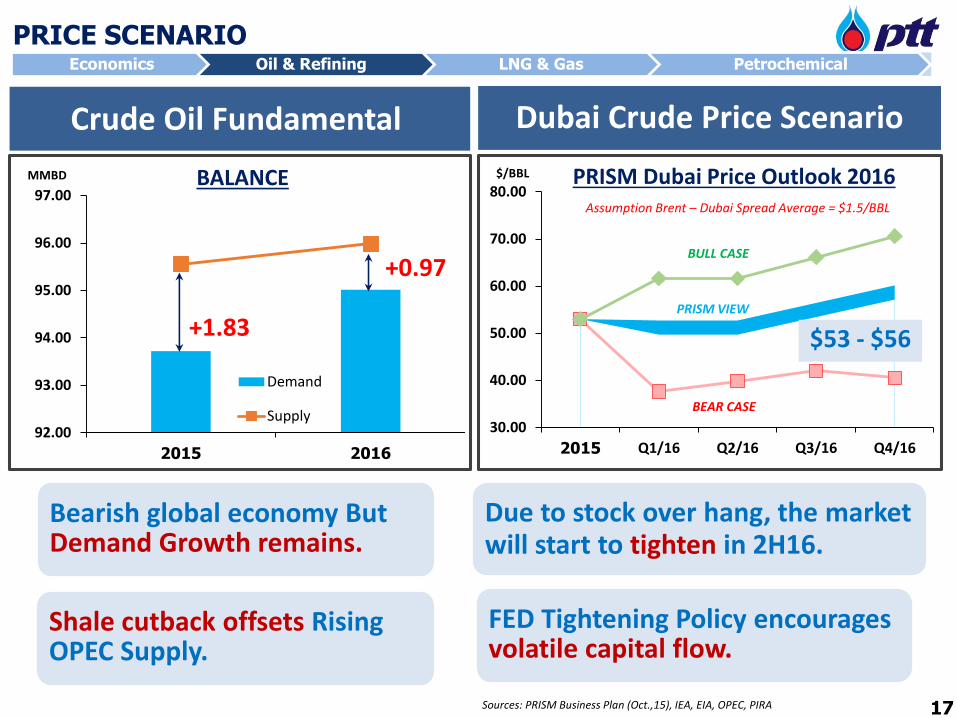
PRICE SCENARIO
Sources: PRISM Business Plan (Oct.,15), IEA, EIA, OPEC, PIRA
Bearish global economy ButDemand Growth remains.
Shale cutback offsets Rising OPEC Supply.
Due to stock over hang, the market will start to tighten in 2H16.
FED Tightening Policy encourages volatile capital flow.
30.00
40.00
50.00
60.00
70.00
80.00
2015 Q1/16 Q2/16 Q3/16 Q4/16
$/BBL
Dubai Crude Price ScenarioCrude Oil Fundamental
92.00
93.00
94.00
95.00
96.00
97.00
2015 2016
MMBD
Demand
Supply
+1.83
+0.97
BALANCE PRISM Dubai Price Outlook 2016Assumption Brent – Dubai Spread Average = $1.5/BBL
BULL CASE
BEAR CASE
PRISM VIEW
$53 - $56
17
Economics
Oil & Refining
LNG & Gas
Petrochemical
Economics Oil & Refining LNG & Gas Petrochemical
Contents
18
LNG & Gas
Presented By:
Dulyapun BuranawitTeam Leader
Liquefied Natural Gas Supply Department
19
Economics Oil & Refining LNG & Gas Petrochemical
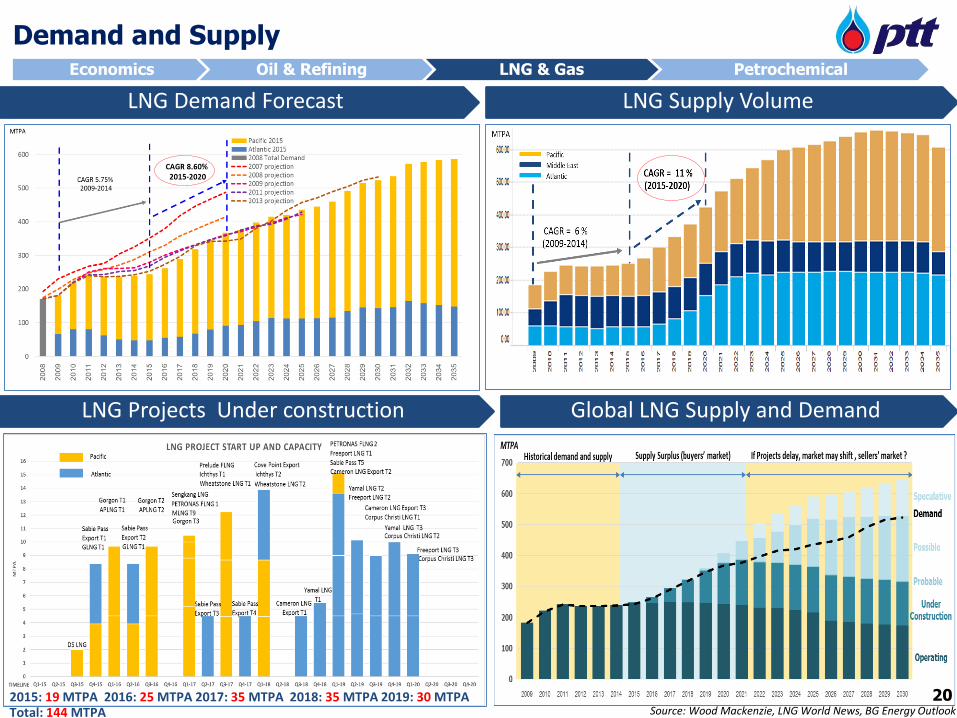
Demand and Supply
Global LNG Supply and Demand
LNG Demand Forecast LNG Supply Volume
LNG Projects Under construction
2015: 19 MTPA 2016: 25 MTPA 2017: 35 MTPA 2018: 35 MTPA 2019: 30 MTPATotal: 144 MTPA Source: Wood Mackenzie, LNG World News, BG Energy Outlook
20

20
LNG Price Outlook and Key Drivers 2016
Bull Bear
• New LNG demand from emerging countries in South East Asia, Middle East, and Eastern Europe
• Positive outcomes from United Nation climate change conference in Paris (Nov)
• Faster-than-expected depletion of indigenous gas in Europe/Asia/South America
• EU policy for guidance of emission trading system (EU ETS) and gas diversification from Russia
• New LNG supply from Australian and US projects (GLNG, APLNG, Gorgon, and Sabine Pass)
• Restart of nuclear power plants in Japan and new commercial operation plants in Korea
• Wildcard LNG projects in Angola and Yemen might start up their production in 2016
• Existing gas price structures in India and China discourage domestic gas consumption
Henry Hub Outlook 2016 LNG Price Outlook 2016
LNG Market Key Drivers for 2016
Source: Wood Mackenzie, PIRA Remark: HH excludes liquefaction fees and freight costs
Economics Oil & Refining LNG & Gas Petrochemical
HH 2016 2.7 – 3.2 $/MMBTU
Long term LNG Price7 – 9 $/MMBTU
Spot LNG Price6 - 7 $/MMBTU
Price divergence
21
Economics
Oil & Refining
LNG & Gas
Petrochemical
Economics Oil & Refining LNG & Gas Petrochemical
Contents
22
Petrochemical
Presented By:
Ekachai SirithammasanVice President
Petrochemicals Subsidiary Planning & Management Department
Economics Oil & Refining LNG & Gas Petrochemical
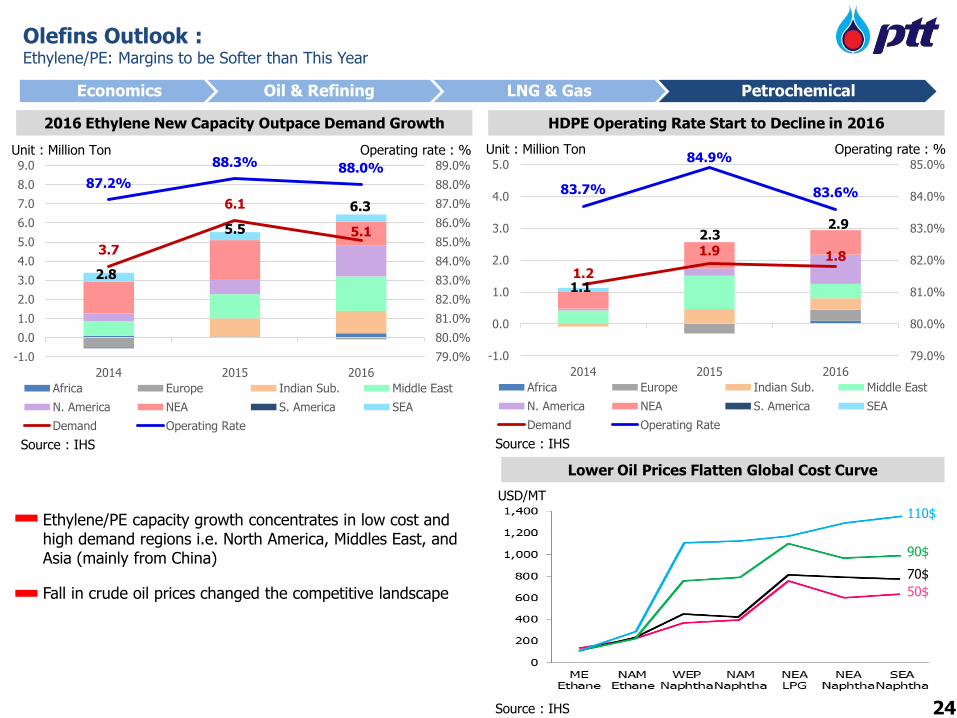
Olefins Outlook :Ethylene/PE: Margins to be Softer than This Year
Ethylene/PE capacity growth concentrates in low cost and high demand regions i.e. North America, Middles East, and Asia (mainly from China)
Fall in crude oil prices changed the competitive landscape
USD/MT
Lower Oil Prices Flatten Global Cost Curve
110$
90$
70$
50$
Source : IHS
2016 Ethylene New Capacity Outpace Demand Growth
Source : IHS
3.7
6.1
5.1
87.2%
88.3% 88.0%
79.0%
80.0%
81.0%
82.0%
83.0%
84.0%
85.0%
86.0%
87.0%
88.0%
89.0%
-1.0
0.0
1.0
2.0
3.0
4.0
5.0
6.0
7.0
8.0
9.0
2014 2015 2016
Africa Europe Indian Sub. Middle East
N. America NEA S. America SEA
Demand Operating Rate
Unit : Million Ton Operating rate : %
6.3
5.5
2.8
HDPE Operating Rate Start to Decline in 2016
Source : IHS
1.2
1.9 1.8
83.7%
84.9%
83.6%
79.0%
80.0%
81.0%
82.0%
83.0%
84.0%
85.0%
-1.0
0.0
1.0
2.0
3.0
4.0
5.0
2014 2015 2016
Africa Europe Indian Sub. Middle East
N. America NEA S. America SEA
Demand Operating Rate
Unit : Million Ton Operating rate : %
2.3
1.1
2.9
24
Economics Oil & Refining LNG & Gas Petrochemical
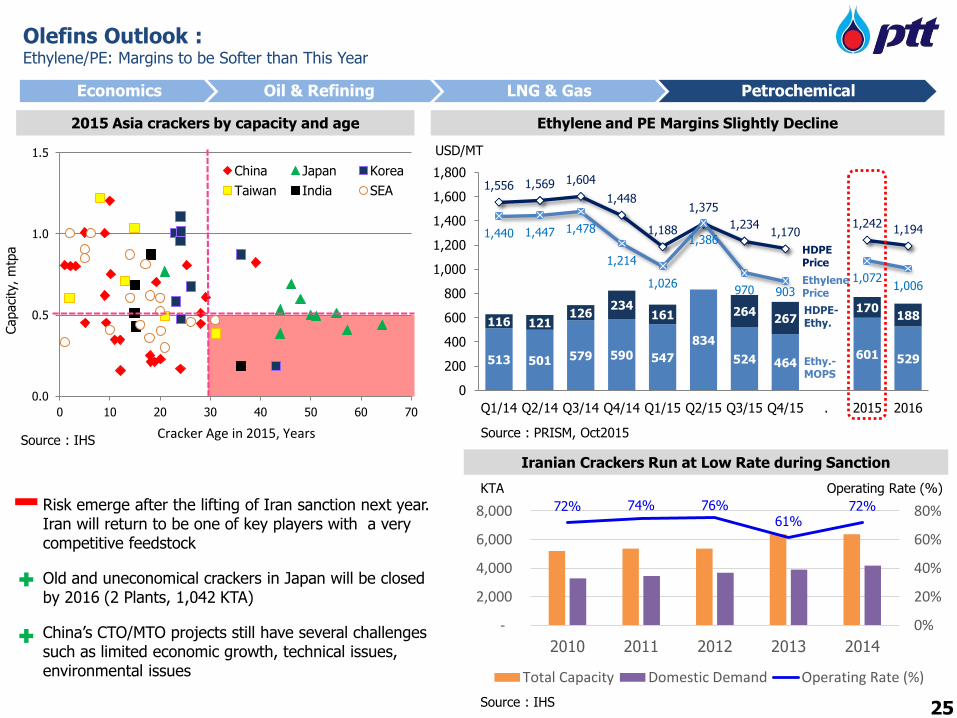
2015 Asia crackers by capacity and age Ethylene and PE Margins Slightly Decline
513 501 579 590 547
834
524 464601 529
116 121126
234161 264
267170
188
1,556 1,569 1,604
1,448
1,188
1,375
1,2341,170
1,2421,1941,440 1,447 1,478
1,214
1,026
1,386
970 9031,072
1,006
0
200
400
600
800
1,000
1,200
1,400
1,600
1,800
Q1/14 Q2/14 Q3/14 Q4/14 Q1/15 Q2/15 Q3/15 Q4/15 . 2015 2016
USD/MT
HDPE-Ethy.
Ethy.-MOPS
HDPE Price
Ethylene Price
72% 74% 76%61%
72%
0%
20%
40%
60%
80%
-
2,000
4,000
6,000
8,000
2010 2011 2012 2013 2014
Total Capacity Domestic Demand Operating Rate (%)
Iranian Crackers Run at Low Rate during Sanction
KTA Operating Rate (%)
Source : IHSSource : PRISM, Oct2015
Olefins Outlook :Ethylene/PE: Margins to be Softer than This Year
Risk emerge after the lifting of Iran sanction next year. Iran will return to be one of key players with a very competitive feedstock
Old and uneconomical crackers in Japan will be closed by 2016 (2 Plants, 1,042 KTA)
China’s CTO/MTO projects still have several challenges such as limited economic growth, technical issues, environmental issues
0.0
0.5
1.0
1.5
0 10 20 30 40 50 60 70
China Japan Korea
Taiwan India SEA
Cracker Age in 2015, Years
Capaci
ty, m
tpa
Source : IHS 25
Economics Oil & Refining LNG & Gas Petrochemical
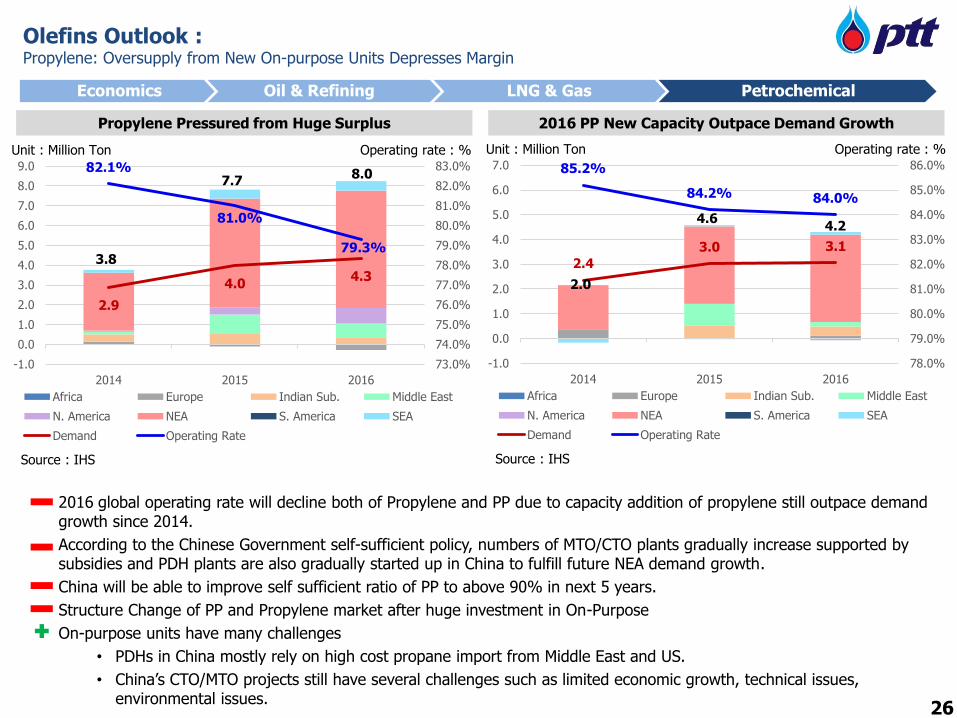
Propylene Pressured from Huge Surplus 2016 PP New Capacity Outpace Demand Growth
Source : IHS
2.9
4.04.3
82.1%
81.0%
79.3%
73.0%
74.0%
75.0%
76.0%
77.0%
78.0%
79.0%
80.0%
81.0%
82.0%
83.0%
-1.0
0.0
1.0
2.0
3.0
4.0
5.0
6.0
7.0
8.0
9.0
2014 2015 2016
Africa Europe Indian Sub. Middle East
N. America NEA S. America SEA
Demand Operating Rate
Unit : Million Ton Operating rate : %
Source : IHS
2.4
3.0 3.1
85.2%
84.2% 84.0%
78.0%
79.0%
80.0%
81.0%
82.0%
83.0%
84.0%
85.0%
86.0%
-1.0
0.0
1.0
2.0
3.0
4.0
5.0
6.0
7.0
2014 2015 2016
Africa Europe Indian Sub. Middle East
N. America NEA S. America SEA
Demand Operating Rate
Unit : Million Ton Operating rate : %
2016 global operating rate will decline both of Propylene and PP due to capacity addition of propylene still outpace demand growth since 2014.
According to the Chinese Government self-sufficient policy, numbers of MTO/CTO plants gradually increase supported by subsidies and PDH plants are also gradually started up in China to fulfill future NEA demand growth.
China will be able to improve self sufficient ratio of PP to above 90% in next 5 years.
Structure Change of PP and Propylene market after huge investment in On-Purpose
On-purpose units have many challenges
• PDHs in China mostly rely on high cost propane import from Middle East and US.
• China’s CTO/MTO projects still have several challenges such as limited economic growth, technical issues, environmental issues.
Olefins Outlook :Propylene: Oversupply from New On-purpose Units Depresses Margin
3.8
7.78.0
2.0
4.64.2
26
Economics Oil & Refining LNG & Gas Petrochemical
Source : IHS
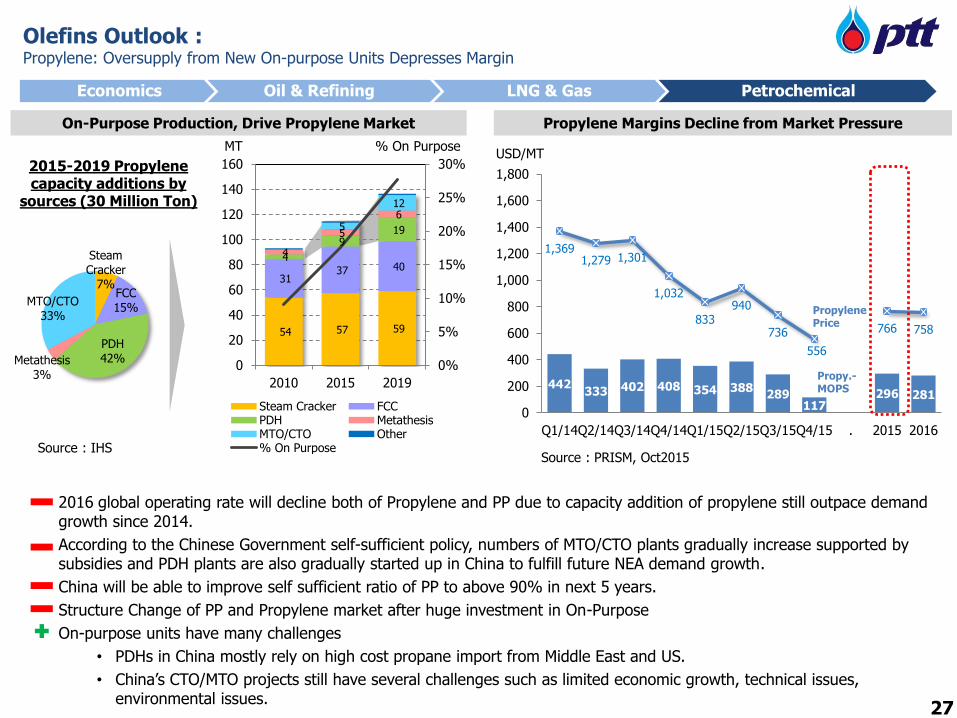
Propylene Margins Decline from Market Pressure
442333 402 408 354 388
289117
296 281
1,3691,279 1,301
1,032
833940
736
556
766 758
0
200
400
600
800
1,000
1,200
1,400
1,600
1,800
Q1/14Q2/14Q3/14Q4/14Q1/15Q2/15Q3/15Q4/15 . 2015 2016
USD/MT
Propy.-MOPS
Propylene Price
Source : PRISM, Oct2015
On-Purpose Production, Drive Propylene Market
Steam Cracker
7%FCC15%
PDH42%Metathesis
3%
MTO/CTO33%
2015-2019 Propylene capacity additions by
sources (30 Million Ton)
MT
54 57 59
31 37 40
4
9 19
4
5
6 5
12
0%
5%
10%
15%
20%
25%
30%
0
20
40
60
80
100
120
140
160
2010 2015 2019
Steam Cracker FCCPDH MetathesisMTO/CTO Other% On Purpose
% On Purpose
Olefins Outlook :Propylene: Oversupply from New On-purpose Units Depresses Margin
2016 global operating rate will decline both of Propylene and PP due to capacity addition of propylene still outpace demand growth since 2014.
According to the Chinese Government self-sufficient policy, numbers of MTO/CTO plants gradually increase supported by subsidies and PDH plants are also gradually started up in China to fulfill future NEA demand growth.
China will be able to improve self sufficient ratio of PP to above 90% in next 5 years.
Structure Change of PP and Propylene market after huge investment in On-Purpose
On-purpose units have many challenges
• PDHs in China mostly rely on high cost propane import from Middle East and US.
• China’s CTO/MTO projects still have several challenges such as limited economic growth, technical issues, environmental issues.
27
Economics Oil & Refining LNG & Gas Petrochemical
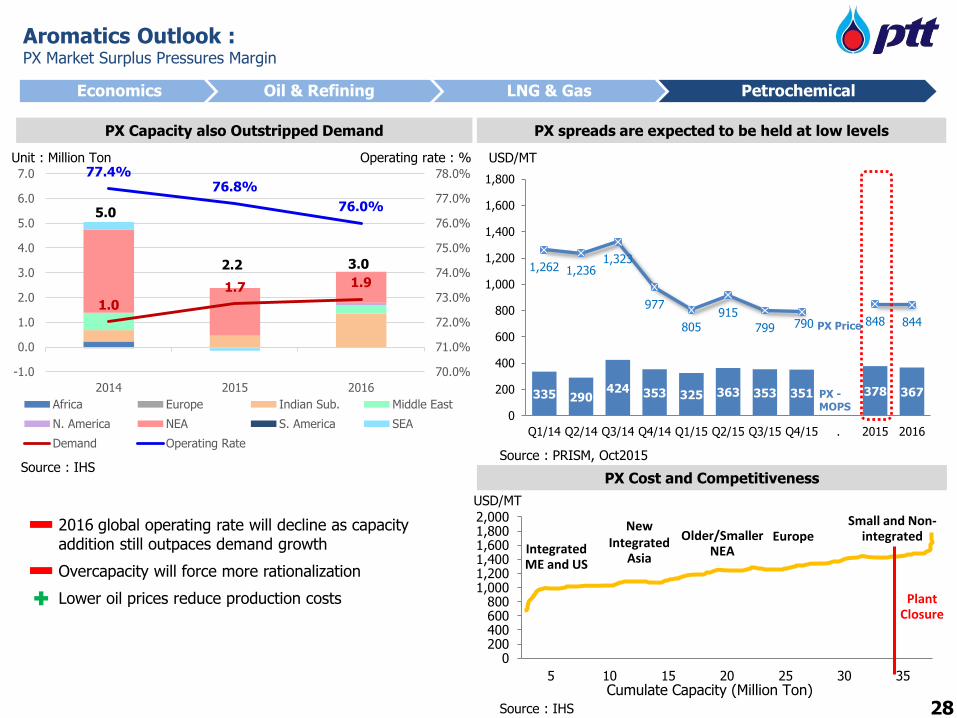
Aromatics Outlook :PX Market Surplus Pressures Margin
PX Capacity also Outstripped Demand
2016 global operating rate will decline as capacity addition still outpaces demand growth
Overcapacity will force more rationalization
Lower oil prices reduce production costs
PX spreads are expected to be held at low levels
335 290424 353 325 363 353 351 378 367
1,262 1,2361,323
977
805915
799 790 848 844
0
200
400
600
800
1,000
1,200
1,400
1,600
1,800
Q1/14 Q2/14 Q3/14 Q4/14 Q1/15 Q2/15 Q3/15 Q4/15 . 2015 2016
USD/MT
PX -MOPS
PX Price
Source : PRISM, Oct2015
PX Cost and Competitiveness
0200400600800
1,0001,2001,4001,6001,8002,000
5 10 15 20 25 30 35
Integrated ME and US
New Integrated
Asia
Older/Smaller NEA
EuropeSmall and Non-
integrated
PlantClosure
USD/MT
Cumulate Capacity (Million Ton)
Source : IHS
1.0
1.7 1.9
77.4%76.8%
76.0%
70.0%
71.0%
72.0%
73.0%
74.0%
75.0%
76.0%
77.0%
78.0%
-1.0
0.0
1.0
2.0
3.0
4.0
5.0
6.0
7.0
2014 2015 2016
Africa Europe Indian Sub. Middle East
N. America NEA S. America SEA
Demand Operating Rate
Unit : Million Ton Operating rate : %
5.0
2.2 3.0
Source : IHS 28
Economics Oil & Refining LNG & Gas Petrochemical
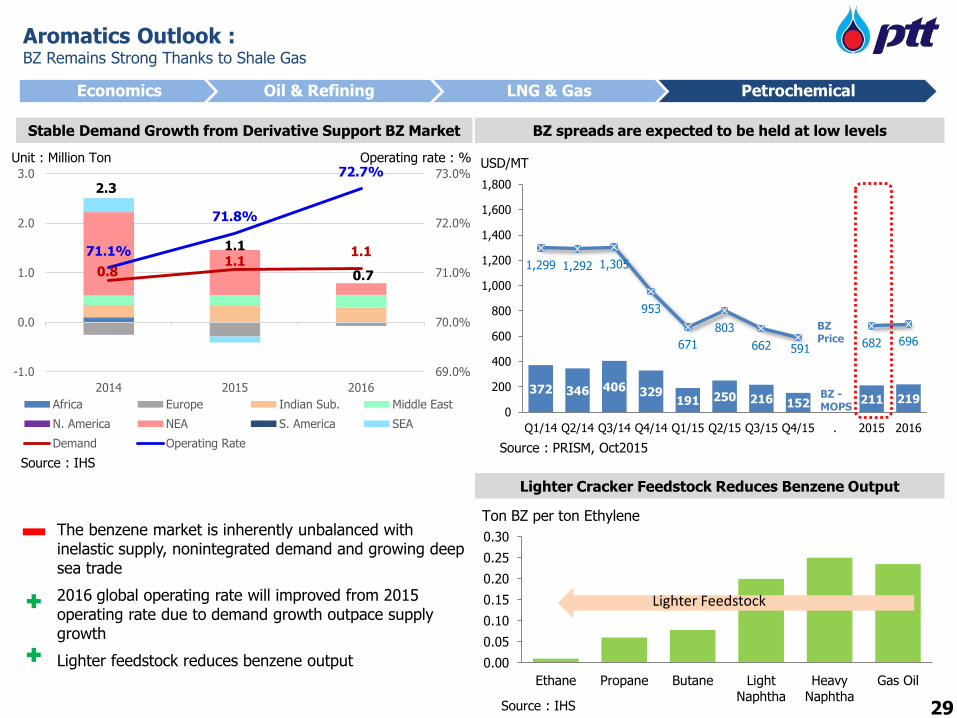
Aromatics Outlook :BZ Remains Strong Thanks to Shale Gas
Stable Demand Growth from Derivative Support BZ Market BZ spreads are expected to be held at low levels
372 346 406 329191 250 216 152 211 219
1,299 1,292 1,305
953
671
803
662 591 682 696
0
200
400
600
800
1,000
1,200
1,400
1,600
1,800
Q1/14 Q2/14 Q3/14 Q4/14 Q1/15 Q2/15 Q3/15 Q4/15 . 2015 2016
USD/MT
BZ -MOPS
BZ Price
Lighter Cracker Feedstock Reduces Benzene Output
0.00
0.05
0.10
0.15
0.20
0.25
0.30
Ethane Propane Butane LightNaphtha
HeavyNaphtha
Gas Oil
Ton BZ per ton Ethylene
Lighter Feedstock
Source : IHS
0.81.1
1.171.1%
71.8%
72.7%
69.0%
70.0%
71.0%
72.0%
73.0%
-1.0
0.0
1.0
2.0
3.0
2014 2015 2016
Africa Europe Indian Sub. Middle East
N. America NEA S. America SEA
Demand Operating Rate
Unit : Million Ton Operating rate : %
Source : PRISM, Oct2015
The benzene market is inherently unbalanced with inelastic supply, nonintegrated demand and growing deep sea trade
2016 global operating rate will improved from 2015 operating rate due to demand growth outpace supply growth
Lighter feedstock reduces benzene output
2.3
0.7
1.1
Source : IHS 29
Thank youPTT Public Company Limited – Investor Relations Department
Tel. +66 2 537-3518, Fax. +66 2 537-3948, E-mail: [email protected] Website: http://www.pttplc.com
Disclaimer
The information contained in our presentation is intended solely for your personal reference only. In addition, such information contains projections and forward-looking
statements that reflect our current views with respect to future events and financial performance. These views are based on assumptions subject to various risks and
uncertainties. No assurance is given that future events will occur, that projections will be achieved, or that our assumptions are correct. Actual results may differ
materially from those projected.
Petroleum Reserves and Resources Information
In this presentation, the Company discloses petroleum reserves and resources that are not included in the Securities Exchange and Commission of Thailand (SEC) Annual
Registration Statement Form 56-1 under “Supplemental Information on Petroleum Exploration and Production Activities”. The reserves and resources data contained in
this presentation reflects the Company’s best estimates of its reserves and resources. While the Company periodically obtains an independent audit of a portion of its
proved reserves, no independent qualified reserves evaluator or auditor was involved in the preparation of reserves and resources data disclosed in this presentation.
Unless stated otherwise, reserves and resources are stated at the Company’s gross basis. This presentation may contain the terms “proved reserves”, “probable reserves”,
and/or “contingent resources”. Unless stated otherwise, the Company adopts similar description as defined by the Society of Petroleum Engineers.
Proved Reserves - Proved reserves are defined as those quantities of petroleum which, by analysis of geological and engineering data, can be estimated with reasonable
certainty to be commercially recoverable, from a given date forward, from known reservoirs and under current economic conditions, operating methods, and government
regulations.
Probable Reserves - Probable reserves are defined as those unproved reserves which analysis of geological and engineering data suggests are more likely than not to be
recoverable.
Contingent Resources – Contingent resources are defined as those quantities of petroleum which are estimated, on a given date, to be potentially recoverable from
known accumulations, but which are not currently considered to be commercially recoverable. The reasons for non commerciality could be economic including market
availability, political, environmental, or technological.
29
30

30
Q & A
31