industry outlook global reinsurance outlooks global reinsurance...2 september 3, 2013 industry...
TRANSCRIPT

INDUSTRY OUTLOOK
INSURANCE SEPTEMBER 3, 2013
Table of Contents:
SUMMARY OPINION 1 KEY TRENDS AND RATING IMPLICATIONS 4
Macroeconomic Environment Remains Challenging, but Manageable 4 Influx of Alternative Capital Roils Market 4 Sidecars Present an Opportunity for Reinsurers to Monetize Risk Expertise 5 Resilience and Discipline are Key Strengths for the Sector 6 Pricing picture is mixed; Profitability outlook dependent on business mix and geography 7 Rising interest rates set the stage for improved profitability longer term 8 Reinsurers are Adapting to the Evolution of the Market 9
MOODY’S RELATED RESEARCH 11
Analyst Contacts:
NEW YORK +1.212.553.1653
James Eck +1.212.553.4438 Vice President - Senior Credit Officer [email protected]
Kevin Lee +1.212.553.2907 Vice President - Senior Credit Officer [email protected]
Brandan Holmes +1.212.553.6897 Assistant Vice President - Analyst [email protected]
Scott Robinson +1.212.553.3746 Senior Vice President [email protected]
Christos Yerolemou +1.212.553.2871 Associate Analyst [email protected]
Yulia Davletova +1.212.553.1370 Associate Analyst [email protected]
>>contacts continued on the last page
Global Reinsurance Outlook
Summary Opinion Our outlook on the global reinsurance industry is stable. The outlook expresses our expectations for the fundamental credit conditions over the next 12 to 18 months. The stable outlook reflects the industry’s resilience in the face of a challenging operating environment, continued underwriting discipline and improvements in risk management, as well as firmer pricing in some primary insurance markets. The industry faces, however, a number of challenges, including: increased competition from alternative markets that has pressured property catastrophe reinsurance pricing, continued low interest rates and tepid demand given sluggish economic conditions in North America and Europe. On balance however, we believe that the adverse effect of such headwinds should remain fairly contained as reinsurers navigate the currently challenging environment and adapt to the evolving marketplace for insurance risk transfer. This also means that reinsurers with large capital bases, a high degree of diversification and an ability to leverage both traditional and third-party capital are best positioned going forward.
» Influx of alternative capital roils market: An estimated $10 billion of new alternative capital has entered the industry over the past year, raising the total amount to approximately $44 billion, and now accounts for roughly 15% of the global property cat reinsurance limit placed. This influx of capital has pressured property cat pricing, with June/July renewals in the US down 10%-20%, and some Florida accounts decreasing by as much as 25%. Barring meaningful catastrophe losses during the remainder of the year, we expect this pricing softness to continue into the key January 1 reinsurance renewal period.
» Resilience and discipline are key strengths: Reinsurers have navigated an extremely challenging operating environment over the past two years, remaining profitable and growing equity capital despite sustaining large losses from the worst and third worst natural catastrophe loss years on record. Underwriting discipline continues to be maintained and after four long years of trading at a significant discount to book value, reinsurance sector equity price to book value ratios have returned to 100%, which improves financial flexibility and is a positive development for creditors.
» Pricing picture is mixed; Profitability outlook dependent on business mix and geography: A number of crosscurrents are creating a mixed pricing outlook for the sector. Property cat reinsurance rates are under significant pressure from alternative capital. This weakness has the potential to spill over to other reinsurance lines in the coming year. On the other hand, ongoing pricing improvements in specialty primary insurance lines, which constitute a significant portion of premiums for many reinsurers, are leading to increased underwriting margins, particularly in the US. As a result, prospective core underwriting profitability is likely to be a function of each individual reinsurer’s business mix, both by product and geography.

INSURANCE
2 SEPTEMBER 3, 2013 INDUSTRY OUTLOOK: GLOBAL REINSURANCE OUTLOOK
» Reinsurers are adapting to the evolution of the market: While a continued inflow of alternative capital has the potential to alter the core business model of reinsurers, many firms in the sector have been preparing for this eventuality for years through their participation in sidecars and the insurance-linked securities market. Considering the transfer of tail risks to third party capital and the related revenue opportunities available to successful risk managers, we believe that the partial disintermediation of commoditized catastrophe reinsurance is not necessarily a lost opportunity for reinsurers.
Definition of an Industry Outlook The Industry Outlook (positive, stable or negative) indicates our forward-looking assessment of fundamental credit conditions that will affect the creditworthiness of Global Reinsurers over the next 12-18 months. As such, the outlook provides our view of how the operating environment for Global Reinsurers, including macroeconomic, competitive and regulatory trends, will affect, among other things, asset quality, capital, funding, liquidity and profitability.
Since outlooks represent our forward-looking view on credit conditions that factor into our ratings, a negative (positive) outlook suggests that negative (positive) rating actions are more likely on average.
However, the Outlook does not represent a sum of upgrades, downgrades or ratings under review, or an average of the rating outlooks of issuers in the industry, but rather our assessment of the direction of credit fundamentals overall within the industry broadly.
EXHIBIT 1
Top Global Reinsurance Groups (USD Mil.)
Rating Reinsurance Premium [1] Shareholders' Equity [2]
Domicile IFSR Outlook FY 2012 FY 2011 Metric 2Q2013/MRQ FY 2012 FY 2011
1 Munich Reinsurance Company Germany Aa3 STA 41,917 42,030 GPW 33,052 35,841 29,918
2 Swiss Reinsurance Company[3] Switzerland A1 POS 27,491 25,555 GPW 30,110 34,002 29,590
3 Hannover Reinsurance Company Germany NR 17,700 16,833 GPW 7,280 7,985 6,448
4 Lloyds of London UK NR 15,474 14,133 GPW 31,386 31,386 28,302
5 SCOR SE France A1 STA 12,226 10,579 GPW 6,109 6,329 5,712
6 Berkshire Hathaway Reinsurance Group [4] USA Aa1 STA 8,187 6,357 GPW 98,455 89,294 78,802
7 Reinsurance Group of America Inc. USA A1 STA 7,907 7,336 NPE 5,888 6,910 5,819
8 China Reinsurance Group China NR 6,561 5,948 GPW 7,106 7,106 6,451
9 General Re Corporation USA Aa1 STA 5,753 5,866 GPW 14,145 14,145 12,418
10 Korean Reinsurance Company Korea NR 5,013 4,680 GPW 1,325 1,325 1,084
11 PartnerRe Ltd. Bermuda A1 STA 4,718 4,633 GPW 6,415 6,933 6,467
12 Allianz Group Germany Aa3 NEG 4,654 4,832 GPW 62,274 66,442 58,268
13 London Reinsurance Group (Great-West Lifeco Inc.) Canada A1 4,003 3,549 NPE 14,621 14,616 13,645
14 ACE Limited Switzerland Aa3 STA 3,449 3,205 GPW 27,295 27,531 24,332
15 Everest Re Group, Ltd. Bermuda A1 STA 3,236 3,471 GPW 6,623 6,733 6,071
16 Mapfre [5] Spain Baa2 NEG 3,211 3,223 GPW 9,365 10,299 9,137
17 Alleghany Corporation [6] USA A1 STA 2,992 4,035 GPW 6,498 6,404 2,926
18 Assicurazioni Generali SpA Italy Baa1 NEG 2,895 2,874 GPW 23,981 25,071 20,090
19 General Insurance Corp of India India NR 2,775 2,848 GPW 4,996 4,996 4,866

INSURANCE
3 SEPTEMBER 3, 2013 INDUSTRY OUTLOOK: GLOBAL REINSURANCE OUTLOOK
EXHIBIT 1
Top Global Reinsurance Groups (USD Mil.)
Rating Reinsurance Premium [1] Shareholders' Equity [2]
Domicile IFSR Outlook FY 2012 FY 2011 Metric 2Q2013/MRQ FY 2012 FY 2011
20 Fairfax Financial Holdings Limited [7] Canada A3 POS 2,516 2,155 GPW 8,486 8,821 8,363
21 XL Group Plc Ireland A2 STA 2,364 2,468 GPW 11,237 11,856 10,756
22 Maiden Holdings, Ltd. Bermuda NR 1,879 1,699 GPW 956 1,015 769
23 Catlin Group Limited Bermuda NR 1,860 1,679 GPW 3,491 3,512 3,298
24 AXIS Capital Holdings Limited Bermuda A2 STA 1,830 1,974 GPW 5,562 5,780 5,444
25 The Toa Reinsurance Company, Limited Japan NR 1,823 1,963 NPW 1,330 1,330 1,138
26 Caisse Centrale de Réassurance France NR 1,729 1,927 GPW 2,325 2,325 2,107
27 Validus Holdings, Ltd. Bermuda A3 STA 1,616 1,614 GPW 3,618 4,021 3,448
28 Amlin PLC UK A2 STA 1,525 1,109 GPW 2,510 2,435 2,206
29 RenaissanceRe Holdings Ltd. Bermuda A1 STA 1,515 1,405 GPW 3,568 3,503 3,605
30 R+V Versicherung AG Germany NR 1,495 1,616 GPW 2,521 2,521 2,395
31 QBE Insurance Group Australia NR 1,398 1,557 GPW 11,210 11,358 10,386
32 Arch Capital Group Ltd. Bermuda A1 STA 1,282 999 GPW 5,234 5,169 4,592
33 Deutsche Ruck Group Germany NR 1,245 1,256 GPW 223 223 218
34 IRB Brasil Re Brazil NR 1,233 1,235 GPW 1,232 1,232 1,304
35 Aspen Insurance Holdings Ltd Bermuda A2 STA 1,228 1,188 GPW 3,235 3,488 3,156
36 Tokio Marine Holdings, Inc. [8] Japan Aa3 STA 1,200 1,066 GPW 29,689 25,098 22,539
37 Endurance Specialty Holdings Ltd. Bermuda A2 NEG 1,119 997 GPW 2,736 2,711 2,611
38 Alterra Capital Holdings Limited [9] Bermuda A3 STA 1,087 1,076 GPW 2,875 2,840 2,809
39 White Mountains Insurance Group, Ltd. [10] Bermuda A3 STA 1,048 1,038 GPW 3,689 3,732 4,088
40 American Agricultural Insurance Company USA NR 955 1,060 GPW 453 440 430
Totals 212,109 203,068 503,177 506,756 446,010
[1] There is an element of double counting in the premium total because part of Lloyd's premium is also included in the figures of some of the other groups in this table
[2] Shareholders' equity excludes minority interests.
[3] Premium figures are gross of intragroup transactions
[4] Ratings are for National Indemnity Company and Columbia Insurance Company
[5] Mapfre IFSR is for Mapfre Global Risks Cia Int. de Seg. y Reaseg.
[6] Alleghany IFSR is for Transatlantic Reinsurance Company; 2012 premium figure only includes business written after March 6, 2012. 2011 premium figure is for Transatlantic Holdings, Inc.
[7] Fairfax IFSR is for Odyssey Reinsurance Company
[8] Premiums from Tokio Millenium Re, Kiln Lloyd's syndicates and non-affiliated assumed reinsurance from US statutory entities
[9] Alterra is now a subsidiary of Markel Corporation
[10] White Mountains IFSR is for Sirius International Insurance Company
Sources: Company reports, Federal Reserve Bank of New York and Moody’s.

INSURANCE
4 SEPTEMBER 3, 2013 INDUSTRY OUTLOOK: GLOBAL REINSURANCE OUTLOOK
Key Trends and Rating Implications
Macroeconomic Environment Remains Challenging, but Manageable
Moody’s current macroeconomic forecast central scenario contemplates a slow but relatively steady recovery in the United States with projected real US GDP growth of around 2% in 2013 and 2.5% in 2014. In the Euro area, we are currently forecasting negative GDP growth in 2013 of 0 to -1% with slight positive growth of 0-1% in 20141. These figures reflect a still difficult macroeconomic environment which inherently constrains the growth of primary insurers, and in turn, suppresses demand for reinsurance. While downside risks remain, the slowly improving economic environment in the US and Europe presents a manageable operating environment for reinsurers.
For reinsurers with meaningful operations in emerging economies such as Brazil, Mexico, China, India and South Korea, Moody’s outlook for economic growth in these countries has moderated somewhat in recent months. Nonetheless, emerging economies still look set to see healthy growth rates over the coming eighteen months, with some strengthening likely during 2014. However, given the high levels of dependency of these economies on external developments, growth prospects could diminish if the wider global economic environment deteriorates.2
Influx of Alternative Capital Roils Market
Capital markets convergence has finally arrived in the reinsurance market. What began with a trickle of capacity more than fifteen years ago has turned into a flood of capital entering the reinsurance market from institutional investors in the form of catastrophe bonds, collateralized reinsurance vehicles and industry loss warranty contracts (ILWs). According to Guy Carpenter, approximately $10 billion of new alternative capital has entered the sector over the past year, raising the amount of alternative capital in the industry to approximately $44 billion. This capital is now estimated to account for approximately 15% of the global property catastrophe reinsurance limit placed (see Exhibits 2 and 3, below).
EXHIBIT 2
Estimated Alternative Reinsurance Capacity ($ Bil.)
Source: Guy Carpenter
EXHIBIT 3
Alternative Capacity as % Global Property Cat Reinsurance Limit
Source: Guy Carpenter
1 Moody’s Global Risk Perspectives, August 28, 2013: “Update to Global Macro Outlook 2013-14: Rising yields dampen recovery” 2 Moody’s Global Risk Perspectives, August 28, 2013: “Update to Global Macro Outlook 2013-14: Rising yields dampen recovery”
13.5 15.0
9.013.0
6.5
10.05.0
6.0
$0
$5
$10
$15
$20
$25
$30
$35
$40
$45
$50
June 2012 April 2013
Catastophe Bonds Collaterlized ReinsuranceRetrocession Industry Loss Warranties
0%
2%
4%
6%
8%
10%
12%
14%
16%
YE 2008 YE 2009 YE 2010 YE 2011 YE 2012 YE 2013E

INSURANCE
5 SEPTEMBER 3, 2013 INDUSTRY OUTLOOK: GLOBAL REINSURANCE OUTLOOK
The increase in alternative capital is not surprising in the current environment. Institutional investors have been starved for yield and continue to use insurance-linked securities (ILS) as a way to provide higher returns. These securities also have the added benefit of being largely uncorrelated with other assets, a key draw for pension funds that continue to increase their participation in the market. (Re)insurance company cedants, on the other hand, appreciate the collateralized nature provided by this new capacity and the ability to structure multi-year deals, all at pricing levels that can be lower than reinsurance protection offered in the traditional market. While some market participants question the durability of this “hot money” capital, we believe that it is here to stay. While investor interest could ebb and flow depending on the level of interest rates and a very large catastrophe resulting in heavy losses to cat bonds could dampen investor appetite somewhat, we believe that increased investor familiarity and sophistication, product standardization, the availability of risk models to reduce the information asymmetry between risk buyers and sellers all point to future growth for the asset class.
This influx of capital has had a major impact on current reinsurance market dynamics. In sharp contrast with typical post cat event dynamics where the debate would have been about how much the $20-25 billion in private sector insured losses arising from Hurricane Sandy3 should increase reinsurance pricing, reinsurers are instead trying to minimize pricing declines. The combination of low interest rates and the relatively low target return hurdle of institutional investors has increased the demand for cat bonds and caused meaningful pricing pressure in the traditional property catastrophe reinsurance market, with June/July renewals in the US down 10%-20%, and some Florida accounts decreasing by as much as 25%4. Barring meaningful catastrophe losses during the remainder of the year, we expect this pricing softness to continue into the key January 1 reinsurance renewal period.
With upside catastrophe reinsurance cycle amplitudes likely to be compressed relative to historical norms, significant hard market payback for big losses in peak risk zones may be difficult for reinsurers to achieve going forward as the potential pool of institutional investor capital is very large and capable of quickly filling supply/demand imbalances.
Sidecars Present an Opportunity for Reinsurers to Monetize Risk Expertise
In addition to cat bonds, sidecars have been a key vehicle for investors interested in accessing reinsurance exposure. Thus far, sidecar capital has focused primarily on property catastrophe reinsurance, largely due to the availability of risk models that can provide investors with a guidepost on potential risk-adjusted returns, as well as the low barriers to entry provided by the reinsurance brokers who syndicate the vast majority of placements. Going forward, we expect sidecar investors to gradually broaden their risk appetite to other areas such as casualty reinsurance. Hedge funds, in particular, could be attracted to sidecars with long-tail risks given the ability to invest the capital and reinsurance float in their managed funds for an extended period of time.
Compared to cat bonds, we view sidecars as more of an opportunity than a threat for incumbent reinsurers. Instead of being largely cut out of the value chain, reinsurers are integral to the risk selection process and ongoing management of sidecar vehicles. They also allow firms to leverage third party capital to provide clients with larger line sizes or write risks that might not ordinarily fit within the desired underwriting and return parameters of their rated balance sheets. Sidecars also allow reinsurers to trade volatile underwriting income for a stable stream of management fee income and the potential for profit overrides. There are risks, however, that sidecars could pressure pricing or even cannibalize (re)insurers’ core business by adding lower cost capacity.
3 Swiss Re Sigma No. 2/2013 4 WillisRe – 1st View, 1 July 2013.
INSURANCE
6 SEPTEMBER 3, 2013 INDUSTRY OUTLOOK: GLOBAL REINSURANCE OUTLOOK
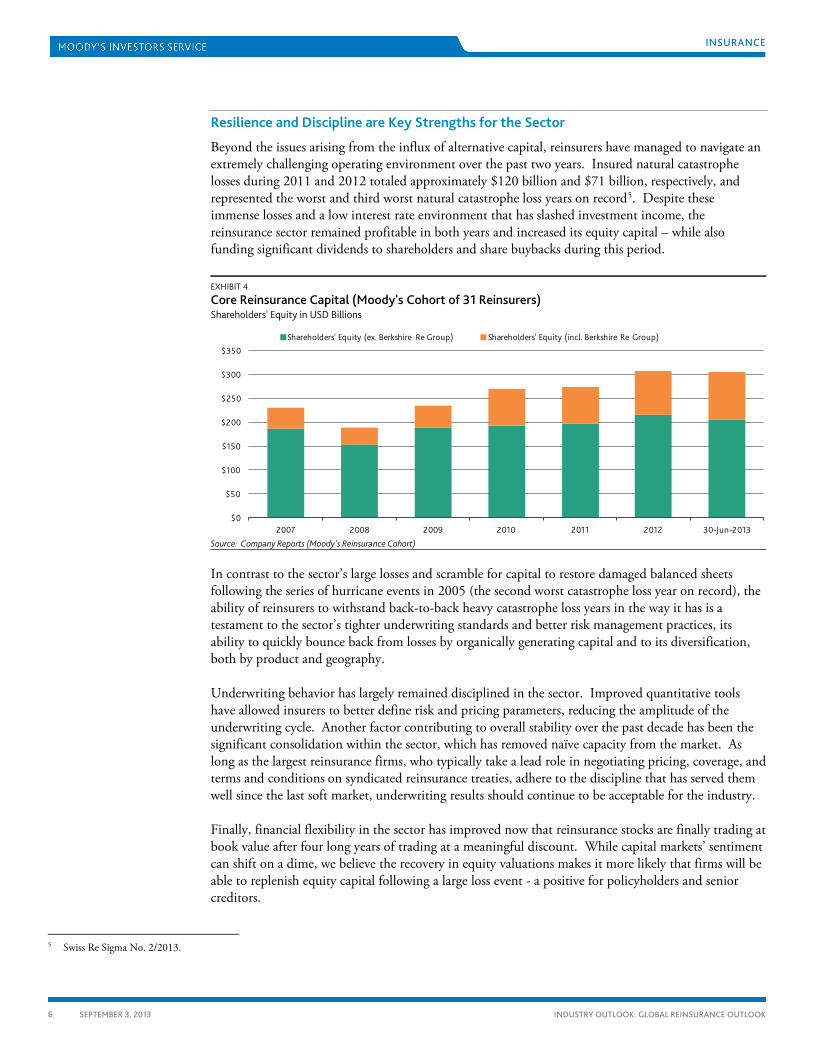
Resilience and Discipline are Key Strengths for the Sector
Beyond the issues arising from the influx of alternative capital, reinsurers have managed to navigate an extremely challenging operating environment over the past two years. Insured natural catastrophe losses during 2011 and 2012 totaled approximately $120 billion and $71 billion, respectively, and represented the worst and third worst natural catastrophe loss years on record5. Despite these immense losses and a low interest rate environment that has slashed investment income, the reinsurance sector remained profitable in both years and increased its equity capital – while also funding significant dividends to shareholders and share buybacks during this period.
EXHIBIT 4
Core Reinsurance Capital (Moody's Cohort of 31 Reinsurers) Shareholders' Equity in USD Billions
Source: Company Reports (Moody's Reinsurance Cohort)
In contrast to the sector’s large losses and scramble for capital to restore damaged balanced sheets following the series of hurricane events in 2005 (the second worst catastrophe loss year on record), the ability of reinsurers to withstand back-to-back heavy catastrophe loss years in the way it has is a testament to the sector’s tighter underwriting standards and better risk management practices, its ability to quickly bounce back from losses by organically generating capital and to its diversification, both by product and geography.
Underwriting behavior has largely remained disciplined in the sector. Improved quantitative tools have allowed insurers to better define risk and pricing parameters, reducing the amplitude of the underwriting cycle. Another factor contributing to overall stability over the past decade has been the significant consolidation within the sector, which has removed naïve capacity from the market. As long as the largest reinsurance firms, who typically take a lead role in negotiating pricing, coverage, and terms and conditions on syndicated reinsurance treaties, adhere to the discipline that has served them well since the last soft market, underwriting results should continue to be acceptable for the industry.
Finally, financial flexibility in the sector has improved now that reinsurance stocks are finally trading at book value after four long years of trading at a meaningful discount. While capital markets’ sentiment can shift on a dime, we believe the recovery in equity valuations makes it more likely that firms will be able to replenish equity capital following a large loss event - a positive for policyholders and senior creditors.
5 Swiss Re Sigma No. 2/2013.
$0
$50
$100
$150
$200
$250
$300
$350
2007 2008 2009 2010 2011 2012 30-Jun-2013
Shareholders' Equity (ex. Berkshire Re Group) Shareholders' Equity (incl. Berkshire Re Group)

INSURANCE
7 SEPTEMBER 3, 2013 INDUSTRY OUTLOOK: GLOBAL REINSURANCE OUTLOOK
EXHIBIT 5
Average Price to Book Value Ratio of 23 Reinsurers [1]
[1] Price to book ratios of 23 reinsurers that are SEC registrants Source: SNL Financial LC. Contains copyrighted and trade secret materials distributed under license from SNL, for recipient's internal use only.
Pricing picture is mixed; Profitability outlook dependent on business mix and geography
A number of crosscurrents are creating a mixed pricing outlook for the sector. Clearly, property catastrophe reinsurance rates are under significant pressure from alternative capital. This weakness has the potential to spill over to other reinsurance lines in the coming year. On the other hand, ongoing pricing improvements in specialty primary insurance lines, which constitute a significant portion of total premiums for many reinsurers, are leading to increased underwriting margins, particularly in the US. As can be seen in Exhibit 6, below, the three major US independent pricing surveys show recent rate increases on primary renewal business in the mid-single digits, though the pace of pricing momentum is moderating. Moody’s expects favorable pricing trends to continue in the US, particularly in primary casualty lines, as insurers look to offset the adverse impact on profitability from low portfolio yields and tapering reserve releases with better underwriting margins.6 In Europe however, primary rates are not rising consistently, with only some pockets of strength amid difficult macroeconomic conditions.
EXHIBIT 6
P&C Pricing Surveys
Sources: The Council of Insurance Agents & Brokers (CIAB), Towers Watson, Market Scout reports.
6 “Stable Outlook for US P&C Commercial Lines: Good Fundamentals, but not a Hard Market”, August 2013
0.5
0.6
0.7
0.8
0.9
1
1.1
1.2
-15.0%
-12.5%
-10.0%
-7.5%
-5.0%
-2.5%
0.0%
2.5%
5.0%
7.5%
10.0%CIAB Towers Watson Market Scout

INSURANCE
8 SEPTEMBER 3, 2013 INDUSTRY OUTLOOK: GLOBAL REINSURANCE OUTLOOK
Moody’s notes that the improvements on the primary side have not yet made a meaningful impact on reinsurance pricing broadly, as insurers continue to retain more risk to offset sluggish economic growth trends and are getting higher ceding commissions on pro-rata reinsurance treaties. Year to date, major reinsurers have reported that proportional reinsurance pricing has been stable to slightly firmer7, suggesting that the rate increases achieved on primary business are not translating into higher reinsurance pricing. However, we do believe they provide some support for continued pricing stability for pro-rata coverages.
As a result, prospective core underwriting profitability is likely to be a function of each individual reinsurer’s business mix, both by product and geography - more favorable in the US than in Europe, better for specialty primary insurance than reinsurance, and pro-rata reinsurance is more attractive than excess reinsurance in certain lines. While the key January 1 renewal season should provide more clarity on the direction of pricing, for now, it is a fragmented market.
Rising interest rates set the stage for improved profitability longer term
While reinsurers’ profit margins have been primarily influenced by underwriting results in recent years, the sector’s profitability is poised to get a boost from higher interest rates, though not without some short term pain. As interest rates move up from their recent historical lows, equity capital will decrease due to the reduction in unrealized gains on fixed income securities that have inflated shareholders’ equity levels over the past several years. We note that the impact on equity may be fairly limited for many firms in the sector as reinsurers generally maintain short duration fixed income portfolios of between 2 to 4 years and retained earnings can offset some of the impact from the reversal of unrealized gains.
EXHIBIT 7
Moody's Central Economic Scenario Forecast
Source: Moody’s
Longer term, investment income will rise as new money is invested at higher rates and portfolio yields gradually move higher, leading to a leveraged impact on reinsurers’ returns on capital. Moody’s central economic forecast contemplates a 4% rate on 10 year US Treasuries by early 2015, which would equate to an approximate 125 basis point rise in the benchmark rate from current levels. In Europe, however, Moody’s is forecasting a slower rise in benchmark rates, with low rates likely to persist for some time yet. Nonetheless, we view the prospect of rising interest rates to be a positive for
7 Munich Re YE 12 and1H2013 results presentations, SCOR 1/1/13 renewals presentation and 1H2013 results presentation
0%
1%
2%
3%
4%
5%
6%
7%
8%
9%
2009 2010 2011 2012 2013 2014 2015 2016 2017
5-Year Treasuries 10-Year Treasuries A-rated Long-Term Corp Bond Yield
10-Year German Bund 10-Year UK Gilts
Projected

INSURANCE
9 SEPTEMBER 3, 2013 INDUSTRY OUTLOOK: GLOBAL REINSURANCE OUTLOOK
the reinsurance sector as they create more favorable economics for long-tail insurance and reinsurance lines.
Reinsurers are Adapting to the Evolution of the Market
While a continued inflow of alternative capital has the potential to alter the core business model of the reinsurers, many firms in the sector have been preparing for this eventuality for years. Through their participation as sidecar managers and as structurers/placement agents, traders, investors and use insurance insurance-linked securities to shape their risk-return profile, reinsurers have been essential participants in the evolution of reinsurance convergence with the capital markets.
Over the past couple of years, reinsurers’ participation in the convergence space has increased markedly, both through the formation of sidecar vehicles (including by RenaissanceRe, Everest Re, Alterra, Hannover Re, PartnerRe, Lancashire and Montpelier Re), as well as through ILS fund management initiatives/joint ventures (involving, e.g., Amlin, Aspen, SCOR, TransRe, XL Group, Sirius Group, Lancashire, Hannover Re, Montpelier Re, RenaissanceRe and Validus). We view these initiatives as a way for reinsurers to maintain their strategic options as the reinsurance market structure continues to evolve.
Given the vulnerability of traditional property catastrophe reinsurance to displacement by capital markets capacity over the longer term, we would expect reinsurers to gradually reduce their direct exposure to this line over time as lower cost institutional investor capital comes into the sector. This incursion into what has traditionally been the sector’s most profitable line of business is a negative development, on its face, for reinsurers.
Despite this challenging trend, all is not as bad as it seems. We think that reinsurance balance sheets may not be the best places to hold certain types of catastrophe risk, such as high excess layers with low single digit rates on line (e.g. covering tail events). These risks consume huge amounts of capital and though losses may be infrequent, when they do hit, the payback period can be as long as 40 years. For reinsurance creditors, the continued growth of capital markets capacity to shoulder a higher proportion of the volatility related to such coverages would be a welcome development.
Moreover, since property catastrophe reinsurance premiums typically represent just 10% to 15% (or less) of total premiums for diversified reinsurers, we believe that a greater focus on value-added complex catastrophe risks and the well-paying lower layers of reinsurance programs, combined with revenue opportunities related to sidecars and ILS fund management, can mitigate the partial disintermediation of commodity-like high layer catastrophe reinsurance. Many firms in the sector can also reallocate underwriting capacity to their well-developed specialty primary insurance platforms, where a number of the business lines are akin to reinsurance, both in the underwriting complexity involved, as well as the low-frequency, high-severity nature of the risks.
INSURANCE
10 SEPTEMBER 3, 2013 INDUSTRY OUTLOOK: GLOBAL REINSURANCE OUTLOOK
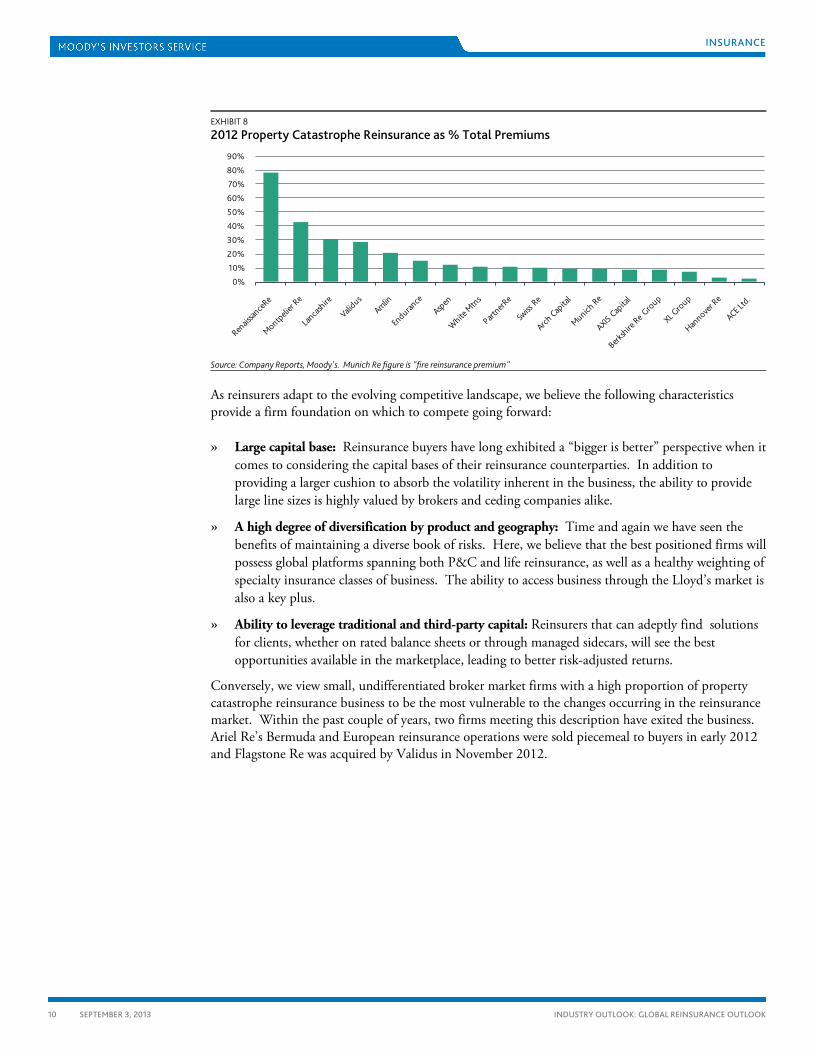
EXHIBIT 8
2012 Property Catastrophe Reinsurance as % Total Premiums
Source: Company Reports, Moody's. Munich Re figure is "fire reinsurance premium"
As reinsurers adapt to the evolving competitive landscape, we believe the following characteristics provide a firm foundation on which to compete going forward:
» Large capital base: Reinsurance buyers have long exhibited a “bigger is better” perspective when it comes to considering the capital bases of their reinsurance counterparties. In addition to providing a larger cushion to absorb the volatility inherent in the business, the ability to provide large line sizes is highly valued by brokers and ceding companies alike.
» A high degree of diversification by product and geography: Time and again we have seen the benefits of maintaining a diverse book of risks. Here, we believe that the best positioned firms will possess global platforms spanning both P&C and life reinsurance, as well as a healthy weighting of specialty insurance classes of business. The ability to access business through the Lloyd’s market is also a key plus.
» Ability to leverage traditional and third-party capital: Reinsurers that can adeptly find solutions for clients, whether on rated balance sheets or through managed sidecars, will see the best opportunities available in the marketplace, leading to better risk-adjusted returns.
Conversely, we view small, undifferentiated broker market firms with a high proportion of property catastrophe reinsurance business to be the most vulnerable to the changes occurring in the reinsurance market. Within the past couple of years, two firms meeting this description have exited the business. Ariel Re’s Bermuda and European reinsurance operations were sold piecemeal to buyers in early 2012 and Flagstone Re was acquired by Validus in November 2012.
0%
10%
20%
30%
40%
50%
60%
70%
80%
90%
INSURANCE
11 SEPTEMBER 3, 2013 INDUSTRY OUTLOOK: GLOBAL REINSURANCE OUTLOOK
Moody’s Related Research
Global Risk Perspective:
» Update to Global Macro Outlook 2013-2014: Rising yields dampen recovery, August 2013 (156821)
Industry Outlooks:
» Stable Outlook for US P&C Personal Lines Insurers: Intense but Orderly Competition Among Industry Leaders, August 2013 (157732)
» Stable Outlook for US P&C Commercial Lines Insurers: Good Fundamentals, but not a Hard Market, August 2013 (157714)
» China Life Insurance Outlook, June 2013 (154774)
» US Mortgage Insurers: Positive Outlook, June 2013 (154801)
» UK General Insurance Outlook, May 2013 (153419)
» Canadian Life Insurance Industry Outlook 2013, April 2013 (151791)
» UK Life Insurance Outlook, March 2013 (151294)
» French Insurance: P&C Stable; Life Negative, February 2013 (150833)
Newsletters:
» Moody’s Reinsurance Monitor, September 2013 (157427)
» Moody’s European Insurance Monitor, June 2013 (154449)
» Moody’s Reinsurance Monitor, June 2013 (155170)
» Moody’s Reinsurance Monitor, March 2013 (151767)
Special Reports:
» Lloyd’s Monitor August 2013 (157906)
» Lloyd’s Monitor May 2013: Q4 2012 Results Statistics (153807)
» Lloyd’s Monitor March 2013 (151417)
Special Comments:
» US P&C Pricing Generates Margin Expansion, Rate Needed in Casualty, August 2013 (157608)
» US P&C Insurers Generated Strong Earnings in Q2 2013; The Pace of Rate Improvement Slows Slightly in Certain Lines, August 2013 (157601)
» The Captive Triangle: Where Life Insurers’ Reserve and Capital Requirements Disappear, August 2013 (156495)
» P&C Insurance Interest Rate Challenges: Capital Volatility If Rates keep Moving Up, Lackluster Returns If Rates Stay Low, July 2013 (155919)
» Q2 2013 Insurance CDS Spreads: U.S. Interest Rates and Italy’s Generali in Focus, August 2013 (157054)

INSURANCE
12 SEPTEMBER 3, 2013 INDUSTRY OUTLOOK: GLOBAL REINSURANCE OUTLOOK
Sector Comments:
» Willis’ Passive Underwriting Scheme Is Credit Negative for Lloyd’s of London Participants, August 2013 (157582)
» Lloyd’s of London – The new era of a Solvency II-based capital approach. Currently in a strong position, August 2013 (156876)
Rating Methodology:
» Moody’s Global Rating Methodology for Reinsurers, December 2011 (138017)
To access any of these reports, click on the entry above. Note that these references are current as of the date of publication of this report and that more recent reports may be available. All research may not be available to all clients.

INSURANCE
13 SEPTEMBER 3, 2013 INDUSTRY OUTLOOK: GLOBAL REINSURANCE OUTLOOK
» contacts continued from page 1
Analyst Contacts:
NEW YORK +1.212.553.1653
Stanislas Rouyer +1.212.553.3684 Associate Managing Director [email protected]
Ted Collins +1.212.553.7903 Managing Director - Global Ins and Mgd Invests [email protected]
LONDON +44.20.7772.5454
Dominic Simpson +44.20.7772.1647 Vice President - Senior Credit Officer [email protected]
Helena Pavicic +44.20.7772.1397 Associate Analyst [email protected]
Simon Harris +44.20.7772.1576 Managing Director - Financial Institutions [email protected]
BUENOS AIRES +54.11.3752.2000
Diego Nemirovsky +54.11.5129.2627 Vice President - Senior Credit Officer [email protected]
TOKYO +81.3.5408.4100
Kenji Kawada +81.3.5408.4056 Vice President - Senior Analyst [email protected]
SAO PAULO +55.11.3043.7300
Diego Kashiwakura +55.11.3043.7316 Assistant Vice President - Analyst [email protected]
HONG KONG +852.3551.3077
Sally Yim +852.3758.1450 Vice President - Senior Credit Officer [email protected]
Report Number: 157899
Author James Eck
Production Associate Prabhakaran Elumalai
© 2013 Moody’s Investors Service, Inc. and/or its licensors and affiliates (collectively, “MOODY’S”). All rights reserved.
CREDIT RATINGS ISSUED BY MOODY'S INVESTORS SERVICE, INC. (“MIS”) AND ITS AFFILIATES ARE MOODY’S CURRENT OPINIONS OF THE RELATIVE FUTURE CREDIT RISK OF ENTITIES, CREDIT COMMITMENTS, OR DEBT OR DEBT-LIKE SECURITIES, AND CREDIT RATINGS AND RESEARCH PUBLICATIONS PUBLISHED BY MOODY’S (“MOODY’S PUBLICATIONS”) MAY INCLUDE MOODY’S CURRENT OPINIONS OF THE RELATIVE FUTURE CREDIT RISK OF ENTITIES, CREDIT COMMITMENTS, OR DEBT OR DEBT-LIKE SECURITIES. MOODY’S DEFINES CREDIT RISK AS THE RISK THAT AN ENTITY MAY NOT MEET ITS CONTRACTUAL, FINANCIAL OBLIGATIONS AS THEY COME DUE AND ANY ESTIMATED FINANCIAL LOSS IN THE EVENT OF DEFAULT. CREDIT RATINGS DO NOT ADDRESS ANY OTHER RISK, INCLUDING BUT NOT LIMITED TO: LIQUIDITY RISK, MARKET VALUE RISK, OR PRICE VOLATILITY. CREDIT RATINGS AND MOODY’S OPINIONS INCLUDED IN MOODY’S PUBLICATIONS ARE NOT STATEMENTS OF CURRENT OR HISTORICAL FACT. CREDIT RATINGS AND MOODY’S PUBLICATIONS DO NOT CONSTITUTE OR PROVIDE INVESTMENT OR FINANCIAL ADVICE, AND CREDIT RATINGS AND MOODY’S PUBLICATIONS ARE NOT AND DO NOT PROVIDE RECOMMENDATIONS TO PURCHASE, SELL, OR HOLD PARTICULAR SECURITIES. NEITHER CREDIT RATINGS NOR MOODY’S PUBLICATIONS COMMENT ON THE SUITABILITY OF AN INVESTMENT FOR ANY PARTICULAR INVESTOR. MOODY’S ISSUES ITS CREDIT RATINGS AND PUBLISHES MOODY’S PUBLICATIONS WITH THE EXPECTATION AND UNDERSTANDING THAT EACH INVESTOR WILL MAKE ITS OWN STUDY AND EVALUATION OF EACH SECURITY THAT IS UNDER CONSIDERATION FOR PURCHASE, HOLDING, OR SALE.
ALL INFORMATION CONTAINED HEREIN IS PROTECTED BY LAW, INCLUDING BUT NOT LIMITED TO, COPYRIGHT LAW, AND NONE OF SUCH INFORMATION MAY BE COPIED OR OTHERWISE REPRODUCED, REPACKAGED, FURTHER TRANSMITTED, TRANSFERRED, DISSEMINATED, REDISTRIBUTED OR RESOLD, OR STORED FOR SUBSEQUENT USE FOR ANY SUCH PURPOSE, IN WHOLE OR IN PART, IN ANY FORM OR MANNER OR BY ANY MEANS WHATSOEVER, BY ANY PERSON WITHOUT MOODY’S PRIOR WRITTEN CONSENT.
All information contained herein is obtained by MOODY’S from sources believed by it to be accurate and reliable. Because of the possibility of human or mechanical error as well as other factors, however, all information contained herein is provided “AS IS” without warranty of any kind. MOODY'S adopts all necessary measures so that the information it uses in assigning a credit rating is of sufficient quality and from sources MOODY'S considers to be reliable including, when appropriate, independent third-party sources. However, MOODY’S is not an auditor and cannot in every instance independently verify or validate information received in the rating process. Under no circumstances shall MOODY’S have any liability to any person or entity for (a) any loss or damage in whole or in part caused by, resulting from, or relating to, any error (negligent or otherwise) or other circumstance or contingency within or outside the control of MOODY’S or any of its directors, officers, employees or agents in connection with the procurement, collection, compilation, analysis, interpretation, communication, publication or delivery of any such information, or (b) any direct, indirect, special, consequential, compensatory or incidental damages whatsoever (including without limitation, lost profits), even if MOODY’S is advised in advance of the possibility of such damages, resulting from the use of or inability to use, any such information. The ratings, financial reporting analysis, projections, and other observations, if any, constituting part of the information contained herein are, and must be construed solely as, statements of opinion and not statements of fact or recommendations to purchase, sell or hold any securities. Each user of the information contained herein must make its own study and evaluation of each security it may consider purchasing, holding or selling.
NO WARRANTY, EXPRESS OR IMPLIED, AS TO THE ACCURACY, TIMELINESS, COMPLETENESS, MERCHANTABILITY OR FITNESS FOR ANY PARTICULAR PURPOSE OF ANY SUCH RATING OR OTHER OPINION OR INFORMATION IS GIVEN OR MADE BY MOODY’S IN ANY FORM OR MANNER WHATSOEVER.
MIS, a wholly-owned credit rating agency subsidiary of Moody’s Corporation (“MCO”), hereby discloses that most issuers of debt securities (including corporate and municipal bonds, debentures, notes and commercial paper) and preferred stock rated by MIS have, prior to assignment of any rating, agreed to pay to MIS for appraisal and rating services rendered by it fees ranging from $1,500 to approximately $2,500,000. MCO and MIS also maintain policies and procedures to address the independence of MIS’s ratings and rating processes. Information regarding certain affiliations that may exist between directors of MCO and rated entities, and between entities who hold ratings from MIS and have also publicly reported to the SEC an ownership interest in MCO of more than 5%, is posted annually at www.moodys.com under the heading “Shareholder Relations — Corporate Governance — Director and Shareholder Affiliation Policy.”
For Australia only: Any publication into Australia of this document is pursuant to the Australian Financial Services License of MOODY’S affiliate, Moody’s Investors Service Pty Limited ABN 61 003 399 657AFSL 336969 and/or Moody’s Analytics Australia Pty Ltd ABN 94 105 136 972 AFSL 383569 (as applicable). This document is intended to be provided only to “wholesale clients” within the meaning of section 761G of the Corporations Act 2001. By continuing to access this document from within Australia, you represent to MOODY’S that you are, or are accessing the document as a representative of, a “wholesale client” and that neither you nor the entity you represent will directly or indirectly disseminate this document or its contents to “retail clients” within the meaning of section 761G of the Corporations Act 2001. MOODY’S credit rating is an opinion as to the creditworthiness of a debt obligation of the issuer, not on the equity securities of the issuer or any form of security that is available to retail clients. It would be dangerous for retail clients to make any investment decision based on MOODY’S credit rating. If in doubt you should contact your financial or other professional adviser.