industry review corporate social responsibility - … review corporate social responsibility ......
TRANSCRIPT

Issue 3
Industry Review
Corporate Social Responsibility
April 2016
Business Units
Giving Patterns Volunteer Data Demographics
Engagement Trends
ParticipationEmployee Groups
Growth Rates

By analyzing the data collected between January 1, 2015 through December 31, 2015, it is the mission of this Industry Review to share trends, activities and industry practices with our clients (current and future), industry peers (partners and nonpro�ts), and all interested parties in hopes of encouraging a better understanding of actual employee engagement and performance within related Corporate Social Responsibility (CSR) programs.
YourCause is committed to developing thought leadership content to help challenge, question and improve the e�ectiveness of employee engagements within Corporate Social Responsibility e�orts. As a part of this commitment, the YourCause team has created numerous resources intended to be used as guides and benchmarks for those seeking greater success within their employee programs. The following are additional recommended resources located at www.CSRconnect.me.
getting STARTED
article: Reaching the Hard-to-ReachReviews advanced strategies that will engage your most di�cult to reach employees.
infographic: Decoding Diversity: Company Demographics & CSRDiscover how longevity at a company can positively correlate into giving and volunteer engagement.
article: Considerations for Grants ProjectsFour key items to consider when launching or expanding your grants program.
infographic: Decoding Diversity: Ethnicity & CSRLearn how an employee’s ethnicity plays a factor in giving and volunteering engagement.
case study: Franklin Templeton Investments: Impact DaysFranklin Templeton shares how their Impact Days unify employees from various o�ces around the world.
case study: Medtronic: Mission in Motion StudyLearn the strategies used to engage on-site employees in international locations.
Access these resources and more at CSRconnect.me
the MISSION
additional RESOURCES
the CONTENTS
What to Know
Founder’s Message
Key Findings
Employee Engagement
Giving by Region
Corporate Landscape
Program Trends
Trends by Industry
Geographic Trends
Nonpro�t Trends
Technology Today
Payment Processing
Nonpro�t Impact
Overall Methodology
Glossary of Terms
3
4
5 / 6
7 / 8
9 / 10
11 / 12
13 / 14
15 / 16
17 / 18
19 / 20
21 / 22
23 / 24
25 / 26
27 / 28
29 / 30
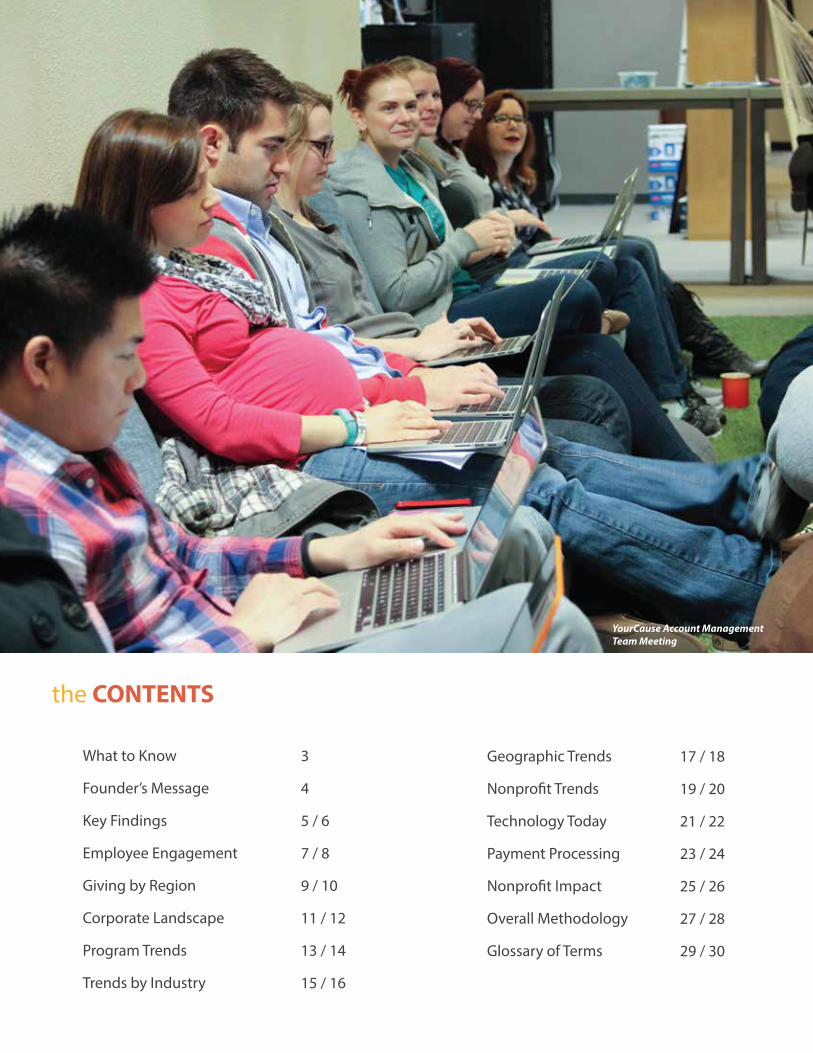
YourCause Account Management Team Meeting

An incentive that allows employees to volunteer to one charity but give the incentive donation to a charity of their choice.
CauseCards
A corporate employee giving program in which a company provides grants to nonpro�ts where employees and retirees volunteer on a regular basis.
Dollars-for-Doers
Broken out into three distinct categories: a) user engagement (those who logged into the system and either gave, volunteered or utilized any of the other services provided by the online system); b) donor engagement in giving (those who made a donation if a program is o�ered by the company); and c) volunteer engagement by volunteering (those who volunteer if a program is o�ered by the company).
Employee Engagement
A limit in the amount of additional donation dollars a party is willing to contribute to an individual’s donation.Match Cap
Users who have demonstrated at least 1 hour of participation through team or individual events and/or have donated at least 1 unit of payment to a nonpro�t. The calculation is performed by dividing the number of participants by the number of eligible participants aggregated per a�liate.
Participation
An incentive in which an employee may ‘earn’ an additional donation to a speci�ed charity as a result of volunteering a pre-de�ned number of total hours over a set period of time.
A transaction symbolizes a unique donation performed within the YourCause provided platform.
An act of redeeming an incentive, usually earned through participation within a speci�c employee program, in the form of a donation to a quali�ed nonpro�t organization.
Volunteer Grants
Redemption (monthly/seasonal)
Transaction
A program which allows employees to give money to a registered charity of their choice by having a deduction taken straight from their gross pay.
Payroll Giving
3
what to KNOWIt’s important we make clear - up front - some key terms that will be used throughout this report so as to not cause any confusion when reading through the data. The below terms represent a subset of a more complete glossary of terms that can be found on page 29. The complete data analysis only looked at data that was captured within the CSRconnect system and that of which is currently stored within the active YourCause database.
Melea MoselyProgram Services
4
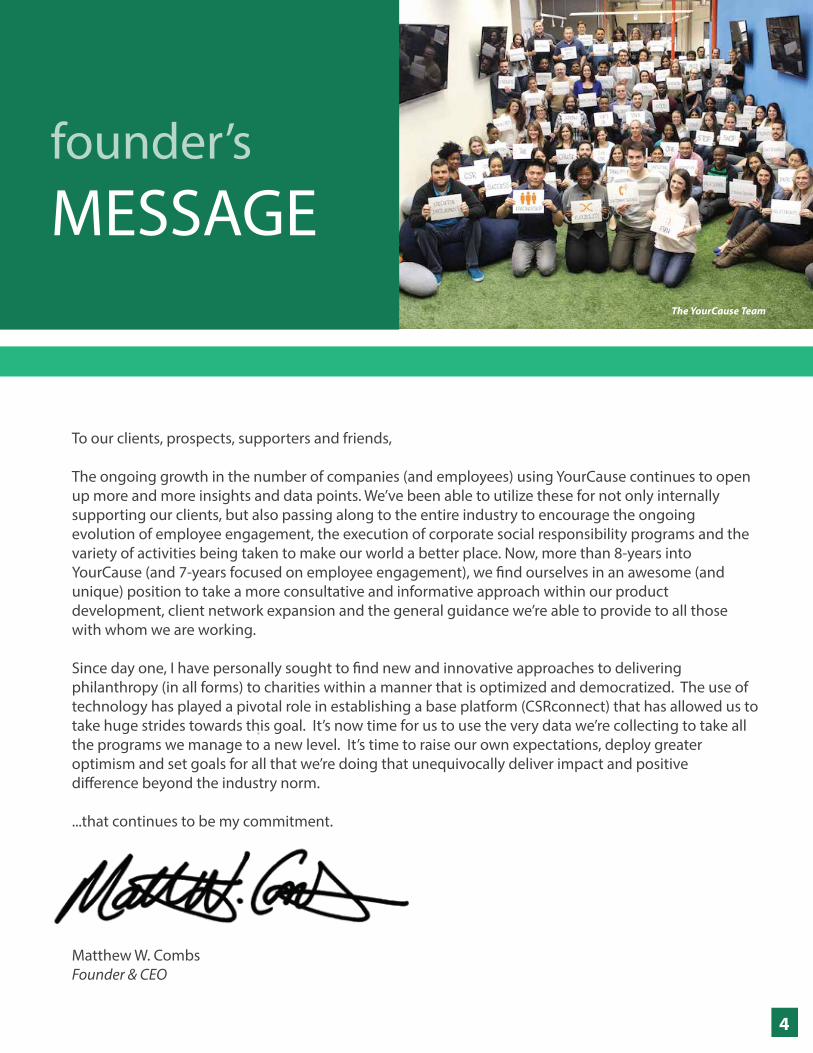
MESSAGEfounder’s
To our clients, prospects, supporters and friends,
The ongoing growth in the number of companies (and employees) using YourCause continues to open up more and more insights and data points. We’ve been able to utilize these for not only internally supporting our clients, but also passing along to the entire industry to encourage the ongoing evolution of employee engagement, the execution of corporate social responsibility programs and the variety of activities being taken to make our world a better place. Now, more than 8-years into YourCause (and 7-years focused on employee engagement), we �nd ourselves in an awesome (and unique) position to take a more consultative and informative approach within our product development, client network expansion and the general guidance we’re able to provide to all those with whom we are working.
Since day one, I have personally sought to �nd new and innovative approaches to delivering philanthropy (in all forms) to charities within a manner that is optimized and democratized. The use of technology has played a pivotal role in establishing a base platform (CSRconnect) that has allowed us to take huge strides towards this goal. It’s now time for us to use the very data we’re collecting to take all the programs we manage to a new level. It’s time to raise our own expectations, deploy greater optimism and set goals for all that we’re doing that unequivocally deliver impact and positive di�erence beyond the industry norm.
...that continues to be my commitment.
Matthew W. CombsFounder & CEO
The YourCause Team
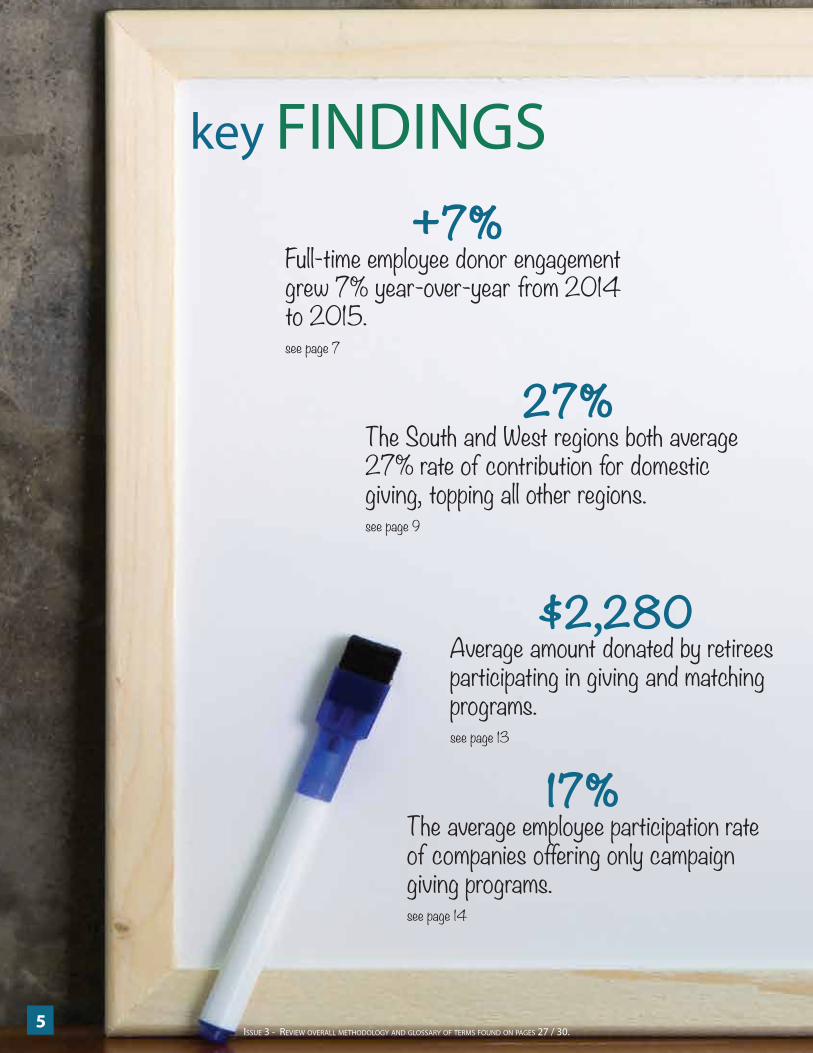
key FINDINGS
5ISSUE 3 - REVIEW OVERALL METHODOLOGY AND GLOSSARY OF TERMS FOUND ON PAGES 27 / 30.
+7%Full-time employee donor engagement grew 7% year-over-year from 2014 to 2015.see page 7
17%The average employee participation rate of companies offering only campaign giving programs. see page 14
$2,280Average amount donated by retirees participating in giving and matching programs. see page 13
27%The South and West regions both average 27% rate of contribution for domestic giving, topping all other regions.see page 9

6ALL INFORMATION ENCLOSED IS CONSIDERED INTELLECTUAL PROPERTY OF YOURCAUSE, LLC.
385%User-input volunteer opportunities receive greatest participation, averaging 385% more hours volunteered per user than events imported into CSRconnect from an external list or events input directly from within the NPO portal. see page 16
55%55% of employees (full-time) who made a donation in 2015 did so via a payroll deduction.see page 17
73%The percentage of companies that process donations monthly (versus quarterly or annually).see page 23
$893The average transaction value for payments processed via ACH is 4X greater than the average transaction value for payments processed by paper check. see page 24
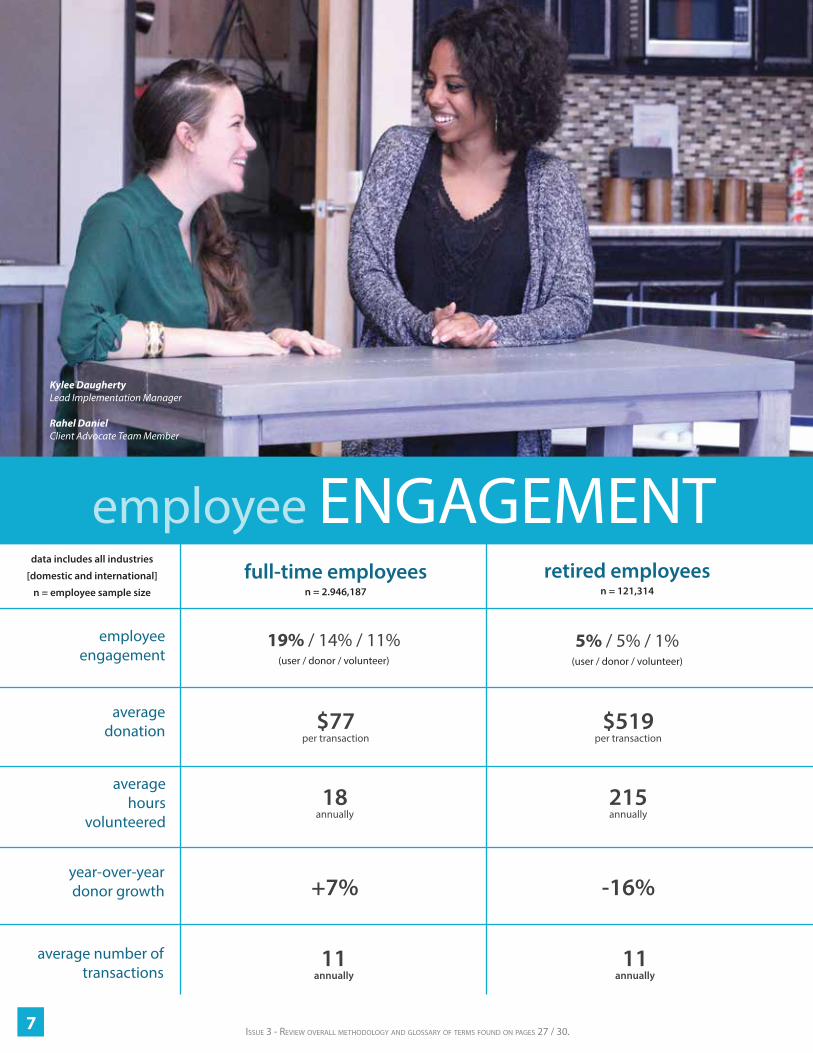
full-time employeesn = 2.946,187
retired employeesn = 121,314
employeeengagement
average donation
average hours
volunteered
year-over-year donor growth
$77per transaction
$519per transaction
18annually
215annually
+7% -16%
7 ISSUE 3 - REVIEW OVERALL METHODOLOGY AND GLOSSARY OF TERMS FOUND ON PAGES 27 / 30.
employee ENGAGEMENT
11annually
average number of transactions
11annually
data includes all industries
[domestic and international]
n = employee sample size
Kylee DaughertyLead Implementation Manager
Rahel DanielClient Advocate Team Member
19% / 14% / 11%(user / donor / volunteer)
5% / 5% / 1%(user / donor / volunteer)

When creating incentive programs for employees, the data shows it’s vital that employees be educated on what the incentives are and the process around redeeming them. Note the redemption rate and the average time it takes to redeem a CauseCard by the number of times a client issues a CauseCard program.
8
90%
80%
70%
60%
50%
40%
30%
20%
10%
0%
1 2 3 4 5 6 7 8 9 10 11 12 13 14 15 16 17 18 19 20
Redemption Rate of CauseCards By Number of CauseCard Programs
= redemption rate
45%
40%
35%
30%
25%
20%
15%
10%
5%
0%
1 2 3 4 5 6 7 8 9 10 11 12 13 14 15 16 17 18 19 20
Days to Redeem a CauseCard
= days to redeem
The redemption rate for a CauseCard has shown to increase as a company o�ers more CauseCard programs and actively communicates to eligible employees the details of the cards, however peak redemption is found at eight programs a year.
Redemption rate for a CauseCard is greatest in the �rst two weeks after it is issued.
programs
days
perc
ent r
edee
med
perc
ent r
edee
med
incentive TRENDS
Wha
t are
Ca
useC
ards
?
ALL INFORMATION ENCLOSED IS CONSIDERED INTELLECTUAL PROPERTY OF YOURCAUSE, LLC.
CauseCards allow YourCause clients to o�er incentive and/or recognition programs within their community. CSRconnect administrators can create a custom campaign and distribute digital CauseCards directly to an eligible user and allow them to donate to the charity of their choice.
- Can be customized around one or multiple programs
- Support a wide range of incentives including employee recognition programs, such as ‘Volunteer of the Month’ and ‘Giving Incentives’- Incentivizes employee participation in giving and/or volunteering programs

donation DISTRIBUTION
N
E
W
MW
S
Total Domestic Contribution by Region
45%
40%
35%
30%
25%
20%
15%
10%
5%
0
N | E | W | MW | S
21%
14%
27%
11%
27%
domestic SNAPSHOT
2% CauseCard
8% CauseCard
13%Credit Card
.65%Fundraising
25%O�ine
53%Payroll
.66%Volunteer Incentive
giving by REGION
9 ISSUE 3 - REVIEW OVERALL METHODOLOGY AND GLOSSARY OF TERMS FOUND ON PAGES 27 / 30.
NorthFull-time sample = 104,624
Retiree sample = 19,919
SouthFull-time sample = 308,303
Retiree sample = 25,635
MidwestFull-time sample = 213,165
Retiree sample = 3,970
EastFull-time sample = 448,004Retiree sample = 5,511
WestFull-time sample = 359,132
Retiree sample = 46,173
23%Credit Card
.37%Fundraising
19%O�ine
55%Payroll
2%Volunteer Incentive
6% CauseCard
15%Credit Card
.58%Fundraising
30%O�ine
46%Payroll
2%Volunteer Incentive
2% CauseCard
13%Credit Card
.63%Fundraising
18%O�ine
66%Payroll
.76%Volunteer Incentive
4% CauseCard
13%Credit Card
.80%Fundraising
22%O�ine
58%Payroll
1%Volunteer Incentive
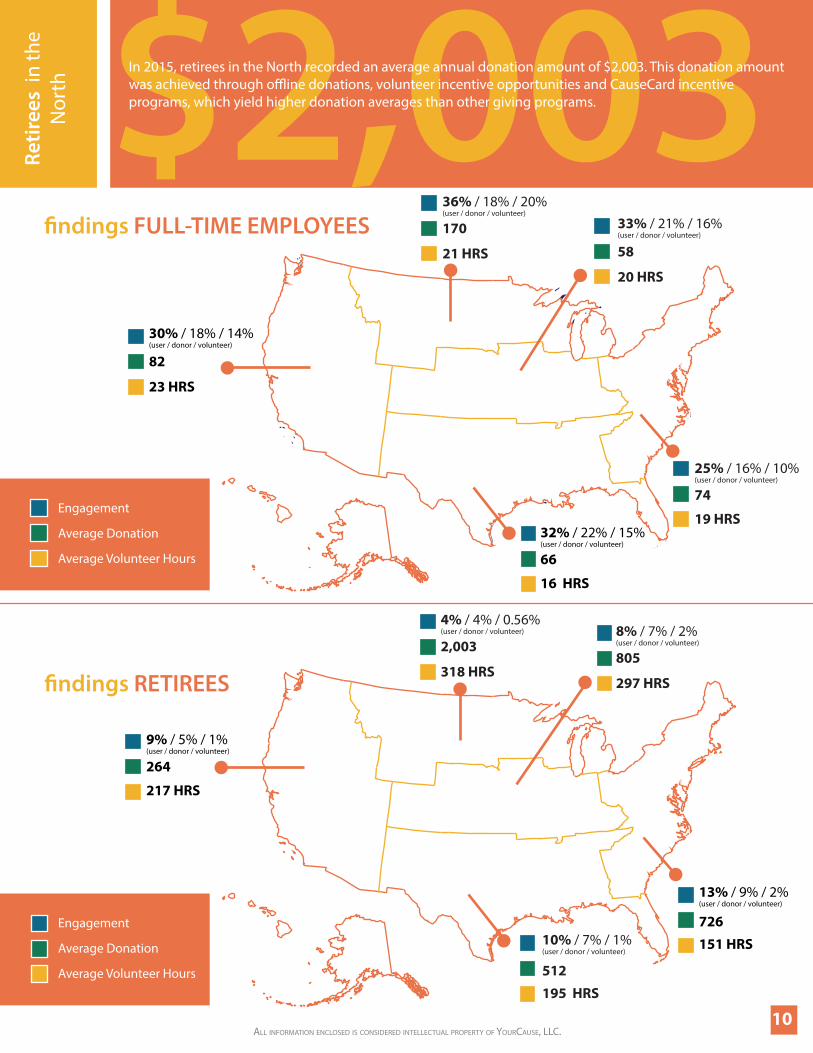
4% / 4% / 0.56%(user / donor / volunteer)
2,003
318 HRS
13% / 9% / 2%(user / donor / volunteer)
726151 HRS
9% / 5% / 1%(user / donor / volunteer)
264
217 HRS
8% / 7% / 2%(user / donor / volunteer)
805
297 HRS
10% / 7% / 1%(user / donor / volunteer)
512195 HRS
ALL INFORMATION ENCLOSED IS CONSIDERED INTELLECTUAL PROPERTY OF YOURCAUSE, LLC.
Retir
ees
in th
e N
orth
10
�ndings FULL-TIME EMPLOYEES
Engagement
Average Donation
Average Volunteer Hours
36% / 18% / 20%(user / donor / volunteer)
170
21 HRS
25% / 16% / 10%(user / donor / volunteer)
74
19 HRS
33% / 21% / 16%(user / donor / volunteer)
58
20 HRS
32% / 22% / 15%(user / donor / volunteer)
66
16 HRS
$2,00330% / 18% / 14%(user / donor / volunteer)
82
23 HRS
Engagement
Average Donation
Average Volunteer Hours
�ndings RETIREES
In 2015, retirees in the North recorded an average annual donation amount of $2,003. This donation amount was achieved through o�ine donations, volunteer incentive opportunities and CauseCard incentive programs, which yield higher donation averages than other giving programs.

corporate LANDSCAPE0 - 5,000
n = 12
employeeengagement
average donation
average hours
volunteered
$98annually
131annually
+40%
5,001- 10,000n =13
10,001 - 50,000n = 17
50,001 - 100,000n = 4
100,000 +n = 7
year-over-year donor growth
11ISSUE 3 - REVIEW OVERALL METHODOLOGY AND GLOSSARY OF TERMS FOUND ON PAGES 27 / 30.
$165annually
13annually
+65%
$104annually
24annually
+14%
$253annually
31annually
+25%
$40annually
12annually
-2%
average number of donations per
employee 12
annually7
annually13
annually7
annually12
annually
data grouped by
workforce size
n = number of companies
Joseph Baldonado Account Manager
Brandi FulmerSenior Account Manager
Kate SchoenSenior Account Manager
42% / 29% / 23%(user / donor / volunteer)
25% / 16% / 11%(user / donor / volunteer)
17% / 13% / 9%(user / donor / volunteer)
20% / 14% / 20%(user / donor / volunteer)
31% / 17% / 11%(user / donor / volunteer)

match cap PROGRAMS
ALL INFORMATION ENCLOSED IS CONSIDERED INTELLECTUAL PROPERTY OF YOURCAUSE, LLC. 12
giving METHODS
Payroll Giving Credit Card Giving O�ine Giving Payroll Giving
Understanding the top preferred domestic giving methods by employee population can help program administrators focus resources. Below are the preferred methods of giving by company size.
100,000 +employees
50,001 - 100,000employees
0 - 5,000employees
5,001- 10,000employees
10,001 - 50,000employees
company size
preferred
method
O�ine Giving
The charts below illustrate the donation distribution amount donated by an employee and the minimum donation match amount set by the employer. The “taller” the peak, the more donations are made to meet the minimum match amount. This visualization shows how changing the minimum donation amount to receive a match a�ects donor behavior. For example, clients that have a $25 minimum donation amount see a dramatic peak in donations at $25, whereas clients with a $50 minimum donation amount to receive a match don’t see that same peak.

program TRENDS
13 ISSUE 3 - REVIEW OVERALL METHODOLOGY AND GLOSSARY OF TERMS FOUND ON PAGES 27 / 30.
full-timeengagement
full-time average donation
full-timeaverage hours
volunteered
giving + matchingn = 5
s = 56,461
volunteeringn =10
s = 98,510
all programsn = 37
s = 46,146
$47per transaction
$114per transaction
134annually
16annually
17annually
retiree engagement
retireeaverage donation
retireeaverage hours
volunteered
$2,280per transaction
$458per transaction
not applicable 216annually
data includes all domestic and international industries
n = number of companies
s = average employee workforce
Adam SherrittProcessing Manager
Matt JohlHead of Processing
14% / 8% / 7%(user / donor / volunteer)
20% / not applicable / 17%(user / donor / volunteer)
38% / 41% / 38%(user / donor / volunteer)
5% / 5% / 1%(user / donor / volunteer)
6% / 7% / not applicable
(user / donor / volunteer)
not applicable
not applicable
not applicable
not applicable

Cove
ring
cred
it ca
rd fe
es
ALL INFORMATION ENCLOSED IS CONSIDERED INTELLECTUAL PROPERTY OF YOURCAUSE, LLC. 14
58%o�er YEAR-ROUND GIVING
o�er CAMPAIGN GIVING
50%of those that o�er giving, support
international giving
58%of those that o�er giving, support
credit card giving
65%of those that o�er giving, support
payroll giving
19%of those that o�er giving, support
international payroll giving
71%of those that o�er giving, support
o�ine giving
4%of those that o�er giving, support
PayPal givingPayPal
$155 average employee donation total when a company o�ers the ability to give year-round.
27% / 10% / 18%(user / donor / volunteer)
employee participation rate for companies o�ering giving programs all year-round.
16 hours average hours volunteered annually by an employee when a company o�ers volunteering year-round.
$97 average employee donation totals when a company o�ers the ability to give through a campaign.
25% / 17% / 11%(user / donor / volunteer)
employee participation rate for companies o�ering campaign giving programs.
9 hours average hours volunteered annually by an employee during a campaign.
n = 46n = 14 (of 46 total surveyed)
n = 4 (of 46 total surveyed)
o�er CAMPAIGN & YEAR-ROUND
$53 average employee donation totals when a company o�ers the ability to give through a campaign.
15% / 16% / 2%(user / donor / volunteer)
employee participation rate for companies o�ering campaign giving programs.
23 hours average hours volunteered annually by an employee during a campaign.
n = 28 (of 46 total surveyed)
58% of employee engagement programs opt to NOT cover fees for donations made via credit card.

trends by INDUSTRYemployee
sample sizeaverage
donationaverage
hours volunteered
Financialsn = 7
Consumer Discretionaryn = 5
Consumer Staplesn = 4
Healthcare Equipmentn = 6
Industrialsn = 2
Information Technologyn = 18
Materialsn = 3
Energyn = 4
Utilitiesn = 3
403,413 $109per transaction
15annually
645,620 $51per transaction
8annually
404,862 $90per transaction
7annually
548,806 $576per transaction
25annually
91,481 $236per transaction
369,595 $92per transaction
14annually
8,248 $775per transaction
189annually
137,009 $124per transaction
28annually
44,083 $51per transaction
17annually
15ISSUE 3 - REVIEW OVERALL METHODOLOGY AND GLOSSARY OF TERMS FOUND ON PAGES 27 / 30.
employee engagement
36% / 2% / 23%(user / donor / volunteer)
data includesdomestic and international
n = number of companies
not applicable
28% / 7% / 38%(user / donor / volunteer)
28% / 15% / 13%(user / donor / volunteer)
49% / 31% / 11%(user / donor / volunteer)
8% / 4% / 3%(user / donor / volunteer)
7% / 6% / 2%(user / donor / volunteer)
3% / 2% / 2%(user / donor / volunteer)
43% / 32% / 15%(user / donor / volunteer)
29% / 9% / 22%(user / donor / volunteer)

Wha
t vol
unte
er
even
t will
they
ch
oose
?
ALL INFORMATION ENCLOSED IS CONSIDERED INTELLECTUAL PROPERTY OF YOURCAUSE, LLC. 16
37Xvolunteer EVENTS
User-input events receive the greatest hours volunteered per user and the highest level of utilization by roughly 37x. Peer-input events are also 670x more likely to engage employees than events created by a nonpro�t or a pre-populated list, respectively.
Volunteer events can be submitted via the nonpro�t, fellow employees and/or an outside list feed. Below the data set looks at the volunteer enagagement associated with all three event submission types.
2015 volunteer event statistics from CSRconnect
outside feed
nonpro�t submission
employee submission
events in the system
hoursvolunteered
hours/ participant
hours/ event
# of participated events
% utilized
4,202
7,057
178,697 2,279,760
201
10 0.8
1.4
5.4
1
3
15
13
67
155,851
0.31%
0.95%
87.22%
user-input events are selected nearly 90% of the time.
volunteers triple the number of hours for events populated by nonpro�ts directly.
user-input volunteer opportunities receive greatest participation, with 385% more hours volunteered per user.
385% 3X 90%
all-time volunteer event statistics from CSRconnect
outside feed
nonpro�t submission
employee submission
events in the system
hoursvolunteered
hours/ participant
hours/ event
# of participated events
% utilized
67,650
23,506
652,395 7,483,995
3,283
263 2.7
1.8
4.6
3
5
12
93
602
611,484
0.14%
2.56%
93.73%

geographic TRENDS
employee engagement
average donation
average hours volunteered
year-over-year growth
Domestic [United States]n = 1,918,901
s = 55,588
Internationaln = 1,027,286
s = 65,095
preferred method of giving
top three areas for participation
$76per transaction
20annually
+6%
55% utilizepayroll deductions
1. Mississippi2. Arkansas 3. Illinois
$90per transaction
12annually
+41%
49% utilizepayroll deductions
1. Puerto Rico2. Kazakhstan3. Israel
17ISSUE 3 - REVIEW OVERALL METHODOLOGY AND GLOSSARY OF TERMS FOUND ON PAGES 27 / 30.
n = number of employees
s = average employee workforce
Brian CobbellSenior Front End Developer
Edward AdjeiSenior Architect
Prathibha PaduriLead Developer
24% / 19% / 12%(user / donor / volunteer)
9% / 2% / 9%(user / donor / volunteer)

18
50%45%40%35%30%25%20%15%10%
5%
cred
it ca
rd g
ivin
g
o�in
e gi
ving
payr
oll g
ivin
g
volu
ntee
ring
15%
19 %
36%
38%
Caus
e Ca
rd15
%
domestic vs. INTERNATIONAL
Puerto Rico | Kazakhstan | Israel
$400
$300
$200
$100
$50
$25
top three non-U.S. countries average donations
$95
$26
$377
40353025201510
5
top three non-U.S. countries average hours volunteered
36
6
13
international PROGRAMS
Mississippi | Arkansas | Illinios
$80$70$60$50$40$30$20$10
top three domestic states average donations
$29
$32
$69
30
25
20
15
10
0
top three domestic states average hours volunteered
15
27 12
Mississippi | Arkansas | Illinios
Mississippi | Arkansas | Illinios
programs o�ered internationally
International programs o�ered to employees are becoming more expansive. Companies are driving consistency on both domestic and international programs. As a result, there has been a rise in the number of companies o�ering credit card giving, o�ine giving and volunteer tracking.
Puerto Rico | Kazakhstan | Israel
Puerto Rico | Kazakhstan | Israel
65%55%45%35%25%15%
5%0%
top three domestic states for employee engagement
32%
(use
r)
5% (v
olun
teer
)
36%
(don
or)
28%
(use
r)
9% (v
olun
teer
)
26%
(don
or)
32%
(use
r)
7% (v
olun
teer
)
26%
(don
or) 40%
35%30%25%20%15%10%
5%
top three non-U.S. countries for employee engagement
36%
(use
r)
13%
(vol
unte
er)
30%
(don
or)
14%
(use
r)
3% (v
olun
teer
)
10%
(don
or)
15%
(use
r)
9% (v
olun
teer
)
9% (d
onor
)
s = 55, 588 s = 65,095
ALL INFORMATION ENCLOSED IS CONSIDERED INTELLECTUAL PROPERTY OF YOURCAUSE, LLC.
s = average employee workforce

overview FINDINGS
Automated Clearing House (ACH) Growth in January 2015 - December 2015
71,689charities that received
donations in 2015
30,469number of unique
charities with at least 1 admin33,051total charity administrators
within the CSRconnect platform
+66%of charities in the
CSRconnect platform utilized ACH in 2015
+15%growth in the dollars
donated in 2015
18% of the total dollars donated
are processed via ACH.
nonpro�t TRENDS
19
Lifetime Charity Statistics
ISSUE 3 - REVIEW OVERALL METHODOLOGY AND GLOSSARY OF TERMS FOUND ON PAGES 27 / 30.
Molly TanzerSales Executive

nonpro�t TRENDStop 10 CHARITY LIST
ALL INFORMATION ENCLOSED IS CONSIDERED INTELLECTUAL PROPERTY OF YOURCAUSE, LLC. 20
most DONATIONS
1. President and Fellows of Harvard College
2. United Way of Metropolitan Dallas
3. Greater Twin Cities United Way
4. Schwab Charitable Fund
5. St. Jude Children’s Research Hospital
6. American Cancer Society
7. National Christian Charitable Foundation
8. United Way of Metropolitan Atlanta
9. American Heart Association
10. American National Red Cross
most VOLUME
1. United Way of Metropolitan Dallas
2. United Way of Metropolitan Atlanta
3. St. Jude Children’s Research Hospital
4. American Cancer Society
5. United Way of Greater St. Louis
6. United Way of Metropolitan Chicago
7. United Way of the Texas Gulf Coast
8. Wounded Warrior Project Inc.
9. United Way of the Bay Area
10. American National Red Cross
most SEARCHED
1. American Heart Association
2. American Red Cross
3. World Vision International
4. The Leukemia & Lymphoma Society
5. Irish Cancer Society
6. Center for Rehabilitation Education and Care “Helenow”
7. American Cancer Society
8. U.S. Conference of Catholic Bishops
9. Help A Veteran
10. Childline India Foundation
highest VOLUNTEER HOURS
1. Adventures in Missions Inc.
2. Ashburn Volunteer Fire Department
3. Boy Scouts of America
4. Smoky Mountain Animal Care Foundation
5. Eastern Iowa Baseball Club
6. Wag On Inn Rescue
7. Stop Hunger Now Inc.
8. The Church of Jesus Christ of Latter-Day Saints
9. Little League Baseball Inc.
10. Twin Cities Habitat for Humanity
ISSUE 3 - REVIEW OVERALL METHODOLOGY AND GLOSSARY OF TERMS FOUND ON PAGES 27 / 30.
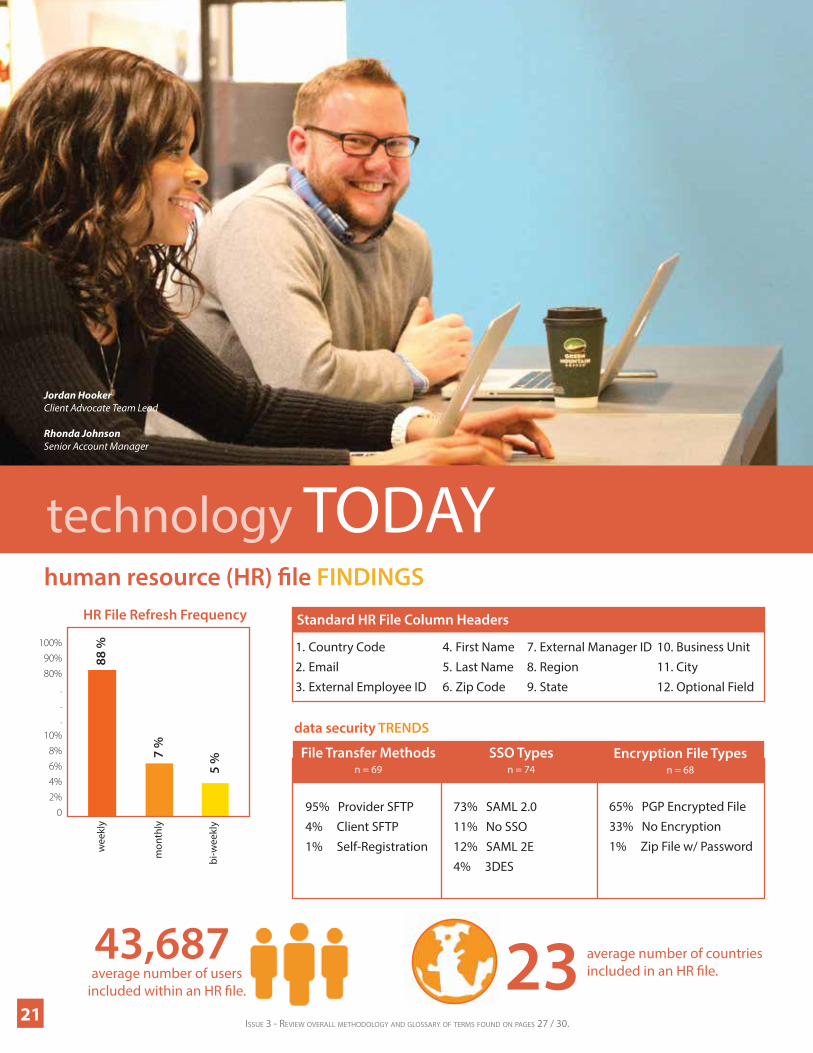
technology TODAY
21
human resource (HR) �le FINDINGS
100%90%80%
.
.
.10%
8%6%4%2%
0
HR File Refresh Frequency
mon
thly
wee
kly
bi-w
eekl
y
Standard HR File Column Headers
Country CodeEmailExternal Employee ID
External Manager IDRegion State
First NameLast NameZip Code
Business UnitCityOptional Field
data security TRENDS
File Transfer Methodsn = 69
SSO Typesn = 74
Encryption File Typesn = 68
95% Provider SFTP4% Client SFTP1% Self-Registration
73% SAML 2.011% No SSO 12% SAML 2E4% 3DES
65% PGP Encrypted File33% No Encryption1% Zip File w/ Password
23 average number of countries included in an HR �le.
43,687average number of users
included within an HR �le.
1.2.3.
4.5.6.
7.8.9.
10.11.12.
88 %
7 %
5 %
Jordan HookerClient Advocate Team Lead
Rhonda JohnsonSenior Account Manager

ALL INFORMATION ENCLOSED IS CONSIDERED INTELLECTUAL PROPERTY OF YOURCAUSE, LLC. 22
top BROWSERS
1. Internet Explorer80%
2. Chrome14%
3. Firefox3.5%
4. Safari2%
n = 188,580 (captured in 2015)
IE 11.049%
IE 8.032%
IE 10.08%
IE 9.06%
IE 7.05%
usage by version of Internet Explorer [IE]
YourCause’s Technology VisionsYourCause seeks to increase the ability for nonpro�ts to achieve their stated causes by e�ectively utilizing technology to deliver the greatest level of sustained support for making a di�erence in our world. CSRconnect has quickly become a technical foundation for connecting the enterprise, the employee and the nonpro�t. The platform must continually adapt to the usability and functional preferences of its users and those organizations relying on services being delivered. Below is the technology infrastructure that makes the CSRconnect vision a possibility.

ISSUE 3 - REVIEW OVERALL METHODOLOGY AND GLOSSARY OF TERMS FOUND ON PAGES 27 / 30.
payment PROCESSING
23
processing FINDINGSA subset of data (roughly 43,000 checks) were randomly pulled to determine trends and relevant datapoints related to donation processing. The sample set selected was taken from checks created within the last six-months prior the date of this publication.
73%Monthly Processing
Brice BoulaSecurity Analyst
Matangi KendapadyProject Manager
Tim LeeQuality Assurance
Donation Frequency
27%Quarterly Processing

ALL INFORMATION ENCLOSED IS CONSIDERED INTELLECTUAL PROPERTY OF YOURCAUSE, LLC. 24
$893average ACH value per transaction
$301average check value per transaction
2015 Quarterly Payment Averages
Q1 Q2 Q3 Q4
Average ACH Value Per Transaction
Average Check Value Per Transaction
$1,106 $851 $879 $882
$370 $295 $249 $300
3028262422201816141210
86420
May 12 | Aug 12 | Nov 12 | Feb 13 | May 13 | Aug 13 | Nov 13 | Feb 14 | May 14 | Aug 14 | Nov 14 | Feb 15 | May 15 | Aug 15 | Nov 15
Days to Deposit Donations
month
days
One of the most important issues to donors is how long it takes a charity to receive and deposit their donation. As a result, YourCause has stepped up its e�orts to get more charities registered for Automate Clearing House (ACH) payments, allowing for next-business day deposits. This visualization represents the growth in registered ACH recipients: the black line represent-ing the median average days to deposit, while the green line represents the number of charities signed up for ACH. As the number of charities receiving donations via ACH has increased, the total number of days it takes for a payment to be received and deposited has decreased.
deposit FINDINGS
nonp
ro�t
s re
gist
ered
for A
CH
4500
4000
3500
3000
2500
2000
1500
1000
500
0
= median days to deposit
= number of ACHs in the CSRconnect system

ISSUE 3 - REVIEW OVERALL METHODOLOGY AND GLOSSARY OF TERMS FOUND ON PAGES 27 / 30.25
Erika BoboClient Advocate
nonpro�t IMPACT
Feeding AmericaCSRconnect which provided $729,835 to provide 8,028,175 meals to the hungry.
www.feedingamerica.org
Austin Pets AliveCSRconnect which provided $339,017 to provide medical care for 3,390 puppies.
www.austinpetsalive.org
Capital Area Food Bank of TexasCSRconnect which provided $763,046 to provide 2,289,138 meals to those in need in North Texas.
www.austinfoodbank.org
Smile TrainCSRconnect which provided $674,146 to support 2,697 Cleft Lip & Palate Surgeries to produce 2,697 new smiles.
www.smiletrain.org

Feed My Starving ChildrenCSRconnect which provided $711,848 to feed 89 villages of 100 people for a year.
www.fmsc.org
26
SafePlaceCSRconnect which provided $564,916.54 for 4 nights of shelter to 3,766 survivors of sexual or domestic violence.
www.safeaustin.org
Doctors Withour BordersCSRconnect which provided $1,634,658 to vaccinate against meningitis, measles, polio and other deadly diseases to 1,634,658 people.
www.doctorswithoutborders.org
Charity WaterCSRconnect which provided $379,652.55 to provide clean water for 1,055 people for a year!
www.charitywater.org
World VisionCSRconnect which provided $1,672,040.35 to provide clean water, safety and education for 3,981 people.
www.worldvision.org ALL INFORMATION ENCLOSED IS CONSIDERED INTELLECTUAL PROPERTY OF YOURCAUSE, LLC.

overall METHODOLOGYOverviewTo construct the third edition of the Industry Review, data was collected from users that have at least 12 months of usage with the system, consequently excluding any organization joining the CSRconnect community after June 30, 2014. The data analysis only looked at data from January 1, 2015 to December 31, 2015. The data is not a re�ection of any speci�c organization but rather a broader overview of all data collected from all users over the period of 12 months.
DataThe complete data analysis only looked at data captured within the CSRconnect system and that of which is currently stored within the active database. Additional data points referenced within the Bloomberg Industry Classi�cation Standard (BICS) were used to identify each organization’s industry. At no time was external data used to support the analysis.
One might note there are some pretty drastic di�erences between previous industry reports and this edition – speci�cally as it relates to international employees and the donation distribution as it relates to region. Because the data being used is from active YourCause clients, the underlying client sample has changed pretty signi�cantly between 7/1/14 and 1/1/15. Furthermore, the YourCause data collection e�orts are far more robust than they have been in previous editions.
Guiding PrinciplesTransparency: The topics covered within this industry review were in�uenced by questions most frequently asked of YourCause by clients, prospects or industry peers. It is our goal to transparently display this data (and consequently, the responses to such questions) within a common document for the industry to observe – with-out bias, prejudice and with as little opinion from YourCause as possible.
Design: A great design is oftentimes able to make plain old data… exciting! The creation and purpose of this Industry Review is to bring excitement and enthusiasm to this space by way of the data we uncover. Therefore, the team responsible for the production of this Industry Review has placed a considerable amount of time on ensuring an ongoing visual appeal while maintaining overall data integrity. Foundation Building: With this edition completed, a foundation of data is now in place to serve as a baseline for future publications and enable our team to determine trends for the prior six and twelve months. Moving forward, subsequent publications will reference previous Industry Reviews and seek to analyze possible short - and long - term trends.
Limitations and AssumptionsAll conclusions are extracted from direct historical data managed internally during the January 1, 2015 to December 31, 2015 timeframes. By way of the total volume of records being analyzed, we are able to determine, with a 95% con�dence level, the conclusions stated within this review are accurate.
• For industry-wide averages, it is important to note that all ‘zero value data’ have been excluded within the calculations, eliminating unintentional adverse impacts on averages.
• Individual users entering large volumes of hours for a single day’s event may skew average volunteer hours.
• Average volunteer hours represent the average number of hours logged on an annual basis (calendar year).
2527

ALL INFORMATION ENCLOSED IS CONSIDERED INTELLECTUAL PROPERTY OF YOURCAUSE, LLC. 28
Domestic Regional Breakout
N - Northern Region: Minnesota, Michigan, North Dakota, South Dakota, Montana, Wisconsin and Wyoming.
E - Eastern Region: Connecticut, Pennsylvania, Ohio, Delaware, New Jersey, New York, Georgia, Massachusetts, North Carolina, South Carolina, Vermont, Rhode Island, Maine, New Hampshire, West Virginia, Virginia, Mary-land and Washington, D.C.
W - Western Region: Idaho, California, Washington, Arizona, Utah, Oregon, Nevada, Alaska and Hawaii.
MW - Midwest Region: Nebraska, Iowa, Illinois, Kentucky, Kansas, Missouri, Indiana and Colorado.
S - Southern Region: Texas, New Mexico, Oklahoma, Tennessee, Louisiana, Arkansas, Florida, Alabama and Mississippi.
Industry Categorization
Communications - Cable & Satellite, Entertainment, Media Non-Cable, Wireless Telecom Services, Wireline Telecom Services
Consumer Discretionary - Airlines, Apparel & Textile Products, Automotive, Casinos & Gaming, Consumer Services, Distributors, Educational Services, Entertainment Resources, Home & O�ce Products, Home Builders, Home Improvements, Leisure Products, Restaurants, Travel & Lodging
Consumer Staples - Consumer Products, Food & Beverage, Retail Staples Supermarkets, Tobacco
Energy - Exploration & Production, Integrated Oils, Oil & Gas Services, Pipeline, Re�ning, Renewable Energy
Financials - Banking, Commercial Finance, Consumer Finance, Financial Services, Life Insurance, Property & Casualty, Real Estate
Health Care - Health Care Facilities & Services, Managed Care, Medical Equipment & Devices, Pharmaceuticals
Industrials - Aerospace & Defense, Electronic Equipment, Industrial Other, Machinery, Manufactured Goods, Railroad, Transportation & Logistics, Waste & Environment Service, Equipment & Facilities
Materials - Chemicals, Construction Materials, Construction & Packaging, Forest & Paper Products, Metals & Mining
Technology - Communications Equipment, Hardware, Software & Services
Utilities – Electric & Gas Utilities and Energy Providers
Government - Sovereign, Government Agency, Government Regional/Local, Supranational, Development Bank, Winding Up Agency

29
glossary of TERMS
The percentage of all possible samples that can be expected to include the true population parameter.
Quantitative measurements used to track performance.
The value placed in the middle of a set of values.
Summaries that calculate the "middle" or "average" of your data; these are called measures of central tendency.
A relationship between two variables in which both variables perform the same action, or they are inverse of one another.
The value that occurs most frequently within a set of numbers.
Con�dence Level
Mode
Metrics
Median
Descriptive Statistics
Correlation
Employment in which a person works a minimum number of hours de�ned as such by his/her employer.
An incentive that allows employees to volunteer to one charity but give the incentive donation to a charity of their choice.
A corporate employee giving program in which a company provides grants to nonpro�ts where employees and retirees volunteer on a regular basis.
Broken out into three distinct categories: a) user engagement (those who logged into the system and either gave, volunteered or utilized any of the other services provided by the online system); b) donor engagement in giving (those who made a donation if a program is o�ered by the company); and c) volunteer engagement by volunteering (those who volunteer if a program is o�ered by the company).
Dollars-for-Doers
Employee Engagement
Full-time (employee)
CauseCards
A donation to a common fund or collection.
A limit in the amount of additional donation dollars a party is willing to contribute to an individual’s donation.
An electronic network for �nancial transactions. ACH processes large volumes of credit and debit transactions in batches. Credit transfers include direct deposit, payroll and vendor payments.
A systematic course of aggressive activities surrounding a speci�c human or natural disaster to encourage employee engagement and assistance.
A systematic course of aggressive activities for a speci�c promotion surrounding a CSR program which encourages engagement.
Contributions
Automated Clearing House (ACH)
Disaster Programs
Campaigns
Match Cap
A free portal for nonpro�ts to administer their charity pages and engage with YourCause corporate clients and their employee networks worldwide.
An employee of a charity undertakes a variety of administrative tasks within the YourCause NPO portal.
NPO Portal
Charity Administrators

ALL INFORMATION ENCLOSED IS CONSIDERED INTELLECTUAL PROPERTY OF YOURCAUSE, LLC. 30
While pulling together this edition of our Industry Review, it quickly became apparent that the growth in the volume of data we are now able to draw upon to publish our insights, is enabling us to provide a much stronger (and more predictive) analysis. Many of the initial theories and hypotheses we originally used when starting (and operating) YourCause are now being con�rmed by the resulting data from client usage. Many of the trends and predictions that were scattered amongst the plans of the administrators operating the employee engagement programs via CSRconnect, are now being validated across geography, industry and peers. It’s exciting to see that as the total number of participating clients grow (the “N” value), the data will only become more and more insightful, making upcoming issues of our Industry Review an instrumental compass for steering successful employee engagement programs into the future.
Onward and upward:- Matt Combs
�nal THOUGHTS
The value of the di�erence between the largest value and the smallest value in a set of numbers.
Users who have demonstrated at least 1 hour of participation through team or individual events and/or have donated at least 1 unit of payment to a nonpro�t. The calculation is performed by dividing the number of participants by the number of eligible participants aggregated per a�liate.
Range
Participation
An incentive in which an employee may ‘earn’ an additional donation to a speci�ed charity as a result of volunteering a pre-de�ned number of total hours over a set period of time.
A transaction symbolizes a unique donation performed within the YourCause provided platform.
A person who has retired from full-time work.
An act of redeeming an incentive, usually earned through participation within a speci�c employee program, in the form of a donation to a quali�ed nonpro�t organization.
Volunteer Grants
Redemption (monthly/seasonal)
Transaction
Retiree
A day in which a person voluntarily o�ers himself or herself for a service or undertaking.
A program which allows employees to give money to a registered charity of their choice by having a deduction taken straight from their gross pay.
A donation recieved by cash or check transacted outside of the system, and logged within CSRconnect by the donor.
Volunteer Days
Payroll Giving
O�ine Giving

To learn more about CSRconnect and YourCause visit: csrconnect.me
About YourCause
YourCause delivers the CSRconnect Employee Engagement Platform to enterprise clients of all sizes, providing a fully hosted solution for a broad array of corporate community involvement programs. CSRconnect is a robust and highly con�gurable software platform that caters to each client’s employee engagement program with giving, volunteering, sustainability, grants, non-pro�t partnerships, and other related engagement tools and philanthropy processing services. Through the CSRconnect Employee Engagement Platform, clients are able to fully manage and report the depth of their social impact and overall employee engagement.