industry sales review march 2017 -...
TRANSCRIPT
1 | P a g e Industry Performance Review Report of PPAC: March, 2017 www.ppac.gov.in
INDUSTRY SALES REVIEW
March 2017

2 | P a g e Industry Performance Review Report of PPAC: March, 2017 www.ppac.gov.in
This report analyses the trend of consumption of petroleum products in the
country during the month of March, 2017. Data on product-wise monthly
consumption of petroleum products for March, 2017 is uploaded on PPAC
website (www.ppac.gov.in).
1.0 CONSUMPTION :
The growth (%) in consumption of petroleum products, category-wise, for the
month of March, 2017 is given in Table-1.
Table-1: Petroleum Products Consumption (Quantity in TMT)
All Products : India’s demand for fuel consecutively for the third month in a row,
dropped by -0.6% in March this year. The demand for all oil products dropped to
17.36 MMT from 17.47 MMT a year ago. On cumulative basis, a growth of 5.2%
was registered for the period April 2016 to March 2017. Except for LPG, MS, HSD,
ATF, Pet Coke and ‘other’ products which recorded a positive growth, all other
products recorded a negative growth during the month. However, SKO
registered a major de-growth of -26.8 % during the month and -21.0% on
cumulative basis, which is the highest ever de-growth since 1970-71, mainly
because of reduced PDS allocation to states and voluntary surrender of PDS
quota by some states and release of about 331.7 lakh new connections
including 200.3 lakh connections released on account of Ujjwala scheme since
its inception in May 2016.
Figure-1: Comparison of monthly POL consumption (MMT) and growth (%) since April, 2015
9.3%
5.1% 5.7%
8.1%
10.0%
16.7%
19.4%
6.8%
8.3%
16.5%
14.7%
19.0%
10.3%
8.9%
11.5%
8.8%
18.2%
-0.8%
7.0%
9.3%
1.9%
-5.9%
-3.1%
-0.6%
-10%
-5%
0%
5%
10%
15%
20%
25%
10
11
12
13
14
15
16
17
18
Ap
r-1
5
May
Jun
e
July
Au
g
Sep
Oct
No
v
De
c
Jan
-16
Feb
Mar
Ap
r-1
6
May Jun
Jul
Au
g
Sep
Oct
No
v
De
c
Jan
-17
Feb
Mar
Previous Year (MMT) Current Year (MMT) Monthly Growth (%)
PRODUCT Share
(%) March 2016 March 2017
Growth
(%) Products Included
Sensitive Products 14.0% 2,418 2,301 -4.8% SKO & LPG
Major decontrolled
Products 70.0% 12,557 12,329 -1.8%
HSD, MS, Naphtha,
Lubes, LDO, FO/LSHS,
Bitumen & ATF
Minor decontrolled
Products 16.0% 2,496 2,728 9.3%
Pet. coke & other
minor products
Grand Total 100% 17,471 17,358 -0.6%

3 | P a g e Industry Performance Review Report of PPAC: March, 2017 www.ppac.gov.in
Compounded Annual Growth Rate (CAGR) of total petroleum product
consumption during 12th Five Year Plan (2012-17) is 5.6% as compared to 4.2%
during 11th plan period (2007-12).
Indian 'Sales Managers Index' (SMI) released by London-based World
Economics, which produces data and analysis on the global economy, for
March 2017, shows that the Indian economy is in recovery mode from
December 2016’s demonetization policy. The abrupt impact of demonetization
had hit small and medium size businesses hard as they predominately rely on
cash based transactions. However SMI suggests an improving situation for Indian
businesses in March, with growing sales and enhanced levels of confidence.
The Nikkei India Services Purchasing Managers' Index, or PMI, rose to 51.5 in
March 2017 from February 2017's 50.3. Manufacturing sector activity rose to a
five-month high in March 2017 with a sharp rise in production and new orders.
The Nikkei India Manufacturing Purchasing Managers’ Index (PMI) rose to 52.5 in
March 2017, from 50.7 in February 2017.
Figure-2 gives a comparison of percentage of monthly sales volumes of all
petroleum products by PSU and Private Oil companies.
Figure-2: Comparison of monthly POL Sales in PSU & Private Sector (%) since April, 2015
PPAC analyzes the sales recorded by the Industry on the basis of the data
available. Data on direct private imports received from DGCIS, which are
added to the final sales reported by oil companies for estimation of
consumption figures, are available up to January, 2017 and private imports data
for the months of February and March, 2017 are projected based on February
2016 to January, 2017 actual data provided by DGCIS.
0%
10%
20%
30%
40%
50%
60%
70%
80%
90%
100%
PSU Sales Private Sales

4 | P a g e Industry Performance Review Report of PPAC: March, 2017 www.ppac.gov.in
Detailed product-wise analysis of growth for March, 2017 is given in
the following sections:
1.2 Petrol / Motor Spirit (MS): MS consumption during the month of March, 2017
recorded a growth of 2.9% as compared to March, 2016 and a cumulative
growth of 8.8% for the period April 2016 to March 2017.
The factors affecting MS consumption during the month can be attributed
mainly to the following:
i. Availability of cheaper fuel resulting in preference for petrol driven
vehicles, growth in automobile industry and improved road connectivity
has boosted MS sales in general.
ii. MS consumption had registered a high growth of 21.0% in March, 2016 as
compared to that in March 2015 resulting in a very high historical base
volume. Hence despite recording good sales volume, the growth in
percentage terms increase was moderate.
iii. Huge downward price revision that happened on 1st April 2017 prompted
dealers to keep very low inventory resulting in shifting of the sales to the
month of April, 2017.
Figure 3 gives month-wise MS consumption volume (TMT) and month-on-month
growth (%) since April, 2015.
Figure-3: Month wise MS consumption (TMT) and growth (%) since April, 2015
Other factors impacting consumption of MS are:
The Indian automobile industry has witnessed 1.33% growth in its domestic sales
during the month of March 2017. For the period April 2016 to March 2017 the
industry has recorded a growth of 6.8%, according to data released by Society
of Indian Automobile Manufacturers (SIAM). March, 2017 is generally a good
month for auto manufacturers as a lot of customers are scheduling their
18.7%
9.0%
9.7%
12.9% 10.4%
25.4%
14.5%
17.2%
11.8% 11.4%
12.9%
21.5%
11.9%
13.6%
4.4%
14.7%
24.9%
-3.4%
13.8% 14.3%
7.9%
-0.6%
3.1%
2.9%
-10%
-5%
0%
5%
10%
15%
20%
25%
30%
35%
0
500
1000
1500
2000
2500Previous Year (TMT) Current Year (TMT) Monthly Growth (%)
5 | P a g e Industry Performance Review Report of PPAC: March, 2017 www.ppac.gov.in
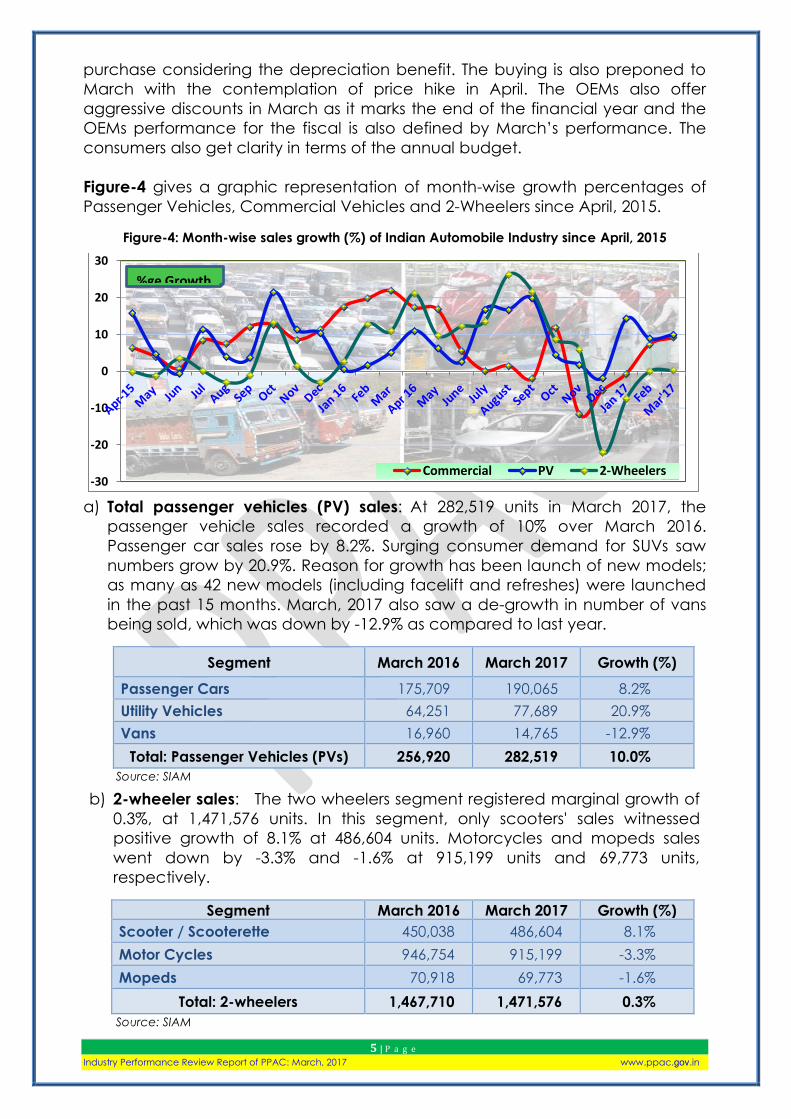
purchase considering the depreciation benefit. The buying is also preponed to
March with the contemplation of price hike in April. The OEMs also offer
aggressive discounts in March as it marks the end of the financial year and the
OEMs performance for the fiscal is also defined by March’s performance. The
consumers also get clarity in terms of the annual budget.
Figure-4 gives a graphic representation of month-wise growth percentages of
Passenger Vehicles, Commercial Vehicles and 2-Wheelers since April, 2015.
Figure-4: Month-wise sales growth (%) of Indian Automobile Industry since April, 2015
a) Total passenger vehicles (PV) sales: At 282,519 units in March 2017, the
passenger vehicle sales recorded a growth of 10% over March 2016.
Passenger car sales rose by 8.2%. Surging consumer demand for SUVs saw
numbers grow by 20.9%. Reason for growth has been launch of new models;
as many as 42 new models (including facelift and refreshes) were launched
in the past 15 months. March, 2017 also saw a de-growth in number of vans
being sold, which was down by -12.9% as compared to last year.
Segment March 2016 March 2017 Growth (%)
Passenger Cars 175,709 190,065 8.2%
Utility Vehicles 64,251 77,689 20.9%
Vans 16,960 14,765 -12.9%
Total: Passenger Vehicles (PVs) 256,920 282,519 10.0%
Source: SIAM
b) 2-wheeler sales: The two wheelers segment registered marginal growth of
0.3%, at 1,471,576 units. In this segment, only scooters' sales witnessed
positive growth of 8.1% at 486,604 units. Motorcycles and mopeds sales
went down by -3.3% and -1.6% at 915,199 units and 69,773 units,
respectively.
Segment March 2016 March 2017 Growth (%)
Scooter / Scooterette 450,038 486,604 8.1%
Motor Cycles 946,754 915,199 -3.3%
Mopeds 70,918 69,773 -1.6%
Total: 2-wheelers 1,467,710 1,471,576 0.3%
Source: SIAM
-30
-20
-10
0
10
20
30
Commercial PV 2-Wheelers
%ge Growth
6 | P a g e Industry Performance Review Report of PPAC: March, 2017 www.ppac.gov.in
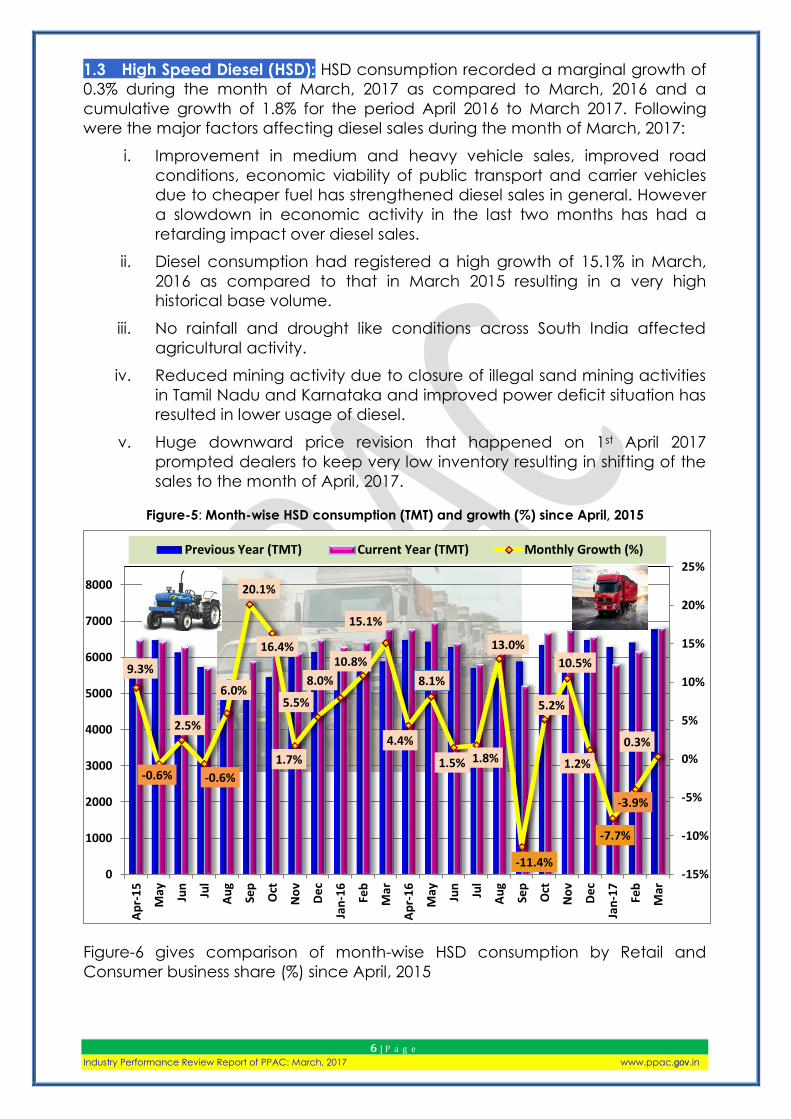
1.3 High Speed Diesel (HSD): HSD consumption recorded a marginal growth of
0.3% during the month of March, 2017 as compared to March, 2016 and a
cumulative growth of 1.8% for the period April 2016 to March 2017. Following
were the major factors affecting diesel sales during the month of March, 2017:
i. Improvement in medium and heavy vehicle sales, improved road
conditions, economic viability of public transport and carrier vehicles
due to cheaper fuel has strengthened diesel sales in general. However
a slowdown in economic activity in the last two months has had a
retarding impact over diesel sales.
ii. Diesel consumption had registered a high growth of 15.1% in March,
2016 as compared to that in March 2015 resulting in a very high
historical base volume.
iii. No rainfall and drought like conditions across South India affected
agricultural activity.
iv. Reduced mining activity due to closure of illegal sand mining activities
in Tamil Nadu and Karnataka and improved power deficit situation has
resulted in lower usage of diesel.
v. Huge downward price revision that happened on 1st April 2017
prompted dealers to keep very low inventory resulting in shifting of the
sales to the month of April, 2017.
Figure-5: Month-wise HSD consumption (TMT) and growth (%) since April, 2015
Figure-6 gives comparison of month-wise HSD consumption by Retail and
Consumer business share (%) since April, 2015
9.3%
-0.6%
2.5%
-0.6%
6.0%
20.1%
16.4%
1.7%
5.5%
8.0%
10.8%
15.1%
4.4%
8.1%
1.5% 1.8%
13.0%
-11.4%
5.2%
10.5%
1.2%
-7.7%
-3.9%
0.3%
-15%
-10%
-5%
0%
5%
10%
15%
20%
25%
0
1000
2000
3000
4000
5000
6000
7000
8000
Ap
r-1
5
May Jun
Jul
Au
g
Sep
Oct
No
v
De
c
Jan
-16
Feb
Mar
Ap
r-1
6
May Jun
Jul
Au
g
Sep
Oct
No
v
De
c
Jan
-17
Feb
Mar
Previous Year (TMT) Current Year (TMT) Monthly Growth (%)

7 | P a g e Industry Performance Review Report of PPAC: March, 2017 www.ppac.gov.in
Figure-6: Month-wise HSD consumption by Retail and Consumer business share (%) since April,
2015
Other factors affecting diesel consumption are discussed below:
a) Commercial vehicles (CV) sales: The green shoots of recovery, after the
speed breaker of demonetization, in the Indian commercial vehicle sector
are being seen. Commercial vehicles will also have to adhere to BS IV
emission norms from 1.4.2017 and therefore the month of March saw a surge
in sales. At 87,257 units, CV sales recorded highest monthly sales for the fiscal
year 2016-17 and recorded a growth of 9.3%. Medium & Heavy Commercial
vehicles (M&HCV) recorded highest-ever sales in a single month this fiscal by
selling 39,353 units, clearly pointing to considerable pre-buying of heavy
vehicles before the BS IV deadline.
b) Light Commercial Vehicle (LCV): The LCV sector too contributed to overall
sector growth with sales of 47,904 units and a growth of 12.1% over historicals.
Segment March 2016 March 2017 Growth (%)
M&HCVs 37,137 39,353 6.0%
LCVs 42,728 47,904 12.1%
Total: Commercial Vehicles 79,865 87,257 9.3%
Source: SIAM
c) Port traffic: There has been a growth of 9.5% in port traffic for the month of
March, 2017 mainly due to increase in traffic at all ports except Ennore,
Chennai and Chidambarnar.
The growth in traffic during the period April 2016 to March 2017 has been
contributed mostly by iron ore (163.67%), POL products (8.16%) and others
(18.54%) while there has been a drop in finished fertilizer (-17.12%) and
thermal coal (-13.48%). High growth in iron ore traffic is due to resumption of
iron ore mining activities in Karnataka, Goa and Odisha.
0
20
40
60
80
100
120HSD Retail HSD Direct

8 | P a g e Industry Performance Review Report of PPAC: March, 2017 www.ppac.gov.in
Table-2 below gives the port-wise performance during the month of March,
2017.
Table-2: Traffic handled at major ports in March, 2017
TRAFFIC HANDLED AT MAJOR PORTS (TMT)
PORTS March 2016 March 2017 Growth (%)
Kolkata + Haldia 4,748 5,789 21.9%
Paradip 7,616 8,342 9.5%
Visakhapatnam 5,067 5,488 8.3%
Kamarajar (Ennore) 3,203 2,724 -15.0%
Chennai 4,692 4,652 -0.9%
V.O. Chidambaranar 3,529 3,301 -6.5%
Cochin 1,587 2,417 52.3%
New Mangalore 3,441 4,014 16.7%
Mormugao 2,757 4,195 52.2%
Mumbai 5,023 5,476 9.0%
JNPT 5,411 5,833 7.8%
Kandla 8,942 9,106 1.8%
Total 56,016 61,337 9.5% Source: IPA
d) Power situation improves: The power deficit position for the month of March,
2017 is given in Table-3. The power deficit position improved from -1.5% in
March, 2016 to -0.3% during March, 2017. The shortage during the month
improved for all regions. The deficit continues mainly in the states of Jammu &
Kashmir, Uttar Pradesh and Assam. The improved power position in March, 2017
may have led to reduced usage of diesel for back-up power generation.
Table-3: Power deficit: Region-wise position for March, 2016 (% deficit)
States
March 2017 (P) March 2016
Requirement
(MU)
Available
(MU)
Deficit Deficit
(%) MU (%)
North 26,586 26,399 -188 -0.7% -4.4%
West 30,579 30,571 -8 0.0% -0.1%
South 28,847 28,829 -18 -0.1% -1.1%
East 10,698 10,691 -7 -0.1% -0.2%
North-East 1,211 1,178 -33 -2.8% -2.7%
Total 97,923 97,669 -254 -0.3% -1.5% Source: Central Electricity Authority (CEA)
e) Seasonal rainfall scenario: The rainfall in the country during the month has
been less than normal. As against a normal of 30.9 mm, only 28.4 mm rain was
recorded during the month of March 2017, which was -8.0% below normal. The
drought due to shortage in rainfall in the last few months has extended its grip
in the South, with the South-West monsoon falling significantly short and the
North-East monsoon proving a total failure. Production of food crops such as
paddy, ragi, jowar and sugarcane, among others, has taken a hit in the
region. Also, plantation crops such as tea, coffee, coconut, rubber and
arecanut have been impacted. Output in allied agriculture sectors such as
dairy, sericulture and poultry has been affected specifically in Southern India.

9 | P a g e Industry Performance Review Report of PPAC: March, 2017 www.ppac.gov.in
1.4 Bitumen: Bitumen consumption recorded a de-growth of -12.2% during the
month of March, 2017. On cumulative basis, a marginal de-growth of -0.8% was
recorded for the period April 2016 to March 2017. Demonetization of currency in
the country since 8th November 2016, resulted in a slow-down in construction
activities due to cash crunch and restriction on cash withdrawals imposed by
the banks. Year-end budget constraints in many states also resulted in reduced
upliftment of bitumen by the state PWDs. Figure-6 gives the month wise bitumen
consumption and growth since April, 2015.
Figure-6: Month-wise Bitumen consumption (TMT) and growth (%) since April, 2015
1.5 LPG: Total LPG consumption continuously for the last forty three months in a
row recorded a positive growth of 1.9% during March, 2017 and cumulative
growth of 9.8% for the period April 2016 to March 2017. Last year in the month of
March, 2016, a growth of 15.2% and during April 2015 to March 2016 a growth of
9.0% was observed. PPAC records from 1970-71 to 2016-17 show that there was
always growth in total LPG consumption every year except for a minor
de-growth of -1.2% during 1980-81. Compounded Annual Growth Rate (CAGR)
of total LPG consumption of last five years is 7.0% and last 10 years is 7.1%.
-2.3%
3.4%
-6.5%
19.0%
43.9%
37.9%
77.8%
1.9%
18.0%
29.2%
15.3%
25.3% 20.4% 15.7%
10.7%
-20.4%
-11.9% -11.3% -12.1%
22.4%
0.7%
-7.4%
-13.5% -12.2%
-40%
-20%
0%
20%
40%
60%
80%
100%
0
100
200
300
400
500
600
700
800
Ap
r-1
5
May Jun
Jul
Au
g
Sep
Oct
No
v
De
c
Jan
-16
Feb
Mar
Ap
r-1
6
May Jun
Jul
Au
g
Sep
Oct
No
v
De
c
Jan
-17
Feb
Mar
Previous Year (TMT) Current Year (TMT) Monthly Growth (%)

10 | P a g e Industry Performance Review Report of PPAC: March, 2017 www.ppac.gov.in
LPG-Packed Domestic consumption registered a growth of 3.4% during March,
2017 and a growth of 9.8% during the period April 2016 to March 2017. Last year
during March, 2016, a growth of 13.2% and in April 2015 to March 2016 a growth
of 7.1% was seen. During the month of March, 2017, approximately 37.5 lakhs
new connections were released out of which 25.1 lakhs were released on
account of Ujjwala scheme. In the period April 2016 to March 2017, about 331.7
lakhs new connections and 69.9 lakhs DBCs were released including
approximately 200.3 lakh connections released on account of Ujjwala scheme
since inception in May 2016.
LPG-Packed Non-Domestic consumption for the past twenty seven months in a
row registered a growth of 2.7% in March, 2017 and cumulative growth of 21.3%
during April 2016 to March 2107. Last year during March, 2016, growth of 35.3%
and cumulative growth of 39.3% during April 2015 to March 2016 was observed.
It is mainly due to easy availability and curb in diversion of subsidized domestic
cylinders after the launch of DBTL.
Bulk LPG consumption registered a de-growth of -17.4% during March, 2017 and
cumulative growth during April 2016 to March 2017 was 14.8%. Last year in the
month of March 2016, a growth of 14.4% and during April 2015 to March 2016 a
minor growth of 0.5% was seen.
Auto LPG consumption registered a growth of 1.0% in March, 2017 and
cumulative de-growth of -2.2% during April 2016 to March 2017. However, last
year in the month of March, 2016 a growth of 3.6% and during April 2015 to
March 2016 growth of 4.3% was witnessed. Reasons for de-growth in Auto LPG is
mainly due to more focus on CNG.
Figure-6: Month-wise LPG consumption (TMT) and growth (%) since April, 2015
9.7%
5.2%
10.4%
11.3%
7.9%
4.5%
12.6%
2.7%
7.1%
5.5%
16.7%
15.2%
7.5%
6.8%
8.2% 7.9%
18.7%
15.4%
9.6%
15.7%
7.6%
16.2%
3.5% 1.9%
-5%
0%
5%
10%
15%
20%
0
500
1000
1500
2000
Ap
r-1
5
May Jun
Jul
Au
g
Sep
Oct
No
v
De
c
Jan
-16
Feb
Mar
Ap
r-1
6
May Jun
Jul
Au
g
Sep
Oct
No
v
De
c
Jan
-17
Feb
Mar
Previous Year (TMT) Current Year (TMT) Monthly Growth (%)

11 | P a g e Industry Performance Review Report of PPAC: March, 2017 www.ppac.gov.in
1.6 Naphtha: Naphtha consumption recorded a de-growth of -1.8% during the
month of March, 2017 and a minor de-growth of -0.1% on cumulative basis for
the period April 2016 to March 2017. Petrochemical industries remain the main
consumers of naphtha in addition to minor consumers like fertilizer and power
plants. Fluctuation in demand of naphtha by the petrochemical industry
(particularly polymers and plastics) largely drives the growth in consumption.
1.7 ATF: During March, 2017 growth in consumption of ATF was 10.4% and a
cumulative growth of 12.1% was observed for the period April 2016 to March
2017. This is the highest growth in annual consumption of ATF since 2007-08 which
is mainly due to a growth of 21.76% in domestic passenger traffic during the
current year. Passengers carried by domestic airlines during March, 2017 were
90.45 lakhs as against 78.72 lakhs during March, 2016 thereby registering a
growth of 15.8%. Growth in passenger traffic has been strong since the new
millennium, especially with rising incomes and low-cost aviation.
Figure-7: Month-wise ATF consumption (TMT) and growth (%) since April, 2015
1.8 FO/LSHS: FO and LSHS consumption registered a de-growth of -23.3% during
March, 2017 and a cumulative growth of 8.4% for the period April 2016 to March
2017. The drop is due to decreased consumption of FO in power, steel and
general trade sectors. The consumption of LSHS has reduced due to shift to
natural gas by major customers like fertilizer industries.
1.9 PETCOKE: Pet-coke consumption registered a growth of 6.4% during March,
2017 and a cumulative growth of 22.2% during April 2016 to March 2017.Growth
seems to have become synonymous to the Petcoke market in India. The
demand for the product has been rising remarkably and during the last five
fiscals, it has grown at a CAGR of 30.9%. Petcoke is a source of fuel for cement,
steel, graphite, aluminium, etc. industries as per their techno-economic
considerations.
4.3%
4.0%
13.9%
6.8%
4.8%
4.5%
11.4%
16.4%
13.0%
7.1%
15.2%
12.0% 12.7%
14.0%
7.9%
11.8% 10.5%
15.4%
6.7%
9.7%
17.1%
18.8%
10.1%
10.4%
0%
5%
10%
15%
20%
25%
150
250
350
450
550
650
Ap
r-1
5
May Jun
Jul
Au
g
Sep
Oct
No
v
De
c
Jan
Feb
Mar
Ap
r-1
6
May Jun
Jul
Au
g
Sep
Oct
No
v
De
c
Jan
-17
Feb
Mar
Previous Year (MMT) Current Year (MMT) Monthly Growth (%)
12 | P a g e Industry Performance Review Report of PPAC: March, 2017 www.ppac.gov.in
Tendency for using Petcoke as primary fuel or partially replacing coal with it is
gaining momentum among its end users due to its higher composition of carbon
relative to coal and therefore resultant calorific value. India is the second largest
Petcoke consuming country in Asia after China. A large quantity of Petcoke is
being imported in the country to bridge the supply-demand gap. Driven by
rising infrastructure development and growing demand for automotive, steel
and cement consumption is on increase resulting in improving the demand for
Petcoke.
1.10 LDO: LDO consumption recorded a drop of -29.8% in the month of March,
2017 and a cumulative growth of 10.1% for April 2016 to March 2017. LDO month
wise demand fluctuates depending on its requirement at power plants for boiler
restart as it trips. LDO is also extensively used in various types of furnaces and any
fluctuation in manufacturing activities leads to fluctuation in its consumption.
*******

13 | P a g e Industry Performance Review Report of PPAC: March, 2017 www.ppac.gov.in
Industry Consumption Trend Analysis 2016-17 (p)
('000 MT)
Product
March April-March
2015-16 2016-17 Growth
(%) 2015-16 2016-17
Growth
(%)
(A) Sensitive Products
SKO 566.0 414.2 -26.8 6826.3 5395.9 -21.0
LPG 1852.2 1886.8 1.9 19623.2 21548.2 9.8
Sub Total 2418.2 2301.0 -4.8 26449.5 26944.1 1.9
(B) Major Decontrolled Products
Naphtha 1167.7 1147.2 -1.8 13270.8 13254.3 -0.1
MS 2046.5 2105.7 2.9 21846.6 23764.8 8.8
HSD 6783.1 6805.4 0.3 74647.1 76012.0 1.8
Lubes+Greases 403.4 337.7 -16.3 3571.2 3413.9 -4.4
LDO 49.4 34.7 -29.8 407.1 448.2 10.1
FO/LSHS 739.8 567.4 -23.3 6632.1 7187.7 8.4
Bitumen 787.7 691.5 -12.2 5937.9 5889.1 -0.8
ATF 579.5 639.7 10.4 6261.7 7018.7 12.1
Sub Total 12557.1 12329.3 -1.8 132574.5 136988.7 3.3
Sub - Total
(A) + (B) 14975.3 14630.3 -2.3 159024.0 163932.8 3.1
(C) Minor Decontrolled Products
Pet.Coke 1967.7 2093.4 6.4 19297.4 23588.9 22.2
Others 528.1 634.5 20.2 6352.2 6692.1 5.4
Sub Total 2495.8 2727.9 9.3 25649.6 30281.0 18.1
Total 17471.1 17358.2 -0.6 184673.6 194213.8 5.2