industry update fall 2016 - harriswilliams.com · rockwell automation, inc. ... hydraulic pressure...
TRANSCRIPT

www.harriswilliams.com
Investment banking services are provided by Harris Williams LLC, a registered broker-dealer and member of FINRA and SIPC, and Harris Williams & Co. Ltd, which is authorized andregulated by the Financial Conduct Authority. Harris Williams & Co. is a trade name under which Harris Williams LLC and Harris Williams & Co. Ltd conduct business.
INDUSTRIAL TECHNOLOGY
INDUSTRY UPDATE │ FALL 2016

PAGE |
www.harriswilliams.com
SUMMARY
1
Emerson (NYSE: EMR) is extending its presence in advanced flow measurementand control technologies with the acquisition of the Blending & Transfer Systemsbusiness of FMC Technologies, a leading provider of systems for lubricant, grease,fuel and chemical blending applications within the refining and chemicalindustries. The Blending & Transfer Systems business will join the flow solutionssegment within Emerson Automation Solutions.Source
AMETEK, Inc. (NYSE: AME) announced that it has completed the acquisition ofLaserage Technology Corporation, a leading provider of laser fabrication servicesfor the medical device market. Laserage is a privately held company withheadquarters and manufacturing operations in Waukegan, IL.Source
Windjammer Capital Investors has acquired Advanced Instruments, LLC.Advanced Instruments provides laboratory test equipment and relatedconsumables for use in clinical, food and dairy, microbiology, pharmaceutical andbiotech markets. AI serves thousands of end users in over 90 countries under theAdvanced Instruments, Fiske and Mart Microbiology brands.Source
Rockwell Automation, Inc. (NYSE: ROK) has acquired systems integrator MAVERICKTechnologies to deliver control and information solutions to customers in industriessuch as chemical, food and beverage, and oil and gas. The acquisitionsignificantly strengthens Rockwell Automation’s expertise in key process and batchapplications.Source
INDUSTRIAL TECHNOLOGY
INDUSTRY UPDATE │ FALL 2016
PUBLIC MARKETS | KEY TRADING STATISTICS
CONTENTS
RECENT M&A ACTIVITY
WHAT WE’RE READING
PUBLIC MARKETS
ECONOMIC UPDATE
PUBLIC COMPARABLES
CONTACTS
John ArendaleManaging [email protected]+1 (804) 648-0072
Jeffery PerkinsManaging [email protected]+49 (69) 3650638 13
Giles TuckerManaging [email protected]+1 (804) 887-6145
Jay [email protected]+1 (617) 654-2114
Eric [email protected]+1 (804) 887-6015
Lars [email protected]+49 (69) 3650638 12
Mike WilliamsVice [email protected]+1 (804) 932-1366
M&A | SELECT RECENT ACTIVITY
DEAL SPOTLIGHT | GROHMANN ENGINEERING
to be acquired by
Harris Williams & Co. announces that Tesla Motors (NASDAQ:TSLA),has agreed to acquire Grohmann Engineering GmbH(“Grohmann”). Harris Williams & Co. acted as the exclusivefinancial advisor to Grohmann. Grohmann provides highlycustomized, high yield, multi-process modular industrialautomation solutions worldwide.Read More
As of November 30, 2016Stock Price % Change TEV / EBITDA TEV / LTM EBITDA LTM Margins
Sub-Sector Median 1 Month 12 Month LTM 2016E Nov-15 May-16 Gross EBITDA
Test and Measurement
Sensors and Instrumentation 6.0% 4.0% 11.9x 12.3x 12.9x 11.9x 37.7% 17.4%
Condition Monitoring 8.8% (5.4%) 13.8x 13.5x 11.9x 13.2x 27.0% 11.3%
Flow Control
Pumps and Filtration 7.6% (1.6%) 13.7x 13.2x 12.8x 12.4x 33.7% 16.2%
Valves and Fittings 10.2% 27.0% 13.2x 12.4x 10.6x 11.3x 32.9% 14.3%
Process / Motion Control
Motion and Drives (0.4%) 7.5% 12.2x 10.9x 11.2x 12.3x 31.9% 16.9%
Automation and Robotics 2.1% 6.6% 13.0x 11.7x 10.5x 11.0x 30.5% 11.9%
Test Services
Testing, Inspection, and Certification (0.5%) 5.3% 10.9x 12.1x 10.1x 11.1x 27.4% 18.6%
Engineering and Consulting (5.7%) 2.3% 11.4x 10.2x 8.9x 9.5x 15.5% 7.6%

PAGE |
WHAT WE’RE READING
2
SMART MATERIAL MARKET ESTIMATED TO GENERATE $73 BILLION BY 2022
PUMP MARKET ESTIMATED TO REPRESENT INCREMENTAL OPPORTUNITY THROUGH 2024
MOBILE ROBOTS AND THE ALWAYS-ON SUPPLY CHAIN
INDUSTRIAL TECHNOLOGY
INDUSTRY UPDATE │ FALL 2016
Persistence Market Research
The global pump market is projected grow at a CAGR of 4.6% in terms of revenue and 4.2% in terms of sales volumebetween 2016 and 2024, according to a new report by Persistence Market Research. Key drivers of the growthinclude (1) Government regulations, (2) Pharmaceutical demand, (3) Growing need for water treatment andwastewater management, and (4) Oil and gas expansion.
The global pumps market is segmented into the five key regions of North America, Latin America, Europe, APAC andthe Middle East & Africa. The APAC region is estimated to dominate the global pumps market in terms of revenue with38.5% share by the end of 2016. Sales of pumps in the North America and Europe regions is estimated to collectivelyaccount for 48.8% share by the end of 2016.
Allied Market Research
A new report by Allied Market Research, titled, "Smart Material Market - Global Opportunity Analysis and IndustryForecast, 2015 - 2022," projects that the global smart material market is expected to generate revenue of $72.6 billionby 2022, with an estimated CAGR of 14.9% from 2016 to 2022. Smart materials are adaptive or intelligent material thatpose intrinsic and extrinsic capabilities that can be altered by external stimuli such as moisture, temperature,electromagnetic field, and pressure to obtain the desired functional effects. In addition, these materials are dynamicin nature and respond to their immediate interaction environments by adapting their characteristics.
Robotics Industries Association
The supply chain never sleeps – neither do robots. The 2016 MHI Annual Industry Report charts the emergence of the“digital, always-on supply chain.” Nearly 900 industry executives were surveyed. The study found that 51% ofrespondents consider robotics and automation a competitive advantage or disruptive technology. At the same time,58% see hiring and retaining a skilled workforce to implement these technologies as a major hurdle. Suppliers needreliable, cost-effective, plug-and-play solutions. A host of new robotics startups and established players are deliveringthe goods.
Read the full article here.
FULLY AUTONOMOUS ROBOTS: THE WAREHOUSE WORKERS OF THE NEAR FUTURE
Wall Street Journal
Symbotic, a robotics company owned by the CEO of grocer C&S Wholesale, is trying to upend the business of storingand shipping groceries. Until now, consumer-products retailers have found it hard to automate even simpleprocedures such as picking products off a rack and assembling odd-shaped containers on a pallet. Such tasks wereperformed by about 867,300 people in warehouses across the U.S. as of August 2016, according to the most recentLabor Department data. Food, in particular, has resisted robots. That attitude is shifting as rising labor and land coststhreaten profits. In addition, increased competition from Amazon and other technology firms that are overturninglongstanding practices.
Read the full article here.
PAGE |
M&A TRANSACTIONS
3
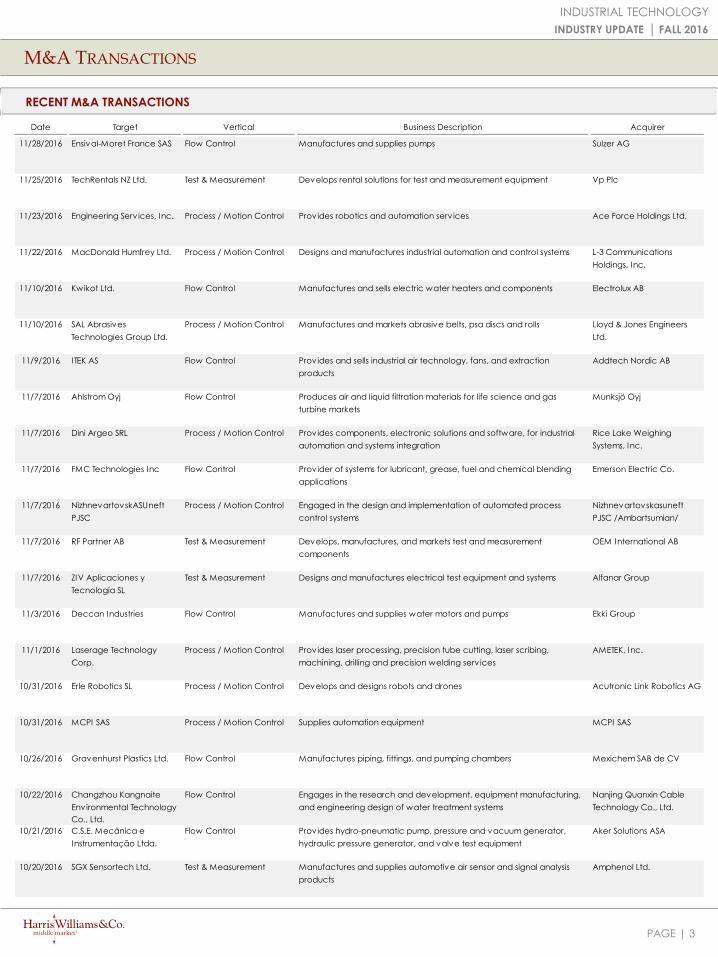
RECENT M&A TRANSACTIONS
INDUSTRIAL TECHNOLOGY
INDUSTRY UPDATE │ FALL 2016
Date Target Vertical Business Description Acquirer
11/28/2016 Ensival-Moret France SAS Flow Control Manufactures and supplies pumps Sulzer AG
11/25/2016 TechRentals NZ Ltd. Test & Measurement Develops rental solutions for test and measurement equipment Vp Plc
11/23/2016 Engineering Serv ices, Inc. Process / Motion Control Prov ides robotics and automation serv ices Ace Force Holdings Ltd.
11/22/2016 MacDonald Humfrey Ltd. Process / Motion Control Designs and manufactures industrial automation and control systems L-3 Communications
Holdings, Inc.
11/10/2016 Kwikot Ltd. Flow Control Manufactures and sells electric water heaters and components Electrolux AB
11/10/2016 SAL Abrasives
Technologies Group Ltd.
Process / Motion Control Manufactures and markets abrasive belts, psa discs and rolls Lloyd & Jones Engineers
Ltd.
11/9/2016 ITEK AS Flow Control Prov ides and sells industrial air technology, fans, and extraction
products
Addtech Nordic AB
11/7/2016 Ahlstrom Oyj Flow Control Produces air and liquid filtration materials for life science and gas
turbine markets
Munksjö Oyj
11/7/2016 Dini Argeo SRL Process / Motion Control Prov ides components, electronic solutions and software, for industrial
automation and systems integration
Rice Lake Weighing
Systems, Inc.
11/7/2016 FMC Technologies Inc Flow Control Prov ider of systems for lubricant, grease, fuel and chemical blending
applications
Emerson Electric Co.
11/7/2016 NizhnevartovskASUneft
PJSC
Process / Motion Control Engaged in the design and implementation of automated process
control systems
Nizhnevartovskasuneft
PJSC /Ambartsumian/
11/7/2016 RF Partner AB Test & Measurement Develops, manufactures, and markets test and measurement
components
OEM International AB
11/7/2016 ZIV Aplicaciones y
Tecnología SL
Test & Measurement Designs and manufactures electrical test equipment and systems Alfanar Group
11/3/2016 Deccan Industries Flow Control Manufactures and supplies water motors and pumps Ekki Group
11/1/2016 Laserage Technology
Corp.
Process / Motion Control Prov ides laser processing, precision tube cutting, laser scribing,
machining, drilling and precision welding serv ices
AMETEK, Inc.
10/31/2016 Erle Robotics SL Process / Motion Control Develops and designs robots and drones Acutronic Link Robotics AG
10/31/2016 MCPI SAS Process / Motion Control Supplies automation equipment MCPI SAS
10/26/2016 Gravenhurst Plastics Ltd. Flow Control Manufactures piping, fittings, and pumping chambers Mexichem SAB de CV
10/22/2016 Changzhou Kangnaite
Env ironmental Technology
Co., Ltd.
Flow Control Engages in the research and development, equipment manufacturing,
and engineering design of water treatment systems
Nanjing Quanxin Cable
Technology Co., Ltd.
10/21/2016 C.S.E. Mecânica e
Instrumentação Ltda.
Flow Control Prov ides hydro-pneumatic pump, pressure and vacuum generator,
hydraulic pressure generator, and valve test equipment
Aker Solutions ASA
10/20/2016 SGX Sensortech Ltd. Test & Measurement Manufactures and supplies automotive air sensor and signal analysis
products
Amphenol Ltd.

PAGE |
M&A TRANSACTIONS
4
INDUSTRIAL TECHNOLOGY
INDUSTRY UPDATE │ FALL 2016
RECENT M&A TRANSACTIONS (CONTINUED)
Date Target Vertical Business Description Acquirer
10/18/2016 Nordic Aerowash
Equipment AB
Process / Motion Control Manufactures automated washing robots B18 Invest I I I AB
10/13/2016 Storv ik Aqua AS Test & Measurement Prov ides measurement and control solutions to the aquaculture industry Fintecna SpA; Vard Group
AS
10/12/2016 Phenomenex, Inc. Process / Motion Control Develops, manufactures and distributes chromatography products Danaher Corp.
10/5/2016 Braas Co. Process / Motion Control Distributes industrial automation and control products Motion Industries, Inc.
10/3/2016 Fondmatic SpA Flow Control Manufactures valves and pumps for the plumbing industry Fonderie di Montorso SpA
10/3/2016 MAVERICK Technologies
Holdings LLC
Process / Motion Control Prov ides engineering, industrial automation, process control and
systems integration serv ices
Rockwell Automation, Inc.
10/3/2016 Permasense Ltd. Test & Measurement Develops, manufactures and supplies corrosion and erosion monitoring
systems
Emerson Electric Co.
9/30/2016 Jonic A/S Process / Motion Control Prov ides hydraulic tools, pumps, and accessories NPM Capital NV; Kramp
Groep BV
9/29/2016 Gansu Jinqiao Water
Technology
Flow Control Prov ides water purification serv ices Tianjin MOTIMO Membrane
Technology Co., Ltd.
9/28/2016 Zhejiang Qianjiang Robot
Co., Ltd.
Process / Motion Control Manufactures and sells industrial robots, and automation equipment
products
Zhejiang Aishida Electric
Co. Ltd.
9/20/2016 Mark Roberts Motion
Control Ltd.
Process / Motion Control Prov ides robotic motion control solutions Nikon Corp.
9/16/2016 Dixon Pumps, Inc. Flow Control Designs and manufactures water, oil and gas pumps Shaw Development LLC
9/15/2016 COURTOIS BRUNO SA Flow Control Designs and manufactures air purification equipment France Air SA
9/15/2016 PumpMan, Inc. Flow Control Prov ides pump system repairs and maintenance serv ices Soundcore Capital Partners
LLC
9/15/2016 R.M. Hoffman Co. Process / Motion Control Prov ides rotary and linear motion products Bearing Engineers, Inc.;
North Branch Capital LLC
9/14/2016 Fortiline LLC Flow Control Distributes underground water, sewer and storm utility products Advent International
Corp.; MORSCO, Inc.
9/12/2016 Applied-Cleveland
Holdings, Inc.
Test Serv ices Prov ides inspection serv ices First Reserve Management
LP
9/12/2016 Automation Control
Products
Process / Motion Control Prov ides factory automation products Rockwell Automation, Inc.
9/9/2016 Wescon Products Co. Process / Motion Control Manufactures valve control assemblies and systems Suprajit USA, Inc.
9/8/2016 RockPile Energy Serv ices
LLC
Flow Control Prov ides hydraulic pressure pumping serv ices Rockpile Newco LLC
9/8/2016 Selecto, Inc. Flow Control Manufactures water filtration products Axel Johnson, Inc.;
Kinetico, Inc.

PAGE |
M&A TRANSACTIONS
5
INDUSTRIAL TECHNOLOGY
INDUSTRY UPDATE │ FALL 2016
RECENT M&A TRANSACTIONS (CONTINUED)
Date Target Vertical Business Description Acquirer
9/7/2016 Texas Pneumatic Systems,
Inc.
Flow Control Prov ides aircraft fuel valve and pump repair serv ices JLL Partners, Inc.; Av iation
Technical Serv ices, Inc.
9/6/2016 Cepheid Test & Measurement Prov ides testing systems for the life sciences market Danaher Corp.
9/6/2016 Fox Thermal Instruments,
Inc.
Test & Measurement Manufactures gas flow meters and emission monitoring applications Harbour Group Industries,
Inc.; ONICON, Inc.
9/6/2016 Young & Franklin, Inc. Flow Control Manufactures gas control valves and actuators TransDigm Group, Inc.
9/1/2016 Agrometer A/S Flow Control Prov ides waste water pumps and irrigation machinery Erhvervsinvest
Management A/S
8/31/2016 Filtra-Systems Co., Inc. Flow Control Manufactures industrial water filtration systems The Chickasaw Nation;
Chickasaw Nation
Industries, Inc.
8/31/2016 GE Fuji Meter Co., Ltd. Test & Measurement Manufactures electric and smart meters Fuji Electric Co., Ltd.
8/31/2016 Seattle Metrics, Inc. Flow Control Designs, manufactures, and supplies flow metering equipment Harbour Group Industries,
Inc.; ONICON, Inc.
8/30/2016 Locus Solutions LLC
(Florida)
Test & Measurement Offers condition monitoring products Emerson Electric Co.
8/29/2016 Kuida Ag Supply Co. Flow Control Supplies irrigation equipments Water Tech Ag Supply
8/29/2016 Morrison Pump Co., Inc. Flow Control Designs and manufactures water pumps Patterson Pump Co.
8/29/2016 Morrison Pump Co., Inc. Flow Control Designs and manufactures water pumps Patterson Pump Co.
8/22/2016 Z-Wave Europe GmbH Process / Motion Control Prov ides wireless home automation controls BID Equity Advisory GmbH
8/18/2016 Pentair Plc /Valves &
Controls Div ision/
Flow Control Manufactures valves and controls Emerson Electric Co.
8/15/2016 Sensus USA, Inc. Test & Measurement Offers metering and related communications systems Xylem, Inc.
8/8/2016 Delta Ultrav iolet Corp. Flow Control Manufactures water filtration products AEA Investors ; Neptune-
Benson, Inc.
8/4/2016 HS Foils Oy Flow Control Prov ides air and water purification and disinfection devices AMETEK, Inc.
8/4/2016 Nu Instruments Ltd. Flow Control Prov ides water filtration systems AMETEK, Inc.

PAGE |
PUBLIC MARKETS OVERVIEW
6
INDUSTRIAL TECHNOLOGY
INDUSTRY UPDATE │ FALL 2016
TEV / LTM EBITDA TEV / 2016E EBITDA
NET DEBT / LTM EBITDA AVERAGE EBITDA MARGIN (2014 – 2016P)
AVERAGE CAPEX / REVENUE (2014 – 2016P) RESEARCH & DEVELOPMENT / LTM REVENUE
11.4x
10.9x
13.0x
12.2x
13.2x
13.7x
13.8x
11.9x
Engineering and Consulting
Testing, Inspection, and Certification
Automation and Robotics
Motion Control and Drives
Valves and Fittings
Pumps and Filtration
Condition Monitoring
Sensors and Instrumentation
10.2x
12.1x
11.7x
10.9x
12.4x
13.2x
13.5x
12.3x
Engineering and Consulting
Testing, Inspection, and Certification
Automation and Robotics
Motion Control and Drives
Valves and Fittings
Pumps and Filtration
Condition Monitoring
Sensors and Instrumentation
2.3x
1.8x
0.5x
1.7x
1.4x
1.6x
1.8x
1.4x
Engineering and Consulting
Testing, Inspection, and Certification
Automation and Robotics
Motion Control and Drives
Valves and Fittings
Pumps and Filtration
Condition Monitoring
Sensors and Instrumentation
8.4%
18.1%
15.7%
17.4%
14.8%
16.8%
20.0%
17.7%
Engineering and Consulting
Testing, Inspection, and Certification
Automation and Robotics
Motion Control and Drives
Valves and Fittings
Pumps and Filtration
Condition Monitoring
Sensors and Instrumentation
2.1%
4.7%
4.1%
3.2%
2.5%
3.4%
2.7%
3.6%
Engineering and Consulting
Testing, Inspection, and Certification
Automation and Robotics
Motion Control and Drives
Valves and Fittings
Pumps and Filtration
Condition Monitoring
Sensors and Instrumentation
0.3%
0.4%
4.1%
4.0%
1.4%
2.3%
3.1%
5.3%
Engineering and Consulting
Testing, Inspection, and Certification
Automation and Robotics
Motion Control and Drives
Valves and Fittings
Pumps and Filtration
Condition Monitoring
Sensors and Instrumentation
Test and Measurement Flow Control Process / Motion Control Test Serv ices

PAGE |
(1.0%)
(0.5%)
0.0%
0.5%
1.0%
1.5%
2.0%
2.5%
Q1
2014
Q2
2014
Q3
2014
Q4
2014
Q1
2015
Q2
2015
Q3
2015
Q4
2015
Q1
2016
Q2
2016
U.S. EU-28
98
100
102
104
106
108
U.S. EU-28
90
100
110
120
130
U.S. EU-28
90
100
110
120
130
U.S. EU-28
ECONOMIC UPDATE
7
INDUSTRIAL PRODUCTION
NEW ORDERS
ECONOMIC SENTIMENT
Billions of 2009 dollars
U.S. Real U.S. GDP increased by 0.4% in Q2 2016, after growing by 0.2% in Q1. Consumer spending, which generally accounts for nearly 70% of all U.S.
economic activity, was the main driver of GDP growth in the second quarter. While a decline in inventories weighed on second quarter growth,
expectations of increased output in the second half of the year are promising.
EU-28 EU-28 GDP rose by 0.4% in Q2 2016. Consumer confidence registered comparatively negligible gains while
services confidence was virtually unchanged.
Indexed to 2012
U.S. Industrial production decreased 0.2% in September. Capacity utilization for the industrial sector edged up 0.1% in September
EU-28 Industrial production decreased 0.7% in September, following a 1.6% increase
in August. September’s result reflected contractions in the production of capital,
intermediate and durable consumer goods.
Indexed to 2012
U.S. U.S. new orders increased by 0.2% in August, representing the second
consecutive month of rising new orders. Through the first eight months of 2016, new orders have grown by 1.8%.
EU-28 The EU-28 saw new orders increase by 4.7% in August, following a 6.6% decline
in July.
Indexed to 2012
U.S. U.S. economic sentiment increased 0.2% in September, following a 0.2%
decline in August. The Federal Reserve recently stated that near-term risks to the U.S. economic
outlook have “diminished.”
EU-28 Economic sentiment in the EU-28 increased by 1.7% in September after two
consecutive months of decline. Improved euro-area sentiment resulted from sharply increasing industry
confidence, as well as stronger retail trade and construction confidence.
INDUSTRIAL TECHNOLOGY
INDUSTRY UPDATE │ FALL 2016
GROSS DOMESTIC PRODUCT
Sep-16:
105.4
Sep-16:
104.2
Aug-16:
103.8
Sep-16:
124.4
Sep-16:
105.6
Aug-16:
120.0
Q2:
0.4%
Q2:
0.4%

PAGE |
HARRIS WILLIAMS & CO. OFFICE LOCATIONS
UNITED STATES EUROPE
BostonTwo International Place24th FloorBoston, Massachusetts 02110Phone: +1 (617) 482-7501
Cleveland1900 East 9th Street20th FloorCleveland, Ohio 44114Phone: +1 (216) 689-2400
Minneapolis222 South 9th StreetSuite 3350Minneapolis, Minnesota 55402Phone: +1 (612) 359-2700
Richmond (Headquarters)1001 Haxall Point9th FloorRichmond, Virginia 23219Phone: +1 (804) 648-0072
San Francisco575 Market Street31st FloorSan Francisco, California 94105Phone: +1 (415) 288-4260
Washington DC800 17th Street NW2nd FloorWashington, DC 20006Phone: +1 (202) 207-2300
FrankfurtBockenheimer Landstrasse 33-3560325 FrankfurtGermanyPhone: +49 069 3650638 00
London63 Brook StreetLondon W1K 4HS, EnglandPhone: +44 (0) 20 7518 8900
NETWORK OFFICES
Beijing
Hong Kong
Mumbai
New Delhi
Shanghai
Energy, Power& Infrastructure
IndustrialsHealthcare & Life Sciences
Transportation & Logistics
Aerospace, Defense & Government
Services
Business Services
Building Products & Materials
Technology, Media & Telecom
Specialty Distribution
Consumer
Industrials
Industrial Technology
Harris Williams & Co. has a broad range of industry expertise, which creates powerful opportunities.Our clients benefit from our deep-sector experience, integrated industry intelligence andcollaboration across the firm, and our commitment to learning what makes them unique. For moreinformation, visit our website at www.harriswilliams.com/industries.
OUR FIRM
INDUSTRIAL TECHNOLOGY
INDUSTRY UPDATE │ FALL 2016
8

PAGE |
PUBLIC COMPARABLES
9
INDUSTRIAL TECHNOLOGY
INDUSTRY UPDATE │ FALL 2016
TEST AND MEASUREMENT
As of November 30, 2016 ($ in Millions, except per share amounts)
Test and Measurement Public Comparables
TEV /
LTM Margins Current 1-Month 1-Year % of LTM
EBITDA Gross TEV Price Change Change LTM High EBITDA
Sensors and Instrumentation
Honeywell International Inc. 21.3% 36.6% $97,380 $113.34 3.2% 9.0% 94.4% 11.6x
Danaher Corporation 23.7% 54.4% $62,907 $79.13 1.2% (17.9%) 77.0% 14.6x
AMETEK, Inc. 26.5% 37.1% $12,409 $45.98 4.2% (18.6%) 80.7% 12.2x
Sensata Technologies Holding NV 26.5% 28.0% $9,346 $36.99 2.8% (19.3%) 78.9% 11.3x
Meggitt PLC 24.3% 34.2% $6,342 $5.90 11.5% 1.0% 90.5% 10.1x
Teledyne Technologies Incorporated 16.0% 38.4% $4,911 $124.06 16.7% 34.1% 98.5% 14.0x
FLIR Systems, Inc. 21.7% 46.7% $4,701 $35.25 7.8% 15.3% 98.0% 13.4x
National Instruments Corporation 15.7% 74.0% $3,543 $30.00 8.5% (4.5%) 94.6% 18.3x
Spectris plc 17.1% 54.1% $3,149 $25.24 0.3% (5.8%) 91.1% 10.3x
I tron, Inc. 17.0% 39.4% $2,719 $65.55 22.4% 82.3% 99.7% 7.3x
ESCO Technologies Inc. 17.7% 36.6% $1,503 $55.70 27.9% 42.0% 97.4% 14.9x
Badger Meter, Inc. 18.5% 38.2% $1,097 $36.40 14.8% 19.7% 92.5% 14.9x
JENOPTIK AG 14.4% 33.0% $979 $16.83 (1.7%) 7.0% 89.2% 9.2x
MTS Systems Corporation 10.5% 36.1% $664 $54.50 18.1% (14.3%) 84.3% 10.9x
Oxford Instruments plc 15.9% 40.2% $629 $7.79 (9.0%) (21.5%) 66.0% 7.5x
First Sensor AG 6.5% 12.0% $188 $14.86 (2.9%) 18.1% 91.8% 18.8x
Median 17.4% 37.7% 6.0% 4.0% 91.5% 11.9x
Mean 18.3% 39.9% 7.9% 7.9% 89.0% 12.5x
Condition Monitoring
Hexagon AB 29.8% 54.7% $14,254 $34.34 (11.5%) (5.4%) 77.6% 13.8x
Team, Inc. 6.2% 27.0% $1,364 $34.50 9.2% (9.6%) 87.3% 18.6x
Mistras Group, Inc. 11.3% 27.0% $766 $22.90 8.8% 6.4% 86.5% 9.6x
Median 11.3% 27.0% 8.8% (5.4%) 86.5% 13.8x
Mean 15.8% 36.2% 2.2% (2.9%) 83.8% 14.0x
Overall Median 17.1% 37.1% 7.8% 1.0% 90.5% 12.2x
Overall Mean 17.9% 39.4% 7.0% 6.2% 88.2% 12.7x
Stock Performance
PAGE |
PUBLIC COMPARABLES
10
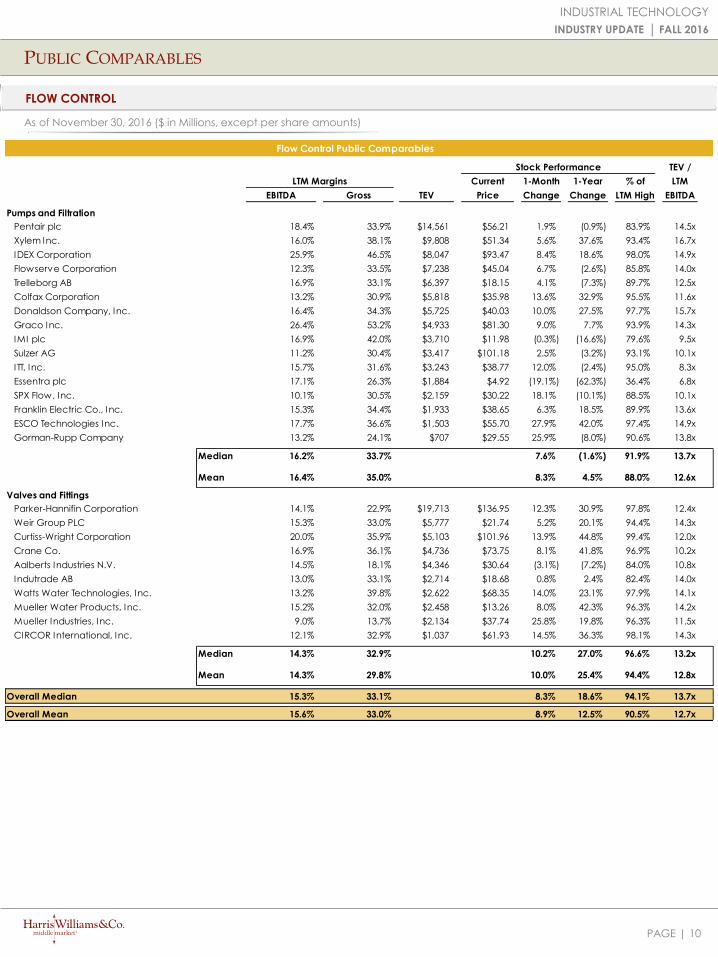
FLOW CONTROL
INDUSTRIAL TECHNOLOGY
INDUSTRY UPDATE │ FALL 2016
As of November 30, 2016 ($ in Millions, except per share amounts)
Flow Control Public Comparables
TEV /
LTM Margins Current 1-Month 1-Year % of LTM
EBITDA Gross TEV Price Change Change LTM High EBITDA
Pumps and Filtration
Pentair plc 18.4% 33.9% $14,561 $56.21 1.9% (0.9%) 83.9% 14.5x
Xylem Inc. 16.0% 38.1% $9,808 $51.34 5.6% 37.6% 93.4% 16.7x
IDEX Corporation 25.9% 46.5% $8,047 $93.47 8.4% 18.6% 98.0% 14.9x
Flowserve Corporation 12.3% 33.5% $7,238 $45.04 6.7% (2.6%) 85.8% 14.0x
Trelleborg AB 16.9% 33.1% $6,397 $18.15 4.1% (7.3%) 89.7% 12.5x
Colfax Corporation 13.2% 30.9% $5,818 $35.98 13.6% 32.9% 95.5% 11.6x
Donaldson Company, Inc. 16.4% 34.3% $5,725 $40.03 10.0% 27.5% 97.7% 15.7x
Graco Inc. 26.4% 53.2% $4,933 $81.30 9.0% 7.7% 93.9% 14.3x
IMI plc 16.9% 42.0% $3,710 $11.98 (0.3%) (16.6%) 79.6% 9.5x
Sulzer AG 11.2% 30.4% $3,417 $101.18 2.5% (3.2%) 93.1% 10.1x
ITT, Inc. 15.7% 31.6% $3,243 $38.77 12.0% (2.4%) 95.0% 8.3x
Essentra plc 17.1% 26.3% $1,884 $4.92 (19.1%) (62.3%) 36.4% 6.8x
SPX Flow, Inc. 10.1% 30.5% $2,159 $30.22 18.1% (10.1%) 88.5% 10.1x
Franklin Electric Co., Inc. 15.3% 34.4% $1,933 $38.65 6.3% 18.5% 89.9% 13.6x
ESCO Technologies Inc. 17.7% 36.6% $1,503 $55.70 27.9% 42.0% 97.4% 14.9x
Gorman-Rupp Company 13.2% 24.1% $707 $29.55 25.9% (8.0%) 90.6% 13.8x
Median 16.2% 33.7% 7.6% (1.6%) 91.9% 13.7x
Mean 16.4% 35.0% 8.3% 4.5% 88.0% 12.6x
Valves and Fittings
Parker-Hannifin Corporation 14.1% 22.9% $19,713 $136.95 12.3% 30.9% 97.8% 12.4x
Weir Group PLC 15.3% 33.0% $5,777 $21.74 5.2% 20.1% 94.4% 14.3x
Curtiss-Wright Corporation 20.0% 35.9% $5,103 $101.96 13.9% 44.8% 99.4% 12.0x
Crane Co. 16.9% 36.1% $4,736 $73.75 8.1% 41.8% 96.9% 10.2x
Aalberts Industries N.V. 14.5% 18.1% $4,346 $30.64 (3.1%) (7.2%) 84.0% 10.8x
Indutrade AB 13.0% 33.1% $2,714 $18.68 0.8% 2.4% 82.4% 14.0x
Watts Water Technologies, Inc. 13.2% 39.8% $2,622 $68.35 14.0% 23.1% 97.9% 14.1x
Mueller Water Products, Inc. 15.2% 32.0% $2,458 $13.26 8.0% 42.3% 96.3% 14.2x
Mueller Industries, Inc. 9.0% 13.7% $2,134 $37.74 25.8% 19.8% 96.3% 11.5x
CIRCOR International, Inc. 12.1% 32.9% $1,037 $61.93 14.5% 36.3% 98.1% 14.3x
Median 14.3% 32.9% 10.2% 27.0% 96.6% 13.2x
Mean 14.3% 29.8% 10.0% 25.4% 94.4% 12.8x
Overall Median 15.3% 33.1% 8.3% 18.6% 94.1% 13.7x
Overall Mean 15.6% 33.0% 8.9% 12.5% 90.5% 12.7x
Stock Performance

PAGE |
PUBLIC COMPARABLES
11
PROCESS AUTOMATION
INDUSTRIAL TECHNOLOGY
INDUSTRY UPDATE │ FALL 2016
As of November 30, 2016 ($ in Millions, except per share amounts)
Process / Motion Control Public Comparables
TEV /
LTM Margins Current 1-Month 1-Year % of LTM
EBITDA Gross TEV Price Change Change LTM High EBITDA
Automation and Robotics
ABB Ltd. 14.1% 29.8% $46,453 $20.39 (0.9%) 7.5% 88.9% 9.8x
Fanuc Corporation 35.4% 45.8% $25,703 $172.02 (7.2%) (3.3%) 89.6% 15.2x
Rockwell Automation, Inc. 19.7% 47.1% $16,754 $131.34 10.6% 23.4% 98.2% 14.4x
Metso Oyj 12.6% 28.5% $4,286 $6.98 5.2% 12.4% 94.2% 11.6x
KUKA Aktiengesellschaft 7.6% 24.7% $3,625 $93.76 12.2% 5.8% 76.1% 15.3x
Krones AG 8.3% 31.2% $2,760 $91.52 (10.3%) (24.8%) 72.0% 9.1x
Automation Tooling Systems Inc. 11.3% 21.6% $819 $8.04 (9.2%) (16.4%) 83.1% 9.3x
FARO Technologies, Inc. 9.2% 50.7% $461 $36.80 9.2% 22.3% 96.8% 15.3x
Median 11.9% 30.5% 2.1% 6.6% 89.2% 13.0x
Mean 14.8% 34.9% 1.2% 3.4% 87.4% 12.5x
Motion and Drives
Siemens AG 12.8% 29.9% $114,544 $112.67 (0.4%) 8.7% 92.1% 10.1x
Danaher Corporation 23.7% 54.4% $62,907 $79.13 1.2% (17.9%) 77.0% 14.6x
ABB Ltd. 14.1% 29.8% $46,453 $20.39 (0.9%) 7.5% 88.9% 9.8x
Schneider Electric SE 16.9% 35.9% $45,208 $66.00 (1.2%) 4.2% 92.3% 9.4x
Nidec Corporation 17.0% 23.6% $26,617 $90.57 (6.9%) 17.3% 92.0% 15.1x
Rockwell Automation, Inc. 19.7% 47.1% $16,754 $131.34 10.6% 23.4% 98.2% 14.4x
AMETEK Inc. 26.5% 37.1% $12,409 $45.98 4.2% (18.6%) 80.7% 12.2x
Yaskawa Electric Corporation 11.7% 30.1% $4,224 $15.57 (1.3%) 18.1% 95.7% 10.3x
Rexnord Corporation 16.1% 31.9% $3,832 $21.20 7.9% 3.8% 92.3% 12.4x
Median 16.9% 31.9% (0.4%) 7.5% 92.1% 12.2x
Mean 17.8% 36.0% 0.6% 5.3% 89.6% 12.0x
Overall Median 14.1% 31.2% (0.4%) 7.5% 92.0% 12.2x
Overall Mean 16.3% 35.2% 1.3% 4.3% 88.7% 12.3x
Stock Performance

PAGE |
PUBLIC COMPARABLES
12
TEST SERVICES
INDUSTRIAL TECHNOLOGY
INDUSTRY UPDATE │ FALL 2016
As of November 30, 2016 ($ in Millions, except per share amounts)
Test Services
TEV /
LTM Margins Current 1-Month 1-Year % of LTM
EBITDA Gross TEV Price Change Change LTM High EBITDA
Testing, Inspection, and Certification
SGS SA 25.1% 38.9% $15,753 $1,995.07 (1.4%) 4.2% 84.7% 10.5x
Bureau Veritas SA 18.6% 15.8% $10,625 $18.69 (0.9%) (9.3%) 77.5% 11.3x
Eurofins Scientific 18.7% 12.3% $9,132 $456.64 1.8% 21.4% 97.2% 19.0x
Intertek Group plc 19.5% 15.1% $7,843 $40.65 (2.6%) (4.5%) 82.6% 11.7x
ALS Ltd. 17.5% 29.4% $2,630 $4.52 (2.2%) 68.3% 91.7% 15.4x
APPLUS S.A. 11.4% 28.1% $2,002 $9.50 0.9% 2.5% 86.7% 9.7x
SAI Global Limited 21.3% 27.9% $902 $3.53 (0.0%) 15.2% 96.7% 10.2x
Mistras Group, Inc. 11.3% 27.0% $766 $22.90 8.8% 6.4% 86.5% 9.6x
Median 18.6% 27.4% (0.5%) 5.3% 86.6% 10.9x
Mean 17.9% 24.3% 0.5% 13.0% 87.9% 12.2x
Engineering and Consulting
Abengoa S.A. Class A -7.9% -56.2% $11,333 $0.53 (10.9%) (31.8%) 34.5% NM
FCC, S.A. 9.6% 25.1% $8,224 $8.20 (5.7%) 21.7% 78.5% 12.5x
Jacobs Engineering Group Inc. 6.0% 16.1% $7,295 $61.72 20.8% 39.8% 98.6% 11.1x
WSP Global Inc. 7.7% 16.1% $4,173 $34.61 6.1% 2.3% 95.8% 11.6x
Amec Foster Wheeler plc 6.3% 9.4% $3,403 $5.10 (7.1%) (22.2%) 64.1% 6.4x
Tetra Tech, Inc. 8.3% 12.7% $2,714 $42.90 11.7% 54.4% 96.8% 12.7x
Arcadis NV 7.6% 15.5% $1,625 $11.56 (13.3%) (52.1%) 46.5% 5.7x
Median 7.6% 15.5% (5.7%) 2.3% 78.5% 11.4x
Mean 5.4% 5.5% 0.2% 1.7% 73.6% 10.0x
Overall Median 11.3% 16.1% (0.9%) 4.2% 86.5% 11.2x
Overall Mean 12.1% 15.5% 0.4% 7.8% 81.2% 11.3x
Stock Performance

PAGE |
HARRIS WILLIAMS & CO.
Automation World
Automation.com
Bloomberg
Eurostat
FactSet
Flow Control Magazine
IHS
13
SOURCES
INDUSTRIAL TECHNOLOGY
INDUSTRY UPDATE │ FALL 2016
Harris Williams & Co. (www.harriswilliams.com) is a preeminent middle market investment bank focused on the advisory needs of clients worldwide. The firm has deep industry knowledge, global transaction expertise, and an unwavering commitment to excellence. Harris Williams & Co. provides sell-side and acquisition advisory, restructuring advisory, board advisory, private placements, and capital markets advisory services.
Investment banking services are provided by Harris Williams LLC, a registered broker-dealer and member of FINRA and SIPC, and Harris Williams & Co. Ltd, which is authorized and regulated by the Financial Conduct Authority. Harris Williams & Co. is a trade name under which Harris Williams LLC and Harris Williams & Co. Ltd conduct business.
THIS REPORT MAY CONTAIN REFERENCES TO REGISTERED TRADEMARKS, SERVICE MARKS AND COPYRIGHTS OWNED BY THIRD-PARTY INFORMATION PROVIDERS. NONE OF THE THIRD-PARTY INFORMATION PROVIDERS IS ENDORSING THE OFFERING OF, AND SHALL NOT IN ANY WAY BE DEEMED AN ISSUER OR UNDERWRITER OF, THE SECURITIES, FINANCIAL INSTRUMENTS OR OTHER INVESTMENTS DISCUSSED IN THIS REPORT, AND SHALL NOT HAVE ANY LIABILITY OR RESPONSIBILITY FOR ANY STATEMENTS MADE IN THE REPORT OR FOR ANY FINANCIAL STATEMENTS, FINANCIAL PROJECTIONS OR OTHER FINANCIAL INFORMATION CONTAINED OR ATTACHED AS AN EXHIBIT TO THE REPORT. FOR MORE INFORMATION ABOUT THE MATERIALS PROVIDED BY SUCH THIRD PARTIES, PLEASE CONTACT US AT THE ABOVE ADDRESSES OR NUMBERS.
The information and views contained in this report were prepared by Harris Williams & Co. (“Harris Williams”). It is not a research report, as such term is defined by applicable law and regulations, and is provided for informational purposes only. It is not to be construed as an offer to buy or sell or a solicitation of an offer to buy or sell any financial instruments or to participate in any particular trading strategy. The information contained herein is believed by Harris Williams to be reliable, but Harris Williams makes no representation as to the accuracy or completeness of such information. Harris Williams and/or its affiliates may be market makers or specialists in, act as advisers or lenders to, have positions in and effect transactions in securities of companies mentioned herein and also may provide, may have provided, or may seek to provide investment banking services for those companies. In addition, Harris Williams and/or its affiliates or their respective officers, directors and employees may hold long or short positions in the securities, options thereon or other related financial products of companies discussed herein. Opinions, estimates and projections in this report constitute Harris Williams’ judgment and are subject to change without notice. The financial instruments discussed in this report may not be suitable for all investors, and investors must make their own investment decisions using their own independent advisors as they believe necessary and based upon their specific financial situations and investment objectives. Also, past performance is not necessarily indicative of future results. No part of this material may be copied or duplicated in any form or by any means, or redistributed, without Harris Williams’ prior written consent.
Copyright© 2016 Harris Williams & Co., all rights reserved.
DISCLOSURES
Mergermarket
PitchBook
PNC Economic Outlook
S&P Leveraged Commentary & Data
Sensors Magazine
The Association for Manufacturing Technology
Thomson Reuters