industry update october 2015 - harris williams
TRANSCRIPT

www.harriswilliams.com
Investment banking services are provided by Harris Williams LLC, a registered broker-dealer and member of FINRA and SIPC, and Harris Williams & Co. Ltd, which is authorised andregulated by the Financial Conduct Authority. Harris Williams & Co. is a trade name under which Harris Williams LLC and Harris Williams & Co. Ltd conduct business.
FOOD AND BEVERAGE
INDUSTRY UPDATE │ OCTOBER 2015

PAGE |
www.harriswilliams.com
WHAT WE’RE SEEING
1
CONTENTS INDUSTRY VITAL SIGNS EQUITY MARKET OVERVIEW M&A MARKET OVERVIEW DEBT MARKET OVERVIEW RECENT M&A ACTIVITY PUBLIC COMPARABLES EARNINGS CALENDAR
GROUP OVERVIEWHarris Williams & Co. is a leading advisor to the food and beverage market. Our significant experience covers a broad range of end markets, industries, and business models. This particular report focuses on trends and metrics in the following areas: Agribusiness Baked and Prepared Goods Beverages Branded and Private Label Dairy Distribution Ingredients Meat and Protein Natural and Organic Processing Produce Restaurant and Retail Snacks
CONTACTSGlenn GurtcheffManaging [email protected]+1 (612) 359-2702Tim AlexanderManaging [email protected]+1 (612) 359-2716Ryan [email protected]+1 (415) 217-3409Brant [email protected]+1 (612) 359-2709Ryan FreemanVice [email protected]+1 (612) 359-2703Andy WarczakVice [email protected]+1 (612) 359-2714
MARKET UPDATE
FOOD AND BEVERAGE INDUSTRY UPDATE │ OCTOBER 2015
CLOSED HW&CO. TRANSACTIONS
WHAT WE’VE BEEN DOING
a portfolio company of
has been acquired by
a portfolio company of
has been acquired by
and
a portfolio company of
has been acquired by
has been acquired by
has divested selected assets to
and
has acquired
a portfolio company of
has been acquired byhas been acquired by
a portfolio company of
has been acquired by
has been acquired by
a portfolio company of
A Private Investor Group
has been acquired by
Food & Beverage companies have been active participants in the M&A markets in 2015 with nearly 400 announced and completed transactions year-to-date.* HW&Co. anticipates an active marketplace for the remainder of the year as both strategic and financial buyers have a strong willingness to pay for platforms with unique growth potential. Strategic buyers continue to leverage the strength of their balance sheets to pursue growth-oriented acquisitions, as illustrated by a series of transactions over the last few weeks, including Treasury Wine Estates’ acquisition of Diageo’s U.S. and U.K. wine assets, Clearwater Seafood’s acquisition of Macduff Shellfish and Bunge America’s acquisition of Whole Harvest Foods. Additionally, SABMiller agreed to preliminary terms to be bought out by rival brewer AB InBev in what would be the largest LBO ever.
a portfolio company of
has been acquired by
* 2015 M&A transactions include European and cross-border transactions.

PAGE |
WHAT WE’RE READING
2
FOOD AND BEVERAGEINDUSTRY UPDATE │ OCTOBER 2015
VITAL SIGNS
COMMODITY PRICE INDICES1
PROTEIN PRICE INDICES2,3
40
60
80
100
120
140
Sep-11 Mar-12 Sep-12 Mar-13 Sep-13 Mar-14 Sep-14 Mar-15 Sep-15
Com
mod
ity P
rice
Inde
x
Corn Soybeans Wheat Crude Oil
90
100
110
120
130
140
150
Aug-11 Feb-12 Aug-12 Feb-13 Aug-13 Feb-14 Aug-14 Feb-15 Aug-15
Prot
ein
Pric
e In
dex
Beef Pork Poultry
Beef:34.6%
Pork:7.6%
Poultry:4.0%
Soybeans:(34.1%)
Corn:(44.0%)
Wheat:(45.2%)
Crude Oil:(54.1%)
Starbucks recently announced that they plan to offer only cage-free eggs in North America by 2020. This follows suitwith other quick service concepts such as McDonalds and Burger King who are working toward achieving similargoals. Starbucks’ program is being hailed by the Humane Society of the United States as “The most comprehensiveanimal welfare policy of any restaurant chain.” This also reflects a growing demand amongst consumers to beprovided more ethically prepared food and has driven concerns amongst other livestock producers.
Access to the full article here.
STARBUCKS TO MOVE TOWARD CAGE-FREE EGGS
After multiple offers by AB InBev, SABMiller’s board finally agreed to accept the most recent offer of £44 per share,which now marks a ~50% premium to SABMiller’s share price prior to deal speculation. The deal is expected to facerigorous antitrust scrutiny and will need regulatory approval in order to be completed. Regulators will likely requiredivestitures in the U.S., China, and Latin America prior to granting approval for the deal. AB InBev currently controls45% of the U.S. beer market with SABMiller controlling a further 25% through MillerCoors.
Access to the full article here.
SABMILLER BOARD ACCEPTS KEY TERMS OF OFFER BY AB INBEV
General Mills announced it is recalling 1.8 million boxes of gluten-free Cheerios after consumers with gluten allergiesreported adverse reactions upon consumption, prompting General Mills to suspect that the cereal might includewheat. General Mills has been offering more gluten-free products and working to remove artificial colors and flavorsacross its brand portfolio. These efforts are designed to address recent sales declines at General Mills and respond togrowing demand for natural and healthy foods among its customer base. The recall has also highlighted worries of thegluten-free community regarding reliance on labeling laws.Access to the full article here.
GENERAL MILLS RECALLS 1.8 MILLION BOXES OF GLUTEN-FREE CHEERIOS

PAGE |
VITAL SIGNS
3
FOOD AND BEVERAGEINDUSTRY UPDATE │ OCTOBER 2015
RESTAURANT AND GROCERY STORE SALES INDICES4
CONSUMER FOOD PRICE INDEX INFLATION2
PUBLIC EQUITY MARKET OVERVIEW
KEY TRADING STATISTICS5
(0.5)
1.0
2.5
4.0
5.5
Aug-11 Feb-12 Aug-12 Feb-13 Aug-13 Feb-14 Aug-14 Feb-15 Aug-15
Infla
tion
(%)
80
100
120
140
Aug-11 Feb-12 Aug-12 Feb-13 Aug-13 Feb-14 Aug-14 Feb-15 Aug-15
Sale
s In
dex
Restaurant Grocery
Restaurant:25.9%
Grocery:9.8%
Net Debt /
Industry and Segment 3 Month 1 Year 3 Month 1 Year Fwd PE LTM PE EV/EBITDA EBITDA
Protein Processing (2.0%) 17.8% 2.7% 7.0% 11.5x 13.0x 8.3x 5.6xFruit and Vegetable 1.2% 18.7% (7.6%) (1.3%) 16.2x 20.5x 10.9x 1.0xIngredients / Flavors 0.6% 24.7% (2.5%) 8.1% 20.2x 26.5x 14.2x 1.7xAgribusiness (15.8%) (16.7%) 2.8% (20.5%) 12.5x 14.2x 8.6x 1.8xBranded Processed Foods 8.7% 22.5% 5.2% 17.4% 21.3x 30.9x 13.8x 2.6xPrivate Label Foods and Beverages 5.6% (0.6%) (16.1%) (2.7%) 33.0x 35.2x 12.4x 5.5xNatural / Organic Foods / BFY (14.8%) (7.7%) (9.2%) (7.8%) 25.7x 54.8x 19.8x 3.7xBaked Goods 6.7% 18.8% 15.5% 24.2% 24.8x 36.3x 14.8x 4.4xDairy (1.2%) 7.5% (19.0%) (11.3%) 20.1x 24.7x 9.7x 2.0xNon-Alcoholic Beverages 5.3% 27.4% 3.4% 23.5% 20.5x 23.7x 13.0x 1.8xAlcoholic Beverages 1.7% 14.7% (5.9%) 8.0% 21.7x 24.2x 12.6x 2.9xSnacks 3.3% 20.9% 1.4% 12.0% 25.2x 30.9x 14.4x 2.2xGrocery Distribution (3.2%) (0.3%) (11.3%) (11.6%) 18.9x 17.2x 8.9x 2.0xFood Retail (0.6%) 10.6% (6.8%) 7.4% 18.4x 20.3x 6.8x 2.0xFoodserv ice (5.1%) (9.7%) 13.0% 8.0% 20.8x 31.2x 11.3x 6.5xQuick Serv ice Restaurant (10.8%) 12.7% (9.9%) 4.8% 21.9x 28.4x 12.3x 2.5xFast Casual (10.3%) 1.6% (16.6%) (24.6%) 38.7x 30.4x 12.2x 0.7xDifferentiated Casual 1.6% 21.1% (1.3%) (13.1%) 29.4x 39.1x 11.4x 2.0xCasual Dining Restaurant (7.8%) 15.5% (11.0%) (9.3%) 19.9x 29.1x 9.1x 2.1xFine Dining (22.4%) 8.0% (15.3%) (8.5%) 16.4x 19.1x 9.9x 2.8xPizza (9.3%) 60.6% (15.0%) 8.8% 27.4x 36.8x 17.3x 3.7xBeverage / Snack Retail (15.7%) 6.6% (22.7%) (8.6%) 33.3x 31.3x 18.8x 2.9xFamily Restaurant (4.0%) 38.8% (12.9%) 18.0% 24.1x 21.2x 10.9x 2.4x
Overall Median (2.2%) 13.5% (6.9%) 5.4% 21.3x 26.1x 12.2x 2.2x
Stock Price % Change EV/EBITDA % Change Current Valuation Stats
Inpu
tsFo
od a
nd B
ever
age
Con
sum
er a
nd R
etai
l

PAGE |
Close Date Filing Date Issuer Ticker Transaction TypeGross Proceeds
($mm) Use of Funds10/06/15 10/06/15 Spot Coffee (Canada) Ltd SPP Follow-On $1.6 General Corp. Purp.
Reduce Indebtedness10/01/15 09/09/15 Performance Food Group Co PFGC IPO $275.5 General Corp. Purp.
09/24/15 09/15/15 SunOpta Inc STKL Follow-On $100.0 Acquisition Fin.Reduce Indebtedness
09/21/15 09/21/15 The JM Smucker Co SJM Follow-On $964.9 Secondary
08/17/15 08/17/15 Aramark ARMK Follow-On $729.1 SecondaryPay Fees & Expenses
08/12/15 03/10/14 Post Holdings Inc POST Follow-On $351.0 Reduce Indebtedness
08/12/15 07/20/15 Shake Shack Inc SHAK Follow-On $240.0 SecondaryPay Fees & Expenses
08/07/15 06/26/15 Captiva Verde Industries Ltd VEG Follow-On $2.5 General Corp. Purp.
08/04/15 06/26/15 Amplify Snack Brands Inc BETR IPO $270.0 Liquidity for Private Owners
07/09/15 07/09/15 The JM Smucker Co SJM Follow-On $533.8 Secondary
07/06/15 07/06/15 Ten Peaks Coffee Co Inc TPK Follow-On $13.9 ConstructionWorking Capital
07/02/15 07/02/15 Del Taco Restaurants Inc TACO Follow-On $548.5 Secondary
07/01/15 06/26/15 Captiva Verde Industries Ltd VEG Follow-On $0.1 General Corp. Purp.
PUBLIC EQUITY MARKET OVERVIEW
4
FOOD AND BEVERAGEINDUSTRY UPDATE │ OCTOBER 2015
PUBLIC COMPANY SECTOR PERFORMANCE (ONE YEAR CHANGE IN STOCK PRICE)5
RECENT EQUITY OFFERINGS6
AgribusinessFoodserv ice
Natural / Organic / BFYDairy
Priv ate LabelGrocery Distribution
Fast CasualBaked Goods
Alcoholic Bev eragesBev erage / Snack Retail
Fine DiningNon-Alcoholic Bev eragesFood Retail
S&PQuick Serv ice RestaurantProtein Processing
Casual Dining RestaurantFruit and Vegetable
Family RestaurantIngredients / Flav ors
SnacksDifferentiated Casual
Branded Processed FoodsPizza
(30.0%) (15.0%) 0.0% 15.0% 30.0% 45.0% 60.0% 75.0% 90.0%Inputs Food and Beverage Consumer and Retail

PAGE |
Price at As a % of Market Cash & Enterprise P/E
($ in millions, except per share data) Ticker 10/9/15 52-wk High Cap Debt Equiv. Value (EV) Revenue EBITDA 1 Year 3 Years Gross EBITDA Multiple Revenue EBITDA Revenue EBITDA
Food and Beverage
Branded Processed Foods
Associated British Foods plc ABF $51.19 96.8% $40,271 $1,675 $437 $41,508 $20,062 $2,399 (9.2%) 2.9% 24.0% 12.0% 46.8x 2.07x 17.3x 2.02x 17.6x
B&G Foods Inc. BGS 36.91 97.7% 2,140 984 99 3,026 858 184 8.0% 13.4% 29.6% 21.5% 44.6x 3.53x 16.4x 2.57x 11.9x
Campbell Soup Company CPB 51.28 97.9% 15,885 4,103 253 19,735 8,082 1,528 (2.2%) 4.0% 34.7% 18.9% 23.2x 2.44x 12.9x 2.43x 12.4x
ConAgra Foods, Inc. CAG 41.76 91.8% 18,078 7,870 114 25,834 15,863 2,205 6.5% 5.4% 21.8% 13.9% NM 1.63x 11.7x 2.17x 13.4x
General Mills, Inc. GIS 56.61 94.6% 33,835 9,434 451 42,818 17,570 3,446 (1.3%) 1.4% 35.1% 19.6% 26.8x 2.44x 12.4x 2.51x 12.5x
Hormel Foods Corporation HRL 65.42 99.6% 17,305 600 349 17,556 9,407 1,177 3.4% 4.8% 18.6% 12.5% 26.4x 1.87x 14.9x 1.82x 14.0x
Kellogg Company K 69.44 99.2% 24,553 7,507 294 31,766 14,207 1,641 (3.0%) 2.4% 34.2% 11.6% 65.9x 2.24x 19.4x 2.32x 12.6x
McCormick & Company, Incorporated MKC 83.02 97.3% 10,631 1,492 112 12,011 4,268 687 0.7% 2.4% 40.4% 16.1% 26.9x 2.81x 17.5x 2.72x 15.7x
Nestlé S.A. NESN 77.31 96.5% 246,526 24,371 5,052 265,845 97,991 18,659 (3.6%) 2.7% 49.0% 19.0% 16.5x 2.71x 14.2x 2.76x 14.5x
Post Holdings, Inc. POST 60.49 84.9% 3,672 4,610 274 8,007 4,382 599 NM 66.5% 25.0% 13.7% NM 1.83x 13.4x 1.52x 10.3x
The Hershey Company HSY 96.56 86.7% 21,184 2,414 402 23,196 7,488 1,664 3.1% 5.7% 45.2% 22.2% 37.6x 3.10x 13.9x 3.03x 13.1x
The J. M. Smucker Company SJM 118.09 97.9% 14,131 5,997 134 19,995 6,321 1,288 13.2% 3.5% 36.0% 20.4% 35.0x 3.16x 15.5x 2.50x 11.8x
Mean 1.4% 9.6% 32.8% 16.8% 35.0x 2.49x 15.0x 2.36x 13.3x
Median 0.7% 3.8% 34.4% 17.5% 30.9x 2.44x 14.6x 2.47x 12.8x
Private Label Foods and Beverages
Cott Corporation TSX:BCB $10.70 88.6% $1,173 $1,752 $79 $2,846 $2,568 $264 25.3% 3.6% 22.7% 10.3% 64.4x 1.11x 10.8x 0.94x 7.8x
Seneca Foods Corp. SENE.A 27.95 88.4% 286 238 8 516 1,273 41 (5.6%) 1.1% 6.8% 3.3% 23.1x 0.41x 12.4x NA NA
Treehouse Foods, Inc. THS 84.08 90.5% 3,621 1,346 54 4,913 3,242 369 31.0% 15.3% 20.1% 11.4% 35.2x 1.52x 13.3x 1.48x 12.3x
Mean 16.9% 6.7% 16.6% 8.3% 40.9x 1.01x 12.2x 1.21x 10.0x
Median 25.3% 3.6% 20.1% 10.3% 35.2x 1.11x 12.4x 1.21x 10.0x
Natural / Organic Foods / Better-For-You
Amplify Snack Brands, Inc. BETR $12.15 70.6% $911 $216 $13 $1,115 $163 $53 NA NA 56.0% 32.7% NM 6.85x 20.9x 5.43x 14.7x
Boulder Brands, Inc. BDBD 9.13 70.9% 561 299 31 829 509 46 2.2% 17.9% 36.5% 9.0% NM 1.63x 18.0x 1.58x 11.4x
SunOpta Inc. TSX:SOY 5.26 42.0% 449 158 4 603 1,203 56 0.6% 4.9% 10.9% 4.6% 104.8x 0.50x 10.8x 0.43x 6.9x
The Hain Celestial Group, Inc. HAIN 54.12 76.6% 5,553 844 167 6,230 2,689 314 24.8% 24.9% 23.0% 11.7% 33.4x 2.32x 19.8x 2.06x 14.6x
The WhiteWave Foods Company WWAV 43.82 83.8% 7,702 1,582 27 9,256 3,603 415 20.7% 18.6% 34.1% 11.5% 54.8x 2.57x 22.3x 2.26x 16.9x
Mean 12.1% 16.6% 32.1% 13.9% 64.3x 2.77x 18.4x 2.35x 12.9x
Median 11.4% 18.3% 34.1% 11.5% 54.8x 2.32x 19.8x 2.06x 14.6x
Baked Goods
ARYZTA AG SWX:ARYN $48.29 56.2% $4,286 $2,266 $350 $6,202 $4,221 $385 (34.9%) (7.7%) 18.4% 9.1% NM 1.47x 16.1x 1.37x 8.2x
Flowers Foods, Inc. FLO 26.03 99.1% 5,471 693 47 6,118 3,757 440 0.7% 8.9% 48.4% 11.7% 29.9x 1.63x 13.9x 1.56x 12.5x
George Weston Limited WN 82.30 93.2% 10,535 11,088 2,206 19,417 38,228 2,513 13.8% 6.3% 26.6% 6.6% 35.4x 0.51x 7.7x 0.53x 6.1x
Grupo Bimbo, S.A.B. de C.V. BIMBO A 2.70 98.9% 12,679 4,244 209 16,714 12,972 1,480 (5.4%) 3.3% 53.0% 11.4% 50.4x 1.29x 11.3x 1.24x 11.3x
Lancaster Colony Corporation LANC 101.62 99.3% 2,780 0 182 2,598 1,105 176 6.1% 3.8% 23.3% 15.9% 27.3x 2.35x 14.8x 2.21x 13.6x
Mean (3.9%) 2.9% 33.9% 10.9% 35.7x 1.45x 12.8x 1.38x 10.3x
Median 0.7% 3.8% 26.6% 11.4% 32.6x 1.47x 13.9x 1.37x 11.3x
EV / LTM EV / 2015ERevenue Growth LTM MarginsLast Twelve Months (LTM)
PUBLIC COMPARABLES5
5
FOOD AND BEVERAGE
INDUSTRY UPDATE │ OCTOBER 2015

PAGE |
Price at As a % of Market Cash & Enterprise P/E
($ in millions, except per share data) Ticker 10/9/15 52-wk High Cap Debt Equiv. Value (EV) Revenue EBITDA 1 Year 3 Years Gross EBITDA Multiple Revenue EBITDA Revenue EBITDA
Dairy
Danone BN $65.88 85.5% $40,386 $13,529 $4,179 $49,736 $24,583 $3,969 (13.3%) (1.1%) 49.0% 16.1% 37.6x 2.02x 12.5x 1.91x 11.4x
Dean Foods Company DF 17.91 90.7% 1,691 839 106 2,425 8,834 314 (4.3%) (3.6%) 20.7% 3.6% NM 0.27x 7.7x 0.30x 6.4x
Emmi AG SWX:EMMN 460.97 99.0% 2,466 609 308 2,767 3,569 317 (5.7%) 7.1% 33.8% 8.9% 20.6x 0.78x 8.7x 0.81x 8.9x
Glanbia plc GL9 18.59 83.4% 5,489 745 105 6,130 2,970 295 (10.4%) 7.2% 29.6% 9.9% 30.1x 2.06x 20.8x 1.87x 16.6x
Lifeway Foods Inc. LWAY 12.20 54.5% 199 8 9 199 120 7 10.1% 17.2% 27.1% 5.5% NM 1.66x 30.2x 1.32x 9.0x
Parmalat SpA BIT:PLT 2.67 92.6% 4,906 386 1,200 4,091 6,588 466 (10.8%) 3.9% 18.5% 7.1% 28.7x 0.62x 8.8x 0.56x 7.4x
Saputo Inc. TSX:SAP 24.12 98.9% 9,458 1,498 141 10,815 8,497 843 (6.4%) 7.4% 9.9% 9.9% 20.7x 1.27x 12.8x 1.27x 12.2x
Savencia SA ENXTPA:SAVE 63.66 86.4% 893 980 507 1,366 5,072 299 (17.2%) (0.6%) 33.4% 5.9% 15.5x 0.27x 4.6x 0.26x 4.2x
Mean (7.3%) 4.7% 27.7% 8.4% 25.5x 1.12x 13.3x 1.04x 9.5x
Median (8.4%) 5.5% 28.3% 8.0% 24.7x 1.02x 10.7x 1.04x 9.0x
Non-Alcoholic Beverages
A.G.Barr p.l.c. LSE:BAG $8.00 74.7% $925 $47 $16 $955 $397 $75 (10.5%) 4.6% 48.2% 18.9% 19.8x 2.41x 12.8x 2.39x 12.3x
Cott Corporation BCB 10.70 88.6% 1,173 1,752 79 2,846 2,568 264 25.3% 3.6% 22.7% 10.3% NM 1.11x 10.8x 0.94x 7.8x
Dr Pepper Snapple Group, Inc. DPS 83.70 99.4% 15,977 2,607 150 18,434 6,198 1,422 2.7% 1.2% 58.9% 22.9% 22.8x 2.97x 13.0x 2.93x 12.0x
Keurig Green Mountain, Inc. GMCR 57.55 36.2% 8,866 415 80 9,201 4,679 1,115 2.6% 8.9% 36.8% 23.8% 17.0x 1.97x 8.2x 2.02x 8.8x
Lassonde Industries Inc. LAS.A 122.13 99.4% 853 301 0 1,154 1,091 117 10.1% 4.7% 28.1% 10.7% 22.6x 1.06x 9.9x NA NA
Monster Beverage Corporation MNST 137.43 88.2% 28,242 0 2,931 25,311 2,562 852 8.8% 9.9% 56.1% 33.3% 50.5x 9.88x 29.7x 8.44x 23.7x
National Beverage Corp. FIZZ 33.97 98.6% 1,576 5 66 1,515 657 89 2.0% 0.7% 33.8% 13.6% 31.2x 2.31x 16.9x NA NA
Pepsico, Inc. PEP 99.47 98.7% 144,913 32,191 10,679 166,425 64,419 12,097 (3.6%) (0.7%) 54.4% 18.8% 29.5x 2.58x 13.8x 2.64x 12.9x
The Coca-Cola Company KO 42.02 93.4% 182,787 44,553 20,953 206,387 45,715 12,700 (1.1%) (1.3%) 61.0% 27.8% 24.6x 4.51x 16.3x 4.59x 16.5x
Mean 4.0% 3.5% 44.5% 20.0% 27.3x 3.20x 14.6x 3.42x 13.4x
Median 2.6% 3.6% 48.2% 18.9% 23.7x 2.41x 13.0x 2.64x 12.3x
Alcoholic Beverages
Anheuser-Busch InBev SA/NV ENXTBR:ABI $111.75 82.2% $179,447 $51,504 $6,784 $224,167 $45,762 $17,597 (1.0%) 5.2% 60.2% 38.5% 18.9x 4.90x 12.7x 4.91x 12.5x
Brown-Forman Corporation BF.B 105.70 95.2% 22,681 1,492 494 23,679 3,128 1,097 3.9% 4.4% 69.7% 35.1% 32.4x 7.57x 21.6x 5.61x 20.5x
Carlsberg A/S CPSE:CARL B 80.91 81.4% 12,466 6,106 422 18,150 9,684 1,871 (18.4%) (4.1%) 49.1% 19.3% 21.6x 1.87x 9.7x 1.80x 8.7x
Constellation Brands Inc. STZ 136.89 99.4% 26,898 7,441 333 34,006 6,263 1,953 6.8% 33.0% 44.9% 31.2% 28.3x 5.43x 17.4x 5.09x 15.7x
Diageo plc DGE 28.04 89.1% 70,497 15,883 742 85,637 17,004 5,284 (3.1%) 1.7% 57.6% 31.1% 19.4x 5.04x 16.2x 5.22x 15.8x
Heineken NV ENXTAM:HEIA 83.27 94.5% 47,849 13,029 946 59,932 22,599 4,797 (13.7%) 4.3% 38.8% 21.2% 20.8x 2.65x 12.5x 2.56x 10.8x
Kirin Holdings Company, Limited TSE:2503 13.75 86.4% 12,547 6,429 227 18,750 18,370 2,163 (16.0%) 7.3% 43.3% 11.8% 29.3x 1.02x 8.7x 1.01x 8.5x
Pernod-Ricard SA RI 110.24 82.4% 29,133 10,593 607 39,119 9,533 2,710 (12.4%) (4.0%) 61.9% 28.4% 29.9x 4.10x 14.4x 3.91x 13.5x
SABMiller plc LSE:SAB 56.17 94.4% 90,442 12,550 1,027 101,965 16,534 5,435 (1.0%) (0.2%) 70.3% 32.9% 26.8x 6.17x 18.8x 6.73x 17.0x
Sapporo Holdings Ltd. TSE:2501 3.92 85.5% 1,529 2,023 88 3,464 4,362 337 (14.8%) 2.8% 34.2% 7.7% 14.8x 0.79x 10.3x 0.77x 9.6x
Mean (7.0%) 5.0% 53.0% 25.7% 24.2x 3.95x 14.2x 3.76x 13.3x
Median (7.7%) 3.5% 53.3% 29.8% 24.2x 4.50x 13.6x 4.41x 13.0x
Snacks
Diamond Foods, Inc. DMND $32.03 93.8% $1,009 $650 $13 $1,646 $864 $108 (0.1%) (4.2%) 26.4% 12.5% 30.9x 1.91x 15.3x 1.88x 12.2x
Golden Enterprises Inc. GLDC 3.97 83.7% 45 8 1 51 131 7 (2.6%) (1.5%) 50.0% 5.7% 24.5x 0.39x 6.9x NA NA
Inventure Foods, Inc. SNAK 9.56 67.8% 187 92 1 279 290 19 14.9% 17.9% 16.8% 6.6% NM 0.96x 14.5x 0.90x 12.6x
J&J Snack Foods Corp. JJSF 120.83 99.1% 2,259 2 127 2,134 970 149 7.3% 6.3% 31.0% 15.3% 31.3x 2.20x 14.3x 2.10x 13.4x
John B Sanfilippo & Son Inc. JBSS 51.70 90.3% 576 98 2 672 887 65 14.0% 8.2% 14.9% 7.3% 19.8x 0.76x 10.3x 0.72x NA
Mondelez International, Inc. MDLZ 45.00 92.6% 72,509 19,378 2,028 89,859 32,590 5,070 (7.0%) 7.1% 37.7% 15.6% 35.5x 2.76x 17.7x 3.12x 17.0x
Pepsico, Inc. PEP 99.47 98.7% 144,913 32,191 10,679 166,425 64,419 12,097 (3.6%) (0.7%) 54.4% 18.8% 29.5x 2.58x 13.8x 2.64x 12.9x
Snyder's-Lance, Inc. LNCE 36.18 99.5% 2,557 443 43 2,958 1,682 186 9.2% 1.1% 35.2% 11.0% 37.3x 1.76x 15.9x 1.70x 13.8x
Mean 4.0% 4.3% 33.3% 11.6% 29.8x 1.66x 13.6x 1.87x 13.7x
Median 3.6% 3.7% 33.1% 11.7% 30.9x 1.83x 14.4x 1.88x 13.2x
Last Twelve Months (LTM) EV / LTMRevenue Growth LTM Margins EV / 2015E
PUBLIC COMPARABLES5
6
FOOD AND BEVERAGE
INDUSTRY UPDATE │ OCTOBER 2015

PAGE |
Price at As a % of Market Cash & Enterprise P/E
($ in millions, except per share data) Ticker 10/9/15 52-wk High Cap Debt Equiv. Value (EV) Revenue EBITDA 1 Year 3 Years Gross EBITDA Multiple Revenue EBITDA Revenue EBITDA
Inputs
Protein Processing
Cal-Maine Foods, Inc. CALM $55.70 91.7% $2,701 $43 $356 $2,388 $1,829 $457 23.7% 17.0% 31.6% 25.0% 9.8x 1.31x 5.2x 1.03x 2.8x
JBS S.A. BOVESPA:JBSS3 4.01 85.4% 11,445 15,670 4,472 22,643 44,312 4,013 (8.5%) 10.3% 15.7% 9.1% 13.6x 0.51x 5.6x 0.43x 4.9x
Sanderson Farms, Inc. SAFM 69.54 72.7% 1,559 10 181 1,388 2,885 507 5.2% 7.9% 20.4% 17.6% 5.6x 0.48x 2.7x 0.48x 4.1x
Seaboard Corp. SEB 3,179.00 68.5% 3,721 109 708 3,122 6,179 376 (6.1%) 1.8% 8.9% 6.1% 13.0x 0.51x 8.3x NA NA
Tyson Foods, Inc. TSN 46.33 99.0% 18,815 7,234 473 25,576 40,972 2,769 12.7% 7.3% 9.1% 6.8% 17.3x 0.62x 9.2x 0.63x 8.0x
Mean 5.4% 8.9% 17.1% 12.9% 11.8x 0.69x 6.2x 0.64x 5.0x
Median 5.2% 7.9% 15.7% 9.1% 13.0x 0.51x 5.6x 0.55x 4.5x
Fruit and Vegetable
Calavo Growers Inc. CVGW $47.44 76.4% $825 $40 $6 $859 $850 $54 10.0% 15.1% 10.1% 6.4% 38.8x 1.01x 15.8x 0.91x 13.8x
Fresh Del Monte Produce Inc. FDP 41.58 98.8% 2,182 209 34 2,356 3,956 252 2.6% 4.9% 8.9% 6.4% 18.0x 0.60x 9.3x 0.58x 9.2x
Seneca Foods Corp. SENE.A 27.95 88.4% 286 238 8 516 1,273 41 (5.6%) 1.1% 6.8% 3.3% 23.1x 0.41x 12.4x NA NA
Total Produce plc ISE:T7O 1.48 98.2% 460 204 110 554 3,091 68 (12.7%) 2.2% 13.9% 2.2% 14.9x 0.18x 8.1x 0.17x 7.7x
Mean (1.4%) 5.8% 9.9% 4.6% 23.7x 0.55x 11.4x 0.56x 10.2x
Median (1.5%) 3.5% 9.5% 4.8% 20.5x 0.50x 10.9x 0.58x 9.2x
Ingredients / Flavors
Givaudan SA SWX:GIVN $1,763.75 87.0% $16,247 $1,352 $307 $17,293 $4,696 $980 (3.9%) 3.3% 46.0% 20.9% 26.5x 3.68x 17.6x 3.75x 15.6x
Ingredion Incorporated INGR $90.61 96.5% 6,467 2,212 677 8,002 5,607 849 (5.8%) (4.2%) 21.0% 15.1% 17.9x 1.43x 9.4x 1.36x 8.8x
International Flavors & Fragrances Inc. IFF 109.53 89.0% 8,827 998 379 9,445 3,072 664 1.5% 3.3% 44.4% 21.6% 20.7x 3.07x 14.2x 3.00x 13.0x
Kerry Group plc ISE:KRZ 76.06 93.1% 13,378 1,786 198 14,966 6,562 839 (17.1%) (2.4%) 45.8% 12.8% 22.5x 2.28x 17.8x 2.17x 15.8x
Sensient Technologies Corporation SXT 65.88 93.4% 3,019 574 22 3,571 1,400 264 (4.2%) (0.9%) 33.8% 18.8% 28.7x 2.55x 13.5x 2.55x 12.9x
Symrise AG XTRA:SY1 64.64 88.2% 8,391 1,655 216 9,831 2,795 590 11.1% 10.3% 42.4% 21.1% 34.0x 3.52x 16.7x 3.21x 14.3x
Tate & Lyle plc TATE 8.85 84.7% 4,128 1,141 400 4,870 3,500 410 (31.2%) (8.4%) 38.6% 11.7% 89.4x 1.39x 11.9x 1.25x 9.7x
Mean (7.1%) 0.1% 38.8% 17.4% 34.3x 2.56x 14.5x 2.47x 12.9x
Median (4.2%) (0.9%) 42.4% 18.8% 26.5x 2.55x 14.2x 2.55x 13.0x
Agribusiness
Archer-Daniels-Midland Company ADM $45.42 84.3% $27,658 $6,923 $1,176 $33,405 $73,703 $3,785 (16.0%) (6.1%) 6.8% 5.1% 12.5x 0.45x 8.8x 0.44x 9.0x
Bunge Limited BG 77.12 82.8% 11,093 4,846 792 15,147 48,495 1,770 (20.9%) (5.1%) 5.7% 3.6% 22.1x 0.31x 8.6x 0.30x 7.2x
CF Industries Holdings, Inc. CF 50.78 72.2% 11,834 4,593 810 15,617 4,403 2,053 (12.4%) (11.7%) 42.0% 46.6% 13.0x 3.55x 7.6x 3.26x 6.6x
Darling Ingredients Inc. DAR 11.45 59.0% 1,892 2,045 126 3,811 3,713 441 27.6% 29.5% 21.6% 11.9% 21.7x 1.03x 8.6x 1.10x 8.3x
Monsanto Company MON 89.70 71.2% 41,965 9,044 3,636 47,373 15,001 4,732 (5.4%) 3.6% 55.2% 31.5% 18.9x 3.16x 10.0x 3.25x 10.8x
The Andersons, Inc. ANDE 38.49 59.9% 1,070 586 41 1,615 4,383 129 (13.7%) (2.2%) 8.9% 3.0% 14.2x 0.37x 12.5x 0.37x 7.8x
The Mosaic Company MOS 33.93 63.0% 12,023 3,846 2,210 13,659 9,256 2,404 20.7% (6.0%) 22.0% 26.0% 10.0x 1.48x 5.7x 1.43x 5.8x
Mean (2.9%) 0.3% 23.2% 18.2% 16.1x 1.48x 8.8x 1.45x 7.9x
Median (12.4%) (5.1%) 21.6% 11.9% 14.2x 1.03x 8.6x 1.10x 7.8x
Consumer and Retail
Grocery Distribution
AMCON Distributing Co. DIT $82.00 92.8% $51 $18 $0 $68 $883 $14 5.8% 3.0% 8.7% 1.5% 9.7x 0.08x 5.1x NA NA
Core-Mark Holding Company, Inc. CORE 77.60 97.1% 1,789 149 15 1,923 8,483 112 6.8% 8.0% 7.1% 1.3% 38.4x 0.23x 17.2x 0.16x 13.4x
Performance Food Group Company PFGC 21.71 96.2% 2,164 1,450 9 3,604 15,270 281 32.7% NA 12.1% 1.8% 33.9x 0.24x 12.8x 0.22x 11.3x
SpartanNash Company SPTN 27.37 80.8% 1,027 538 13 1,551 7,881 223 27.6% 44.1% 14.5% 2.8% 17.2x 0.20x 7.0x 0.20x 6.4x
SUPERVALU Inc. SVU 7.58 63.2% 2,008 2,712 137 4,583 17,963 793 4.6% 16.1% 15.0% 4.4% 15.1x 0.26x 5.8x 0.25x 5.7x
United Natural Foods, Inc. UNFI 55.42 66.0% 2,777 549 17 3,309 8,185 307 20.5% 16.1% 15.4% 3.7% 20.1x 0.40x 10.8x 0.39x 10.1x
Mean 16.3% 17.5% 12.1% 2.6% 22.4x 0.23x 9.8x 0.24x 9.4x
Median 13.6% 16.1% 13.3% 2.3% 18.6x 0.23x 8.9x 0.22x 10.1x
LTM Margins EV / 2015ELast Twelve Months (LTM) Revenue Growth EV / LTM
PUBLIC COMPARABLES5
7
FOOD AND BEVERAGE
INDUSTRY UPDATE │ OCTOBER 2015

PAGE |
Price at As a % of Market Cash & Enterprise P/E
($ in millions, except per share data) Ticker 10/9/15 52-wk High Cap Debt Equiv. Value (EV) Revenue EBITDA 1 Year 3 Years Gross EBITDA Multiple Revenue EBITDA Revenue EBITDA
Food Retail
Costco Wholesale Corporation COST $153.97 98.2% $67,431 $6,147 $6,419 $67,159 $116,199 $4,659 3.2% 5.4% 13.0% 4.0% 28.7x 0.58x 14.4x 0.54x 13.2x
Establishments Delhaize Freres DELB 93.82 91.7% 9,658 2,827 1,679 10,807 25,724 1,483 (8.1%) (1.5%) 24.2% 5.8% 30.2x 0.42x 7.3x 0.39x 6.1x
Fairway Group Holdings Corp. FWM 1.50 19.2% 66 257 32 291 793 11 0.7% 12.6% 31.4% 1.3% NM 0.37x NM 0.37x 7.2x
Ingles Markets, Incorporated IMKT.A 48.70 87.0% 987 918 9 1,896 3,791 240 (0.8%) 1.5% 23.4% 6.3% 16.6x 0.50x 7.9x 0.49x 7.7x
J Sainsbury plc LSE:SBRY 4.22 95.6% 8,096 4,246 1,956 10,386 35,064 1,832 (11.9%) (0.2%) 6.4% 5.2% NM 0.30x 5.7x 0.29x 5.6x
Koninklijke Ahold N.V. ENXTAM:AH 20.71 91.6% 16,939 3,744 2,187 18,496 39,568 2,422 (9.2%) 0.8% 26.8% 6.1% 19.2x 0.47x 7.6x 0.43x 6.8x
Natural Grocers by Vitamin Cottage NGVC 24.93 71.2% 561 28 3 585 598 49 19.6% 23.6% 29.1% 8.2% 34.1x 0.98x 12.0x 0.82x 10.4x
Roundy's, Inc. RNDY 2.74 44.8% 135 647 40 743 4,030 121 15.3% 1.3% 26.3% 3.0% NM 0.18x 6.1x 0.18x 6.2x
Sprouts Farmers Market, Inc. SFM 23.54 61.2% 3,615 289 97 3,807 3,261 273 20.4% 43.4% 29.4% 8.4% 32.7x 1.17x 13.9x 0.99x 11.9x
SUPERVALU Inc. SVU 7.58 63.2% 2,008 2,712 137 4,583 17,963 793 4.6% 16.1% 15.0% 4.4% 15.1x 0.26x 5.8x 0.25x 5.7x
Tesco PLC LSE:TSCO 3.14 81.1% 25,518 19,374 2,973 41,919 93,911 1,027 (3.5%) (2.2%) 2.3% 1.1% NM 0.45x NM 0.49x 10.9x
The Kroger Co. KR 38.03 96.4% 37,020 11,270 268 48,022 108,784 5,537 4.6% 5.4% 22.3% 5.1% 19.6x 0.44x 8.7x 0.42x 8.4x
Village Super Market Inc. VLGE.A 25.29 73.1% 358 45 59 345 1,584 67 4.3% 3.7% 27.3% 4.2% 11.7x 0.22x 5.2x NA NA
Weis Markets, Inc. WMK 43.07 83.0% 1,159 0 104 1,055 2,828 155 3.7% 0.9% 27.3% 5.5% 20.3x 0.37x 6.8x NA NA
Whole Foods Market, Inc. WFM 34.24 59.5% 12,222 63 691 11,594 15,207 1,414 9.3% 10.9% 35.4% 9.3% 20.5x 0.76x 8.2x 0.71x 7.8x
Mean 3.5% 8.1% 22.6% 5.2% 22.6x 0.50x 8.4x 0.49x 8.3x
Median 3.7% 3.7% 26.3% 5.2% 20.3x 0.44x 7.6x 0.43x 7.7x
Foodservice
Colabor Group Inc. TSX:GCL $0.87 28.7% $24 $145 $0 $169 $1,128 $20 (14.0%) (8.4%) 1.8% 1.8% NM 0.15x 8.5x 0.14x 7.3x
Sysco Corporation SYY 40.93 97.8% 24,399 7,322 5,130 26,590 48,681 2,345 4.7% 4.7% 17.6% 4.8% 35.6x 0.55x 11.3x 0.52x 10.6x
The Chefs' Warehouse, Inc. CHEF 14.75 61.2% 388 313 2 698 918 47 20.1% 28.7% 25.0% 5.2% 26.9x 0.76x 14.7x 0.63x 10.1x
Mean 3.6% 8.3% 14.8% 3.9% 31.2x 0.49x 11.5x 0.43x 9.3x
Median 4.7% 4.7% 17.6% 4.8% 31.2x 0.55x 11.3x 0.52x 10.1x
Quick Service Restaurant
Bojangles', Inc. BOJA $16.46 57.9% $592 $244 $13 $823 $463 $64 23.4% NA 22.3% 13.8% 25.0x 1.78x 12.9x 1.61x 10.9x
Jack in the Box Inc. JACK 77.41 77.4% 2,831 659 18 3,472 1,531 286 3.6% 10.5% 27.7% 18.7% 28.4x 2.27x 12.1x 2.18x 11.0x
McDonald's Corp. MCD 102.76 99.3% 96,780 17,902 3,999 110,684 26,016 9,032 (8.1%) (1.8%) 37.8% 34.7% 23.9x 4.25x 12.3x 4.51x 12.5x
Popeyes Louisiana Kitchen, Inc. PLKI 56.89 85.6% 1,303 110 10 1,403 251 81 13.2% 15.2% 64.9% 32.5% 31.5x 5.60x 17.2x 5.01x 15.5x
Restaurant Brands International Inc. QSR 36.32 79.5% 7,352 8,860 689 15,522 2,669 827 156.0% 5.1% 48.0% 31.0% NM NM NM 3.79x 9.2x
Sonic Corp. SONC 25.39 69.1% 1,318 466 23 1,762 595 158 8.6% 3.0% 54.4% 26.6% 24.3x 2.96x 11.1x 2.83x 10.3x
The Wendy's Company WEN 9.28 79.2% 2,527 2,397 1,198 3,727 1,988 374 (11.6%) (6.9%) 33.5% 18.8% 37.2x 1.87x 10.0x 2.53x 9.6x
Yum! Brands, Inc. YUM 70.25 73.3% 30,292 3,217 861 32,648 13,151 2,665 (2.3%) (1.1%) 26.2% 20.3% 33.6x 2.48x 12.3x 2.39x 10.9x
Mean 22.9% 3.4% 39.4% 24.5% 29.1x 3.03x 12.6x 3.11x 11.2x
Median 6.1% 3.0% 35.7% 23.4% 28.4x 2.48x 12.3x 2.68x 10.9x
Fast Casual
Chipotle Mexican Grill, Inc. CMG $732.93 96.6% $22,825 $0 $879 $21,946 $4,441 $951 22.5% 20.8% 38.3% 21.4% 44.9x 4.94x 23.1x 4.33x 19.7x
El Pollo Loco Holdings, Inc. LOCO 13.00 33.6% 497 136 6 627 356 62 9.9% 20.0% 25.8% 17.4% 11.2x 1.76x 10.1x 1.61x 9.2x
Fiesta Restaurant Group, Inc. FRGI 43.34 62.8% 1,150 74 6 1,218 647 93 17.3% 36.0% 25.9% 14.3% 29.1x 1.88x 13.1x 1.64x 10.8x
The Habit Restaurants, Inc. HABT 23.10 52.3% 318 2 52 268 207 22 17.3% 36.0% 22.0% 10.6% NM 1.30x 12.2x 1.04x 9.4x
Noodles & Company NDLS 13.77 49.1% 391 30 2 419 436 46 17.3% 36.0% 19.2% 10.5% NM 0.96x 9.1x 0.85x 9.2x
Panera Bread Company PNRA 191.92 92.3% 5,215 100 125 5,190 2,618 390 17.3% 36.0% 33.0% 14.9% 31.6x 1.98x 13.3x 1.91x 12.8x
Potbelly Corporation PBPB 11.65 70.0% 352 0 54 298 351 34 17.3% 36.0% 30.4% 9.6% NM 0.85x 8.8x 0.75x 8.1x
Shake Shack Inc. SHAK 44.05 45.5% 670 0 65 606 153 16 17.3% 36.0% 38.5% 10.4% NM 3.96x NM 2.94x 18.8x
Zoe's Kitchen, Inc. ZOES 38.27 82.1% 742 27 24 745 201 16 37.7% NA 20.7% 8.1% NM 3.70x NM 2.99x 37.0x
Mean 19.3% 32.1% 28.2% 13.0% 29.2x 2.37x 12.8x 2.01x 15.0x
Median 17.3% 36.0% 25.9% 10.6% 30.4x 1.88x 12.2x 1.64x 10.8x
Last Twelve Months (LTM) Revenue Growth LTM Margins EV / LTM EV / 2015E
PUBLIC COMPARABLES5
8
FOOD AND BEVERAGE
INDUSTRY UPDATE │ OCTOBER 2015

PAGE |
Price at As a % of Market Cash & Enterprise P/E
($ in millions, except per share data) Ticker 10/9/15 52-wk High Cap Debt Equiv. Value (EV) Revenue EBITDA 1 Year 3 Years Gross EBITDA Multiple Revenue EBITDA Revenue EBITDA
Differentiated Casual
BJ's Restaurants, Inc. BJRI $42.38 76.4% $1,085 $75 $25 $1,134 $877 $109 7.9% 9.3% 19.0% 12.4% 31.2x 1.29x 10.4x 1.16x 9.0x
Buffalo Wild Wings Inc. BWLD 196.14 95.3% 3,729 0 92 3,637 1,649 247 18.6% 22.0% 23.3% 15.0% 40.3x 2.21x 14.7x 1.78x 11.3x
Chuy's Holdings, Inc. CHUY 33.15 92.7% 546 0 8 538 268 31 20.0% 21.5% 19.1% 11.6% 39.0x 2.01x 17.3x 1.74x 14.9x
Dave & Buster's Entertainment, Inc. PLAY 39.84 91.9% 1,651 361 24 1,989 811 166 17.5% 14.4% 28.0% 20.5% 39.2x 2.45x 12.0x 2.20x 9.1x
Ignite Restaurant Group, Inc. IRG 4.85 58.2% 127 162 48 240 836 29 17.3% 36.0% 29.9% 3.4% NM 0.29x 8.4x 0.48x 7.9x
The Cheesecake Factory Incorporated CAKE 54.59 92.7% 2,580 104 62 2,622 2,046 244 17.3% 36.0% 42.9% 11.9% 24.8x 1.28x 10.7x 1.19x 9.8x
Wingstop Inc. WING 28.70 80.6% 820 101 5 916 73 25 41.0% NA 70.5% 34.1% 114.7x 12.59x NM 11.43x 33.3x
Mean 19.9% 23.2% 33.2% 15.6% 48.2x 3.16x 12.3x 2.86x 13.6x
Median 17.5% 21.8% 28.0% 12.4% 39.1x 2.01x 11.4x 1.74x 9.8x
Casual Dining Restaurant
Bloomin' Brands, Inc. BLMN $18.45 70.3% $2,263 $1,324 $133 $3,454 $4,476 $449 4.4% 4.5% 16.7% 10.0% 22.8x 0.77x 7.7x 0.77x 7.1x
Brinker International, Inc. EAT 51.69 81.5% 3,107 974 55 4,026 3,002 461 3.2% 2.1% 19.8% 15.4% 16.9x 1.34x 8.7x 1.18x 7.9x
Darden Restaurants, Inc. DRI 66.68 88.2% 8,544 1,453 690 9,307 6,855 834 8.0% (5.4%) 21.7% 12.2% 29.1x 1.36x 11.2x 1.33x 9.6x
DineEquity, Inc. DIN 91.64 80.2% 1,729 1,449 104 3,074 675 257 4.3% (11.8%) 56.4% 38.1% 33.9x 4.56x 12.0x 4.56x 10.9x
Red Robin Gourmet Burgers Inc. RRGB 79.28 83.5% 1,123 145 23 1,245 1,237 136 15.7% 9.8% 22.9% 11.0% 29.2x 1.01x 9.1x 0.93x 8.1x
Ruby Tuesday, Inc. RT 5.80 67.7% 355 232 57 530 1,125 78 (3.1%) (4.9%) 16.7% 6.9% NM 0.47x 6.8x 0.47x 6.0x
Texas Roadhouse, Inc. TXRH 38.06 93.2% 2,667 51 71 2,647 1,705 201 13.4% 12.7% 32.1% 11.8% 29.5x 1.55x 13.2x 1.39x 11.2x
Mean 6.6% 1.0% 26.6% 15.1% 26.9x 1.58x 9.8x 1.52x 8.7x
Median 4.4% 2.1% 21.7% 11.8% 29.1x 1.34x 9.1x 1.18x 8.1x
Fine Dining
Del Frisco's Restaurant Group, Inc. DFRG $14.17 54.6% $332 $0 $2 $330 $317 $43 10.9% 13.5% 24.3% 13.4% 20.3x 1.04x 7.8x 0.92x 6.8x
Fogo de Chao, Inc. FOGO 15.87 58.4% 443 165 25 583 266 50 21.1% NA 32.0% 19.0% 1.0x 2.20x 11.6x 2.02x 9.7x
Ruth's Hospitality Group Inc. RUTH 16.00 89.8% 563 0 5 558 361 56 24.2% (1.4%) 25.9% 15.6% 19.1x 1.55x 9.9x 1.44x 9.5x
Mean 18.7% 6.0% 27.4% 16.0% 13.5x 1.59x 9.7x 1.46x 8.7x
Median 21.1% 6.0% 25.9% 15.6% 19.1x 1.55x 9.9x 1.44x 9.5x
Pizza
Domino's Pizza, Inc. DPZ $105.38 88.0% $5,759 $1,528 $33 $7,254 $2,118 $407 10.5% 8.9% 30.3% 19.2% 33.4x 3.42x 17.8x 3.16x 15.6x
Papa John's International Inc. PZZA 68.30 86.0% 2,695 234 22 2,907 1,647 168 8.6% 9.3% 24.9% 10.2% 39.7x 1.76x 17.3x 1.70x 15.3x
Papa Murphy's Holdings, Inc. FRSH 14.81 65.2% 251 113 1 362 109 27 22.5% NA 49.9% 24.8% NM 3.33x 13.4x 2.75x 11.8x
Mean 13.9% 9.1% 35.0% 18.1% 36.6x 2.84x 16.2x 2.54x 14.3x
Median 10.5% 9.1% 30.3% 19.2% 36.6x 3.33x 17.3x 2.75x 15.3x
Beverage / Snack Retail
DAVIDsTEA Inc. DTEA $16.19 54.0% $388 $0 $48 $340 $121 $11 24.2% NA 53.5% 9.0% NM 2.80x 31.3x 2.31x 17.2x
Dunkin' Brands Group, Inc. DNKN 42.05 74.0% 4,005 2,503 329 6,179 783 390 6.9% 6.0% 79.9% 49.8% 24.5x 7.89x 15.9x 7.51x 14.7x
Jamba, Inc. JMBA 14.72 87.2% 238 0 14 224 209 (2) (5.7%) (1.8%) 33.1% NM NM 1.07x NM 2.37x 18.3x
Krispy Kreme Doughnuts, Inc. KKD 14.41 64.6% 907 12 44 874 508 66 8.3% 7.3% 18.9% 13.1% 31.3x 1.72x 13.2x 1.61x 10.8x
Starbucks Corporation SBUX 60.07 99.9% 89,156 2,937 2,175 89,918 18,429 4,133 14.8% 12.4% 31.0% 22.4% 33.8x 4.88x 21.8x 4.31x 18.1x
Mean 9.7% 6.0% 43.3% 23.6% 29.9x 3.67x 20.5x 3.62x 15.8x
Median 8.3% 6.7% 33.1% 17.7% 31.3x 2.80x 18.8x 2.37x 17.2x
Family Restaurant
Bob Evans Farms, Inc. BOBE $43.77 72.8% $979 $491 $6 $1,464 $1,345 $137 1.4% (5.1%) 35.8% 10.2% NM 1.09x 10.7x 1.07x 9.4x
Cracker Barrel Old Country Store, Inc. CBRL 144.26 88.9% 3,466 410 265 3,610 2,842 331 5.9% 3.3% 32.6% 11.7% 21.2x 1.27x 10.9x 1.23x 10.2x
Denny's Corporation DENN 11.19 87.4% 932 161 5 1,088 489 87 6.8% (1.9%) 39.6% 17.9% 26.6x 2.22x 12.5x 2.18x 11.3x
Luby's, Inc. LUB 4.79 80.8% 137 48 2 183 396 16 0.8% 3.5% 30.8% 4.0% NM 0.46x 11.5x NA NA
Mean 3.7% (0.0%) 34.7% 10.9% 23.9x 1.26x 11.4x 1.49x 10.3x
Median 3.7% 0.7% 34.2% 10.9% 23.9x 1.18x 11.2x 1.23x 10.2x
Last Twelve Months (LTM) Revenue Growth LTM Margins EV / LTM EV / 2015E
PUBLIC COMPARABLES5
9
FOOD AND BEVERAGE
INDUSTRY UPDATE │ OCTOBER 2015
PAGE |
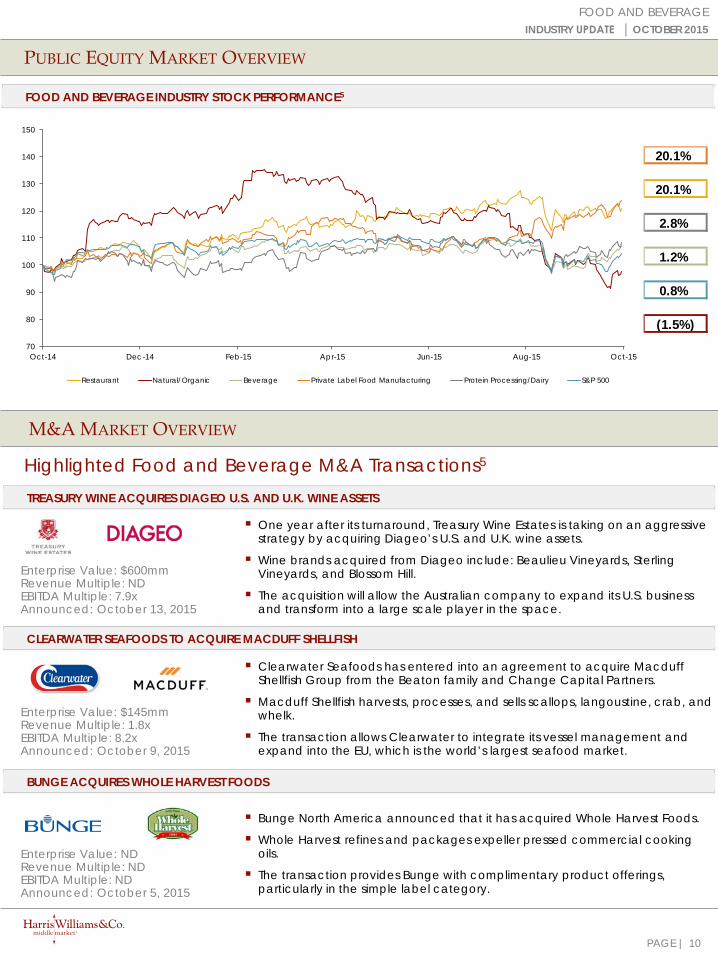
20.1%
20.1%
2.8%
1.2%
0.8%
(1.5%)
PUBLIC EQUITY MARKET OVERVIEW
10
FOOD AND BEVERAGEINDUSTRY UPDATE │ OCTOBER 2015
FOOD AND BEVERAGE INDUSTRY STOCK PERFORMANCE5
Highlighted Food and Beverage M&A Transactions5
M&A MARKET OVERVIEW
TREASURY WINE ACQUIRES DIAGEO U.S. AND U.K. WINE ASSETS
Clearwater Seafoods has entered into an agreement to acquire Macduff Shellfish Group from the Beaton family and Change Capital Partners.
Macduff Shellfish harvests, processes, and sells scallops, langoustine, crab, and whelk.
The transaction allows Clearwater to integrate its vessel management and expand into the EU, which is the world’s largest seafood market.
Enterprise Value: $145mmRevenue Multiple: 1.8xEBITDA Multiple: 8.2xAnnounced: October 9, 2015
BUNGE ACQUIRES WHOLE HARVEST FOODS
CLEARWATER SEAFOODS TO ACQUIRE MACDUFF SHELLFISH
Bunge North America announced that it has acquired Whole Harvest Foods.
Whole Harvest refines and packages expeller pressed commercial cooking oils.
The transaction provides Bunge with complimentary product offerings, particularly in the simple label category.
Enterprise Value: NDRevenue Multiple: NDEBITDA Multiple: NDAnnounced: October 5, 2015
70
80
90
100
110
120
130
140
150
Oct-14 Dec-14 Feb-15 Apr-15 Jun-15 Aug-15 Oct-15
Restaurant Natural/Organic Beverage Private Label Food Manufacturing Protein Processing/Dairy S&P 500
One year after its turnaround, Treasury Wine Estates is taking on an aggressive strategy by acquiring Diageo’s U.S. and U.K. wine assets.
Wine brands acquired from Diageo include: Beaulieu Vineyards, Sterling Vineyards, and Blossom Hill.
The acquisition will allow the Australian company to expand its U.S. business and transform into a large scale player in the space.
Enterprise Value: $600mmRevenue Multiple: NDEBITDA Multiple: 7.9xAnnounced: October 13, 2015

PAGE |
M&A MARKET OVERVIEW*
11
FOOD AND BEVERAGEINDUSTRY UPDATE │ OCTOBER 2015
Food and Beverage M&A Trends5
MEDIAN FOOD & BEV. TRANSACTION MULTIPLES
PRIVATE EQUITY INVESTMENTS & EXITS
Latest Deals and Announced Private Equity Activity5
LAST 10 DEALS ANNOUNCED
ANNOUNCED FOOD & BEV. TRANSACTIONS
Announced Target Buyer 10/16/2015 Premier Is - Mejerigaarden A/S Food Union10/15/2015 Red Arrow Products Company LLC Kerry Group plc (ISE:KRZ)10/15/2015 Island Oasis, Inc. Kerry Group plc (ISE:KRZ)10/14/2015 Voortman Cookies Limited Swander Pace Capital10/14/2015 La Terra Fina USA, Inc. HP Hood LLC10/13/2015 US And UK Wine Operations Treasury Wine Estates Limited10/9/2015 Macduff Shellfish Group Clearwater Seafoods10/8/2015 Grupo Ibérica de Congelados, S.A. Portobello Capital Gest ión10/7/2015 Biocentury, S.L.U. Nutrit ion & Santé SAS10/7/2015 Comptoir du Caviar SAS Gardinier & Fils SAS
9.9x
8.8x 8.3x 8.0x
11.3x
9.2x 9.7x
8.3x
0.00x
0.25x
0.50x
0.75x
1.00x
1.25x
1.50x
1.75x
2.00x
0.0x
2.0x
4.0x
6.0x
8.0x
10.0x
12.0x
2008 2009 2010 2011 2012 2013 2014 YTD2015
EV / LTM Sales M
ultipleEV /
LTM
EBI
TDA
Mul
tiple
EV / L TM EBITDA EV / L TM Sales
$110.2
$9.3
$67.2
$8.2
$24.0
$55.7
$120.7
$95.7
0
50
100
150
200
250
300
350
400
450
$0
$20
$40
$60
$80
$100
$120
$140
2008 2009 2010 2011 2012 2013 2014 YTD2015
Num
ber of Transactions
Aggr
egat
e D
eal V
alue
($
inbi
llion
s)
Aggregate Deal Value # of deals
27
46
2114
3225 26
3831
48
27 26 27
17
34
18
3643
48 51
0
10
20
30
40
50
60
2006 2007 2008 2009 2010 2011 2012 2013 2014 2015 YTD
Num
ber o
f Tra
nsac
tions
Number of Investments Number of Exits
* 2015 M&A transactions include European and cross-border transactions.

PAGE |
Effective Date Borrower Name Description Tranche Amount Type Rating Spread
10/09/15 Khmer Brewery Ltd Malt beverages JPY 80 Term Loan N/A 55009/30/15 Marusan-Ai Co Ltd Food preparations, nec JPY 2,000 Revolver/Line >= 1 Yr. N/A N/A09/30/15 Miyoshi Oil & Fat Co Ltd Vegetable oil mills, nec JPY 2,000 Revolver/Line >= 1 Yr. N/A N/A09/30/15 Nichimo Co Ltd Fresh or frozen prepared fish USD 10,600 Revolver/Line >= 1 Yr. N/A N/A09/30/15 Ocean Choice International L Fresh or frozen prepared fish USD 150 Term Loan N/A N/A09/30/15 Ocean Choice International L Fresh or frozen prepared fish EUR 60 Revolver/Line >= 1 Yr. N/A N/A09/30/15 Yokooshoten Co Ltd Food preparations, nec EUR 130 Revolver/Line >= 1 Yr. N/A N/A09/28/15 CHS Inc Flour/other grain mill products EUR 600 Delay Draw Term Loan N/A 15009/26/15 Kato Brothers Honey Co Ltd Food preparations, nec EUR 3,000 Revolver/Line >= 1 Yr. N/A N/A09/25/15 Kagome Co Ltd Pickles/sauces/salad dressings EUR 3,000 Revolver/Line >= 1 Yr. N/A N/A09/25/15 Kinjirushi Co Ltd Food preparations, nec JPY 1,615 Revolver/Line >= 1 Yr. N/A N/A09/25/15 Kirin Holdings Co Ltd Malt beverages USD 84 Term Loan N/A N/A09/25/15 Maruwa Oil & Fat Co Ltd Edible fats and oils, nec USD 600 Revolver/Line >= 1 Yr. N/A N/A06/26/13 Synlait Milk Finance Ltd Fluid milk USD 35 Revolver/Line >= 1 Yr. N/A N/A06/26/13 Synlait Milk Finance Ltd Fluid milk USD 245 Revolver/Line >= 1 Yr. N/A N/A
L + 0
L + 200
L + 400
L + 600
L + 800
L + 1000
Ave
rage
Spre
ad O
ver L
IBO
R
AVERAGE SPREAD ON FOOD & BEVERAGE LOANS
DEBT MARKET OVERVIEW
12
FOOD AND BEVERAGEINDUSTRY UPDATE │ OCTOBER 2015
Food and Beverage Loan Activity7
AVERAGE SECONDARY SPREADS
Recent Debt Offerings8
CREDIT STATISTICS
QUARTERLY LOAN VOLUME
$0
$2
$4
$6
$8
$10
$12
$14
$16
2Q09 2Q10 2Q11 2Q12 2Q13 2Q14 2Q15
Loan
Vol
ume
by Q
uart
er
($ in
billi
ons)
Institutional Pro Rata
L + 0
L + 100
L + 200
L + 300
L + 400
L + 500
L + 600
2009 2010 2011 2012 2013 2014 1H15
Ave
rage
Spre
ad O
ver L
IBO
R
Revolving Credit / Term Loan A Weighted-Average Inst itutional
0.0x
2.0x
4.0x
6.0x
Debt/EBITDA
Senior Debt/EBITDA
EBITDA/Cash Interest
EBITDA - Capex/Cash Interest
EBITD
A M
ultip
le
2011 2012 2013 2014 LTM 1H15

PAGE |
Enterprise Enterprise Value Private Equity Geographic
Announced Target Seller Buyer
($mm) Sales EBITDA EBIT Involvement Location
10/16/2015 Premier Is - Mejerigaarden A/S Erhvervsinvest Management A/S Food Union - - - - EU10/15/2015 Red Arrow Products Company LLC - Kerry Group plc (ISE:KRZ) - - - - Cross Border10/15/2015 Island Oasis, Inc. TSG Consumer Partners Kerry Group plc (ISE:KRZ) - - - - Cross Border10/14/2015 Voortman Cookies Limited - Swander Pace Capital - - - - N.A.10/14/2015 La Terra Fina USA, Inc. Claridge, Inc. HP Hood LLC - - - - N.A.10/13/2015 US And UK Wine Operations Diageo plc (LSE:DGE) Treasury Wine Estates Limited $600.0 - 7.9x - Cross Border10/9/2015 Macduff Shellfish Group Change Capital Partners Clearwater Seafoods $144.5 1.8x 8.2x - Cross Border10/9/2015 Mill Street Brewery XDL Capital Group; HMW Capital Labatt Brewing Company Limited - - - - N.A.10/8/2015 Grupo Ibérica de Congelados, S.A. - Portobello Capital Gest ión - - - - EU10/7/2015 Biocentury, S.L.U. Agrolimen SA Nutrit ion & Santé SAS - - - - EU10/7/2015 Comptoir du Caviar SAS - Gardinier & Fils SAS - - - - EU10/6/2015 Stumptown Coffee Roasters, Inc. TSG Consumer Partners Peet's Coffee & Tea, Inc. - - - - N.A.10/6/2015 Barrel O' Fun Snack Foods Co., Inc. - Shearer's Foods, Inc. - - - - N.A.10/5/2015 Woolwich Dairy Inc. Nova Cheese Inc. Saputo Inc. (TSX:SAP) $61.1 - - - N.A.10/5/2015 Bite Group Ltd. - Adelie Foods Group Ltd - - - - EU10/5/2015 Whole Harvest Foods, LLC - Bunge North America, Inc. - - - - N.A.10/1/2015 Solina Group SAS IK Investment Partners Ardian - - - - EU10/1/2015 GROMART S.p.A. - Unilever plc (LSE:ULVR) - - - - EU10/1/2015 Eatem Foods Co. Linsalata Capital Partners Archer-Daniels-Midland - - - - N.A.10/1/2015 Agrial S.A., Poultry Processing Assets Agrial S.A. L.D.C. S.A. (ENXTPA:LOUP) - - - - EU10/1/2015 Past ificio di Chiavenna S.r.l. - Alto Partners SGR Spa - - - - EU9/30/2015 Marlow Foods Limited Intermediate Capital Group plc Monde Nissin Corporat ion $832.3 - - - Cross Border9/28/2015 VitaminFizz, L.P. Big Red and Power Brands Athena Brands, Inc. - - - - N.A.9/23/2015 R2 Group A/S Maj Invest Equity Caldic B.V. - - - - EU9/23/2015 Avanta Serviced Office Group plc - Regus plc (LSE:RGU) - - - - EU9/22/2015 Cargill Inc., Schweigert Meat Cargill, Incorporated Bakalars Sausage Company, Inc. - - - - N.A.9/22/2015 Willamette Egg Farms, L.L.C. WEF, INC. Post Holdings, Inc. (NYSE:POST) $90.0 1.1x 6.0x - N.A.9/21/2015 Dorset County Foods Ltd. - Eversfield Organic Limited - - - - EU9/21/2015 Bioderij B.V. - Cérélia SA - - - - EU9/21/2015 Harrogate Cake Company Limited - Sugar Therapy Limited - - - - EU9/15/2015 Cargill, Small Pack Specialty Business Cargill, Incorporated Brenntag AG (XTRA:BNR) - - - - EU9/15/2015 Love Child (Brands) Inc. - GreenSpace Brands Inc. $5.7 1.5x - - N.A.9/11/2015 CoPak Solut ions, Inc. - Star Snax, LLC - - - - N.A.9/10/2015 Saint Archer Brewing Company - Tenth and Blake Beer Company - - - - N.A.9/9/2015 Alpine Valley Bread Company - Flowers Bakeries, LLC $120.0 - - - N.A.9/8/2015 Expresco Foods Inc. - Premium Brands Holdings - - - - N.A.9/8/2015 Lagunitas Brewing Company - Heineken NV (ENXTAM:HEIA) - - - - Cross Border9/8/2015 Natural Food Holdings, Inc. LNK Partners Perdue Farms Inc. - - - - N.A.9/8/2015 Bright Blue Foods Ltd. NBGI Private Equity Limited Endless LLP - - - - EU9/4/2015 State Fish - HPP Business & Calpack State Fish Company Inc ICPK Corporat ion $12.7 - - - N.A.
10.0x
11.0x
12.0x
13.0x
14.0x
15.0x
16.0x
Sep
-14
Oct
-14
Nov
-14
Dec
-14
Jan-
15
Feb
-15
Ma
r-15
Apr
-15
Ma
y-15
Jun-
15
Jul-1
5
Aug
-15
Sep
-15
Med
ian
Tradi
ng M
ultip
le
Food Products, Processing, and Ingredients Retail and Restaurants
3646 47
2533
4934
4253 52 48
39 3346 47 52
70
89
58 57
82
141
118
75 7
136
7
75
4 7 9
610
13 87
10
6
10 5
20
18
8
0
20
40
60
80
100
120
140
160
180
Q11
0
Q21
0
Q31
0
Q41
0
Q11
1
Q21
1
Q31
1
Q41
1
Q11
2
Q21
2
Q31
2
Q41
2
Q11
3
Q21
3
Q31
3
Q41
3
Q11
4
Q21
4
Q31
4
Q41
4
Q11
5
Q21
5
Q31
5
Num
be
r o
f Tra
nsa
ctio
nsStrategic Acquirer Private Equity Acquirer
M&A OVERVIEW*
13
FOOD AND BEVERAGEINDUSTRY UPDATE │ OCTOBER 2015
QUARTERLY M&A ACTIVITY
Median LTM Trading Multiples & Quarterly Food & Beverage M&A5
Recent Food and Beverage M&A5
MEDIAN LTM TRADING MULTIPLES
* 2015 M&A transactions include European and cross-border transactions.

PAGE |
Enterprise Enterprise Value Private Equity EuropeanAnnounced Target Seller Buyer
($mm) Sales EBITDA EBIT Involvement Transaction
9/4/2015 Elgorriaga Brands, S.A. - Energy Shot Iberica S.L. - - - - EU9/4/2015 Virtue Cider Company - Fulton Street Brewery, LLC - - - - N.A.9/3/2015 Nutrafur S.A. - Frutarom Industries Ltd. (TASE:FRUT) $14.5 1.1x - - Cross Border9/2/2015 Green Giant, Le Sueur Stable & Frozen General Mills, Inc. (NYSE:GIS) B&G Foods North America, Inc. $765.0 1.1x 6.4x - N.A.8/31/2015 New York Fries Ltd. 122164 Canada Ltd. Cara Operations Limited (TSX:CAO) - - - - N.A.8/31/2015 Canon Potato Company, LLC - H.C. Schmieding Produce Company, In - - - - N.A.8/31/2015 QiZiNi Group B.V. - Natsu Foods GmbH & Co. KG - - - - EU8/27/2015 Twin Rivers Technologies Felda Global Ventures Viterra Inc. $143.7 0.5x - - N.A.8/26/2015 Dicot Partners, S.L Gest ion Ganuza S.L. Yantai Changyu Pioneer $39.3 1.0x - - Cross Border8/26/2015 Talbott Vineyards - E. & J. Gallo Winery, Inc. - - - - N.A.8/26/2015 Proviand BV - Like Meat GmbH - - - - EU8/25/2015 DOUX SA Développement et Partenariat SA Sofiprotéol; Terrena SARL - - - - EU8/25/2015 McNeil Nutrit ionals, LLC., Splenda McNeil Nutrit ionals, LLC TC Heart land LLC - - - - N.A.8/21/2015 Caesar's Pasta, LLC. - Consolidated Investment Group, LLC - - - - N.A.8/21/2015 B.V. Vurense Snack Industrie NPM Capital N.V.; SHV Holdings Hearthside Group Holdings, LLC - - - - Cross Border8/21/2015 Norbest, LLC - J. D. Heiskell & Company, Inc. - - - - N.A.8/20/2015 Deep Eddy Vodka & Spirits DE Spirits LLC HeavenHill Dist illeries,Inc. - - - - N.A.8/20/2015 The Mediterranean Snack Food - American Halal Company, Inc. - - - - N.A.8/19/2015 Hudson Baking Company, LLC - Le Petit Pain Holdings, LLC - - - - N.A.8/19/2015 Ovation Brands, Inc. Buffets Holdings, Inc. Food Management Partners, Inc. - - - - N.A.8/18/2015 Big Smoke Burger Inc. - MTY Tiki Ming Enterprises Inc. $3.8 - - - N.A.8/16/2015 EWOS Group AS Albain Fund I I I , Bain Capital Cargill, Incorporated $1,495.1 - - - Cross Border8/12/2015 Dave's Killer Bread company Goode Partners LLC Flowers Bakeries, LLC $275.0 - - - N.A.8/11/2015 Niagara Natural Fruit Snack Co., Inc. - SunOpta Inc. (TSX:SOY) $6.7 - - - N.A.8/11/2015 Aqua Farming Technology Inc. Xl Biofuels, Inc New Global Energy, Inc. - - - - N.A.8/7/2015 Pleasant Kids, Inc. (OTCPK:PLKD) - NEXT Group Holdings, Inc. - - - - N.A.8/7/2015 Wallaby Yogurt Company, Inc. - The WhiteWave Foods Company $125.0 2.8x - - N.A.8/7/2015 Irish Pride Bakeries Ltd. - Pat The Baker Ltd - - - - EU8/7/2015 Twin Beans DoubleShot - Twin Beans Coffee - - - - N.A.8/7/2015 Bobby & Fritz GmbH - Autobahn Tank & Rast Holding - - - - EU8/6/2015 Classic Fine Foods UK Ltd EQT Partners AB METRO AG (DB:MEO) $328.0 1.6x - - EU8/5/2015 Boyer's Coffee Company, Inc. - Luna Gourmet Coffee & Tea - - - - N.A.8/5/2015 Gold Pure Food Products Co., Inc. - LaSalle Capital - - - - N.A.8/4/2015 GRUPO CUTTING'S, S.L. - Guzman Gastronomia S.L. - - - - EU8/4/2015 Starr Restaurants Catering Group GP, LLC - TrustHouse Services Group, Inc. - - - - N.A.8/4/2015 Buona Compagnia Gourmet s.r.l. Assietta Private Equity SGR SpA Gradiente SGR S.p.A. - - - - EU8/3/2015 The Kerfoot Group Ltd - Avril SCA - - - - EU8/2/2015 Just Baked LLC - Tubby's Sub Shops Inc. - - - - N.A.8/1/2015 Meatsnacks Group Ltd - Cruga Biltong Ltd. - - - - EU7/31/2015 Ab A.Kastén Oy Helmet Business Mentors Oy Ab Chipsters Food Oy - - - - EU7/31/2015 Litt le Big Burger LLC - American Roadside Burgers, Inc. $6.1 1.0x - - N.A.7/30/2015 Sunrise Growers, Inc. Paine & Partners, LLC; SGF Produce SunOpta Inc. (TSX:SOY) $450.0 1.5x 11.5x - N.A.7/30/2015 Paisley Farm, Inc. - The Fremont Company - - - - N.A.7/30/2015 Thompson Bros. Salmon Limited - Cooke Aquaculture Scotland Ltd. - - - - EU7/30/2015 Direct Ocean SA - Freshpack SA - - - - EU7/29/2015 Sharrocks Fresh Produce Ltd. E.H.Booth & Co Ltd Gilbert Thompson (Leeds) Ltd - - - - EU7/27/2015 Spring Genetics Inc - Benchmark Holdings plc (AIM:BMK) $5.4 - - - Cross Border7/27/2015 The I lkley Brewery Company Limited Glentrool Capital Partners LLP Half Full Beer Co Limited - - - - EU7/25/2015 Acetum S.r.l. - Clessidra SGR S.p.A. - - - - EU7/24/2015 Boojum Ltd. - Renatus Capital Partners $3.3 6.7x - - EU7/24/2015 Taboada Grupo Alimentacio S.L. - Industrias Alimentarias de Navarra - - - - EU7/23/2015 The Feel Good Drinks Company Ltd. MBG International Premium Brands Nichols plc (AIM:NICL) - - - - EU7/23/2015 Louis Royer SAS Suntory France S.A.S. SASU Terroirs Dist illers $109.8 - - - EU7/23/2015 Euro Cakes S.p.A. - Biscuits Bouvard S.A.S - - - - EU7/23/2015 World Feeds Limited - Finance Yorkshire $0.7 - - - EU7/22/2015 Carte Noire, European Business Jacobs Douwe Egberts Trading Luigi Lavazza S.p.A. $871.8 - - - EU7/22/2015 La Rousse Foods Ltd. - ARYZTA Food Solut ions Ireland - - - - EU7/22/2015 Fabrelac bvba - FrieslandCampina Cheese & Butter - - - - EU7/22/2015 B.R. Cohn Winery - Vintage Wine Estates, Inc. - - - - N.A.7/21/2015 The 3D Pub Company Limited Downing ONE VCT plc Brunning & Price Limited - - - - EU7/21/2015 Merrick Pet Care, Inc. Highland Capital; Monitor Clipper Nest lé Purina PetCare Company - - - - N.A.7/21/2015 Cumberland Breweries Ltd. - Alltech, Inc. - - - - Cross Border7/19/2015 Societe Chiron A.C.V.F. (SAS) - Liffey Meats Ltd. - - - - EU7/17/2015 Italian Home Bakery Ltd. - Grupo Bimbo, S.A.B. - - - - Cross Border7/17/2015 Seabrook Crisps Ltd. - LDC (Managers) Limited $54.6 1.3x - - EU
M&A OVERVIEW*
14
FOOD AND BEVERAGEINDUSTRY UPDATE │ OCTOBER 2015
Recent Food and Beverage M&A5
* 2015 M&A transactions include European and cross-border transactions.

PAGE |
October 2015Date Company
10/19/2015 Del Taco Restaurants, Inc. (NasdaqCM:TACO)10/19/2015 Sonic Corp. (NasdaqGS:SONC)10/20/2015 Chipotle Mexican Grill, Inc. (NYSE:CMG)10/20/2015 Brinker International, Inc. (NYSE:EAT)10/21/2015 The Coca-Cola Company (NYSE:KO)10/22/2015 McDonald's Corp. (NYSE:MCD)10/22/2015 Pernod-Ricard SA (ENXTPA:RI)10/22/2015 Koninklijke Wessanen N.V. (ENXTAM:WES)10/22/2015 Dr Pepper Snapple Group, Inc. (NYSE:DPS)10/22/2015 Dunkin' Brands Group, Inc. (NasdaqGS:DNKN)10/26/2015 The Cheesecake Factory Incorporated (NasdaqGS:CAKE)10/28/2015 Panera Bread Company (NasdaqGS:PNRA)10/28/2015 The Hershey Company (NYSE:HSY)10/28/2015 Walgreens Boots Alliance, Inc. (NasdaqGS:WBA)10/28/2015 Cott Corporation (TSX:BCB)10/28/2015 Mondelez International, Inc. (NasdaqGS:MDLZ)10/28/2015 Buffalo Wild Wings Inc. (NasdaqGS:BWLD)10/29/2015 Starbucks Corporation (NasdaqGS:SBUX)10/29/2015 Ingredion Incorporated (NYSE:INGR)10/29/2015 Pilgrim's Pride Corporation (NasdaqGS:PPC)10/29/2015 Maple Leaf Foods Inc. (TSX:MFI)10/29/2015 DineEquity, Inc. (NYSE:DIN)10/29/2015 Fiesta Restaurant Group, Inc. (NasdaqGS:FRGI)10/29/2015 Boston Beer Co. Inc. (NYSE:SAM)10/30/2015 Anheuser-Busch InBev SA/NV (ENXTBR:ABI)
November 2015Date Company
11/2/2015 Sysco Corporation (NYSE:SYY)11/3/2015 Archer-Daniels-Midland Company (NYSE:ADM)11/3/2015 Associated British Foods plc (LSE:ABF)11/3/2015 Kellogg Company (NYSE:K)11/3/2015 Papa John's International Inc. (NasdaqGS:PZZA)11/3/2015 Bloomin' Brands, Inc. (NasdaqGS:BLMN)11/3/2015 Kellogg Company (NYSE:K)11/4/2015 The Wendy's Company (NasdaqGS:WEN)11/4/2015 Asahi Group Holdings, Ltd. (TSE:2502)11/5/2015 Kikkoman Corp. (TSE:2801)11/5/2015 Molson Coors Brewing Company (NYSE:TAP)11/5/2015 Treehouse Foods, Inc. (NYSE:THS)
FOOD AND BEVERAGE EARNINGS RELEASE CALENDAR
15
FOOD AND BEVERAGEINDUSTRY UPDATE │ OCTOBER 2015
Earnings Release Calendar5

Energy, Power& Infrastructure
IndustrialsHealthcare & Life Sciences
Transportation & Logistics
Aerospace, Defense & Government
Services
Business Services
Building Products & Materials
Technology, Media & Telecom
Specialty Distribution
Consumer
PAGE |
HARRIS WILLIAMS & CO. OFFICE LOCATIONS
UNITED STATES EUROPE
BostonTwo International Place24th FloorBoston, Massachusetts 02110Phone: +1 (617) 482-7501
Cleveland1900 East 9th Street20th FloorCleveland, Ohio 44114Phone: +1 (216) 689-2400
Minneapolis222 South 9th StreetSuite 3350Minneapolis, Minnesota 55402Phone: +1 (612) 359-2700
Richmond (Headquarters)1001 Haxall Point9th FloorRichmond, Virginia 23219Phone: +1 (804) 648-0072
San Francisco575 Market Street31st FloorSan Francisco, California 94105Phone: +1 (415) 288-4260
FrankfurtBockenheimer Landstrasse 33-3560325 FrankfurtGermanyPhone: +49 069 3650638 00
London63 Brook StreetLondon W1K 4HS, EnglandPhone: +44 (0) 20 7518 8900
NETWORK OFFICES
BeijingHong KongMumbai
New DelhiShanghai
Consumer
OUR FIRM
FOOD AND BEVERAGEINDUSTRY UPDATE │ OCTOBER 2015
16
Harris Williams & Co. has a broad range of industry expertise, which creates powerful opportunities.Our clients benefit from our deep-sector experience, integrated industry intelligence andcollaboration across the firm, and our commitment to learning what makes them unique. For moreinformation, visit our website at www.harriswilliams.com/industries.

PAGE |
HARRIS WILLIAMS & CO.
1. IMF
2. U.S. Bureau of Labor Statistics
3. Unweighted Average
4. U.S. Census Bureau
5. Capital IQ
6. Thomson Financial
7. S&P
8. Reuters
SOURCES
FOOD AND BEVERAGE
INDUSTRY UPDATE │ OCTOBER 2015
Harris Williams & Co. (www.harriswilliams.com) is a preeminent middle market investment bank focused on the advisory needs of clients worldwide. The firm has deep industry knowledge, global transaction expertise, and an unwavering commitment to excellence. Harris Williams & Co. provides sell-side and acquisition advisory, restructuring advisory, board advisory, private placements, and capital markets advisory services.
Investment banking services are provided by Harris Williams LLC, a registered broker-dealer and member of FINRA and SIPC, and Harris Williams & Co. Ltd, which is authorised and regulated by the Financial Conduct Authority. Harris Williams & Co. is a trade name under which Harris Williams LLC and Harris Williams & Co. Ltd conduct business.
THIS REPORT MAY CONTAIN REFERENCES TO REGISTERED TRADEMARKS, SERVICE MARKS AND COPYRIGHTS OWNED BY THIRD-PARTY INFORMATION PROVIDERS. NONE OF THE THIRD-PARTY INFORMATION PROVIDERS IS ENDORSING THE OFFERING OF, AND SHALL NOT IN ANY WAY BE DEEMED AN ISSUER OR UNDERWRITER OF, THE SECURITIES, FINANCIAL INSTRUMENTS OR OTHER INVESTMENTS DISCUSSED IN THIS REPORT, AND SHALL NOT HAVE ANY LIABILITY OR RESPONSIBILITY FOR ANY STATEMENTS MADE IN THE REPORT OR FOR ANY FINANCIAL STATEMENTS, FINANCIAL PROJECTIONS OR OTHER FINANCIAL INFORMATION CONTAINED OR ATTACHED AS AN EXHIBIT TO THE REPORT. FOR MORE INFORMATION ABOUT THE MATERIALS PROVIDED BY SUCH THIRD PARTIES, PLEASE CONTACT US AT THE ABOVE ADDRESSES OR NUMBERS.
The information and views contained in this report were prepared by Harris Williams & Co. (“Harris Williams”). It is not a research report, as such term is defined by applicable law and regulations, and is provided for informational purposes only. It is not to be construed as an offer to buy or sell or a solicitation of an offer to buy or sell any financial instruments or to participate in any particular trading strategy. The information contained herein is believed by Harris Williams to be reliable, but Harris Williams makes no representation as to the accuracy or completeness of such information. Harris Williams and/or its affiliates may be market makers or specialists in, act as advisers or lenders to, have positions in and effect transactions in securities of companies mentioned herein and also may provide, may have provided, or may seek to provide investment banking services for those companies. In addition, Harris Williams and/or its affiliates or their respective officers, directors and employees may hold long or short positions in the securities, options thereon or other related financial products of companies discussed herein. Opinions, estimates and projections in this report constitute Harris Williams’ judgment and are subject to change without notice. The financial instruments discussed in this report may not be suitable for all investors, and investors must make their own investment decisions using their own independent advisors as they believe necessary and based upon their specific financial situations and investment objectives. Also, past performance is not necessarily indicative of future results. No part of this material may be copied or duplicated in any form or by any means, or redistributed, without Harris Williams’ prior written consent.
Copyright© 2015 Harris Williams & Co., all rights reserved.
DISCLOSURES
17