inequalities in utilisation of maternal health …
TRANSCRIPT

i
University of Witwatersrand
School of Public Health
INEQUALITIES IN UTILISATION OF MATERNAL HEALTH
SERVICES IN ZIMBABWE
Nyasha Madzudzo
Student Number: 876411
A Research Report submitted to the Faculty of Health Sciences,
University of the Witwatersrand, in fulfillment of the requirements
for the degree of
Degree of Master of Public Health
Johannesburg, April 2018

ii
DECLARATION
I, Nyasha Madzudzo, declare that this research report is my original work. All citations, references
and ideas have been acknowledged. This research report is submitted to the Faculty of Health
Sciences, University of the Witwatersrand, Johannesburg, South Africa in partial fulfillment of the
requirements for the degree of Master of Public Health, in the field of Health systems and Policy.
None of the work has been submitted before to this or any other University for any degree or
examination.
Signature: ____________________ Date: __ 03/04/2018________

iii
ABSTRACT
Background: Maternal mortality in developing countries like Zimbabwe is much higher amongst
poorer, rural and less educated communities. Poorer or marginalised communities have the highest
burden of disease and worst health status, but the least access to health care services. The
distribution of health care resources and their use plays a key part in determining health and health
outcomes. This study aims to measure inequalities in the utilisation of key maternal health care
services in Zimbabwe using the PROGRESS-Plus framework, and to examine how the intersection of
these factors create multidimensional advantage and disadvantage.
Methodology: Using Data from the 2015 Zimbabwe Demographic and Health Survey (DHS), the
Concentration Index, Slope Index of inequality and Relative Index of Inequality were computed for
key maternal health care utilisation outcomes. Bivariate and Multiple Logistic Regressions were
computed to determine the PROGRESS-Plus factors associated with utilisation of these services.
Multiple Correspondence Analysis was used to investigate the interaction of multiple PROGRESS- Plus
factors influencing social position.
Results: The majority of women (93.3%) in the 2015 Zimbabwean DHS survey had a skilled ANC
attendant although few of the women (38.5%) had their first ANC visit before four months gestation.
Most women (78.1%) had a skilled birth attendant and delivered at a health facility (77.0%).
Inequalities were higher in delivery care than antenatal care. The utilisation of maternal health
service was higher amongst socially advantaged groups, although the magnitude of the inequality
was small. Higher wealth index, educational attainment and health insurance coverage were
significantly associated with higher maternal health service utilisation. These factors were closely
inter-related with the same group of women having low wealth, low levels of education and no
health insurance.
Conclusion: Inequalities in utilisation of maternal health services favour socially advantaged groups.
Wealth, education and health insurance where the strongest determinants of use of maternal health
care and these factors were interlinked. There is need to consider social protection policies that
reduce the vulnerability of disadvantaged groups of women to access education and work
opportunities
Keywords: Inequality, Maternal Health, Zimbabwe

iv
ACKNOWLEDGEMENTS
I would like to thank my research supervisor Dr Duane Blaauw for setting the bar very high and never
allowing me to take the easy route. Thank you for not giving me all the answers when I asked for
them, but encouraging me to figure things out myself. I have learnt so much about having excellence
as a standard in all that I do.
I would also like to thank my research mentor and future supervisor Professor Jane Goudge. Thank
you for all the opportunities to grow and become a seasoned researcher. I look forward to the next
chapter of my research story.
Special thanks to my husband and friend Kuda, your encouragement and support has enabled me to
get this far. Thank you for taking care of the baby till very late in my office whilst I wrote this report.
It was good practice for the upcoming PhD.
Lastly I would like to thank my parents Eunice and Cleopas for setting me up to succeed, for
supporting me in all my dreams and allowing me to stand on their shoulders. This is just the
beginning of greater things to come.

v
DEDICATION
To my son Tafadzwa Joseph, you are living proof that I can do anything, if I put my mind to it.

vi
TABLE OF CONTENTS
CHAPTER 1. INTRODUCTION .................................................................................................................... 1
1.1. Background.............................................................................................................................. 1
1.2. Literature Review .................................................................................................................... 2
1.2.1. Social Determinants of Health ........................................................................................ 2
1.2.2. Measuring Disparities in Health ...................................................................................... 3
1.2.3. PROGRESS-PLUS Framework ........................................................................................... 5
1.2.4. Intersectionality in Health ............................................................................................... 7
1.2.5. Measurement of Inequalities in Maternal Health ........................................................... 7
1.2.6. Inequalities in Maternal Health ....................................................................................... 8
1.2.7. Zimbabwe: Country Overview ......................................................................................... 9
1.2.8. 2015 Zimbabwe Demographic and Health Survey ........................................................ 10
1.3. Statement of Problem ........................................................................................................... 11
1.4. Study Justification ................................................................................................................. 11
1.5. Study Research Question, Aim and Objectives ..................................................................... 12
CHAPTER 2. METHODOLOGY .................................................................................................................. 14
2.1. Study Design .......................................................................................................................... 14
2.2. ZDHS Study Setting ................................................................................................................ 14
2.3. ZDHS Study Sample ............................................................................................................... 14
2.4. ZDHS Data Collection and Processing ................................................................................... 14
2.5. Measurement ........................................................................................................................ 14
2.6. Data Management ................................................................................................................ 17
2.7. Data Analysis ......................................................................................................................... 18
2.7.1. Inequality in Utilisation of Maternal Health Services .................................................... 18
2.7.2. Logistic Regression ........................................................................................................ 20
2.7.3. Intersectionality in Maternal Health Care ..................................................................... 20
2.8. Research Ethics...................................................................................................................... 21
CHAPTER 3. RESULTS .............................................................................................................................. 22
3.1. Demographic Characteristics ................................................................................................ 22
3.2. Maternal Health Care Utilisation Rates by PROGRESS-PLUS Factors .................................... 23
3.3. Simple Measures of Inequality .............................................................................................. 26
3.4. Complex Measures of Inequality ........................................................................................... 29
3.5. PROGRESS-PLUS Factors Associated with Utilisation of Maternal Health Care Services ...... 32
3.5.1. Skilled Antenatal Care Attendant .................................................................................. 32
3.5.2. First Antenatal Care Visit before Four Months Gestation ............................................. 34
3.5.3. Four or more than Antenatal Care Visits ....................................................................... 35
3.5.4. Skilled Birth Attendant .................................................................................................. 36
3.5.5. Delivery at a Health Facility ........................................................................................... 38
3.6. Intersectionality .................................................................................................................... 39
3.6.1. Skilled Birth Attendant Rates for the Intersection of Four PROGRESS-PLUS Factors ... 39
3.6.2. Multiple Correspondence Analysis ................................................................................ 40

vii
CHAPTER 4. DISCUSSION ........................................................................................................................ 42
4.1. Key Findings ........................................................................................................................... 42
4.2. Study Limitations ................................................................................................................... 43
4.3. Maternal Health Inequality in Zimbabwe ............................................................................. 44
4.4. Maternal Health Inequality in other Low- and Middle-Income Countries ............................ 44
4.5. Determinants of Inequality in Zimbabwe.............................................................................. 45
CHAPTER 5. CONCLUSIONS AND RECOMMENDATIONS ........................................................................ 48
5.1. Conclusions ........................................................................................................................... 48
5.2. Recommendations ................................................................................................................ 48
REFERENCES 50
APPENDIX A: HUMAN RESEARCH ETHICS CLEARANCE CERTIFICATE ..................................................... 54

viii
LIST OF TABLES
Table 2-1: PROGRESS-PLUS predictor variables .................................................................................... 16
Table 2-2: Maternal health outcome variables ..................................................................................... 17
Table 2-3 Binary PROGRESS-PLUS variables .......................................................................................... 20
Table 3-1 Demographic Characteristics of study participants .............................................................. 22
Table 3-2 Utilisation Rates by PROGRESS-PLUS factors ........................................................................ 24
Table 3-3 Simple measures of inequality .............................................................................................. 27
Table 3-4 Complex measures of inequality ........................................................................................... 31
Table 3-5 Predictors of skilled ANC attendance .................................................................................... 33
Table 3-6 Predictors of first ANC visit before four months ................................................................... 35
Table 3-7 Predictors of four or more ANC Visits ................................................................................... 36
Table 3-8 Predictors of skilled birth attendance ................................................................................... 37
Table 3-9 Predictors of delivery at a health facility............................................................................... 38
Table 3-10 Skilled birth attendant utilisation rates by multidimensional social status ........................ 40

ix
LIST OF FIGURES
Figure 1-1: The CSDH Conceptual Framework ........................................................................................ 3
Figure 1-2: Concentration curves and concentration index (CI) ............................................................. 4
Figure 3-1: Differentials in utilisation rates of maternal health care services ...................................... 25
Figure 3-2: Rate differences for maternal care indicators by PROGRESS-PLUS factors ........................ 28
Figure 3-3 Concentration curves for maternal indicators by wealth index .......................................... 30
Figure 3-4 Multiple correspondence analysis of place of residence, educational attainment, wealth
index and health insurance .................................................................................................. 40

x
ACRONYMS AND ABBREVIATIONS
AIDS Acquired Immunodeficiency Syndrome
ANC Antenatal Care
CI Concentration index
FBD Facility-based delivery
HIV Human Immunodeficiency Virus
MTCT Mother to Child Transmission
MRC Medical Research Council
MDG Millennium Development Goals
PROGRESS Place of residence, Race, Occupation, Gender, Religion, Education,
Socioeconomic status and Social capital
PNC Post Natal Care
RII Relative index of Inequality
SDG Sustainable Development Goals
SES Socio-Economic Status
SII Slope Index of Inequality
SCI Standard Concentration Index
STI Sexually transmitted infection
TB Tuberculosis
WHO World Health Organization
ZDHS Zimbabwe Demographic and Health Survey
ZIMSTAT Zimbabwe Statistics Agency

1
CHAPTER 1. INTRODUCTION
1.1. Background
Every day over eight hundred women die due to complications of pregnancy and labour globally(1),
with the four leading causes of death being severe bleeding, pregnancy-induced hypertension,
infections and obstructed labour(2). All of these causes are preventable in the presence of maternal
health interventions(3, 4). Women need access to antenatal care (ANC) during pregnancy so that
health problems that have an unfavourable outcome on pregnancy can be identified early and
treated(4). It is also essential that women have access to a skilled health care worker during delivery
to monitor the labour process, detect problems and complications early, and manage emergencies
that may arise during and immediately after delivery(3). Improving maternal health was one of the
eight Millennium Development Goals (MDG) that were adopted by the one hundred and eight nine
member states of the United Nations in 2000(5). MDG number five sought to reduce by three
quarters the maternal mortality ratio between 2000 and 2015. The indicators for monitoring
progress for MDG-5 were the maternal mortality ratio and the proportion of births attended by
skilled health care workers(5). The new agenda set for maternal health in the Sustainable
Development Goals (SDGs) aims to reduce the global maternal mortality to less than 70 per 100 000
live births by the year 2030(6).
Health inequalities are differences in health status or the distribution of health between population
groups, these differences are often avoidable, and when allowed to persist are unjust and unfair,
therefore become inequities (7, 8). Health inequities are differences in health status that are
systematic, socially produced, and therefore modifiable and maintained by unjust social
arrangements. Not all health inequalities, however, are unfair, for example it is expected that young
adults will be healthier than the elderly, therefore health inequalities are not synonymous with
health inequities(9). Health inequities focus on the distribution of resources that drive a particular
inequality, and grounded on ethical principle of distributive justice(9). Equity in health cannot be
assessed directly but is only defined as the absence of disparities in health(10). Assessing inequities
in health thus requires comparing health and its social determinates among more and less privileged
social groups and making moral judgement of what is fair or unfair(9).
Inequalities in health are universal as evidenced by the global burden of maternal mortality with the
maternal mortality in developing countries being more than 20 times that of developed regions(11).
Sub-Saharan Africa in 2015 had a maternal mortality rate of 546 compared to an MMR of 12 in
developed countries(1, 11). Although there has been some focus on inequalities between regions

2
and countries, unfair differences in health outcomes also exist within countries. Disparities in health
occur amongst population groups due to social stratifying factors (12).
In 2003 the acronym PROGRESS was introduced to highlight the socially stratifying factors that affect
health outcomes(13). PROGRESS refers to the Place of residence, Race, Occupation, Gender, Religion,
Education, Socioeconomic status and Social capital(13). PROGRESS-Plus takes into account other
stratifying factors beyond those emphasised by the acronym(14). This framework has been
recommended as a guideline to use when reporting socially stratifying factors that drive variations in
health(14). Inequalities are however not a result of single distinct factors but a combination of
different social positions, relations of authority and power and other social dynamics that work
together(15, 16). In recent research there is an increased focus on the role of multiple factors that
produce complex interactions of disadvantage, through what has been termed intersectionality
analysis(15-17). These inter-related factors change over time and are dependent on the context and
geographic setting(15, 16). The World health organisation created the Commission on Social
Determinants of Health (CSDH) who’s goal is to advance equity in health by driving action that
reduces the health difference amongst social groups, within and between countries.
According to the World Health Organisation, Zimbabwe has made no advances in maternal health
outcomes such as maternal mortality (11). The country had a 28% increase in the maternal mortality
ratio from 440 per one hundred thousand live births in 1990 to 570 per one hundred thousand live
births in 2000(18). The MMR by 2015 had reduced to 443 thus achieving a -0.7% change in MMR
between 1990 and 2015(11).
1.2. Literature Review
Literature on the measurement of health inequalities will be presented in this section. It will
summarise literature on the different types of measures of inequality and intersectionality analysis,
identify studies that have conducted similar analyses, and provide some background on Zimbabwe
and the Zimbabwe Demographic and Health Survey (DHS).
1.2.1. Social Determinants of Health
The CSDH framework (Figure 1-1) shows how social, economic and political mechanisms give rise a
set of socioeconomic positions where populations are stratified by income, education, gender, race
and other factors. These positions shape individuals exposure and vulnerability to health
compromising conditions.

3
Figure 1-1: The CSDH Conceptual Framework
1.2.2. Measuring Disparities in Health
There are several measures in the literature that have been used for inequalities in health. Mainly
these are the Range, Rate Ratio, Index of Dissimilarity, Effect index, Slope Index of Inequality,
Relative Index of Inequality, and the Concentration index(19-21). These measures can be divided into
simple and complex measures based on the complexity of analysis.
Simple measures
The range is a widely used inequality measure and is simply the absolute difference in health status
between the most advantaged and least advantaged groups(19, 20). The rate ratio expresses this
difference as the ratio of the upper value to lower value(19, 20). The related index of dissimilarity
reflects the uneven distribution of health between groups and is interpreted as the proportion of
people that need to be moved from the most advantaged group to the least advantaged group in
order to achieve an equal distribution of health(19).
Complex Measures
Simple measures such as the rate difference or rate ratio only compare the experiences of the most
disadvantaged to the least disadvantaged but not the population as a whole, thus ignoring
inequalities that exist between groups that are not compared(20). The effect index, however, does
not have this limitation. The effect index is calculated by regressing the dependant variable i.e.
morbidity or mortality rate by an independent variable i.e. an indicator of socioeconomic status(22).

4
If the relationship between these two variables is linear, the slope of the regression line is the
absolute effect. The effect index is interpreted as the effect on the dependant variable of modifying
the independent variable by one unit(22).
The slope index of inequality (SII) and relative index of inequality (RII) are used widely in epidemiology
to measure absolute and relative socioeconomic gradients(23). These indices are calculated by
regression of the dependant variable on a cumulative relative position of the independent variable,
an indicator of socioeconomic position (19-21). The SII is the coefficient of the linear regression
measuring the association between the occurrence of a health outcome and the ordered ranking of
each socioeconomic group on a social scale(19). The SII is thus a weighted measure of inequality
representing the absolute difference in the predicted values of a health indicator between the most
advantaged and the most disadvantaged, whilst considering other intermediary subgroups(24). The
RII is the associated relative inequality measure and reflects the SII as a proportion of the population
mean of the health indicator(24). These measures are therefore regarded as the absolute and
relative effect on health of shifting from the most disadvantaged to the most advantaged groups(19).
A few authors have ordered the rank from highest to lowest, therefore quantifying exposure to a
beneficial position(23). The SII and RII produce a single comprehensive value, for easier and more
valid comparisons between different populations(23).
Figure 1-2: Concentration curves and concentration index (CI)

5
The concentration index (CI) is another important measure of health inequality. It indicates the
extent to which a health indicator is concentrated among the disadvantaged or advantaged on a
socioeconomic scale(24). As shown in Figure 1-2 above, the CI is defined as twice the area between
the concentration curve and the line of equality, producing an index which ranges between -1 and
+1(19, 25). The concentration curve is constructed by plotting the cumulative proportion of the
population from the poorest to the richest against the cumulative proportion of a health outcome
variable(19, 25). If the outcome variable is equally distributed in the social groups then the
concentration curve will be a 45 degree line (line of equality) from the origin, and the CI=0. If the
outcome variable is higher amongst the disadvantaged, the concentration curve lies above the line of
equality, and the CI is defined as a value between 0 and -1 (26). Conversely, if the indicator is
concentrated in the advantaged, the concentration curve lies below the line of equality, and the CI is
a value between 0 and 1 (Figure 1-2).
The standard concentration index (SCI) measures relative inequality. Multiplying the SCI by the
population mean gives a measure of absolute inequality, the generalised concentration index (GCI).
Variations of the GCI and SCI have been proposed for variables that have distinct measurement
attributes(25, 27). Erreygers (28) proposed a modification of the GCI when the variable of interest is
bounded i.e. has a finite upper and lower limit, the Erreygers concentration index (ECI). Erreygers
argued that the index should reveal the same magnitude of inequality when calculated on the basis
of a health variable or ill health variable, since health and ill health mirror each other. The GCI,
however, does not have the mirror property. He also argued that health indicators are often not ratio
scaled and therefore are not invariant to positive linear transformations that are needed for cardinal
health variables. Wagstaff (29) noted that the range of the SCI depends on the mean of the bounded
variable therefore suggested rescaling the S CI to ensure that it always lies between -1 and +1 when
the variable of interest has finite upper and lower limits, the Wagstaff Concentration Index (WCI)
Reviews on measuring disparities in health suggest that the SI and CI are measures that are best
suited to measure socioecomic inequality in health .(19, 30, 31). According to Wagstaff et al (19, 32)
and Kakwani et al(30) both these measures reflect the experiences of the entire population, are
responsive to the changes of the health outcome in the population, and focus on the socioeconomic
dimension of inequality in health.
1.2.3. PROGRESS-PLUS Framework
PROGRESS refers to the Place of residence, Race, Occupation, Gender, Religion, Education,
Socioeconomic status and Social capital(13). PROGRESS-Plus takes into account other stratifying
factors beyond those emphasised by the acronym(14). This framework has been recommended as a
guideline to use when reporting socially stratifying factors that drive variations in health(14).

6
Place of residence is a key determent of health(33) and within the PROGRESS framework often refers
to the rural and urban places of residence but may refer to a particular region in which population
group live. Race refers to the race, ethnicity or cultural background. Language can be used as a proxy
for race because many definition of ethnicity included shared culture and language (13).Racial
inequality arises from the social experience of different racial groups whilst ethnicity is socially
constructed and like race it has an impact of health depending on the context(13). Cultural beliefs
and values disadvantage certain groups from accessing health information and care and language is a
barrier especially when the patient does not speak the same language a s a health care provider(13).
Occupation within the framework encompasses different situation including both formal and
informal employment(13). Occupational status is strongly linked to many health outcomes and
mortality. Gender refers to the socially constructed roles and associated traits(13). Inequities are
driven by gender roles particularly for women(13). Gendered norms affect health seeking behaviour,
health status and access to health care. Religious beliefs and practices affect the health seeking
behaviour and health practices(13). Education is a major determinant of health because it affects
they type of occupation a person is eligible for and thus correlated to income. High levels of
education are associated with healthier lifestyles and more knowledge about healthy behaviours and
preventive measures. Socioeconomic status is correlated to determinants of health such as living
conditions, access to nutrition and financial access to health care.(13)
Social capital, which is the social features of social organisation of that facilitate cooperation and
mutual benefit(34), has been argued to be important for the enhancement of government
performance and functioning and maintaining of population health(35). Social capital refer to the
resources that are as a result of social networking social networks, which advance the sharing of
information and advice during pregnancy and childcare(36). Social capital might influence individual
health in three plausible pathways. First, social capital may influence the health behaviours of a
community by promoting more sharing of health information, increasing the likelihood that healthy
norms of behaviour are adopted and exerting social control over deviant health-related
behaviour(37) Studies show that individuals are at risk of poor health outcomes if they have limited
access to resources such as information(36, 38, 39). Social capital is interrelated with socioeconomic
status, as the income inequality increases in a community the social capital within the community
decreases(35).

7
1.2.4. Intersectionality in Health
In most of the traditional literature on social inequalities in health, the dimensions of inequality are
regarded as separate(40). There is, however, an increasing literature on intersectionality, that
evaluates how various axes of inequality work together in intricate ways to affect individuals’ lives,
social practices and health outcomes (16, 17, 40). The term intersectionality was coined in 1991 by
Crenshaw(41) and has been used in different disciplines to understand the relationship between
various types of social inequality. Different population groups are endowed different social
advantages and disadvantages along various inter-related dimensions(16, 40). Studies in the field of
health show, for example, that women’s vulnerability to ill health and their access to health services
are shaped by social interactions of power that are shaped by race, economic class, gender and
ethnicity together(40, 42, 43).
Intersectional analysis attempts to explore these inter-connections, to evaluate, for example, if the
burden of inequity borne by the poor is also influenced by race or level of education(17).
Quantitative intersectionality analysis is generally based on interacting categorical socioeconomic
variables to generate new intersectional variables that can be included in regression models(17).
1.2.5. Measurement of Inequalities in Maternal Health
A number of similar studies have been conducted to evaluate inequalities in maternal health using
DHS and other nationally representative data in low- and middle-income countries (44-54). These
studies have calculated various measures of inequality including the rate ratio and rate difference
(46, 47, 52), concentration index (48, 49, 52-55), slope index of Inequality (50, 51, 55), and relative
index of inequality(50, 51, 55).
The outcome variables measured in the studies were more than four antenatal visits (48, 54), skilled
antenatal attendant (52), skilled birth attendant (46-49, 53-55), delivery at a health facility (47, 48,
55), use of modern contraception method (53, 55), and caesarean section (49, 52). Most studies
assessed outcomes by sociodemographic factors including socio-economic status, mother’s age at
birth, child’s birth order, ethnic group, marital status, level of education, occupation, and health
insurance. PROGRESS-Plus was used as a framework in the two studies by Wabiri et al (50, 51)
Makate and Makate (54) examined how inequality changed over time between 1994 and 2010 in
Zimbabwe, and decomposed the concentration index to examine how a set of explanatory factors
contributed to the measured health inequalities. Their study found a pro-rich distribution of
inequality in skilled birth attendance and receiving more than four ANC visits. The study further
found a pro-rich distribution of receiving information on gestational complications. The study
showed a widening gap in inequality between the rich and poor over time, which was attributed to

8
the economic crisis causing deterioration in essential sectors such as health, manufacturing, and
agriculture, and which worsened the predicament of the poor(54).
The magnitude of inequalities in use of delivery care was generally larger than for antenatal services,
with a pro-wealthy distribution (48, 52). In Kenya, Namibia and Ethiopia socioeconomic status
measured by wealth index(49, 53) and mothers’ educational attainment (49, 52, 53) were the main
predictors of use of maternal care service. Poor women were found to face many barriers to using
health services such as high cost, poor transportation and inadequate facilities. In Ghana publicly-
funded health care interventions were used more by the rich than the poor(55), reinforcing the claim
that government health spending benefits the rich more than the poor. Mothers’ education was
reported to be a major determinant in many studies, and was attributed to education improving the
ability of mothers to judge when to seek medical care, and to correctly interpret health
messages(55). Education also increased earning opportunities for women which enabled women to
access health care services where payment is required(52).
1.2.6. Inequalities in Maternal Health
This section will highlight the findings of studies that measures inequalities in use maternal health
services in Sub Saharan African and Asian countries, using Demographic and Health Survey data. The
majority of the studies examined change in inequalities over time by comparing finding of successive
DHS surveys.
A study that examined the trends in utilisation of antenatal care and facility based delivery in sub-
Saharan Africa showed that countries with progress toward the MGD target had an increase in ANC
and facility-based delivery (FBD) use over time(44). In countries where there was inadequate
progress toward MDG 5, Zimbabwe being one of the countries reported on, there was a decline in
the rates of use of ANC and FBD over time(44). The study also showed marked urban-rural disparities
in ANC and FBD utilisation rates and wealthier mothers used ANC and FBC in all countries
understudy(44).
In South Africa high levels of inequalities persist, with disparities in social determinants of health
worsening over in the period between 2008 and 2012(51). There were however advances in the
access to maternal health services in the country as a whole as seen by indicators such as early ANC
attendance, HIV testing and deliver with a doctor present rising(51). Overall compared to other race
group black women had the poorest access to key maternal health services such as early ANC and
skilled birth attendance and. Mother’s level of education was also found to be linked to all maternal
outcomes(51). Rural area were found to have the deficiencies in access to services such as a SBA(51).

9
There were regional patterns of deficiency of health services in provinces such as eastern cape and
North West(51).
Large differences in provincial SBA coverage were observed, with utilisation higher in urban areas in
Kenya (49). Wealth, mother’s education and ethnic group were found to be significantly associated
with SBA however, SBA coverage and magnitude of inequalities did not vary over time (49). In
Ethiopia despite an increase in the coverage of maternal health services, inequalities by wealth
persisted over time(53). Socioeconomic status and education were found to be the main predictors
of use maternal health services(53). In Ghana coverage of maternal health services remains low,
with poorest in society having the lowest provision of services(55). There is a pro rich distribution of
services such as SBA, delivery at a health facility and use of modern contraceptive methods with a
pro poor distribution of home delivery(55).
Antenatal care, facility based delivery and caesarean section use favoured the rich however there
are improvements in inequality over time between 2008 and 2013 in Philippines (48). In Namibia
there were differences in utilisation of maternal health services such as antenatal care, SBA and
caesarean section, by geographic region(52). The region where the capital city is located was where
the highest use was observed. Home based deliveries were more common in rural regions(52).
Marked inequalities in the use of SBA and provision of ANC by a skilled attendant were observed by
mothers level of education, with use favouring the educated(52). A pro rich distribution of use of
maternal health was also observed for all maternal health care services of interest measured(52).
The findings from the studies above show that in Sub Saharan Africa there are inequalities in the use
and coverage of maternal health services. Some countries have managed to reduce the magnitude of
inequalities(48), whilst others have remained the same over time(49, 53) and in other cases
increased over time(51). Wealth and mothers level of education was found to be significantly
associated with use if maternal health care services in most studies. Geographic region and ethnicity
was also found to be liked to use in some countries.
1.2.7. Zimbabwe: Country Overview
The Republic of Zimbabwe is a landlocked country in Southern Africa that achieved independence
from Britain in 1980(56). The country had a population of 14.15 million in 2015 with two thirds of the
population residing in rural areas (57). The country is divided into 10 administrative provinces and 52
districts. The districts are further divided into wards.
The Shona are the largest ethnic group and located in the eastern and central parts of the country,
the Ndebele are the second largest ethnic group and are found in the western parts of the country.
Other ethnic groups are the Venda and Shangaan in the south, the Tonga in the north, the Kalanga

10
and Nambya in the far west and the Ndau in the far east(56). According to the 2014 Labour Force
Survey(58) the national literacy rate was 98.0%.
Between independence and the mid-1990s, Zimbabwe developed one of the strongest economies
and health systems in southern Africa. However, economic collapse due to high inflation, low
reserves of foreign currency and high budget deficits lead to a drop in economic indicators(59).
According to The World Bank the GNI per capita fell by 54% between 2000 and 2005, and
unemployment was 94% by the end of 2008(60). In 2015 Zimbabwe the GNI was US$13.48 billion
with a GNI per capita of US$860(60). The economic collapse over recent years has caused the
outmigration of many skilled health workers in search for better wages and working conditions
abroad and in neighbouring African countries.
The providers of health care in Zimbabwe are public health facilities, private clinics and hospitals,
non-profit organisations and company clinics(56). The public health delivery system, the biggest
provider of health care in the country is decentralised into four levels. The primary care level
comprises community based clinics, which are nurse-run but supported by village health workers,
and represent 78% of all health facilities in the country(56). A medical officer-staffed secondary care
level receives referrals from the primary care level and accounts for 3.6% of facilities in the health
system(56). Seven provincial hospitals make up the tertiary care level with doctors and a few
specialists to manage referrals from the secondary level, and accounting for less than 1% of health
facilities(56). The quaternary level consists of six hospitals located in the two largest cities in
Zimbabwe. These facilities have the largest staff complement of specialists and have more advanced
diagnostic and curative equipment(56). In 2009 the expenditure on health was 0.02% of the
country’s GDP, with US$5.77 spent on health per capita from public funds(56).
1.2.8. 2015 Zimbabwe Demographic and Health Survey
The most recent DHS in Zimbabwe was conducted in 2015. The study was a nationally representative
survey implemented by the Zimbabwe Statistics Agency (ZIMSTAT) between July and December in
2015(61). The primary objective of the survey was to provide current estimates of demographic and
health indicators, which are intended to assist policy makers and programme managers to evaluate
and design health programmes and strategies to improve the country’s health(61).
Chapter Nine of the report presented the results of Maternal Health Care, which are pertinent to the
current study. The report presented information on antenatal care (ANC), childbirth and postnatal
care. The first section on ANC showed information about antenatal care from a skilled provider,
timing and number of first ANC visit, and important components of the ANC. The second section
focused on place of delivery, skilled birth attendant and caesarean section deliveries. The final

11
section presents information about postnatal care of the mother and baby. In each section, a figure
showing the trends for coverage of these indicators over the last three DHS surveys is presented. The
chapter ends with summary tables that disaggregate each maternal health care indicator by mother’s
age at birth, birth order of the child, residence i.e. urban and rural, province, mother’s educational
attainment and wealth quintile(61).
1.3. Statement of Problem
Despite an antenatal coverage of 93.7%, 70.1% of women having at least 4 ANC visits, and a skilled
birth attendant rate of 80.0% (62), the maternal mortality has increased in Zimbabwe(18, 62).
Maternal mortality in developing countries such as Zimbabwe is much higher amongst the poorer,
rural and less educated communities. There is evidence that poorer or marginalised communities
have the highest burden of disease and worst health status, but the least access to health care
services(63). An inverse care law has been found to apply to health service utilisation where the
wealthiest in society use most of the health care services yet have the lowest burden of disease and
the least need of health care(64). Because of these potential disparities, it would be important to
investigate the socially stratifying factors that drive variations in the utilisation of maternal health
services in Zimbabwe between different population groups. Furthermore, populations are becoming
progressively diverse, and it would be instructive to move beyond looking at separate analyses of
individual factors driving inequalities, to a multi-level focus that investigates the connections
between these factors, and how the connections combine to create social advantage and
disadvantage for different groups(40).
1.4. Study Justification
Measuring inequalities and examining equity in the area of maternal health is important, as accurate
and internationally comparable measures of maternal care are required to ensure adequate planning
and prioritise the allocation of resources to effective maternal health interventions in targeted
communities and groups that are in most need(10). Health services often contribute to the
aggravation of health inequalities(65) thus there is need mainstream the consideration of equity in
health policies and programs if countries are to achieve national gaols. Routine health information on
use of health services may mask disparities between population groups, therefore there is need to
conduct studies that specifically examine these differences(10).
Makate and Makate conducted a study previously that explores inequalities in maternal healthcare
utilisation in Zimbabwe, which examined the socioeconomic- related inequalities in attending more
than 4 ANC visits and delivery by a skilled attendant(54). The study examined the changes in
inequality of these two variable between 1994 and 2010 using just the Concertation Index (CI). Our

12
study calculated both simple and complex measures of health inequality, that is Rate Ratio (RR), Risk
Rate difference(RD), the Slope index of Inequality (SII), Relative Index of Inequality (RII) and
Concentration index (CI) of five maternal health outcomes using the PROGRESS- PLUS framework. CI
and SII are considered to be most appropriate to measure disparities in health as they reflect the
experiences of the whole population, and are sensitive to changes in the distribution of a health
outcome in the population(19, 30). Whilst these measures mainly reflect the socioeconomic
dimension of disparities in health, health inequalities amongst population groups often connect,
interact and overlap depending on the context(15). The study therefore went beyond the one
dimensional analysis of inequality by only economic class, but also analysed the interaction of
multiple dimensions of socially stratifying factors using the PROGRESS-PLUS framework to identify
the key axes of social stratification(14) which was not done in the previous study. PROGRESS-PLUS is
a framework that has been widely used to inform socially stratifying influences that drive differences
in health outcomes (13, 14, 50). This study therefore generated information about a wider range of
factors that impel inequality of more health outcomes than the previous study.
This information will highlight the inequalities that exist in the utilisation of key maternal health
services in Zimbabwe and how the interaction of various stratifying factors generate disadvantage
along different dimensions. By understanding these factors, how they contribute to inequalities in
maternal health utilisation, and how these factors are connected amongst various population groups,
the study will help identify the social groups that have the greatest potential to reduce equity
gaps(66, 67). This is particularly pertinent to policy makers and designers of health programmes in
the area of maternal in order to establish legislative frameworks and interventions that address the
multiple dimensions of inequality, lead to improved uptake of maternal health services, and lower
maternal mortality. This is necessary to improve Zimbabwe’s prospects of achieving the new
ambitious SDGs targets for maternal health.(65, 68).
1.5. Study Research Question, Aim and Objectives
Research Question
What socioeconomic inequalities exist in the utilisation of maternal health care services In Zimbabwe
and how do these interact across population groups?
Study Aim
To determine the socioeconomic inequalities that exist in the utilisation of maternal health care
services and how the factors driving inequalities interact amongst women aged between 15-49 years
in Zimbabwe using the PROGRESS-PLUS framework.

13
Study Objectives
1. To measure the socioeconomic inequalities in utilisation of maternal health care services in
Zimbabwe.
2. To determine the PROGRESS-PLUS factors that are associated with the use of maternal
health services in Zimbabwe.
3. To determine the intersection of PROGRESS-PLUS factors and how these intersections affect
the utilisation of maternal health care services in Zimbabwe.

14
CHAPTER 2. METHODOLOGY
2.1. Study Design
This study was a secondary data analysis of the Zimbabwe Demographic and Health Survey 2015
(ZDHS), a nationally presentative, cross-sectional household survey.
2.2. ZDHS Study Setting
The Zimbabwe Demographic and Health Survey (ZDHS) is a nationally representative household
survey that has been conducted every five years in Zimbabwe since 1999. The most recent DHS was
conducted in 2015. This data is accessible on the DHS website (http://www.measuredhs.com).
2.3. ZDHS Study Sample
Using the 2012 Zimbabwe National Population Census as a sampling frame, the ZDHS 2015 sample
was identified using a stratified two stage cluster design. In the first phase of sampling, enumeration
areas (EA) of the previous census were the sampling units(61). 400 EAs were sampled with 166 being
urban and 234 rural(61). For each of the EAs sampled a complete housing list was compiled in March
2015 and maps where drawn of each area(61). The housing lists excluded institutional
accommodation such as police and army barracks, boarding schools and hospitals. In the second
phase of sampling, households were the sampling units and a representative sample of 11 196
households was selected from the housing lists.
2.4. ZDHS Data Collection and Processing
Three questionnaires were used to collect data during the ZDHS: a household, male and female
questionnaire. All females aged between 15-49 years and all males aged 15-54 years who were
permanent occupants of the sampled households or guests who had slept in the house the evening
before the survey were included for interviewing(61). Interviewers captured responses of
participants digitally with personal digital assistants (PDA)(61). This data collection tool was
developed by the MEASURE DHS using a mobile version of CSPro software(61). Editing, weighting and
cleaning of the primary data were done using CSPro software, which included checking for structural
and internal consistency. Of the 11196 households identified for inclusion in the survey, 10657 where
found to be inhabited and 10 534 were successfully interviewed thus yielding a 99% response rate.
2.5. Measurement
This study aimed to measure health inequalities in utilisation of health care services amongst
pregnant women in Zimbabwe using data from the 2015 Zimbabwe Demographic and Health Survey.

15
In the DHS report the section on maternal health is mainly descriptive, reporting on the utilisation of
many key maternal health service variables and disaggregating these variables by a few social
stratifying factors such as urban/ rural residence, education and wealth quintiles(61). The secondary
data analysis in this study evaluated more complex measures of health inequalities that were not
calculated in the primary study. This study also used the PROGRESS-Plus as a framework in the
investigation of socioeconomic inequalities in utilisation of maternal health services. The study aimed
to determine which of the PROGRESS-PLUS factors are associated with utilisation of maternal health
care services and examine how the interaction of these factors create inequalities amongst
population groups.
The variables of interest were drawn from two of the three questionnaires: the household and
woman’s questionnaires as outlined below.
PROGRESS-PLUS (Predictor) variables
Mothers age at birth
Place of residence,
Region
Race/Ethnicity,
Occupation,
Religion,
Educational attainment,
Household wealth,
Social Capital,
Health Insurance
Maternal Health Care (Outcome) Variables
Skilled ANC attendant
Timing of first ANC visit,
Number of ANC visits,
Place of delivery,
Type of delivery assistance.
Table 2-1 and Table 2-2 respectively show the predictor and outcome variables used in this analysis,
indicating how they were presented in the original DHS dataset, and how they were recoded to
generate the dataset for the current study.
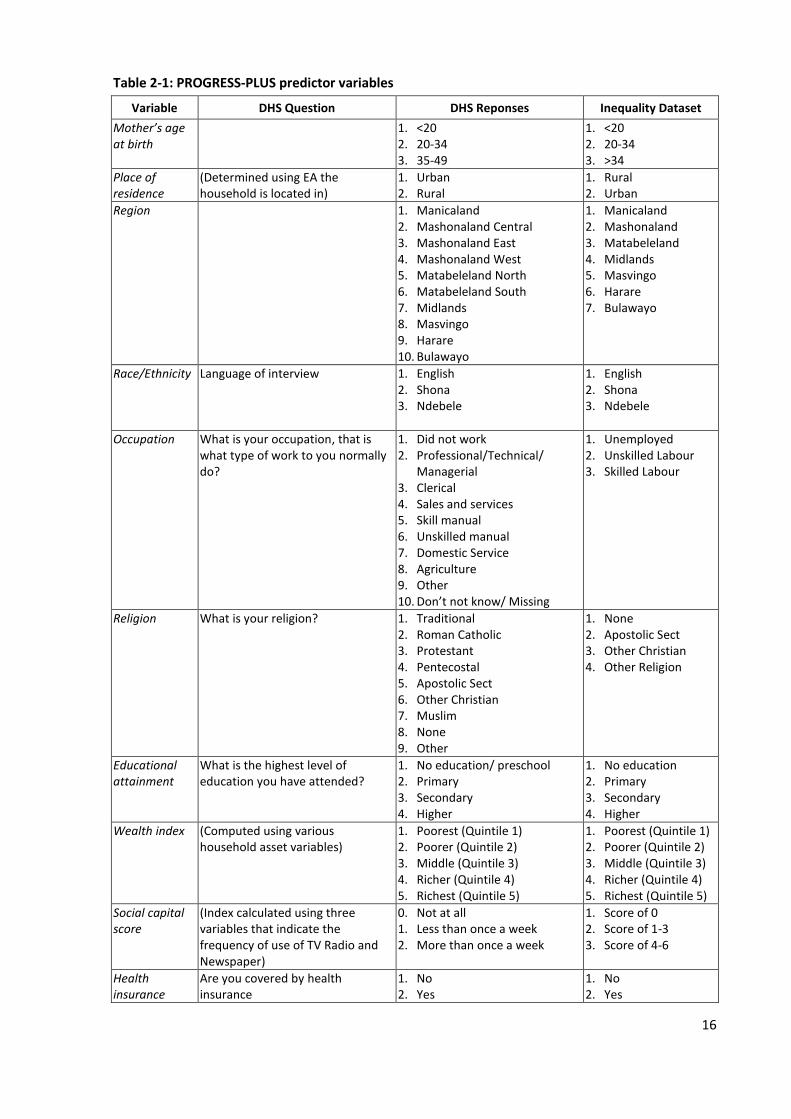
16
Table 2-1: PROGRESS-PLUS predictor variables
Variable DHS Question DHS Reponses Inequality Dataset
Mother’s age at birth
1. <20 2. 20-34 3. 35-49
1. <20 2. 20-34 3. >34
Place of residence
(Determined using EA the household is located in)
1. Urban 2. Rural
1. Rural 2. Urban
Region 1. Manicaland 2. Mashonaland Central 3. Mashonaland East 4. Mashonaland West 5. Matabeleland North 6. Matabeleland South 7. Midlands 8. Masvingo 9. Harare 10. Bulawayo
1. Manicaland 2. Mashonaland 3. Matabeleland 4. Midlands 5. Masvingo 6. Harare 7. Bulawayo
Race/Ethnicity Language of interview 1. English 2. Shona 3. Ndebele
1. English 2. Shona 3. Ndebele
Occupation What is your occupation, that is what type of work to you normally do?
1. Did not work 2. Professional/Technical/
Managerial 3. Clerical 4. Sales and services 5. Skill manual 6. Unskilled manual 7. Domestic Service 8. Agriculture 9. Other 10. Don’t not know/ Missing
1. Unemployed 2. Unskilled Labour 3. Skilled Labour
Religion What is your religion? 1. Traditional 2. Roman Catholic 3. Protestant 4. Pentecostal 5. Apostolic Sect 6. Other Christian 7. Muslim 8. None 9. Other
1. None 2. Apostolic Sect 3. Other Christian 4. Other Religion
Educational attainment
What is the highest level of education you have attended?
1. No education/ preschool 2. Primary 3. Secondary 4. Higher
1. No education 2. Primary 3. Secondary 4. Higher
Wealth index (Computed using various household asset variables)
1. Poorest (Quintile 1) 2. Poorer (Quintile 2) 3. Middle (Quintile 3) 4. Richer (Quintile 4) 5. Richest (Quintile 5)
1. Poorest (Quintile 1) 2. Poorer (Quintile 2) 3. Middle (Quintile 3) 4. Richer (Quintile 4) 5. Richest (Quintile 5)
Social capital score
(Index calculated using three variables that indicate the frequency of use of TV Radio and Newspaper)
0. Not at all 1. Less than once a week 2. More than once a week
1. Score of 0 2. Score of 1-3 3. Score of 4-6
Health insurance
Are you covered by health insurance
1. No 2. Yes
1. No 2. Yes

17
Table 2-2: Maternal health outcome variables
Variable DHS Question DHS Reponses Inequality Dataset
Skilled ANC attendant
Who did you see for ANC for this pregnancy?
1. Doctor 2. Midwife 3. Nurse 4. Village Health Worker 5. Traditional birth attendant 6. Relative/Other 7. No one
1. Unskilled (Village Health Worker Traditional birth attendant Relative/Other No one)
2. Skilled (Doctor Midwife Nurse)
Number of ANC visits
How many times did you receive ANC during this pregnancy?
1. 1 2. 2-3 3. 4 4. Don’t know
1. Less than 4 visits 2. 4 or more visits
Timing of first ANC
How many months pregnant where you when you first received ANC?
1. Less than 4 months 2. 4-5 months 3. 6-7 months 4. 8+ months
1. Before 4 months 2. After 4 months
Place of delivery
Where did you give birth to your baby?
1. Public sector facility 2. Private sector facility 3. Mission hospital 4. Home 5. Other
1. Not in health facility 2. In health facility
Type of delivery assistance
Who assisted with the delivery of your baby?
1. Doctor 2. Midwife 3. Nurse 4. Village Health Worker 5. Traditional birth attendant 6. Relative/Other 7. No one
1. Unskilled 2. Skilled
This study analysed data collected from women aged between 15-49 years reported to have had a
live birth in the five years preceding the survey. Of the 10 351 eligible females identified in
households, 9 955 of these females were interviewed, representing a 96.2 percent response rate(61).
A total of 6 418 live deliveries were reported by these women in the five years prior to the study. It is
data about the place of delivery and presence of a skilled birth attendant of these births that was
used for the analysis of those two outcome variables. Women were asked about ANC use for their
most recent birth. Therefore, data was analysed for the ANC utilisation of the 4 988 most recent
births reported(61).
2.6. Data Management
The data was downloaded from the Measure DHS website (http://www.measuredhs.com) in STATA
format. The variables of interest were drawn from the two questionnaires for the each of the 6 418
participants from the merged KR dataset which has data of all women and children. The variables of

18
interest were recoded using the STATA Version 14 statistical package. New categorical variables were
generated as outlined in Table 2-1 and Table 2-2 above.
Table 2-1 shows the predictor variables. Language of interview was used as proxy of ethnicity. 99.3%
of the population was black, thus race was not included as a predictor variable. The social capital
index was constructed by adding the results of three variables; frequency of watching TV, reading a
newspaper, and listening to the radio. The individual variables were coded from 0 to 2 so the total
score for the three variables ranged between 0 and 6. This score was re-categorised to a three-level
social capital index as follows: 0 for a score of 0; 1 for a score of 1-3; 2 for a score of 4-6.
Table 2-2 shows the outcome variables. All variables were recoded to binary variables using the WHO
guidelines for minimal recommended care for pregnant women(6). All responses originally
categorised as “do not know” where recoded as missing and excluded from analysis.
2.7. Data Analysis
Data was analysed per study objective using STATA Version 14. The primary study involved stratified
two-stage cluster sampling and therefore the STATA svy commands were used for all secondary data
analyses in this study as post stratification weighting to adjust the sample data to conform more to
population parameters(69). The svy command ensures that point estimates, coefficients and
standard errors are produced to adjusted for the sample weighting, stratification and clustering used
to randomly select study participants(69, 70). In all analyses, a p-value of <0.05 was considered as
statistically significant.
2.7.1. Inequality in Utilisation of Maternal Health Services
To examine the socioeconomic inequality the Difference (range), Rate Ratio, Concentration index
(CI), Slope index of inequality (SII) and relative index of inequality (RII) were calculated.
The difference was calculated by subtracting the utilisation rate of the lowest category from the rate
of the highest category for all PROGRESS-Plus factors by each outcome variable. Rate ratio was
calculated by dividing the utilisation rate of the highest category by the utilisation rate of the lowest
category for each PROGRESS-Plus factor by each outcome variable.
The CI was computed using the STATA conindex command(25). The generalised concentration index
(GCI) was computed together with the Wagstaff (WCI) and Erreygers (ECI) normalised concentration
indices, since all maternal health outcome variables of interest are binary and bounded with a lower
limit of 0 and upper limit of 1. The formulas for these calculations are shown in Equation 1, Equation
2, and Equation 3 respectively where hi is the health status of the ith person in the population, Ri is
their fractional socio-economic rank, amin is the lower limit of the health variable , amax is the upper

19
limit of the health variable, and ā is the average health status. The three CI indices were computed
for all outcome variable of interest by all ordinal PROGRESS-PLUS factors.
Equation 1: Standard Concentration Index
Equation 2: Wagstaff Concentration Index
Equation 3: Erreygers Concentration Index
Concentration curves were also drawn for selected variables by plotting the cumulative proportion of
the population ordered by wealth (x-axis) against the cumulative percentage of the outcome variable
(y-axis) e.g. skilled birth attendant (19, 26).
The SII is a coefficient of weighted regression calculated using Equation 4:
Equation 4: Slope Index of Inequality
where ni is the quintile population size, Ri is the rank score of the quintile, and β0 is the health
outcome of the lowest quintile. β1 is then the SII which is the absolute difference in a health outcome
between the lowest and highest quintiles.
The slope and relative indices of inequality were calculated using regression models (71). The STATA
command riigen was used to produce new variables for each of the ordinal PROGRESS-PLUS
predictors, representing the ridit scores or midpoint of the cumulative distribution for each category
of the PROGRESS-PLUS variable(71). The RII and SII were then calculated using generalised linear
model estimation with the log link function to generate the RII, and the identity link function to
generate the SII(71). RII and SII were calculated for all outcome variables by all ordinal PROGRESS-
PLUS factors.

20
2.7.2. Logistic Regression
Bivariate logistic regressions were computed for all maternal health outcome variables by each of the
PROGRESS-PLUS factor. Multiple logistic regression models were then computed for all outcome
variables and including all PROGRESS-PLUS predictor variables.
2.7.3. Intersectionality in Maternal Health Care
This investigation focused only on the skilled birth attendant outcome variable and included only the
four PROGRESS-PLUS predictor variables that proved most significant in the inequality analyses and
logistic regressions, namely wealth, geographical area, education level and insurance status. To
simplify the analysis and interpretation, these were all recoded to binary variables as shown in Table
2-3 below.
Table 2-3 Binary PROGRESS-PLUS variables
PROGRESS-PLUS factor Categories New Binary Variable
Wealth 1. Poorest (Quintile 1) 2. Poorer (Quintile 2) 3. Middle (Quintile 3) 4. Richer (Quintile 4) 5. Richest (Quintile 5)
0. Poor ( Q1-Q2) 1. Rich ( Q3-Q5)
Residence 1. Rural 2. Urban
0. Rural 1. Urban
Education 1. No education 2. Primary 3. Secondary 4. Higher
0. Low (No education & Primary) 1. High (Secondary & Higher)
Health Insurance 1. No 2. Yes
0. No 1. Yes
A new multi-dimensional socio-economic status variable was then calculated to indicate each
individual’s position in relation to the combination or intersection of these four binary variables. For
example, the most advantaged group would be expected to be rich women, with high education and
health insurance, from urban areas. In theory this would produce 16 potential sub-groups (24
possible combinations of four binary variables), but in practice not all of these sub-groups were
represented in the DHS sample (there were no poor women in urban areas, for example). The skilled
birth attendant rates were then compared between the subgroups of the multi-dimensional status
variable.
To further investigate the pattern of relationships between the wealth index, place of residence,
educational attainment and health insurance variables, multiple correspondence analysis (MCA) was
used. The MCA plot was drawn to show the relationship of these four factors on the first two MCA
dimensions.

21
2.8. Research Ethics
Approval to conduct the study was obtained from the University of Witwatersrand Human Research
Ethics Committee. A copy of the clearance letter is attached in APPENDIX A. Permission to download
and use the ZDHS data was obtained from Measure DHS. The downloaded dataset is already
anonymised, with each participant allocated a unique study number. Individual households were also
not identifiable from the dataset due to the geospatial displacement of households during sampling
as well as the large size of the study sample(61).

22
CHAPTER 3. RESULTS
This chapter present the results of the study. Firstly the demographic characteristics of the study
participants are presented then the utilisation rates for all maternal health care services of interest
disaggregated by PROGRESS-PLUS factors are presented. The simple and complex measures of
inequality are presented then the logistic regression analyses are shown which investigate the
PROGRESS-PLUS factors associated with the utilisation of maternal health care services. Finally, the
results of the intersectionality analysis of the skilled birth attendant indicator are reported.
3.1. Demographic Characteristics
Table 3-1 Demographic Characteristics of study participants
Antenatal Care (ANC) N (%)
Delivery Care (DC) N(%)
Age (years) <20 775 (15.6) 1074 (16.7)
20-34 3535 (70.9) 4572(71.2)
>34 678 (13.6) 772(12.0)
Residence Rural 3351(67.2) 4392( 68.4)
Urban 1637(32.8) 2027(31.6)
Region Manicaland 708(14.2) 966(15.1)
Mashonaland 1603(32.1) 2084(32.5)
Matebeland 434(8.7) 526(8.2)
Midlands 678(13.6) 866(13.5)
Masvingo 583(11.7) 764(11.9)
Harare 761(15.3) 950(14.8)
Bulawayo 220(4.4) 262(4.1)
Language English 4325(86.2) 5609(87.4)
Shona 461(9.2) 566(8.8)
Ndebele 202(4.1) 243(3.8)
Occupation Unemployed 2322(47.1) 3025 (47.7)
Unskilled Labour 1192(24.2) 1518(23.9)
Skilled Labour 1415(28.7) 1804(28.4)
Education Attainment No Education 57(1.2) 76(1.2)
Primary 1530(30.7) 2038(31.8)
Secondary 3125(62.7) 3962(61.7)
Higher 274(5.5) 342(5.3)
Religion None 305(6.1) 398(6.2)
Apostolic Sect 2408(48.3) 3228(50.3)
Other Christian 2225(44.6) 2732(42.6)
Other Religions 50(1.0) 60(1.0)
Wealth Index Poorest 1082(21.7) 1477(23.3)
Poorer 956(19.2) 1252(19.5)
Middle 860(17.2) 1098(17.1)
Richer 1183(23.7) 1504(23.4)
Richest 908(18.2) 1087(16.9)
Social Capital None 1316(26.4) 1748(27.2)
Low 2509(50.3) 3259(50.8)
High 1162(23.3) 1411(22.0)
Health Insurance No 4550(91.2) 5888(91.7)
Yes 438(8.9) 530(8.3)
TOTAL 4988(100) 6418(100)

23
Table 3-1 above shows the demographic characteristics of study participants disaggregated by
PROGRESS- PLUS factors. There table shows that 4988 women reported to have had antenatal care
for their most recent pregnancy and 6418 women reported to have had a live birth in the five years
prior to the study. Most women were in the 20-34 year age group (70.9%- ANC, 71.2%- DC) and
resided in urban areas (67.2-ANC, 68.4- DC). The majority of women (86.2%-ANC , 87.4%-DC) used
English as the language for the interview. The largest proportion of women interviewed where
unemployed (47.1%- ANC, 47.7%-DC), had attained secondary education (62.7%-ANC, 61.7%-DC) and
had no health insurance (91.2%-ANC, 91.7%-DC).
3.2. Maternal Health Care Utilisation Rates by PROGRESS-PLUS Factors
Table 3-2 shows the utilisation rates of maternal health services disaggregated by PROGRESS-PLUS
factors. The utilisation rate of a skilled ANC attendant was very high (93.3%), however, very few
women (38.5%) attend their first ANC before four months gestation. Most women (78.1%) have a
delivery with a skilled birth attendant and at a health facility (77.0%).
Women who attained higher education (99.6%), those with health insurance (99.5%) and those in the
richest wealth quintile (98.6%) had the highest skilled antenatal attendant rates. Women who
belonged to the Apostolic Sect (88.9%) and those that resided in Manicaland (86.4%) had the lowest
skilled antenatal attendant rates.
The highest proportion of women attending their first ANC visit before four months gestation were
women who attained higher education (54.2%) , those that reside in Masvingo region (48.1%) and
women aged above 34 years at the time of birth (46.7%). The lowest proportion of women having
their first ANC visit before four months gestation were in other religions (31.5%), richer wealth
quintile (30.9%) and from the Harare region (27.5%) sub groups.
Overall 76.0% of women (N=4988) had more than four ANC visits. Women with health insurance
(90.4%), those who attained higher education (90.2%) and those in the richest wealth quintile (86.2)
had the highest proportion of women with more than four ANC visits during pregnancy. The
subgroups with the lowest percent of women with more than four ANC visits during pregnancy were
women in the poorest wealth quintile (71.4%), women in Midlands region (69.2%) and women with
no religious affiliation (69.1%).
The subgroups with the highest skilled birth attendance rate were women who attained higher
education (99.9%), those with health insurance (96.9%) and women in the richest wealth quintile
(95.7). The lowest skilled birth attendance rate was amongst the women with no education (49.7%),
the poorest wealth quintile (61.7%) and the no social capital (69.5%) subgroups.

24
Table 3-2 Utilisation Rates by PROGRESS-PLUS factors
Skilled ANC Attendant
% (N=4988)
First ANC visit before 4 months
% (N=4988)
More than four ANC visits
% (N=4988)
Skilled Birth Attendant
% (N=6418)
Delivery at a Health Facility
% (N=6418)
Age (years)
<20 94.6 35.9 73.3 77.2 76.9
20-34 93.3 37.5 76.1 78.9 77.6
>34 93.1 46.7 77.9 74.7 72.9
Residence
Rural 92.1 40.7 75.1 71.3 70.0
Urban 95.7 33.9 77.6 92.9 92.1
Region
Manicaland 86.4 37.6 74.6 69.8 69.5
Mashonaland 93.7 40.7 78.4 69.8 68.8
Matebeland 97.4 40.4 79.1 86.0 83.2
Midlands 95.3 38.7 69.2 81.2 80.8
Masvingo 92.8 48.1 78.2 80.1 78.0
Harare 94.1 27.5 73.3 91.3 91.1
Bulawayo 96.4 33.4 78.7 94.8 90.2
Language
English 92.8 38.9 75.4 76.7 75.8
Shona 97.2 37.1 78.2 88.7 85.7
Ndebele 94.4 33.4 81.8 85.1 82.8
Occupation
Unemployed 93.7 38.2 74.9 77.5 76.4
Unskilled Labour 92.2 38.5 74.6 72.9 71.4
Skilled Labour 93.4 38.9 78.4 83.2 82.3
Education Attainment
No Education 93.1 39.1 79.2 49.6 51.5
Primary 89.6 38.9 73.2 65.8 63.7
Secondary 94.5 36.9 75.9 83.1 82.3
Higher 99.6 54.2 90.2 99.9 99.4
Religion
None 94.3 38.7 69.1 73.2 71.8
Apostolic Sect 88.9 35.6 72.5 69.5 68.8
Other Christian 97.8 41.7 80.6 88.9 88.0
Other Religions 96.6 31.5 72.0 79.7 77.0
Wealth Index
Poorest 90.1 38.0 71.4 61.7 60.8
Poorer 91.8 42.6 72.7 70.1 68.2
Middle 93.2 42.1 79.1 77.5 76.1
Richer 93.3 30.9 72.4 88.5 87.5
Richest 98.6 41.3 86.2 95.7 95.2
Social Capital
None 89.5 37.5 71.8 69.5 68.3
Low 93.4 38.3 75.4 77.1 75.9
High 97.1 40.0 81.7 91.0 90.0
Health Insurance
No 92.6 37.1 74.5 76.4 75.2
Yes 99.5 53.2 90.4 96.9 96.8
TOTAL 93.3 38.5 76.0 78.1 77.0
Overall 77.0% of the women (N=6418) had a delivery at a health facility. The highest proportions of
women having deliveries at a health facility were in the higher education (99.4%), health insurance
(96.8%) and richest wealth quintile subgroups. Women with no education (51.5%), primary education
(63.7%) and from the poorest wealth quintile (60.8%) had the lowest proportion of deliveries at a
health facility.
25
Residence
Education
Wealth Index
Social Capital Index
Health Insurance
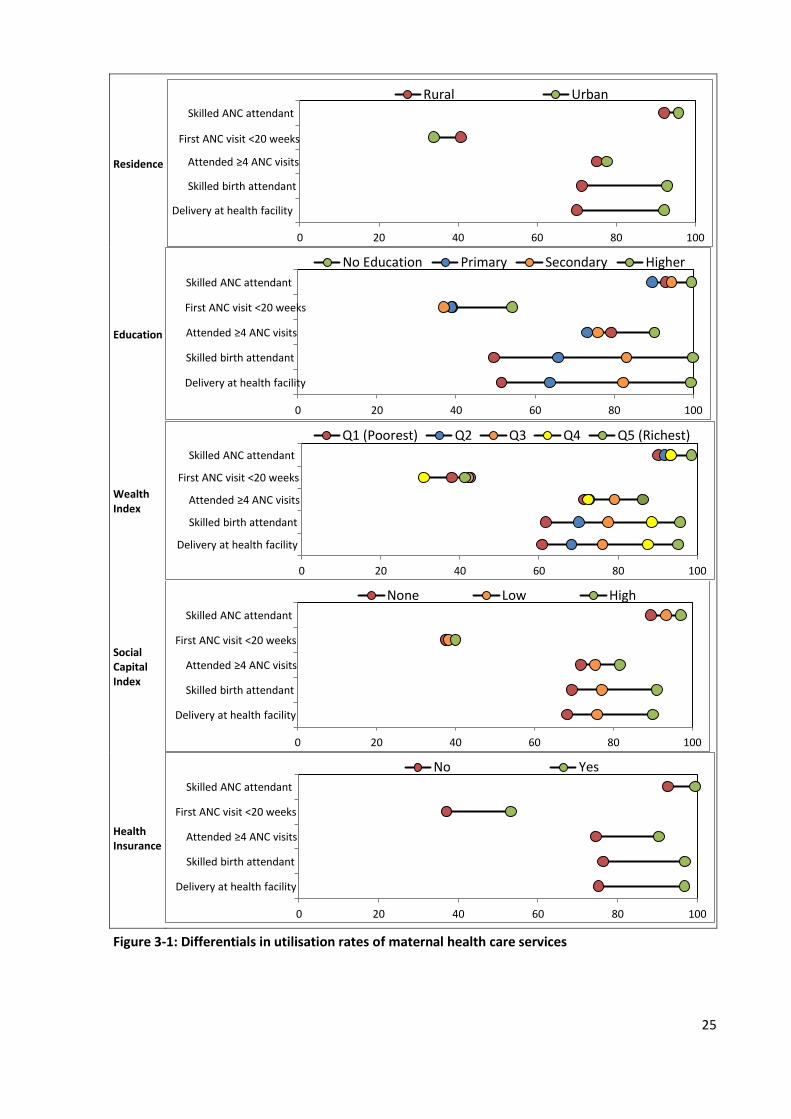
Figure 3-1: Differentials in utilisation rates of maternal health care services
Skilled ANC attendant
First ANC visit <20 weeks
Attended ≥4 ANC visits
Skilled birth attendant
Delivery at health facility
0 20 40 60 80 100
Rural Urban
Skilled ANC attendant
First ANC visit <20 weeks
Attended ≥4 ANC visits
Skilled birth attendant
Delivery at health facility
0 20 40 60 80 100
No Education Primary Secondary Higher
Skilled ANC attendant
First ANC visit <20 weeks
Attended ≥4 ANC visits
Skilled birth attendant
Delivery at health facility
0 20 40 60 80 100
Q1 (Poorest) Q2 Q3 Q4 Q5 (Richest)
Skilled ANC attendant
First ANC visit <20 weeks
Attended ≥4 ANC visits
Skilled birth attendant
Delivery at health facility
0 20 40 60 80 100
None Low High
Skilled ANC attendant
First ANC visit <20 weeks
Attended ≥4 ANC visits
Skilled birth attendant
Delivery at health facility
0 20 40 60 80 100
No Yes

26
Figure 3-1 graphically shows the distribution of maternal Health care services utilisation rates
disaggregated by place of residence, educational attainment, wealth index, social capital and health
insurance status. In general, education and wealth are the factors that show the largest variation in
utilisation rates. The maternal health services that show the widest variation in utilisation are skilled
birth attendant and delivery at a health facility for most of the PROGRESS-PLUS factors outlined.
3.3. Simple Measures of Inequality
Table 3-3 shows the PROGRESS-PLUS sub-groups with the lowest and highest utilisation rates for
each maternal healthcare service indicator, the rate difference and rate ratio of those values with
standard errors, and the p-value testing for a significant difference between the highest and lowest
rates. Overall, small differences were observed in antenatal care related indicators and larger
differences in delivery related care. The ratio of highest to lowest category ranged from 1.01 to 2.00.
The largest difference in skilled ANC rate was between women in Matebeland region and
Manicaland region (difference= 11.0) with women in Matebeland having 1.13 times the skilled ANC
attendant rate of women in Manicaland. The least difference in skilled attendant rate was by age and
occupation. The biggest difference in proportion of women attending their first ANC before four
months is by educational attainment (17.3). Women with higher education had attended their first
ANC visit early 1.47 times more frequently than women with secondary education. The least
difference in attending first ANC by four months was by occupation. Women with higher education
attended more than four ANC visits 1.23 times more the women with primary education
(difference=17.0). The least difference for this indicator was observed by age.
The skilled birth attendant rate of women with higher education and those with no education
(difference=49.8) was the greatest difference in utilisation rates overall, with women that have
attained higher education having twice the skilled birth attendant rate of those with no education.
The least difference in skilled birth attendant rate was observed by maternal age. Large differences in
skilled birth attendant rates were observed by wealth (difference=34.0), region (difference= 21.6),
social capital (difference=21.5), health insurance (difference=20.5) and religion (difference=19.4).
The greatest difference in delivery at a health facility rate was by education ( difference=47.9) with
women with a higher education having deliveries at a health facility 1,93 times more frequently than
women with no education. Large differences where observed in the delivery at a health facility rate
by wealth (difference=34.4), region (difference= 22.0), social capital (difference=21.7), health
insurance (difference=21.7) and religion (difference=19.7).

27
Table 3-3 Simple measures of inequality
Lowest Highest Ratio (SE)
Difference (SE)
p-valve Category Value Category Value
Skilled ANC Attendant
Age >35 93.1 <20 94.6 1.02 (0.02) 1.5 (1.5) 0.302 Residence Rural 92.1 Urban 95.7 1.04 (0.01) 3.6 (1.3) 0.005*
Region Manicaland 86.4 Matabeleland 97.4 1.13 (0.05) 11.0 (3.5) 0.002* Language English 92.8 Shona 97.3 1.05 (0.01) 4.5 (1.1) <0.001*
Occupation Unskilled Labour 92.2 Unemployed 93.7 1.02 (0.01) 1.5 (1.2) 0.232 Education Primary 89.6 Higher 99.6 1.11 (0.02) 10.0 (1.7) < 0.001*
Religion Apostolic Sect 88.9 Other Christian 97.8 1.10 (0.02) 8.9 (1.5) <0.001* Wealth Poorest 90.0 Richest 98.6 1.10 (0.02) 8.6 (1.8) <0.001*
Social Capital None 89.6 High 97.2 1.08 (0.02) 7.6 (1.5) <0.001* Health Insurance No 92.7 Yes 99.5 1.07 (0.01) 6.8 (0.9) <0.001*
First ANC Before 4 Months
Age <20 35.9 >35 46.8 1.30 (0.10) 10.9 (3.1) <0.001* Residence Urban 34.0 Rural 40.8 1.20 (0.07) 6.8 (2.0) 0.001*
Region Harare 27.6 Masvingo 48.0 1.74 (0.19) 20.5 (3.8) <0.001* Language Ndebele 33.4 English 38.9 1.16 (0.12) 5.5 (3.4) 0.112
Occupation Unemployed 38.2 Skilled Labour 39.0 1.02 (0.06) 0.7 (2.2) 0.742 Education Secondary 36.9 Higher 54.3 1.47 (0.12) 17.4 (4.2) <0.001*
Religion Other Religions 31.6 Other Christian 41.8 1.32 (0.33) 10.2 (7.9) 0.195 Wealth Richer 30.9 Poorer 42.7 1.38 (0.10) 11.7 (2.5) <0.001*
Social Capital None 37.6 High 40.0 1.07 (0.07) 2.5 (2.4) 0.308 Health Insurance No 37.1 Yes 53.2 1.43 (0.11) 16.1 (3.7) <0.001*
4 or more ANC Visits
Age <20 73.4 >35 78.0 1.06 (0.04) 4.5 (2.8) 0.103 Residence Rural 75.1 Urban 77.6 1.03 (0.02) 2.5 (1.8) 0.160
Region Midlands 69.2 Matabeleland 79.1 1.14 (0.04) 9.9 (2.7) <0.001* Language English 75.4 Ndebele 81.8 1.08 (0.04) 6.4 (2.8) 0.022*
Occupation Unskilled Labour 74.6 Skilled Labour 78.5 1.05 (0.03) 3.8 (2.0) 0.057 Education Primary 73.3 Higher 90.3 1.23 (0.04) 17.0 (2.6) <0.001*
Religion None 69.1 Other Christian 80.6 1.17 (0.06) 11.5 (3.5) 0.001* Wealth Poorest 71.5 Richest 86.2 1.21 (0.04) 14.7 (2.5) <0.001*
Social Capital None 71.9 High 81.7 1.14 (0.03) 9.9 (2-1) <0.001* Health Insurance No 74.6 Yes 90.5 1.21 (0.03) 15.9 (2.0) <0.001*
Skilled Birth Attendant
<0.001
Age >35 74.7 20-34 78.9 1.06 (0.03) 4.2 (2.0) 0.035* Residence Rural 71.3 Urban 92.9 1.30 (0.03) 21.6 (1.9) <0.001*
Region Mashonaland 69.8 Bulawayo 94.8 1.36 (0.05) 25.0 (2.6) <0.001* Language English 76.8 Shona 88.7 1.16 (0.03) 12.0 (2.0) <0.001*
Occupation Unskilled Labour 73.0 Skilled 83.3 1.14 (0.03) 10.3 (2.1) <0.001* Education No Education 49.7 Higher 99.9 2.01 (0.32) 50.2 (7.8) <0.001*
Religion Apostolic Sect 69.6 Other Christian 88.9 1.28 (0.03) 19.3 (1.9) <0.001* Wealth Poorest 61.7 Richest 95.8 1.55 (0.06) 34.1 (2.6) <0.001*
Social Capital None 69.5 High 91.1 1.31 (0.04) 21.5 (2.3) <0,001* Health Insurance No 76.4 Yes 96.9 1.27 (0.03) 20.5 (1.7) <0.001*
Delivery At A Health Facility
Age >35 72.9 20-34 77.7 1.07 (0.03) 4.8 (2.1) 0.021* Residence Rural 70.0 Urban 92.1 1.31 (0.03) 22.0 (2.0) <0.001*
Region Mashonaland 68.8 Harare 91.1 1.32 (0.05) 22.3 (2.9) <0.001* Language English 75.9 Shona 85.8 1.13 (0.03) 9.9 (2.1) <0.001*
Occupation Unskilled Labour 71.4 Skilled 82.3 1.15 (0.03) 10.9 (2.1) <0.001* Education No Education 51.5 Higher 99.4 1.93 (0.26) 47.9 (7.0) <0.001*
Religion Apostolic Sect 68.3 Other Christian 88.0 1.29 (0.04) 19.7 (1.9) <0.001* Wealth Poorest 60.8 Richest 95.2 1.57 (0.07) 34.4 (2.7) <0.001*
Social Capital None 68.4 High 90.1 1.32 (0.04) 21.7 (2.3) <0,001* Health Insurance No 75.2 Yes 96.8 1.29 (0.03) 21.6 (1.7) <0.001*
p values < 0.05 are shown in bold and marked with an asterisk (*)
Figure 3-2 graphically represents the utilisation rates of the highest and lowest PROGRESS-PLUS
subgroups for each maternal indicator. It shows that skilled ANC attendant, first ANC before four
months and 4 or more ANC visit had the least variation between the lowest and highest PROGRESS-
PLUS subgroups whilst skilled ANC attendant and delivery at a health facility had the largest
differences.

28
Figure 3-2: Rate differences for maternal care indicators by PROGRESS-PLUS factors
Age
Residence
Region
Language
Occupation
Education
Religion
Wealth
Social Capital
Health Insurance
Age
Residence
Region
Language
Occupation
Education
Religion
Wealth
Social Capital
Health Insurance
Age
Residence
Region
Language
Occupation
Education
Religion
Wealth
Social Capital
Health Insurance
Age
Residence
Region
Language
Occupation
Education
Religion
Wealth
Social Capital
Health Insurance
Age
Residence
Region
Language
Occupation
Education
Religion
Wealth
Social Capital
Health Insurance
0 20 40 60 80 100
Lowest Highest
Skilled ANC Attendance
Delivery at Health Facility
First ANC <20 weeks
Attended ≥4 ANC visits
Skilled Birth Attendant

29
Figure 3-2 also shows that utilisation rates for maternal health services were generally above 60%
except for first ANC visit before four weeks gestation. Mother’s age at birth and occupation were the
PROGRESS-PLUS factors with the least variation across all outcome variables. Generally the most
variation was observed for educational status, especially for skilled birth attendant and delivery at a
health facility. Large variations are also observed by wealth index, health insurance and region for all
outcomes.
3.4. Complex Measures of Inequality
Figure 3-3 presents the concentration curves for each of the maternal health utilisation indicators by
wealth index. It shows that the magnitude of inequality of utilisation of antenatal care services is very
small as the concentration curves lie very close to the line of inequality, but there is more inequality
observed for the maternal delivery variables. The first curve for first ANC visit before four months
actually crosses the line of inequality in the intermediate wealth index groups indicating higher
utilisation rates in those groups. The concentration curves for skilled ANC attendant and having more
than four ANC visits lie below the line of equality indicating that higher utilisation of these services is
concentrated amongst the advantaged, although the magnitude of the inequality is very small. The
concentration curves for skilled birth attendant and delivery at a health facility show that utilisation
is also concentrated amongst the advantaged but the magnitude of inequality is larger.
Table 3-4 outlines the complex measures of inequality of all maternal health outcomes by all ordinal
PROGRESS-PLUS factors. The concentration index is a measure showing the extent to which
utilisation of a service concentrated amongst the advantaged or disadvantaged in the population on
a scale from -1 (completely concentrated in the disadvantaged) to 1 (completely concentrated in the
advantaged). The slope index of Inequality is the absolute difference in utilisation rates, whilst the
relative index of inequality is the relative difference in utilisation rates, between the most
disadvantaged and the most disadvantaged. The RII is thus the SII as a proportion of the average
utilisation rate of the population. Numbers that are highlighted in bold indicate indices with
significant p-values (<0.05) when tested for deviations from equality.

30
Skilled ANC Attendant First ANC before 4 months
≥4 ANC visits
Skilled Birth Attendant Delivery at Health Facility
Figure 3-3 Concentration curves for maternal indicators by wealth index
0.2
.4.6
.81
Cum
ula
tive s
hare
of S
kill
ed A
NC
Attendant
0 .2 .4 .6 .8 1
Wealth Index Rank
0.2
.4.6
.81
Cum
ula
tive s
hare
of F
irst A
NC
befo
re 4
month
s
0 .2 .4 .6 .8 1
Wealth Index Rank
0.2
.4.6
.81
Cu
mu
lative
sh
are
of
mo
re t
ha
n 4
AN
C v
isits
0 .2 .4 .6 .8 1
Wealth Index Rank
0.2
.4.6
.81
Cu
mu
lative
sh
are
of
Skill
ed
Birth
Att
end
ant
0 .2 .4 .6 .8 1
Wealth index Rank
0.2
.4.6
.81
Cum
ula
tive s
hare
of D
eliv
ery
at a H
ealth F
acili
ty
0 .2 .4 .6 .8 1
Wealth Index Rank

31
Table 3-4 Complex measures of inequality
Concentration Index (se) Slope Index of
Inequality Relative Index of Inequality
Ranking Variable Standard Index
Wagstaff Index
Erreygers Index
Skilled ANC Attendant
Age -0.002 (0.002) -0.03 (0.028) -0.02 (0.007) -0.02 (0.01) -0.02 (0.06) Residence 0.008* (0.003) 0.13* (0.045) 0.03* (0.011) 0.06* (0.01) 0.07 (0.06)
Occupation -0.001 (0.002) -0.02 (0.038) -0.004 (0.009) -0.001 (0.01) -0.002 (0.06) Education 0.01* (0.003) 0.02* (0.054) 0.05* (0.013) 0.09* (0.01) 0.09 (0.06)
Wealth 0.02* (0.004) 0.23* (0.059) 0.06* (0.014) 0.08* (0.01) 0.08 (0.05) Social Capital 0.02* (0.003) 0.23* (0.046) 0.06* (0.011) 0.08* (0.01) 0.09 (0.06)
Health Insurance 0.006* (0.001) 0.09 (0.011) 0.02* (0.002) 0.10* (0.01) 0.10 (0.10)
First ANC before 4 months
Age 0.03* (0.010) 0.05* (0.016) 0.05* (0.015) 0.11* (0.03) 0.28* (0.10) Residence -0.04* (0.012) -0.01* (0.018) -0.06* (0.017) -0.06* (0.03) -0.17 (0.10)
Occupation 0.004 (0.013) 0.07 (0.020) 0.01 (0.019) 0.04 (0.03) 0.12 (0.09) Education 0.01 (0.012) 0.02 (0.019) 0.02 (0.018) 0.04 (0.03) 0.10 (0.10)
Wealth -0.01 (0.014) -0.02 (0.022) -0.02 (0.021) -0.01 (0.02) -0.04 (0.08) Social Capital 0.01 (0.012) 0.02 (0.018) 0.02 (0.017) 0.04 (0.03) 0.11 (0.09)
Health Insurance 0.03* (0.008) 0.05* (0.012) 0.05* (0.011) 0.29* (0.05) 0.67* (0.13)
4 or more ANC Visits
Age 0.007 (0.005) 0.03 (0.0180 0.02 (0.013) 0.05* (0.03) 0.07 (0.07) Residence 0.007 (0.005) 0.03 (0.021) 0.02 (0.015) 0.10* (0.02) 0.13 (0.07)
Occupation 0.01 (0.005) 0.04 (0.021) 0.03 (0.015) 0.07* (0.02) 0.09 (0.06) Education 0.02* (0.005) 0.07* (0.022) 0.05* (0.016) 0.11* (0.03) 0.13* (0.07)
Wealth 0.03* (0.006) 0.12* (0.026) 0.09* (0.019) 0.13* (0.02) 0.16* (0.06) Social Capital 0.02* (0.005) 0.10* (0.021) 0.07* (0.015) 0.13* (0.02) 0.17* (0.06)
Health Insurance 0.02* (0.002) 0.07* (0.008) 0.05* (0.006) 0.28* (0.03) 0.34* (0.10)
Skilled Birth
Attendant
Age -0.002 (0.004) -0.01 (0.019) -0.01 (0.013) -0.03 (0.02) -0.04 (0.06) Residence 0.06* (0.005) 0.27* (0.024) 0.20* (0.016) 0.42* (0.02) 0.50* (0.06)
Occupation 0.01* (0.005) 0.06* (0.021) 0.04* (0.014) 0.07* (0.02) 0.08 (0.05) Education 0.06* (0.005) 0.28* (0.024) 0.20* (0.016) 0.40* (0.01) 0.47* (0.06)
Wealth 0.09* (0.007) 0.41* (0.031) 0.28* (0.021) 0.41* (0.01) 0.53* (0.05) Social Capital 0.05* (0.006) 0.23* (0.026) 0.16* (0.017) 0.28* (0.02) 0.33* (0.05)
Health Insurance 0.02* (0.002) 0.09* (0.007) 0.06* (0.005) 0.35* (0.02) 0.39* (0.09)
Delivery at a Health Facility
Age -0.005 (0.004) -0.02 (0.019) -0.02 (0.013) -0.04* (0.02) -0.06 (0.06) Residence 0.06* (0.005) 0.27* (0.023) 0.19* (0.016) 0.42* (0.02) 0.52* (0.06)
Occupation 0.01* (0.005) 0.54* (0.021) 0.04* (0.015) 0.07* (0.02) 0.08 (0.05) Education 0.07* (0.005) 0.29* (0.023) 0.20* (0.016) 0.40* (0.02) 0.50* (0.06)
Wealth 0.09* (0.007) 0.40* (0.031) 0.28* (0.021) 0.41* (0.02) 0.54* (0.05) Social Capital 0.05* (0.006) 0.40* (0.025) 0.16* (0.017) 0.29* (0.02) 0.35* (0.05)
Health Insurance 0.02* (0.002) 0.22* (0.007) 0.07* (0.005) 0.37* (0.02) 0.42* (0.09)
p values < 0.05 are shown in bold and marked with an asterisk (*). Standard errors in brackets.
Generally the concentration indices were positive indicating that higher utilisation of maternal health
care services was concentrated among the advantaged in the population. Age, however, had
negative CI values for skilled ANC attendant, skilled birth attendant and delivery at a health facility
indicating that utilisation of services was concentrated more amongst younger women. The largest
inequality in utilisation rates is observed by residence, educational attainment, wealth and health
insurance.
In comparing the different CIs, the standard index generally shows the smallest inequality measure of
the three indices. The Erreygers and Wagstaff correction results in larger values indicating more
inequality. Overall, the Wagstaff Index has the highest values of the three indices across all
PROGRESS-PLUS and maternal health outcomes
The largest inequalities in the skilled ANC attendant rates are by wealth and social capital. The SII
shows that there is an 8% increase in the skilled ANC attendant rate when we move from the poorest
to the richest women and from the women with no social capital to the women with the highest

32
social capital. The table shows that younger women and women who are unemployed have higher
skilled ANC attendant rate than old women and those who are employed respectively.
With regards to attending first ANC before four months, women who reside in rural areas are better
off than those residing in urban areas (SCI=-0.04, WCI=-0.01, ECI=0.06). The SII and RII shows that
there is a 6% absolute and 17% relative increase in attending first ANC before four months gestation
when we move from women in urban areas to women in rural areas. Older women and women with
health insurance are however better off. The largest inequality in women attending first ANC by four
months gestation is by health insurance, there was a 29% absolute and 67% relative increase in rate
attending first ANC by four months from women without health insurance to women with health
insurance.
With respect to attending more than four antenatal care visits, the CIs were all positive indicating
higher utilisation among women with higher level of education, more wealth, higher social capital,
and health insurance. The greatest inequality in attending 4 or more ANC visits is by health insurance
(SII 0.28, RII 0.34) and the least inequality is by age (SII 0.05 RII, 0.07)
The results show that women residing in urban areas, and those with skilled employment, higher
levels of education, richer, higher social capital and with health insurance were better off in having a
skilled birth attendant during delivery. The largest inequality of skilled birth attendant was by wealth.
There was a 41% absolute and 53% relative increase in skilled birth attendant rate when moving from
the poorest to the richest woman. The least inequality was by occupation, with a 7% absolute and 8%
relative increase in skilled birth attendant rate from unemployed to skilled labourers.
Younger women were better off than older women with regards to having a delivery at a health
facility with a 4% absolute and 6% relative decrease in the delivery at health facility rate among older
women. Fairly large inequalities were again observed by wealth index, education level, and health
insurance status for this indicator.
3.5. PROGRESS-PLUS Factors Associated with Utilisation of Maternal Health Care Services
The section presents the results of the bivariate logistic regression and the multiple logistic
regression models for each indicator.
3.5.1. Skilled Antenatal Care Attendant
Table 3-5 shows that women residing in urban areas were 1.92 times more likely to have a skilled
ANC attendant (p=0.004) in the bivariate analysis. However, after adjusting for all other PROGRESS-
PLUS factors the odds ratio decreases such that women in urban areas were 14% less likely to have a

33
skilled ANC attendant than women in rural areas, although this finding is not statistically significant
(p=0.686).
Table 3-5 Predictors of skilled ANC attendance
Bivariate Logistic Regression Multiple Logistic Regression Odds Ratio P-Value Odds Ratio P-Value
Age (years) <20 — — 20-34 0.76 0.193 0.76 0.200 >34 0.77 0.280 0.75 0.224 Residence Rural — — Urban 1.92* 0.004 0.86 0.686 Region Manicaland — — Mashonaland 2.33* 0.028 2.33* 0.029 Matebeland 5.88* <0.001 2.87* 0.009 Midlands 3.25* 0.002 2.82* 0.009 Masvingo 2.02 0.089 1.80 0.143 Harare 2.49* 0.017 1.11 0.791 Bulawayo 4.21* <0.001 1.07 0.900 Language English — — Shona 2.77* <0.001 1.96 0.099 Ndebele 1.31 0.481 1.35 0.477 Occupation Unemployed — — Unskilled Labour 0.80 0.213 0.77 0.172 Skilled Labour 0.96 0.801 0.69* 0.048 Education Attainment No Education — — Primary 0.64 0.412 0.47 0.147 Secondary 1.28 0.664 0.67 0.470 Higher 19.29* 0.001 4.51 0.108 Religion None — — Apostolic Sect 0.48* 0.019 0.49* 0.017 Other Christian 2.69* 0.010 1.80 0.127 Other Religions 1.72 0.576 2.10 0.444 Wealth Index Poorest — — Poorer 1.25 0.316 1.13 0.586 Middle 1.53 0.103 1.28 0.344 Richer 1.54 0.088 1.09 0.825 Richest 7.87* <0.001 3.53* 0.018 Social Capital Score 0 — — 1 1.66* 0.002 1.45* 0.036 2 3.97* <0.001 2.17* 0.009 Health Insurance No — — Yes 15.79* <0.001 3.56* 0.013
Coefficients with p values < 0.05 are shown in bold and marked with an asterisk (*)
Women residing in Mashonaland (OR=2.33), Matebeland (OR=5.88), Midlands (OR=3.25), Harare
(OR=2.49) and Bulawayo (OR=4.21) were more likely to have a skilled ANC attendant than women in
Manicaland. After adjusting for all PROGRESS-PLUS factors the likelihood decreases and the findings
were not significant for women residing in Harare and Bulawayo region. Unskilled labourers
(OR=0.86) and skilled labourers (OR=0.96) were less likely to have a skilled ANC attendant than
unemployed women. After adjusting for all PROGRESS-Plus factors this finding is statistically
significant for skilled labourers who were 31% less likely to have a skilled birth attendant than

34
unemployed women (p=0.048). Women affiliated to the Apostolic Sect were 42% less likely and
those belonging to other Christian denominations were 2.69 times more like to have a skilled ANC
attendant than women with no religious affiliation. After adjusting for all factors this finding is
statistically significant for women in the Apostolic Sect (OR= 0.49).
The likelihood of having a skilled ANC attendant increased with an increase in the wealth index. This
is statistically significant for women in the richest quintile who were 7.87 times more likely to have a
skilled ANC attendant than women in the poorest wealth quintile. After adjusting for all PROGRESS-
PLUS factors women in the richest wealth quintile were 3.53 times more likely to have a skilled ANC
attendant than women in the poorest wealth quintile (p=0.018). The odds of having a skilled ANC
attendant increases with an increase in social capital, after adjusting for all PROGRESS-PLUS factors.
This finding is statistically significant for women with low social capital (OR=1.45) and high social
capital (OR=2.17. Women with health insurance were 15.79 times more likely to have a skilled ANC
attendant than women without health insurance (p=<0.001). After adjusting, women with health
insurance were 3.56 times more likely than women with no health insurance (p=0.013).
3.5.2. First Antenatal Care Visit before Four Months Gestation
Table 3.5 below shows that women aged above 34 years were 1.57 times more likely to have their
first ANC visit before four months than women aged below 20 years and after adjusting for all
PROGRESS-PLUS factors the odds ratio was 1.47. Women residing in urban areas were 25% less likely
to attend their first ANC visit before four month gestation compared to women residing in rural
areas. After adjusting for all PROGRESS-PLUS factors this finding (OR= 0.80) is not statistically
significant. Women residing in the Harare region were 37% less likely to have their first ANC visit
before four months than women residing in Manicaland, whilst women in Masvingo were 1.53 times
more likely to have their first ANC visit before four months. After adjusting for confounding women
in Harare were 42% less likely to have their first ANC visit before four months than women in
Manicaland region. Women that are Ndebele speaking were 2% less likely to have their first ANC visit
before four months than women who are English speaking after adjusting for all PROGRESS-PLUS
factors. Women in the richer wealth quintile were 27% less likely to have their first ANC visit before
four months than women in the poorest wealth quintile. This finding (OR=0.86) is not statistically
significant after adjusting for all PROGRESS-PLUS factors. Women with health insurance were 1.92
times more likely to have their first ANC visit before four months than women with no health
insurance, this finding is statistically significant (OR=1.78) after adjusting for all PROGRESS-PLUS
factors.

35
Table 3-6 Predictors of first ANC visit before four months
Bivariate Multiple Logistic Regression Odds Ratio P-Value Odds Ratio P-Value
Age (years) <20 — — 20-34 1.07 0.458 1.05 0.613 >34 1.57* 0.001 1.47* 0.003 Residence Rural — — Urban 0.75* 0.001 0.80 0.136 Region Manicaland — — Mashonaland 1.14 0.419 1.04 0.798 Matebeland 1.12 0.474 1.38 0.115 Midlands 1.04 0.802 0.95 0.771 Masvingo 1.53* 0.021 1.36 0.092 Harare 0.63* 0.015 0.58* 0.003 Bulawayo 0.83 0.267 0.96 0.849 Language English — — Shona 0.93 0.406 0.71* 0.024 Ndebele 0.79 0.124 0.59* 0.002 Occupation Unemployed — — Unskilled Labour 1.02 0.861 1.02 0.843 Skilled Labour 1.03 0.741 0.98 0.807 Education Attainment No Education — — Primary 1.00 0.993 1.08 0.787 Secondary 0.91 0.749 1.04 0.884 Higher 1.85 0.065 1.66 0.129 Religion None — — Apostolic Sect 0.88 0.345 0.79 0.078 Other Christian 1.13 0.389 1.06 0.701 Other Religions 0.73 0.406 0.66 0.208 Wealth Index Poorest — — Poorer 1.21 0.078 1.21 0.078 Middle 1.18 0.122 1.14 0.231 Richer 0.73* 0.004 0.86 0.352 Richest 1.15 0.251 1.13 0.549 Social Capital Score 0 — — 1 1.03 0.671 1.04 0.630 2 1.11 0.307 1.20 0.109 Health Insurance No — — Yes 1.92* <0.001 1.78* 0.001
Coefficients with p values < 0.05 are shown in bold and marked with an asterisk (*)
3.5.3. Four or more than Antenatal Care Visits
There was an increase in the rate of women attending more than four antenatal visits by wealth with
women in the middle wealth quintile (OR=1.51) and the richest (OR =2.65) more likely to have more
than four ANC visits than women in the poorest wealth quintile (Table 3-7). The likelihood increased
(OR=2.68) for women in the richest wealth quintile after adjusting for all PROGESS factors. The odds
of having more than four ANC visits increased with an increase in social capital score, with women
with the highest score 1.75 times more likely to have more than four ANC visits than those with the
lowest social capital. The results showed the women with health insurance were 3.24 times more
likely to have more than four ANC visits than those without and after adjusting for all PROGRESS-
PLUS factors the likelihood decreased to 1.87 times.

36
Table 3-7 Predictors of four or more ANC Visits
Bivariate Multiple Logistic Regression Odds Ratio P-Value Odds Ratio P-Value
Age (years) <20 — — 20-34 1.15 0.161 1.11 0.312 >34 1.28 0.108 1.18 0.282 Residence Rural — — Urban 1.15 0.160 0.76 0.146 Region Manicaland — — Mashonaland 1.24 0.318 1.25 0.310 Matebeland 1.28 0.236 1.16 0.540 Midlands 0.76 0.202 0.72 0.119 Masvingo 1.22 0.438 1.18 0.506 Harare 0.93 0.752 0.63* 0.035 Bulawayo 1.25 0.339 0.72 0.226 Language English — — Shona 1.17 0.180 1.12 0.575 Ndebele 1.47* 0.038 1.21 0.425 Occupation Unemployed — — Unskilled Labour 0.89 0.872 0.93 0.516 Skilled Labour 1.22 0.043 1.04 0.708 Education Attainment No Education — — Primary 0.72 0.430 0.69 0.379 Secondary 0.83 0.664 0.68 0.365 Higher 2.44 0.081 0.91 0.854 Religion None — — Apostolic Sect 1.18 0.284 1.16 0.338 Other Christian 1.86* <0.001 1.60* 0.008 Other Religions 1.15 0.723 1.18 0.681 Wealth Index Poorest — — Poorer 1.06 0.604 1.03 0.788 Middle 1.51* 0.003 1.46* 0.008 Richer 1.05 0.707 1.28 0.179 Richest 2.50* <0.001 2.68* <0.001 Social Capital Score 0 — — 1 1.20 0.046 1.05 0.579 2 1.75* <0.001 1.26 0.080 Health Insurance No — — Yes 3.24* <0.001 1.87* 0.006
Coefficients with p values < 0.05 are shown in bold and marked with an asterisk (*)
3.5.4. Skilled Birth Attendant
The results in Table 3.7 show that women who reside in urban areas were 5.27 times more likely to
have a skilled birth attendant than women in rural areas but after adjusting for all PROGRESS-PLUS
factors this finding was not statistically significant.

37
Table 3-8 Predictors of skilled birth attendance
Bivariate Multiple Logistic Regression Odds Ratio P-Value Odds Ratio P-Value
Age (years) <20 — — 20-34 1.11 0.358 1.01 0.907 >34 0.87 0.352 0.85 0.325 Residence Rural — — Urban 5.27* <0.001 1.45 0.196 Region Manicaland — — Mashonaland 0.10 0.992 0.97 0.902 Matebeland 2.66* <0.001 1.49 0.188 Midlands 1.87* 0.036 1.65 0.075 Masvingo 1.74 0.057 1.87* 0.025 Harare 4.53* <0.001 1.10 0.757 Bulawayo 7.89* <0.001 1.05 0.904 Language English — — Shona 2.38* <0.001 2.02* 0.011 Ndebele 1.73 0.056 1.43 0.228 Occupation Unemployed — — Unskilled Labour 0.78* 0.024 0.79* 0.039 Skilled Labour 1.45* <0.001 0.88 0.274 Education Attainment No Education — — Primary 1.95* 0.038 1.55 0.203 Secondary 4.99* <0.001 2.31* 0.014 Higher 159.35* <0.001 195.02* <0.001 Religion None — — Apostolic Sect 0.83 0.275 0.77 0.101 Other Christian 2.93* <0.001 1.47* 0.027 Other Religions 1.43 0.352 0.96 0.928 Wealth Index Poorest — — Poorer 1.46* 0.001 1.46* 0.001 Middle 2.15* <0.001 2.01* <0.001 Richer 4.81* <0.001 2.66* <0.001 Richest 14.11* <0.001 4.25* <0.001 Social Capital Score 0 — — 1 1.48* <0.001 1.16 0.172 2 4.46* <0.001 1.44* 0.024 Health Insurance No — — Yes 9.69* <0.001 1.36 0.403
Coefficients with p values < 0.05 are shown in bold and marked with an asterisk (*)
Women in Matebeland (OR=2.66), Midlands (OR=1.74), Masvingo (OR=1.74), Harare (OR=4.53) and
Bulawayo (OR=7.89) have greater odds of having a skilled birth attendant than women in
Manicaland. After adjusting for all confounding variables only the women in Masvingo were 1,87
times more likely to have a skilled birth attendant than women in Manicaland (p=0.025). Unskilled
labourers, however, were 22% less likely to have a skilled birth attendant than women who are
unemployed; this is statistically significant after adjusting for all PROGRESS-PLUS factors (OR=0.79)
Skilled birth attendant rates increase with an increase with level of education, wealth index, social
capital score and health insurance. Women with higher education were 159.3 times more likely to
have a skilled birth attendant than women with no education and the findings were statistically

38
significant after adjusting for all PROGRESS-PLUS factors. Women in the richest wealth quintile were
14.1 times more likely to have a skilled birth attendant than women in the poorest wealth quintile.
The odds of having a skilled birth attendant decreased after adjusting for all PROGRESS-PLUS factors.
Women with the highest social capital score were 4.46 times more likely to have a skilled birth
attendant than those with the lowest score, and those with health insurance were 9.69 times more
likely than those with no health insurance. The likelihood decreased (OR=1.44) and (OR=1.36) for
social capital and health insurance respectively after adjusting for confounders.
3.5.5. Delivery at a Health Facility
Table 3-9 Predictors of delivery at a health facility
Bivariate Multiple Logistic Regression Odds Ratio P-Value Odds Ratio P-Value
Age (years) <20 — — 20-34 1.04 0.708 0.93 0.579 >34 0.81 0.144 0.77 0.107 Residence Rural — — Urban 4.96* <0.001 1.43 0.190 Region Manicaland — — Mashonaland 0.97 0.887 0.93 0.780 Matebeland 2.17* 0.002 1.14 0.627 Midlands 1.85* 0.034 1.61 0.081 Masvingo 1.55 0.121 1.57 0.095 Harare 4.49* <0.001 1.09 0.780 Bulawayo 4.06* <0.001 0.51 0.056 Language English — — Shona 1.92* <0.001 2.10* 0.001 Ndebele 1.53 0.100 1.34 0.274 Occupation Unemployed Unskilled Labour 0.77* 0.016 0.77* 0.018 Skilled Labour 1.43 0.001 0.87 0.223 Education Attainment No Education — — Primary 1.66 0.077 1.27 0.432 Secondary 4.40* <0.001 2.02* 0.025 Higher 158.20* <0.001 19.65* <0.001 Religion None — — Apostolic Sect 0.84 0.292 0.78 0.098 Other Christian 2.87* <0.001 1.47* 0.018 Other Religions 1.31 0.457 0.90 0.780 Wealth Index Poorest — — Poorer 1.39* 0.004 1.37* 0.008 Middle 2.06* <0.001 1.90* <0.001 Richer 4.54* <0.001 2.56* <0.001 Richest 12.80* <0.001 4.28* <0.001 Social Capital None — — Low 1.46* 0.001 1.14 0.246 High 4.20* <0.001 1.36 0.054 Health Insurance No — — Yes 10.07* <0.001 1.57 0.214
Coefficients with p values < 0.05 are shown in bold and marked with an asterisk (*)

39
Women residing in urban areas were more likely to have a delivery at a health facility (OR=4.96) but
after adjusting for confounding this was not statistically significant. Shona speaking women were
1.92 times more likely to have a delivery at a health facility than English speaking women and the
odds increased after adjusting for al PROGRESS-PLUS factors (OR=2.10).
Women belonging to other Christian denominations were more likely to have a delivery at a health
facility than women with no religious affiliation. The likelihood decreased (OR= 1.47) after adjusting
for all PROGRESS-PLUS factors. Delivery at health facility rates increased with an increase with level
of education, wealth index social capital score and health insurance. This was statistically significant
after adjusting for confounding factors.
3.6. Intersectionality
3.6.1. Skilled Birth Attendant Rates for the Intersection of Four PROGRESS-PLUS Factors
Table 3-10 shows the skilled birth attendant (SBA) rates for the multi-dimensional social status
variable constructed by intersecting the four most influential PROGRESS-PLUS factors. The
combinations produced 10 different sub-groups, which are ordered in Table 3-10 from the most
disadvantaged to the most advantaged.
It shows that the utilisation rate ranges from 60.4% amongst the most disadvantaged sub-group to
97.4% in the most advantaged women. Not surprisingly the most disadvantaged sub-group were
poor women residing in rural areas with a low level of education and no health insurance, while rich
women living in urban areas with a high level of education and with health insurance made up the
most advantaged sub-group.
The intersectionality analysis is instructive in comparing different sub-groups. For example, having
higher education increases the skilled birth attendant rate from 60.4% (sub-group 1) to 71.4% (sub-
group 2) among poor, rural women without health insurance. Similarly, an increase in SBA utilisation
rates is observed by the addition of health insurance among rich, urban areas with lower education
(sub-group 7- 85.8% compared to sub-group 8- 95.6%). Also, poor women in rural areas with high
level of education and health insurance have higher utilisation rates (sub-group 3- 73.8%) than rich
women in rural areas with low level of education and no health insurance (sub-group 4- 71.3%).
Utilisation rates also increase with the attainment of higher education amongst women classified as
rich, residing in urban areas, and without health insurance (sub-group 7- 85.8% compared to sub-
group 9- 92.5%).

40
Table 3-10 Skilled birth attendant utilisation rates by multidimensional social status
Sub-Group Wealth Residence Level of
Education
Health
Insurance n SBA (%)
1 Poor Rural Low No 1216 60.4
2 Poor Rural High No 1097 71.4
3 Poor Rural High Yes 5 73.8
4 Rich Rural Low No 404 71.3
5 Rich Rural High No 1003 83.3
6 Rich Rural High Yes 89 96.6
7 Rich Urban Low No 235 85.8
8 Rich Urban Low Yes 12 95.6
9 Rich Urban High No 1598 92.5
10 Rich Urban High Yes 471 97.4
3.6.2. Multiple Correspondence Analysis
Figure 3-4 below shows the plot of the results of the multiple correspondence analyses (MCA) of the
four PROGRESS-PLUS factors.
Figure 3-4 Multiple correspondence analysis of place of residence, educational attainment, wealth index and health insurance
rural
urban
no_education
primary
secondary
higher
poorest
poorer
middle
richer
richest
no
yes
-2-1
01
23
4
dim
en
sio
n 2
( 4
.8%
)
-3 -2 -1 0 1 2dimension 1 (83.6%)
res edu
wealth ins
coordinates in standard normalization
MCA coordinate plot

41
The figure above shows three distinct clusters of women, the most disadvantaged cluster around a
score of 1 on dimension 1 includes women with no education, from wealth quintiles 1-3, residing in
rural areas, and without secondary education. A second cluster is formed around a score of -1 and is
made up of women residing in urban areas, with secondary education and in wealth quintile 4. These
women are intermediary in terms of their relative disadvantage. The third cluster, formed around the
score of -2 is made up of women in wealth quintile 5, with higher education and with health
insurance. Women with these characteristics are the most advantaged in the population.
These findings indicate that these socially stratifying factors are closely inter-related. Multiple
dimensions of disadvantage such as low level education, low wealth index and rural residence occur
together, whilst the multiple axes of advantage such as urban residence, high level of education and
richer wealth quintiles also appear together. Therefore, social position is construed by multiple
factors which are not separate but work together to social advantage and disadvantage.

42
CHAPTER 4. DISCUSSION
This chapter will summarise our key findings, highlight the limitations of the study as well as compare
the results of this study with other inequality studies conducted in Zimbabwe and similar studies
from other low- and middle-income countries.
4.1. Key Findings
This study sought to measure the socioeconomic inequalities that exist in the utilisation of maternal
health care services in Zimbabwe using PROGRESS-PLUS as a framework. Skilled ANC attendance rate
was very high whilst skilled birth attendant, delivery at a health facility rate and 4 or more antenatal
visits rate were intermediary. Very few women had their first visit before four months gestation.
The greatest differences in utilisation rates overall were by level of education, wealth index, health
insurance and geographical region, and the least differences were by mother’s age and occupation.
Generally women with higher levels of education, richer wealth quintiles and women with health
insurance utilised maternal health services more than women from less advantaged groups.
However, younger women appeared slightly better off than the older women in the use of maternal
health care services.
Complex inequality measures showed that the magnitude of inequalities between the most
advantaged and most disadvantaged was generally small for all maternal health outcome variables
available in the DHS dataset. However, inequality was significantly greater in delivery care than for
antenatal care use. Maternal health care services utilisation favoured the expected advantaged
group for all PROGRESS-PLUS variables, except for mother’s age at birth in which service utilisation is
slightly more concentrated among younger than older women.
The geographical region, occupation, religion, wealth index, social capital and health insurance status
were significantly associated with the likelihood of having a skilled birth attendant in logistic
regression analyses, with educational attainment and wealth index being the strongest predictors.
Mother’s age at birth, language and health insurance predicted the odds of having the first ANC visit
before four months gestation whilst religion, wealth index, social capital score and health Insurance
predicted the likelihood of women attending more than four ANC visits. Wealth index and
educational attainment were the strongest predictors of delivery with a skilled birth attendant and
delivery at a health facility, with women in higher wealth quintiles and with higher levels of
education utilising these services more. Overall utilisation of maternal health services was found to

43
increase with high wealth index, higher levels of educational attainment, and having health
insurance.
The intersectionality analysis in this study suggested that the spectrum of advantage and
disadvantage was a construct resulting from the complex interaction of a number of social factors,
especially wealth, educational attainment, place of residence and health insurance.
4.2. Study Limitations
The study was a secondary data analysis and therefore the researcher had no influence on the
variables collected and the quality of the primary data. However, the DHS is a national level study in
which various quality control measures are employed to ensure good quality data is collected. To
enable complete use of the acronym PROGRESS in the secondary study proxies were used for some of the
variables which were not measured in primary. Language of interview was used as a proxy for ethnicity
and a composite score of media use was used as a proxy for social capital. Media use is shown in
literature to contribute to the diversity of peoples networks which improves individuals social capital(72,
73)
Because the primary study is cross-sectional, the observed associations between PROGRESS-PLUS
predictors and maternal health inequalities have not been proven as causal in this study. Stronger
experimental designs would be required to investigate these relationships more thoroughly.
The primary study aimed to measure indicators of key maternal health outcomes and health
behaviours, amongst other indicators. Therefore, the survey sample size was not sufficiently
powered to enable comparisons of very small sub-groups. This would be necessary for more robust
analyses of intersectionality, for example(17). We had intended to include such interaction variables
in the logistic regressions but the sample size was not sufficient for stable estimation. The stratified
two stage cluster sampling method employed in the primary study, however, ensured a nationally
representative sample which was large enough to draw conclusions on the intersection of
PROGRESS-PLUS factors using more simple methods. Furthermore, we were able to show how this
intersection affects the utilisation rates of key maternal health services, such as skilled birth
attendance.
Maternal mortality was not analysed as an outcome measure in our study because of the method
used to calculate maternal mortality in DHS studies. The sisterhood method, which uses the
proportion of adult sisters dying prenatally, during childbirth, or postnatally, reported by adults in
the survey was used to calculate maternal mortality by factoring the number of reported deaths by
age(74). Although this analysis provides a national estimate of maternal mortality in the absence of

44
reliable data from death registers, such data cannot be disaggregated by the PROGRESS-Plus factors
used for the analysis of inequality in this study.
Nevertheless, key process indicators of maternal health are available in the DHS dataset, and were
analysed in this study. They are useful in understanding key issues in the delivery of maternal health
services In Zimbabwe. Furthermore, maternal health service utilisation data was self-reported
through face to face interviews and is thus directly measured, unlike maternal mortality which was
measured indirectly.
4.3. Maternal Health Inequality in Zimbabwe
A similar study was previously conducted in Zimbabwe(54). Makate and Makate (54) sought to
examine the wealth-related inequalities in maternal health care utilisation in Zimbabwe between
1994 and 2011, using the Errygers concentration index for antenatal care, skilled birth attendance,
and receiving information about the pregnancy. This study, like ours, examined inequality using the
Zimbabawe DHS, but focused only on wealth-related inequality, whilst we examined inequality for all
PROGRESS-Plus factors. Unlike our study, Makate and Makate (54) examined how inequality changed
over time between 1994 and 2010, and decomposed the concentration index to examine how a set
of explanatory factors contributed to the measured health inequalities. Their study found a pro-rich
distribution of inequality in skilled birth attendance and receiving more than four ANC visits, which
was corroborated in our analysis. The study further found a pro-rich distribution of receiving
information on gestational complications, an outcome which our study did not measure. The earlier
study showed a widening gap in inequality between the rich and poor over time, which was
attributed to the economic crisis causing deterioration in essential sectors such as health,
manufacturing, and agriculture, and which worsened the predicament of the poor(54).
This upward trend in inequality was also observed in other studies for antenatal care use(44) and
skilled birth attendant(75). The decomposition analysis by Makate and Makate (54) showed that
wealth, education, place of residence and health insurance contribute the largest share of observed
inequalities. Although we did not perform a decomposition analysis, our study also showed that the
greatest inequality was observed in these variables, when complex measures of inequality where
computed, or when these variables were used as predictors of utilisation in the multiple regression
analyses.
4.4. Maternal Health Inequality in other Low- and Middle-Income Countries
The analysis of socioeconomic inequalities in maternal health service utilisation data has been
performed using DHS data in a number of other low- and middle-income countries(48, 49, 52, 53,

45
55). Various maternal health outcome variables were measured such as skilled birth attendant (48,
49, 53), skilled antenatal attendant (52), more than four antenatal visits (48), and facility based
delivery (53, 55) - outcomes which were also measured in our study. Other outcome variables
measured, which we did not include in our analysis, were use of modern methods of
contraception(53, 55), postnatal care(52), and birth by caesarean section(48, 52, 55).
Most studies used the concentration index to measure the magnitude of inequality(48, 49, 52, 53), as
well as the slope index of inequality(55), and the relative index of inequality(55). The magnitude of
inequalities in use of delivery care was generally larger than for antenatal services, with a pro-
wealthy distribution (48, 52), which is similar to our findings. Similarly, in Kenya, Namibia and
Ethiopia socioeconomic status measured by wealth index(49, 53) and mothers’ educational
attainment (49, 52, 53) were the main predictors of use of maternal care service. Poor women were
found to face many barriers to using health services such as high cost, poor transportation and
inadequate facilities. In Ghana publicly-funded health care interventions were used more by the rich
than the poor(55), reinforcing the claim that government health spending benefits the rich more
than the poor. Mothers’ education was reported to be a major determinant in many studies, and was
attributed to education improving the ability of mothers to judge when to seek medical care, and to
correctly interpret health messages(55). Education also increased earning opportunities for women
which enabled women to access health care services where payment is required(52).
4.5. Determinants of Inequality in Zimbabwe
The health delivery platform in Zimbabwe may influence the inequality of service utilisation between
the poor and the rich. Wealthier patients have been shown to use higher levels of care such as
provincial and central hospitals more frequently, therefore benefitting more from public health
subsidies which are biased towards higher levels of care(76). Historically central and provincial
hospital are funded by central government whilst community-based clinics and mission hospitals are
donor-funded or financed by the consumers of the services through user fees(56, 76). As a result,
central hospitals located in urban areas are better resourced than rural health centres.
Also, due to the economic crisis in Zimbabwe, many skilled health workers left to work in
neighbouring countries and overseas, in response to lower wages and worsening working
conditions(56). Doctors in provincial hospitals and nurses in rural health centres, areas that service
the poor, were the most likely to leave their positions. Although the government, mainly through
donor support, implemented various financial incentives to retain skilled workers in rural areas,
retention allowances offered were not as competitive as salaries abroad. Furthermore these
allowance where unfortunately frequently neither paid in full nor on time(56).

46
Similar to our results, women’s education has emerged as a key factor in the utilisation of maternal
health services in Zimbabwe in other studies, particularly for more than four antenatal care visits and
for skilled birth attendance(54, 77). Zimbabwe has relatively high levels of literacy and primary school
attendance compared to other sub-Saharan countries, but secondary school attendance continues to
be low(78). Although the literacy rate of Zimbabwe was 98% in 2014 only 50.4% of children between
15-19 years were attending school(58). Moreover the calculation of literacy is based on completion
of grade three(58) which is a very low level of education, and was associated with relatively low
utilisation rates in our analyses. Education is not free in Zimbabwe and many families struggle to
send their children to school(79). The economic climate of the 2000s also saw the out-migration of
teachers and frequent industrial action leading to a drop in school attendance and a deterioration in
the quality of education, with schools in marginalised areas most affected(79).
Education plays a key role in the development of a society and according to Grossman(80) education
is said to cause changes in health outcomes by three main ways. Firstly, education makes people
more adherent to treatment through knowledge of impacts of their health behaviour. Secondly, it
makes people more aware of different treatments therefore impacting their preventative behaviour
and choice of care. Thirdly, education leads to a higher income which increases one’s purchasing
power, therefore greater access to better health care services. These theories have been tested in
Zimbabwe for the impact of maternal education on child survival, which is closely linked to maternal
health(81). This study showed an increase in child survival for every extra year in a mother’s
education (82). Our study showed an increase in the likelihood of maternal health service utilisation
with increasing educational attainment, especially secondary and higher education. This suggests
that ensuring women attain secondary and higher education might be an effective way to improve
maternal health outcomes.
The Zimbabwean Economic Structural adjustment Programme (ESAP) was introduced in 1991. ESAP
saw the introduction of cost sharing and user fees in both health and education(83). This became a
barrier to access for both health care and education and affecting the poor the most. Service delivery
and access to health was worsened by the economic crisis of the 2000s, characterised by
hyperinflation, low foreign currency reserves and high budget deficits, which lead to poor health
financing and enormous budget cuts(84). The economic climate in Zimbabwe may explain out
multiple correspondence analysis findings in which low wealth index, low education, no health
insurance and rural residence characterises the same group of disadvantaged women on a social
scale.
Although our study did not find religion as a major determinant of maternal health care utilisation, a
previous study conducted in Zimbabwe showed that affiliation to the Apostolic sect is associated

47
with a reduced likelihood of accessing maternal health services, including attending four ANC visits
and having a skilled birth attendant(77). Women in the Apostolic sect were worse off than women
from other religions despite the services being available at little to no cost, and when other
socioeconomic factors were considered (77). Religious teaching in the Apostolic sect shapes health
seeking behaviour by emphasising strong doctrines of faith healing and strict adherence to church
belief and practices which decrease the use of modern healthcare services(85). Apostolic sect
membership has also been found to be correlated with a poor socioeconomic status(77), although
this was not identified in our analyses. However, the apostolic faith does not represent one
homogenous group but rather three subgroups with varying emphasis on faith healing and
adherence to church beliefs against the use of modern medicine(85), but we did not have data on
these distinctions to explore in our study.

48
CHAPTER 5. CONCLUSIONS AND RECOMMENDATIONS
5.1. Conclusions
This study sought to measure the socioeconomic inequalities that exist in the utilisation of maternal
health care services in Zimbabwe using PROGRESS-PLUS as a framework. Measuring inequalities in
maternal health is essential, as accurate and internationally comparable measures of maternal care
are required to ensure adequate planning and prioritise the allocation of resources to effective
maternal health interventions in targeted communities and population groups which are in most
need. The more complex methods used in this study to measure disparities are more suitable
because they reflect the experiences of the whole population.
Skilled ANC attendance rate was very high whilst skilled birth attendant, delivery at a health facility
rate and 4 or more antenatal visits rate were intermediary. Very few women had their first visit
before four months gestation. The magnitude of inequalities between the most advantaged and
most disadvantaged was generally small for all maternal health outcomes, however inequality was
significantly greater in delivery care than for antenatal care use. Health care during delivery is closely
linked to maternal mortality. The greater inequalities in delivery care observed in this study may
explain why maternal mortality is still very high in Zimbabwe.
The spectrum of advantage and disadvantage was revealed as a multi-dimensional construct
resulting from the complex interaction of a number of social factors, especially wealth, educational
attainment, place of residence and health insurance. Maternal health care services utilisation
favoured the expected advantaged group for all PROGRESS-PLUS variables, except for mother’s age
at birth in which service utilisation is slightly more concentrated among younger than older women.
Generally women with higher levels of education, richer wealth quintiles and women with health
insurance utilised maternal health services more than women from less advantaged groups.
5.2. Recommendations
The study findings suggest a number of recommendations for maternal health delivery, human and
economic development, as well as future research.
The lowest utilisation rates observed in this study were for attending antenatal care before four
month, therefore in terms of maternal health services and the health system in Zimbabwe, policy and
strategies that address the barriers to early antenatal care are required. Early antenatal care is
linked to institutional delivery which is associated with better maternal outcomes and removing
barriers to early antenatal care could possibly result in further gains in the observed facility delivery
and delivery by a skilled attendant rates. A potential strategy could be the removal of user fees for

49
pregnant women at primary health care facilities, thus enabling poorer women without health
insurance to access health care services earlier during pregnancy. This perhaps may be augmented by
redirecting some government subsidies from urban located central hospitals, which are located in
urban areas only, down to primary facilities which are more accessible to poor and marginalised
women, who showed the lowest utilisation rates in this study.
Initiatives are also required to support the personal and economic development of women in
Zimbabwe. A woman’s level of education is a major factor determining the use of maternal care.
Improvement in the education level of women has been shown to be beneficial for both maternal
and child health outcomes. The government therefore needs to explore ways to improve the
education of women. Due to the complexities around the construct of disadvantage related to
economic challenges the country faced over the last two decades, there is need to for a multi
sectoral approach beyond just the health sector to develop human capital in the country. The
inequalities in maternal health by both income and education highlight the importance of the
broader social and economic environment, thus strategies should aim to address these various axes
of inequality that affect women in Zimbabwe(86).
This study was an initial descriptive study but also suggests priorities for future research. We were
able to draw nationally representative conclusions on the intersection of PROGRESS- PLUS factors
using simple methods, however, in future larger samples are required to conduct robust analysis of
intersectionality. Data from the national census could possibly be used for such an analysis if key
questions on maternal health are incorporated into the survey. Furthermore, although PROGRESS-
Plus is a framework to identify the most important factors that drive inequalities in health, the extent
to which the acronym characterises disadvantage depends on the country context(13). It may be
useful to explore for further study the effect of other factors, such as distance travelled to health
facility and mother’s health status, to determine country specific factors that drive utilisation
inequality in the Zimbabwean context.

50
REFERENCES
1. World Health Organization. Trends in maternal mortality: 1990 to 2013. Estimates by WHO, UNICEF. UNFPA, The World Bank and the United Nations Population Division Geneva, World Health Organization http://appswhoint/iris/bitstream. 2014;10665(112682):2.
2. Say L, Chou D, Gemmill A, Tuncalp O, Moller AB, Daniels J, et al. Global causes of maternal death: a WHO systematic analysis. The Lancet Global health. 2014;2(6):e323-33.
3. World Health Organization. The World Health Report: 2005: make every mother and child count: overview 2005 [Available from: http://www.who.int/whr/2005/overview_en.pdf?ua=1.
4. Villar J, Ba'aqeel H, Piaggio G, Lumbiganon P, Belizán JM, Farnot U, et al. WHO antenatal care randomised trial for the evaluation of a new model of routine antenatal care. The Lancet. 2001;357(9268):1551-64.
5. UN Department of Economic and Social Affairs. Official list of MDG Indicators. UN Department of Economic and Social Affairs–Statistics Division, New York. 2008.
6. World Health Organization. Strategies towards ending preventable maternal mortality (EPMM). 2015.
7. Arcaya MC, Arcaya AL, Subramanian S. Inequalities in health: definitions, concepts, and theories. Global health action. 2015;8.
8. Kawachi I, Subramanian S, Almeida-Filho N. A glossary for health inequalities. Journal of epidemiology and community health. 2002;56(9):647-52.
9. Braveman P, Gruskin S. Defining equity in health. Journal of Epidemiology & Community Health. 2003;57(4):254-8.
10. Whitehead M, Dahlgren G. Concepts and principles for tackling social inequities in health: Levelling up Part 1. World Health Organization: Studies on social and economic determinants of population health. 2006;2.
11. World Health Organization, UNICEF. Trends in maternal mortality: 1990-2015: estimates from WHO, UNICEF, UNFPA, World Bank Group and the United Nations Population Division. 2015.
12. Say L, Raine R. A systematic review of inequalities in the use of maternal health care in developing countries: examining the scale of the problem and the importance of context. Bull World Health Organ. 2007;85(10):812-9.
13. O'Neill J, Tabish H, Welch V, Petticrew M, Pottie K, Clarke M, et al. Applying an equity lens to interventions: using PROGRESS ensures consideration of socially stratifying factors to illuminate inequities in health. Journal of clinical epidemiology. 2014;67(1):56-64.
14. Tugwell P, Petticrew M, Kristjansson E, Welch V, Ueffing E, Waters E, et al. Assessing equity in systematic reviews: realising the recommendations of the Commission on Social Determinants of Health. BMJ: British Medical Journal. 2010;341(7778):873-7.
15. Iyer A, Sen G, Östlin P. The intersections of gender and class in health status and health care. Global Public Health. 2008;3(S1):13-24.
16. Hankivsky O. Women’s health, men’s health, and gender and health: Implications of intersectionality. Social science & medicine. 2012;74(11):1712-20.
17. Sen G, Iyer A, Mukherjee C. A methodology to analyse the intersections of social inequalities in health. Journal of Human Development and Capabilities. 2009;10(3):397-415.
18. World Health Organization. Zimbabwe: Maternal and Perinatal Health Profile 2013 [Available from: http://www.who.int/maternal_child_adolescent/epidemiology/profiles/maternal/zwe.pdf?ua=1.
19. Wagstaff A, Paci P, Van Doorslaer E. On the measurement of inequalities in health. Social science & medicine. 1991;33(5):545-57.
20. Munoz-Arroyo R, Sutton M. Measuring socio-economic inequalities in health: a practical guide. Edinburgh: ScotPHO. 2007.
21. O'Donnell O, Van Doorslaer E, Wagstaff A, Lindelow M. Analyzing health equity using household survey data. World Bank Institute Learning Series. 2008.

51
22. Schneider MC, Castillo-Salgado C, Bacallao J, Loyola E, Mujica OJ, Vidaurre M, et al. Methods for measuring health inequalities (Part III). Epidemiol Bull. 2005;26(2):12-5.
23. Moreno-Betancur M, Latouche A, Menvielle G, Kunst AE, Rey G. Relative index of inequality and slope index of inequality: a structured regression framework for estimation. Epidemiology. 2015;26(4):518-27.
24. Hosseinpoor AR, Nambiar D, Schlotheuber A, Reidpath D, Ross Z. Health Equity Assessment Toolkit (HEAT): software for exploring and comparing health inequalities in countries. BMC medical research methodology. 2016;16(1):141.
25. O'Donnell O, O'Neill S, Van Ourti T, Walsh B. conindex: Estimation of concentration indices. The Stata journal. 2016;16(1):112.
26. O'Donnell OA, Wagstaff A. Analyzing health equity using household survey data: a guide to techniques and their implementation: World Bank Publications; 2008.
27. Erreygers G, Van Ourti T. Measuring socioeconomic inequality in health, health care and health financing by means of rank-dependent indices: A recipe for good practice. Journal of Health Economics. 2011;30(4):685-94.
28. Erreygers G. Correcting the concentration index. Journal of health economics. 2009;28(2):504-15.
29. Wagstaff A. The bounds of the concentration index when the variable of interest is binary, with an application to immunization inequality. Health economics. 2005;14(4):429-32.
30. Kakwani N, Wagstaff A, Van Doorslaer E. Socioeconomic inequalities in health: measurement, computation, and statistical inference. Journal of econometrics. 1997;77(1):87-103.
31. Mackenbach JP, Kunst AE. Measuring the magnitude of socio-economic inequalities in health: an overview of available measures illustrated with two examples from Europe. Social science & medicine. 1997;44(6):757-71.
32. Wagstaff A, Van Doorslaer E. Income inequality and health: what does the literature tell us? Annual review of public health. 2000;21(1):543-67.
33. Solar O, Irwin A. A conceptual framework for action on the social determinants of health. 2007. 34. Coleman JS. Foundations of social theory Harvard: Belknap Press of Harvard University Press;
1990. 35. Kawachi I, Kennedy BP, Lochner K, Prothrow-Stith D. Social capital, income inequality, and
mortality. American journal of public health. 1997;87(9):1491-8. 36. Gage AJ. Barriers to the utilization of maternal health care in rural Mali. Social science &
medicine. 2007;65(8):1666-82. 37. Brehm J, Rahn W. Individual-level evidence for the causes and consequences of social capital.
American journal of political science. 1997:999-1023. 38. Kunitz SJ. Social capital and health. British Medical Bulletin. 2004;69(1):61-73. 39. Kawachi I, Berkman L. Social cohesion, social capital, and health. Social epidemiology. 2000:174-
90. 40. Sen G, Iyer A. Who gains, who loses and how: leveraging gender and class intersections to
secure health entitlements. Social science & medicine. 2012;74(11):1802-11. 41. Crenshaw K. Mapping the margins: Intersectionality, identity politics, and violence against
women of color. Stanford law review. 1991:1241-99. 42. Sen G, George A, Östlin P. Engendering international health: The challenge of equity: MIT Press;
2002. 43. Lynch J, Kaplan G. Socioeconomic position: Social Epidemiology. New York: Oxford University
Press; 2000. 44. Alam N, Hajizadeh M, Dumont A, Fournier P. Inequalities in Maternal Health Care Utilization in
Sub-Saharan African Countries: A Multiyear and Multi-Country Analysis. PLoS ONE. 2015;10(4):1-16.
45. Alkenbrack S, Chaitkin M, Zeng W, Couture T, Sharma S. Did Equity of Reproductive and Maternal Health Service Coverage Increase during the MDG Era? An Analysis of Trends and Determinants across 74 Low- and Middle-Income Countries. PLoS ONE. 2015;10(9):1-22.

52
46. Houweling TAJ, Ronsmans C, Campbell OMR, Kunst AE. Huge poor-rich inequalities in maternity care: an international comparative study of maternity and child care in developing countries. Bull World Health Organ. 2007;85(10):745-54.
47. Joseph G, Mohnsam da Silva IC, Wehrmeister FC, Barros AJD, Victora CG. Inequalities in the coverage of place of delivery and skilled birth attendance: analyses of cross-sectional surveys in 80 low and middle-income countries. Reproductive Health. 2016;13:1-13.
48. Paredes KPP. Inequality in the use of maternal and child health services in the Philippines: do pro-poor health policies result in more equitable use of services? International Journal for Equity in Health. 2016;15:1-11.
49. Van Malderen C, Ogali I, Khasakhala A, Muchiri SN, Sparks C, Van Oyen H, et al. Decomposing Kenyan socio-economic inequalities in skilled birth attendance and measles immunization. International Journal for Equity in Health. 2013;12(1):1-13.
50. Wabiri N, Chersich M, Zuma K, Blaauw D, Goudge J, Dwane N. Equity in Maternal Health in South Africa: Analysis of Health Service Access and Health Status in a National Household Survey. PLoS One. 2013;8(9):e73864.
51. Wabiri N, Chersich M, Shisana O, Blaauw D, Rees H, Dwane N. Growing inequities in maternal health in South Africa: a comparison of serial national household surveys. BMC pregnancy and childbirth. 2016;16(1):256.
52. Zere E, Mandlhate C, Mbeeli T, Shangula K, Mutirua K, Kapenambili W. Equity in health care in Namibia: developing a needs-based resource allocation formula using principal components analysis. International Journal for Equity in Health. 2007;6(1):3.
53. Memirie ST, Verguet S, Norheim OF, Levin C, Johansson KA. Inequalities in utilization of maternal and child health services in Ethiopia: the role of primary health care. BMC Health Serv Res. 2016;16(1):51.
54. Makate M, Makate C. The Evolution of Socioeconomic-Related Inequalities in Maternal Healthcare Utilization: Evidence from Zimbabwe, 1994-2011. Munich Personal RePEc Archive [Internet]. 2016 15 Jan 2016. Available from: https://mpra.ub.uni-muenchen.de/72718/1/MPRA_paper_72718.pdf.
55. Zere E, Kirigia JM, Duale S, Akazili J. Inequities in maternal and child health outcomes and interventions in Ghana. BMC public health. 2012;12(1):252.
56. Osika J, Altman D, Ekbladh L, Katz I, Nguyen H, Rosenfeld J, et al. Zimbabwe Health System Assessment 2010. Health System 20/20 Project [Internet]. 2010 9 Sept 2015; 20:[20 p.]. Available from: http://healthsystemassessment.org/wp-content/uploads/2012/06/Zimbabwe_Health_System_Assessment2010.pdf.
57. Zimbabwe National Statistics Agency (ZIMSTAT). Zimbabwe Population Census 2012 Harare Zimbabwe2013 [Available from: http://www.zimstat.co.zw/dmdocuments/Census/Census.pdf.
58. Zimbabwe Labour Force Survey: 2014 [Internet]. Zimbabwe National Statistical Agency. 2015 [cited 12 Sept 2016]. Available from: http://www.zimstat.co.zw/sites/default/files/img/publications/Labour/Labour_2014.pdf.
59. McIndoe T. Hyperinflation in Zimbabwe: Trinity College Dublin; 2009. 60. Kroll LE. RIIGEN: Stata module to generate Variables to Compute the Relative Index of
Inequality. 2013. 61. Zimbabwe National Statistics Agency (ZIMSTAT) and ICF International. Zimbabwe Demographic
and Health Survey 2015 Calverton, Maryland2016 [Available from: https://www.dhsprogram.com/pubs/pdf/FR322/FR322.pdf.
62. Zimbabwe National Statistics Agency (ZIMSTAT). Multiple Indicator Cluster Survey 2014 :Key Findings. Harare, Zimbabwe: 2014 [Available from: http://www.childinfo.org/files/Zimbabwe_2014_KFR.pdf.
63. Houweling TA, Ronsmans C, Campbell OM, Kunst AE. Huge poor-rich inequalities in maternity care: an international comparative study of maternity and child care in developing countries. Bull World Health Organ. 2007;85(10):745-54.

53
64. Moosa S, Wojczewski S, Hoffmann K, Poppe A, Nkomazana O, Peersman W, et al. Why there is an inverse primary-care law in Africa. The Lancet Global health. 2013;1(6):e332-3.
65. Barros AJD, Ronsmans C, Axelson H, Loaiza E, Bertoldi AD, França GVA, et al. Equity in maternal, newborn, and child health interventions in Countdown to 2015: a retrospective review of survey data from 54 countries. The Lancet.379(9822):1225-33.
66. Navarro V, Shi L. The political context of social inequalities and health. Social science & medicine. 2001;52(3):481-91.
67. Thomsen S, Hoa DTP, Målqvist M, Sanneving L, Saxena D, Tana S, et al. Promoting equity to achieve maternal and child health. Reprod Health Matters. 2011;19(38):176-82.
68. Gwatkin DR, Bhuiya A, Victora CG. Making health systems more equitable. The Lancet. 2004;364(9441):1273-80.
69. Heeringa SG, West BT, Berglund PA. Applied survey data analysis: CRC Press; 2010. 70. LP SC. Stata Statistical Software Release 13: Stata Press Publication; 2013. 71. Ernstsen L, Strand BH, Nilsen SM, Espnes GA, Krokstad S. Trends in absolute and relative
educational inequalities in four modifiable ischaemic heart disease risk factors: repeated cross-sectional surveys from the Nord-Trøndelag Health Study (HUNT) 1984–2008. BMC public health. 2012;12(1):266.
72. Hampton KN, Lee C-j, Her EJ. How new media affords network diversity: Direct and mediated access to social capital through participation in local social settings. New Media & Society. 2011;13(7):1031-49.
73. Putnam R. Social capital: Measurement and consequences. Canadian Journal of Policy Research. 2001;2(1):41-51.
74. Graham W, Brass W, Snow RW. Estimating maternal mortality: the sisterhood method. Stud Fam Plann. 1989;20(3):125-35.
75. Hosseinpoor AR, Bergen N, Barros AJD, Wong KLM, Boerma T, Victora CG. Monitoring subnational regional inequalities in health: measurement approaches and challenges. International Journal for Equity in Health. 2016;15:1-13.
76. Shamu S, January J, Rusakaniko S. Who benefits from public health financing in Zimbabwe? Towards universal health coverage. Global public health. 2015:1-14.
77. Ha W, Salama P, Gwavuya S, Kanjala C. Is religion the forgotten variable in maternal and child health? Evidence from Zimbabwe. Social science & medicine (1982). 2014;118:80-8.
78. Lewin KM. Access to education in sub‐Saharan Africa: Patterns, problems and possibilities. Comparative Education. 2009;45(2):151-74.
79. Chitiyo G, Chitiyo M, Rumano M, Ametepee LK, Chitiyo J. ZIMBABWE EDUCATION SYSTEM: EMERGING CHALLENGES AND THE IMPLICATIONS FOR POLICY AND RESEARCH. Journal of Global Intelligence & Policy. 2010;3(3):35-42.
80. Grossman M. Education and nonmarket outcomes. Handbook of the Economics of Education. 2006;1:577-633.
81. Starrs AM. Safe motherhood initiative: 20 years and counting. The Lancet. 2006;368(9542):1130-2.
82. Grepin KA, Bharadwaj P. Maternal education and child mortality in Zimbabwe. J Health Econ. 2015;44:97-117.
83. Clemens M, Moss T. Costs and causes of Zimbabwe’s crisis. Center for Global Development. 2005;20.
84. Coomer J, GsTraunThaler T. The hyperinflation in Zimbabwe. Quarterly journal of Austrian economics. 2011;14(3):311.
85. Maguranyanga B. Apostolic religion, health, and utilization of maternal and child health services in Zimbabwe. 2011.
86. Kunst AE, Houweling T. A global picture of poor-rich differences in the utilisation of delivery care. Safe motherhood strategies: a review of the evidence. 2001.

54
APPENDIX A: HUMAN RESEARCH ETHICS CLEARANCE CERTIFICATE