inequality, jobs, growth: the postwar experience in the u.s
TRANSCRIPT

Inequality, Jobs, Growth
The postwar experience in the U.S.
Pavlina R. Tcherneva, Ph.D.
Bard College and Levy Economics Institute
http://pavlina-tcherneva.net
@ptcherneva

INEQUALITY

-20%
0%
20%
40%
60%
80%
100%
120%
1949 -1953
1954 -1957
1958 -1960
1961 -1969
1970 -1973
1975 -1979
1982 -1990
1991 -2000
2001 -2007
2009 -2012
bottom 90% top 10%
source: Pavlina R. Tcherneva calculcations based on Piketty/Saez data and NBER
Distribution of average income growth during expansions
bottom 90% vs. top 10% of families

0%
20%
40%
60%
80%
100%
120%
1949 -1953
1954 -1957
1958 -1960
1961 -1969
1970 -1973
1975 -1979
1982 -1990
1991 -2000
2001 -2007
2009 -2012
Distribution of average income growth during expansions bottom 99% vs. top 1% of families
bottom 99% top 1%
source: Pavlina R. Tcherneva calculcations based on Piketty/Saez data and NBER
0%
20%
40%
60%
80%
100%
120%
1949 -1953
1954 -1957
1958 -1960
1961 -1969
1970 -1973
1975 -1979
1982 -1990
1991 -2000
2001 -2007
2009 -2012
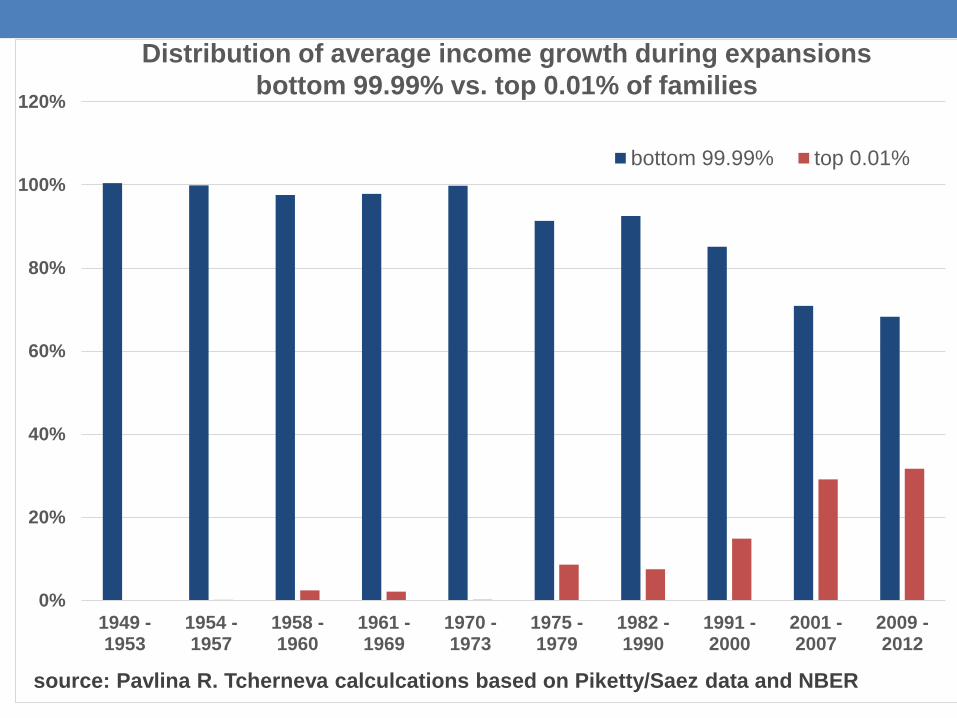
bottom 99.99% top 0.01%
Distribution of average income growth during expansions
bottom 99.99% vs. top 0.01% of families
source: Pavlina R. Tcherneva calculcations based on Piketty/Saez data and NBER

UNEMPLOYMENT

Inequality and the labor market
• Long term unemployment
• Slower recovery in payrolls
• Decline in wage share as % GDP
• Collapse in labor force participation rate
• Collapse in employment-population ratio
• Spike in hidden unemployment

Secular rise in long term unemployment
0%
10%
20%
30%
40%
50%
60%
70%1948
1951
1954
1957
1960
1963
1966
1969
1972
1975
1978
1981
1984
1987
1990
1993
1996
1999
2002
2005
2008
2011
2014
Number unemployed for 15 weeks & over, as % of total unemployment

Slower recovery in payrolls
0
10
20
30
40
50
60
70
80
90
1950 1955 1959 1960 1969 1974 1981 1990 2000 2008
months to recover lost payrolls
mo
nth
s

Decline in wages as % GDP
43%
45%
47%
49%
51%
53%
55%
1947 1951 1955 1959 1963 1967 1971 1975 1979 1983 1987 1991 1995 1999 2003 2007 2011
wages and salary accruals as % of GDP

Labor market during the Great Recession
54
56
58
60
62
64
66
68
1948 1952 1956 1960 1964 1968 1972 1976 1980 1984 1988 1992 1996 2000 2004 2008 2012
Labor Force Participation Rate Employment-to-Population Ratio

0
1
2
3
4
5
6
7
8
1994 1995 1996 1997 1998 1999 2000 2001 2002 2003 2004 2005 2006 2007 2008 2009 2010 2011 2012 2013 2014
difference between official unemployment rate and broader BLS U6 measure
Spike in hidden unemployment

The mark of unemployment
• Costs of unemployment
• “The unemployed need not apply”
• “9 months of unemployment = 4 years off work
experience” (Eriksson, S. and Rooth, AER, 2014)

UNEMPLOYMENT - INEQUALITY
LINK

Policy strategies
• Supply side: cuts in top marginal tax rates
• incentives investment growth employment
• Alternative monetary policy
• Asset price stabilization bank balance sheet improvements
confidence wealth effect lending investment growth
employment
• Demand “stimulus”
• Transfers, firm subsidies and contracts with guaranteed profits:
investment growth employment

Fiscal policy and inequality
• Pro-growth, pro-investment orientation
• Erodes income inequality between labor and capital
• Erodes income inequality within labor

Employment by occupation
-10%
-8%
-6%
-4%
-2%
0%
2%
4%
2002 2003 2004 2005 2006 2007 2008 2009 2010 2011 2012 2013
low and medium wage occupations high wage occupations
Source: Pavlina R. Tcherneva calculations based on www.bls.gov data
Two ways to improve the income distribution
1. distribute income after it was generated
2. change the way income is generated
• Increase the wage share of economy
• Stabilize incomes from employment at the bottom
• Policy regime full employment over the long run (tight labor markets)
• Establish living wages as a floor to all wages (eliminate race to bottom)
• Ensure that wages at the bottom grow faster than those at the top
• Bubble up policy, not trickle down economics
• Rethink and redesign government countercyclical stabilizers
• Rethink the safety-net

RETHINKING
COUNTERCYCLICAL
STABILIZERS

Conventional stabilizer
• Unemployment pool x unemployment insurance
• Income from forced idleness
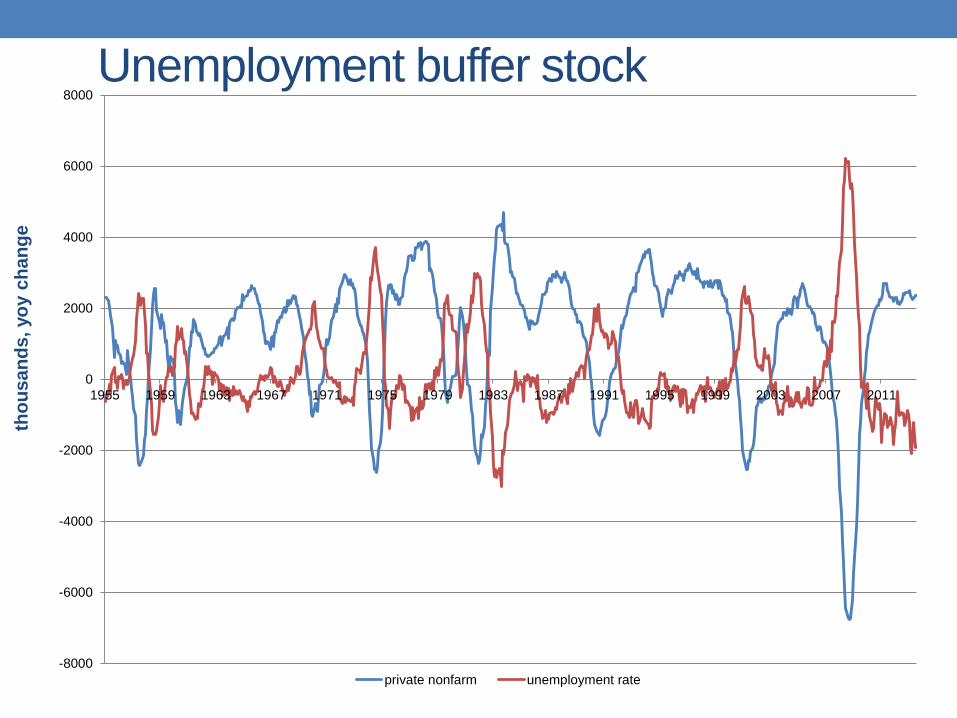
Unemployment buffer stock th
ou
sa
nd
s, yo
y c
ha
ng
e
-8000
-6000
-4000
-2000
0
2000
4000
6000
8000
1955 1959 1963 1967 1971 1975 1979 1983 1987 1991 1995 1999 2003 2007 2011
private nonfarm unemployment rate

Proposed stabilizer
• Employment pool x base wage
• Wage income from work
• ELR

RETHINKING THE SAFETY-NET

Rethinking the safety-net
• Retirement income insecurity
• social security
• Homelessness
• housing
• Hunger
• food
• Unemployment
• job
• Job Guarantee
• Employer of Last Resort
• Full employment through Social Entrepreneurship

Two roads to full employment
• TOP DOWN “stimulus” and “bank bailouts”
• BOTTOM UP direct job creation

Thank you