inequality monitoring in immunization
TRANSCRIPT
A STEP-BY-STEP MANUAL
INEQUALITY MONITORINGIN IMMUNIZATION

Inequality monitoring in immunization flow chart
S T E P 5
Report resultsKnowledge translation
Identify priority areas for action
Integrate equity considerations into immunization programmes and policies Identify opportunities for intersectoral collaboration
S T E P 4
Report results
ADefine the purpose of reporting and the target audience
BSelect the scope of reporting
CDefine the technical content
DDecide upon methods of presenting data
EAdhere to best practices of reporting
S T E P 3
Analyse data
APrepare disaggregated data
BCalculate summary measures of inequality
S T E P 2
Obtain data
AConduct data source mapping
BDetermine whether sufficient data are currently available
Determine scope of monitoring
S T E P 1
ADecide on the target population
BIdentify relevant immunization indicators
CIdentify relevant dimensions of inequality

Inequality monitoring in immunization: a step-by-step manual
ISBN 978-92-4-151653-2
© World Health Organization 2019
Some rights reserved. This work is available under the Creative Commons Attribution-NonCommercial-ShareAlike 3.0 IGO licence (CC BY-NC-SA 3.0 IGO; https://creativecommons.org/licenses/by-nc-sa/3.0/igo).
Under the terms of this licence, you may copy, redistribute and adapt the work for non-commercial purposes, provided the work is appropriately cited, as indicated below. In any use of this work, there should be no suggestion that WHO endorses any specific organization, products or services. The use of the WHO logo is not permitted. If you adapt the work, then you must license your work under the same or equivalent Creative Commons licence. If you create a translation of this work, you should add the following disclaimer along with the suggested citation: “This translation was not created by the World Health Organization (WHO). WHO is not responsible for the content or accuracy of this translation. The original English edition shall be the binding and authentic edition”.
Any mediation relating to disputes arising under the licence shall be conducted in accordance with the mediation rules of the World Intellectual Property Organization.
Suggested citation. Inequality monitoring in immunization: a step-by-step manual. Geneva: World Health Organization; 2019. Licence: CC BY-NC-SA 3.0 IGO.
Cataloguing-in-Publication (CIP) data. CIP data are available at http://apps.who.int/iris.
Sales, rights and licensing. To purchase WHO publications, see http://apps.who.int/bookorders. To submit requests for commercial use and queries on rights and licensing, see http://www.who.int/about/licensing.
Third-party materials. If you wish to reuse material from this work that is attributed to a third party, such as tables, figures or images, it is your responsibility to determine whether permission is needed for that reuse and to obtain permission from the copyright holder. The risk of claims resulting from infringement of any third-party-owned component in the work rests solely with the user.
General disclaimers. The designations employed and the presentation of the material in this publication do not imply the expression of any opinion whatsoever on the part of WHO concerning the legal status of any country, territory, city or area or of its authorities, or concerning the delimitation of its frontiers or boundaries. Dotted and dashed lines on maps represent approximate border lines for which there may not yet be full agreement.
The mention of specific companies or of certain manufacturers’ products does not imply that they are endorsed or recommended by WHO in preference to others of a similar nature that are not mentioned. Errors and omissions excepted, the names of proprietary products are distinguished by initial capital letters.
All reasonable precautions have been taken by WHO to verify the information contained in this publication. However, the published material is being distributed without warranty of any kind, either expressed or implied. The responsibility for the interpretation and use of the material lies with the reader. In no event shall WHO be liable for damages arising from its use.
Design and layout by L’IV Com Sàrl
Printed in France
iii
ContentsForeword . . . . . . . . . . . . . . . . . . . . . . . . . . . . . . . . . . . . . . . . . . . . . . . . . . . . . . . . . . . . . . . . . . . . . . . . . . . . . v
Acknowledgements . . . . . . . . . . . . . . . . . . . . . . . . . . . . . . . . . . . . . . . . . . . . . . . . . . . . . . . . . . . . . . . . . . . vi
Abbreviations and acronyms . . . . . . . . . . . . . . . . . . . . . . . . . . . . . . . . . . . . . . . . . . . . . . . . . . . . . . . . . . . . . vii
Introduction . . . . . . . . . . . . . . . . . . . . . . . . . . . . . . . . . . . . . . . . . . . . . . . . . . . . . . . . . . . . . . . . . . . . . . . . . 1
About this resource . . . . . . . . . . . . . . . . . . . . . . . . . . . . . . . . . . . . . . . . . . . . . . . . . . . . . . . . . . . . . . . . . . . . 4
Equity Reference Group for Immunization . . . . . . . . . . . . . . . . . . . . . . . . . . . . . . . . . . . . . . . . . . . . . . . . . . 5
S T E P 1 Determine scope of monitoring . . . . . . . . . . . . . . . . . . . . . . . . . . . . . . . . . . . . . . . . . . . . . . . . . 9
Overview . . . . . . . . . . . . . . . . . . . . . . . . . . . . . . . . . . . . . . . . . . . . . . . . . . . . . . . . . . . . . . . . . . . . . . . 11
A. Decide on the target population . . . . . . . . . . . . . . . . . . . . . . . . . . . . . . . . . . . . . . . . . . . . . . . . . . 12
B. Identify relevant immunization indicators. . . . . . . . . . . . . . . . . . . . . . . . . . . . . . . . . . . . . . . . . . . . 13
C. Identify relevant dimensions of inequality . . . . . . . . . . . . . . . . . . . . . . . . . . . . . . . . . . . . . . . . . . . 15
S T E P 2 Obtain data . . . . . . . . . . . . . . . . . . . . . . . . . . . . . . . . . . . . . . . . . . . . . . . . . . . . . . . . . . . . . . . . 17
Overview . . . . . . . . . . . . . . . . . . . . . . . . . . . . . . . . . . . . . . . . . . . . . . . . . . . . . . . . . . . . . . . . . . . . . . . 19
A. Conduct data source mapping . . . . . . . . . . . . . . . . . . . . . . . . . . . . . . . . . . . . . . . . . . . . . . . . . . . . 20
B. Determine whether sufficient data are currently available . . . . . . . . . . . . . . . . . . . . . . . . . . . . . . . 23
S T E P 3 Analyse data . . . . . . . . . . . . . . . . . . . . . . . . . . . . . . . . . . . . . . . . . . . . . . . . . . . . . . . . . . . . . . . 25
Overview . . . . . . . . . . . . . . . . . . . . . . . . . . . . . . . . . . . . . . . . . . . . . . . . . . . . . . . . . . . . . . . . . . . . . . . 27
A. Prepare disaggregated data . . . . . . . . . . . . . . . . . . . . . . . . . . . . . . . . . . . . . . . . . . . . . . . . . . . . . . 28
B. Calculate summary measures of inequality . . . . . . . . . . . . . . . . . . . . . . . . . . . . . . . . . . . . . . . . . . . 31
S T E P 4 Report results . . . . . . . . . . . . . . . . . . . . . . . . . . . . . . . . . . . . . . . . . . . . . . . . . . . . . . . . . . . . . . 35
Overview . . . . . . . . . . . . . . . . . . . . . . . . . . . . . . . . . . . . . . . . . . . . . . . . . . . . . . . . . . . . . . . . . . . . . . . 37
A. Define the purpose of reporting and the target audience . . . . . . . . . . . . . . . . . . . . . . . . . . . . . . . 38
B. Select the scope of reporting . . . . . . . . . . . . . . . . . . . . . . . . . . . . . . . . . . . . . . . . . . . . . . . . . . . . . 39
C. Define the technical content . . . . . . . . . . . . . . . . . . . . . . . . . . . . . . . . . . . . . . . . . . . . . . . . . . . . . 41
D. Decide upon methods of presenting data . . . . . . . . . . . . . . . . . . . . . . . . . . . . . . . . . . . . . . . . . . . 42
E. Adhere to best practices of reporting . . . . . . . . . . . . . . . . . . . . . . . . . . . . . . . . . . . . . . . . . . . . . . . 46
S T E P 5 Knowledge translation . . . . . . . . . . . . . . . . . . . . . . . . . . . . . . . . . . . . . . . . . . . . . . . . . . . . . . . 49
Overview . . . . . . . . . . . . . . . . . . . . . . . . . . . . . . . . . . . . . . . . . . . . . . . . . . . . . . . . . . . . . . . . . . . . . . . 51
Identify priority areas for action . . . . . . . . . . . . . . . . . . . . . . . . . . . . . . . . . . . . . . . . . . . . . . . . . . . . . 52
Integrate equity considerations into immunization programmes and policies . . . . . . . . . . . . . . . . . 53
Identify opportunities for intersectoral collaboration . . . . . . . . . . . . . . . . . . . . . . . . . . . . . . . . . . . . . 55

iv
I N E Q UA L I T Y M O N I TO R I N G I N I M M U N I Z AT I O N: A S T E P - BY - S T E P MA N UA L
Appendix 1. Additional resources . . . . . . . . . . . . . . . . . . . . . . . . . . . . . . . . . . . . . . . . . . . . . . . . . . . . . . . . 59
Appendix 2. Monitoring, Evaluation and Review Framework . . . . . . . . . . . . . . . . . . . . . . . . . . . . . . . . . . . 61
Appendix 3. Double disaggregation . . . . . . . . . . . . . . . . . . . . . . . . . . . . . . . . . . . . . . . . . . . . . . . . . . . . . . 62
Appendix 4. Data sources for immunization coverage . . . . . . . . . . . . . . . . . . . . . . . . . . . . . . . . . . . . . . . . 63
Appendix 5. Overcoming limited data availability . . . . . . . . . . . . . . . . . . . . . . . . . . . . . . . . . . . . . . . . . . . 66
Appendix 6. Complex measures of inequality . . . . . . . . . . . . . . . . . . . . . . . . . . . . . . . . . . . . . . . . . . . . . . . 67
Appendix 7. Multiple regression analysis and compounded vulnerability . . . . . . . . . . . . . . . . . . . . . . . . . 69
Appendix 8. Case study: reporting inequalities in immunization . . . . . . . . . . . . . . . . . . . . . . . . . . . . . . . . 70
Glossary of terms . . . . . . . . . . . . . . . . . . . . . . . . . . . . . . . . . . . . . . . . . . . . . . . . . . . . . . . . . . . . . . . . . . . . . 71

ForewordWith the United Nations 2030 Sustainable Development Agenda to ensure healthy lives and promote the well-being for all, at all ages (Goal 3), immunization is one of the most effective tracers to track that no one is left behind. Equity is one of the cornerstones of immunization strategy and reducing inequalities is embedded in targets and goals. Attention is turning to rapidly closing the inequity gap and reaching the ones hardest to reach, including the urban poor, those living in conflict settings and in remote rural areas, and the marginalized. A rigorous surveillance and monitoring system with a laser-like focus on data disaggregation becomes central to achieving the health-related United Nations Sustainable Development Goals and the World Health Organization (WHO) Thirteenth General Programme of Work (GPW 13) targets.
WHO continues to highlight and build country capacity for inequality monitoring. In 2016, the State of inequality: childhood immunization report analysed survey data from 69 low- and middle-income countries, using interactive visuals to illustrate socioeconomic, demographic and geographic inequalities. In the same year, WHO launched the Health Equity Assessment Toolkit (HEAT), which enables explorations and comparisons of data about immunization (and other health topics) within and across countries. In 2017, WHO published the National health inequality monitoring: a step-by-step manual, which introduced the general steps of health inequality monitoring for national jurisdictions. Applying the steps outlined in the manual, a collaboration between WHO and stakeholders in Indonesia yielded the State of health inequality: Indonesia report, which quantifies inequalities across 11 health topics, including immunization. Subsequently, improvised analysis techniques have been used to determine the factors associated with immunization coverage in a set of 10 priority countries, captured in the 2018 Explorations of inequality: childhood immunization report.
The Inequality monitoring in immunization: a step-by-step manual complements the 2017 National health inequality monitoring: a step-by-step manual. Building on these basic concepts, the practical steps are revisited in the current resource with the specific application to monitoring inequalities in immunization. The guidance, tools and examples presented in this manual demonstrate how they can be applied to accelerate and deliver on the targets.
Samira Asma Assistant Director-GeneralDivision of Data, Analytics and Delivery for ImpactWorld Health Organization
v

AcknowledgementsAhmad Reza Hosseinpoor (Health Equity Monitoring Lead, Department of Data and Analytics, World Health Organization, Geneva, Switzerland) and Nicole Bergen (Faculty of Health Sciences, University of Ottawa, Ottawa, Canada) conceptualized and developed the manual.
Early drafts of the manual benefited from the contributions of the following reviewers:
Cesar Victora (International Center for Equity in Health, Federal University of Pelotas, Pelotas, Brazil)
Heather Scobie (Centers for Disease Control and Prevention, Atlanta, United States of America)
Molly Abbruzzese, Tove Ryman (Bill & Melinda Gates Foundation, Seattle, United States of America)
Laura Craw, Anuradha Gupta (Gavi, the Vaccine Alliance, Geneva, Switzerland)
Nikki Gurley, Jessica Shearer (PATH, Seattle, United States of America)
Niklas Danielsson, Richard Duncan, Mamadou Saliou Diallo, Ahmadu Yakubu (UNICEF, New York, United States of America)
Celina Hanson (UNICEF Middle East and North Africa Regional Office, Amman, Jordan)
Gunter Boussery (UNICEF West and Central Africa Regional Office, Dakar, Senegal)
Marta Gacic-Dobo, Jan Grevendonk, Katherine Kirkby, Anne Schlotheuber, Samir Sodha (World Health Organization, Geneva, Switzerland)
Oscar Mujica (Pan American Health Organization/World Health Organization Regional Office for the Americas, Washington DC, United States of America)
Roberta Pastore (World Health Organization Regional Office for the Western Pacific, Manila, Philippines)
AvisAnne Julien provided copy-editing support and proofread the document.
Funding for the project was provided in part by Gavi, the Vaccine Alliance.
vi
I N E Q UA L I T Y M O N I TO R I N G I N I M M U N I Z AT I O N: A S T E P - BY - S T E P MA N UA L

Abbreviations and acronymsBCG bacille Calmette-Guérin vaccine
cMYP comprehensive multi-year strategic plan
CRVS civil registration and vital statistics
DHS Demographic and Health Surveys
DTP combined diphtheria, tetanus toxoid and pertussis vaccine
DTP1 first dose of combined diphtheria, tetanus toxoid and pertussis vaccine
DTP3 third dose of combined diphtheria, tetanus toxoid and pertussis vaccine
DTP-HepB diphtheria, tetanus toxoid and pertussis and hepatitis B vaccine
EIR electronic immunization registry
EPI Expanded Programme on Immunization
ERG Equity Reference Group for Immunization
Gavi Gavi, the Vaccine Alliance
HEAT Health Equity Assessment Toolkit
MCV measles-containing vaccine
MCV1 first dose of measles-containing vaccine
MCV2 second dose of measles-containing vaccine
MICS Multiple Indicator Cluster Surveys
UNICEF United Nations Children’s Fund
WHO World Health Organization
vii

Introduction Immunization is a safe, effective and cost-effective measure to prevent and protect against disease. Ensuring universal access to immunization promotes better population health and improved outcomes across diverse aspects of development. Childhood immunization efforts contributed to progress on the Millennium Development Goals (1), and have a role in achieving the Sustainable Development Goals (2).
Unfortunately, however, the benefits of vaccines are spread unevenly. Certain population groups and areas where large numbers of children remain unvaccinated are more susceptible to disease outbreaks or the re-emergence of infectious diseases. In many low- and middle-income countries, national immunization coverage has increased over the past decades, yet socioeconomic and geographic inequalities remain a challenge. Children in poor households and children of mothers with low levels of education report lower immunization coverage; in many countries, rural areas still lag behind urban areas (3). For example, in 2018, the World Health Organization (WHO) reported (4):
• In Afghanistan in 2015, a child of a teenaged mother with no education had one third the chance of being vaccinated with three doses of the combined diphtheria, tetanus toxoid and pertussis vaccine (DTP3) as a child of a mother 20–49 years of age with secondary education or higher; if the child of the uneducated, teenaged mother belonged to the poorest 20%, then this chance dropped to one ninth (compared to a child of a highly educated mother aged 20–49 years in the richest 20%).
• In Chad in 2014–2015, a child of a mother 20–34 years of age with secondary education or higher and belonging to the richest 20% of households had up to 7.2 times higher chance of receiving DTP3 immunization compared with a child of a teenaged mother with no education, from the poorest 20%.
• In Ethiopia in 2016, the chance of receiving the DTP3 vaccine was 6.7 times higher for a child of a mother 20–49 years of age and primary school educated, and who lived in a male-headed household, compared with a child of a teenaged mother with no education in a female-headed household.
• In India in 2015–2016, children with highly educated mothers aged 20–49 years who belonged to the richest 20% of households had a 5.3 times higher chance of being vaccinated with DTP3, compared with children born to teenaged mothers with no education, in the poorest 20%.
• In Nigeria in 2013, children of mothers aged 20–34 years who were highly educated, living in a rich household in the South South region were among the most advantaged in terms of childhood immunization: their chance of being vaccinated was 300 times higher than children with teenaged mothers with no education, living in poor households in the North West region.
Equity is embedded as a priority in global efforts to promote immunization. The Decade of Vaccines’ (2011–2020) Global Vaccine Action Plan (GVAP) includes equity as a guiding principle, measured as the percentage of districts with less than 80% coverage with DTP3, and as gaps in coverage between lowest and highest wealth quintiles (5). In 2018, just 39 countries reported at least 80% coverage in all districts (6). Building on GVAP, the forthcoming WHO Immunization Agenda 2030: a global strategy to leave no one behind envisions “a world
1

where everyone, everywhere, at every age, fully benefits from vaccines for good health and well-being” (7). Gavi, the Vaccine Alliance works to improve access to vaccines in the world’s poorest countries, and measures progress by tracking vaccine coverage according to geographic distribution, wealth distribution and maternal education (8). Equity is a priority in Gavi’s 2021–2025 high-level strategy (Gavi 5.0), which focuses on reaching groups that are often left behind (9). The Equity Reference Group for Immunization (ERG), an action-oriented think tank convened by the United Nations Children’s Fund (UNICEF) and the Bill & Melinda Gates Foundation, has a specific aim to accelerate progress in achieving equity in immunization (10). The ERG promotes improved approaches to tracking and monitoring equity in immunization, calling attention to four priority thematic areas of work: urban poor areas; remote rural areas; children affected by conflict; and gender-related inequities and barriers to immunization.
Monitoring inequalities in immunization is an important part of efforts to promote equity (Box 1). In general, health inequalities are defined as observed differences in health between subgroups of a population. For example, if the coverage of polio immunization is higher in urban than rural areas, then this constitutes an inequality. Inequalities are deemed to be inequitable if they are avoidable and could be reduced through action such as government programmes and policies.
Box 1. Promoting equity in immunization by monitoring inequalities
Many prominent immunization efforts uphold the notion of “equity” – the idea that the benefits of immunization should be equitably extended to all, regardless of where they live, the conditions that surround them, and personal or family characteristics such as age, gender, economic status, ethnicity, education or disability. Equitable access to immunization is considered a core component of the right to health.
The process of “monitoring inequalities” in immunization refers to a systematic approach to collecting data and measuring and reporting the observable differences between subgroups of a population. Monitoring inequality in vaccination coverage is a way to identify where inequalities exist and where disadvantaged subgroups stand in terms of access to and utilization of health services. When monitoring inequalities over time, the results can help to evaluate how a population is progressing in terms of promoting equity.
Monitoring refers to the process of repeatedly measuring an indicator to observe changes over time. By monitoring inequalities in immunization coverage, it is possible to verify whether gaps in coverage are getting larger or smaller, assess the impact of programmes and policies, and identify population groups that are disadvantaged. Systematic approaches to measure inequalities in immunization provide information that can help countries tailor policies, programmes and service provision and demand promotion to close gaps in immunization. The five general steps of health inequality monitoring are summarized below. For more information about the theory that underlies these steps, see the resources listed in Appendix 1.
1 Determine scope of monitoring: After defining a target population for monitoring, a broad range of relevant health indicators and dimensions of inequality (categorizations upon which population subgroups are formed, such as wealth, education, region, sex, etc.) are identified.
2 Obtain data: Data sources are identified that contain information about the health indicators and dimensions of inequality identified in Step 1: Determine scope of monitoring, and the necessary data are obtained.
2
I N E Q UA L I T Y M O N I TO R I N G I N I M M U N I Z AT I O N: A S T E P - BY - S T E P MA N UA L
3 Analyse data: Data analysis involves calculating health estimates by population subgroups and making comparisons between the levels of health in those subgroups.
4 Report results: Reporting the results of health inequality monitoring to the desired target audience is important to promote the use of this evidence to inform policies, programmes and practices.
5 Knowledge translation: The results of health inequality monitoring can help decision-makers to determine priority areas for further action to reduce inequalities.
References
1. Millennium Development Goals [Internet]. Global Health and Development. Gavi, the Vaccine Alliance; 2018 (https://www.gavi.org/about/ghd/mdg/, accessed 6 September 2019).
2. Sustainable Development Goals [Internet]. Global Health and Development. Gavi, the Vaccine Alliance; 2018 (https://www.gavi.org/about/ghd/sdg/, accessed 6 September 2019).
3. State of inequality: childhood immunization. Geneva: World Health Organization; 2016.
4. Explorations of inequality: childhood immunization. Geneva: World Health Organization; 2018.
5. Global Vaccine Action Plan 2011–2020. Geneva: World Health Organization; 2013.
6. 2018 Assessment report of the Global Vaccine Action Plan: strategic advisory group of experts on immunization. Geneva: World Health Organization; 2018.
7. Immunization Agenda 2030: a global strategy to leave no one behind, Draft 1 [Internet]. World Health Organization; 2019 (https://www.who.int/immunization/ia2030_Draft_One_English.pdf?ua=1, accessed 6 September 2019).
8. Annual progress report: 2017, Year 2 of our five-year strategy [Internet]. Gavi, the Vaccine Alliance; 2017 (https://www.gavi.org/library/publications/gavi-progress-reports/gavi-progress-report-2017/, accessed 8 September 2019).
9. New 2021–2025 high-level strategy to leave no-one behind with immunisation approved by Gavi Board [Internet]. Gavi, the Vaccine Alliance; 2019 (https://www.gavi.org/library/news/press-releases/2019/new-2021-2025-high-level-strategy-to-leave-no-one-behind-with-immunisation-approved-by-gavi-board/, accessed 6 September 2019).
10. Equity Reference Group for Immunization [Internet]. 2019 (https://sites.google.com/view/erg4immunisation/home, accessed 6 September 2019).
3

About this resourceThis resource, Inequality monitoring in immunization: a step-by-step manual, applies the general steps of health inequality monitoring to the topic of immunization. The manual aims to serve as an introductory-level guide to build capacity for the uptake and improvement of inequality monitoring practices in immunization. Through this resource, we hope that regions, countries, districts and other jurisdictions will adopt regular reporting of immunization inequalities that, in turn, informs focused efforts to address situations of inequality. The outputs of inequality monitoring in immunization are particularly relevant to immunization programme review and planning activities, such as the desk review stage of the Expanded Programme on Immunization (EPI) Review and comprehensive multi-year strategic plans (cMYPs).
The manual is primarily written and designed for monitoring and evaluation officers for immunization and other interested readers who have basic knowledge and experience working with immunization data. It presents information in a practical and straightforward way, and links readers to further, more detailed information. Although inequality monitoring is described as a step-by-step process, in reality, the implementation of these steps is iterative in nature, and requires contextualization within the setting in which it is being applied. Throughout the monitoring process, readers may find themselves referring back to previous steps, or thinking through considerations at subsequent steps. Thus, readers may find it useful to review the entire manual prior to undertaking inequality monitoring activities.
The manual is organized in five main sections, each corresponding to one step of inequality monitoring. For each section, readers are first provided with an overview of the step, situating it within the broader monitoring process. Then, readers are guided through a series of sub-steps, highlighting key questions, best practices, considerations and examples. Appendices provide more in-depth technical information, resources and examples about select themes. At the end of the manual, a glossary of terms provides easy reference to key terminology, and a fold-out flow chart on the back cover summarizes the content from all five steps.
The primary focus of this resource is on immunization, with most explanations and examples pertaining to inequalities in immunization coverage – a common way of measuring progress towards immunization goals. As such, this resource can be regarded as a starting point from which immunization inequality monitoring practices can be expanded. Using the methods described in this manual, inequality monitoring in immunization can be extended to cover broader aspects of the health system, include any context-specific vulnerable population subgroups and incorporate more diverse and sophisticated forms of data analysis and reporting. This manual is based on the 2017 World Health Organization (WHO) resource, National health inequality monitoring: a step-by-step manual, which introduced the health inequality monitoring flow chart of the general steps and sub-steps of health inequality monitoring.
For the sake of feasibility and usability, certain aspects of monitoring are given less emphasis in this resource. For instance, Step 3 describes only the basic approaches to inequality data analysis, referring to more technically advanced methods in Appendices 6 and 7, and suggested resources. Similarly, while Step 5 outlines basic considerations for knowledge translation activities, further details about how to design and monitor the effectiveness of pro-equity interventions are beyond the scope of the manual. Indeed, the best practices and field examples of how the results of monitoring inequalities in immunization are taken up by programmes, policies and practices are yet to be developed. Readers are encouraged to refer to the resources mentioned throughout the manual as required to suit their specific interests and needs.
4
I N E Q UA L I T Y M O N I TO R I N G I N I M M U N I Z AT I O N: A S T E P - BY - S T E P MA N UA L
Equity Reference Group for ImmunizationRecognizing the tremendous progress during the Decade of Vaccines, the Equity Reference Group for Immunization (ERG) seeks to close the remaining gaps in immunization, promoting greater equity in immunization through policies and programmes. The work of the ERG calls attention to challenges in four key thematic areas.
1. Immunization challenges in remote rural areas
Populations in remote rural areas may lack regular contact with the health system, and thus have fewer opportunities to vaccinate and lower levels of awareness surrounding immunization. For example, a study of measles vaccination coverage in 26 African countries found that geographical isolation (measured as travel time to the nearest urban centre) was a key factor in determining the level of inequality in immunization coverage (1). Countries with lower overall immunization coverage could make greater equity gains through improving coverage levels in remote areas, though there is a high marginal cost in reaching these areas, and health worker retention and motivation pose challenges (2).
Community health worker programmes have been a successful strategy in some areas to connect remote populations with the health system and increase the coverage of basic health services. In Pakistan, where nearly two thirds of the population reside in rural areas (3), subgroups that lived farther away from immunization facilities or had less contact with the network of community health workers had lower levels of full immunization; conversely, rural areas with a greater presence of outreach immunization support reported higher proportions of fully immunized children (4). Other recommendations for enhancing immunization in remote rural areas include identifying opportunities to integrate immunization services with other health services and strengthening health information services to gather timely data from these populations.
2. Immunization challenges in areas of conflict
Populations in settings affected by active conflict are at an elevated risk for vaccine-preventable disease outbreaks due to factors such as poor nutrition, overcrowding and unsanitary living environments. For instance, the eradication of wild and vaccine-derived polio virus is proving the most difficult in conflict areas in Afghanistan, the Democratic Republic of the Congo, Nigeria, Pakistan and Somalia (5,6). Situations of instability may impede efforts to provide immunization through routine visits or campaigns. Key challenges include: disrupted infrastructure and supply chain; violence against health workers; difficulties retaining health workers; delivery service interruptions; mistrust between authorities and communities; and displacement and migration (7). For populations affected by active conflict, adopting flexibility surrounding age and eligibility criteria is a key strategy to improve immunization coverage. The ERG suggests coordination with humanitarian actors to provide immunization services, improved payment mechanisms for health facility staff and engagement with community leaders as additional strategies to strengthen immunization in conflict settings (7).
5
3. Immunization challenges in rapidly urbanizing areas
Increasingly, health inequalities within urban populations warrant special attention. Traditionally, urban populations have tended to report higher immunization coverage than rural populations; however, in many areas with rapid urbanization this trend is reversing. In India, for instance, urban and rural areas showed similar levels of DTP3 immunization coverage among one-year-olds, and all other things being equal, infants in urban areas were less likely to be vaccinated than similarly poor infants in rural areas (8).
Looking at the immunization situation in urban populations reveals a complex story. Recent rural-to-urban migrants, children living in informal settlements and children of poor families are among the urban population subgroups that often face disadvantages in terms of access and utilization of vaccination services. Further, these populations – who often live in highly concentrated areas with poor environmental and living conditions – are at a greater risk of disease transmission and severe outbreaks, and tend to have poor access to health services (9,10). Populations in these areas are often difficult to identify and reach and may be distrustful of public authorities. Strategies for strengthening immunization services in urban settings include instituting “opt out” policies, scaling up peer networks for health workers, adjusting the timing and location of immunization services, implementing electronic immunization registries (EIRs) and sending reminders through mobile phones (11).
4. Immunization challenges related to gender inequities and barriers
In many countries, characteristics associated with a child’s mother (for example, her age, education level, employment, economic status and decision-making ability) are often important dimensions of inequality that affect vaccination uptake as well as broader health service use. Mothers and other women are primarily responsible for children’s health care, but they also tend to have lower status in the community and family and may have a limited capacity to act in the interest of their child. For example, while immunization services are often provided without a charge, women may lack access to resources for indirect expenses related to the costs of transportation, childcare or relief from work. In some settings, men or community leaders may have a greater role in health decision-making, acting as gatekeepers for the use of immunization services.
Health workers who deliver vaccines often tend to be women. They may face security issues that affect the hours that services are provided or the geographical scope of where services are provided. Addressing gender-related inequities in health underlies health system strengthening, and requires comprehensive efforts that span from the community through to higher administrative levels of the health system (12).
References
1. Metcalf CJE, Tatem A, Bjornstad ON, Lessler J, O’Reilly K, Takahashi S et al. Transport networks and inequities in vaccination: remoteness shapes measles vaccine coverage and prospects for elimination across Africa. Epidemiol Infect. 2015 May;143(7):1457–66.
2. Levine O, Lemango ET, Bernson J, Gurley N, Rowley E, McIlvaine B. ERG Discussion paper No. 8. Tackling inequities in immunization outcomes in remote rural contexts [Internet]. Equity Reference Group for Immunization; 2018 (https://sites.google.com/view/erg4immunisation/discussion-papers, accessed 6 September 2019).
6
I N E Q UA L I T Y M O N I TO R I N G I N I M M U N I Z AT I O N: A S T E P - BY - S T E P MA N UA L
3. Rural population (% of total population): Data [Internet]. The World Bank Group; 2019 (https://data.worldbank.org/indicator/sp.rur.totl.zs, accessed 6 September 2019).
4. Khowaja AR, Zaman U, Feroze A, Rizvi A, Zaidi AK. Routine EPI coverage: subdistrict inequalities and reasons for immunization failure in a rural setting in Pakistan. Asia Pac J Public Health. 2015;27(2):NP1050–NP1059.
5. Nnadi C, Etsano A, Uba B, Ohuabunwo C, Melton M, Wa Nganda G et al. Approaches to vaccination among populations in areas of conflict. J Infect Dis. 2017 Jul 1;216(Suppl. 1):S368–72.
6. Mbaeyi C, Alleman MM, Ehrhardt D, Wiesen E, Burns CC, Liu H et al. Update on vaccine-derived poliovirus outbreaks: Democratic Republic of the Congo and Horn of Africa, 2017–2018. Morb Mortal Wkly Rep. 2019;68(9):225.
7. Okwo-Bele J-M, Conner R, McIlvaine B, Rowley E, Bernson J. ERG Discussion paper No. 6. Tackling inequities in immunization outcomes in conflict contexts [Internet]. Equity Reference Group for Immunization; 2018 (https://sites.google.com/view/erg4immunisation/discussion-papers, accessed 6 September 2019).
8. Explorations of inequality: childhood immunization. Geneva: World Health Organization; 2018. 9. Health and immunization services for the urban poor in East Asia: case studies from seven countries
in East Asia on access by the urban poor to health services. Bangkok: UNICEF East Asia and Pacific Regional Office; 2016.
10. Awoh AB, Plugge E. Immunisation coverage in rural–urban migrant children in low- and middle-income countries (LMICs): a systematic review and meta-analysis. J Epidemiol Community Health. 2016 Mar 1;70(3):305–11.
11. Nandy R, Rees H, Bernson J, Digre P, Rowley E, McIlvaine B. ERG Discussion paper No. 7. Tackling inequities in immunization outcomes in urban contexts [Internet]. PATH and Equity Reference Group for Immunization; 2018 (https://sites.google.com/view/erg4immunisation/discussion-papers, accessed 6 September 2019).
12. Feletto M, Sharkey A, Rowley E, Gurley N, Sinha A, Champions ERG et al. ERG Discussion paper No. 5. A gender lens to advance equity in immunization [Internet]. Equity Reference Group for Immunization; 2018 (https://sites.google.com/view/erg4immunisation/discussion-papers, accessed 6 September 2019).
7

S T E P1
S T E P1

S T E P 5
Report resultsKnowledge translation
S T E P 4
Report results
S T E P 3S T E P 2
I N E Q UA L I T Y M O N I TO R I N G I N I M M U N I Z AT I O N: A S T E P - BY - S T E P MA N UA L
Obtain data Analyse dataDetermine scope of monitoring
S T E P 1
10
A
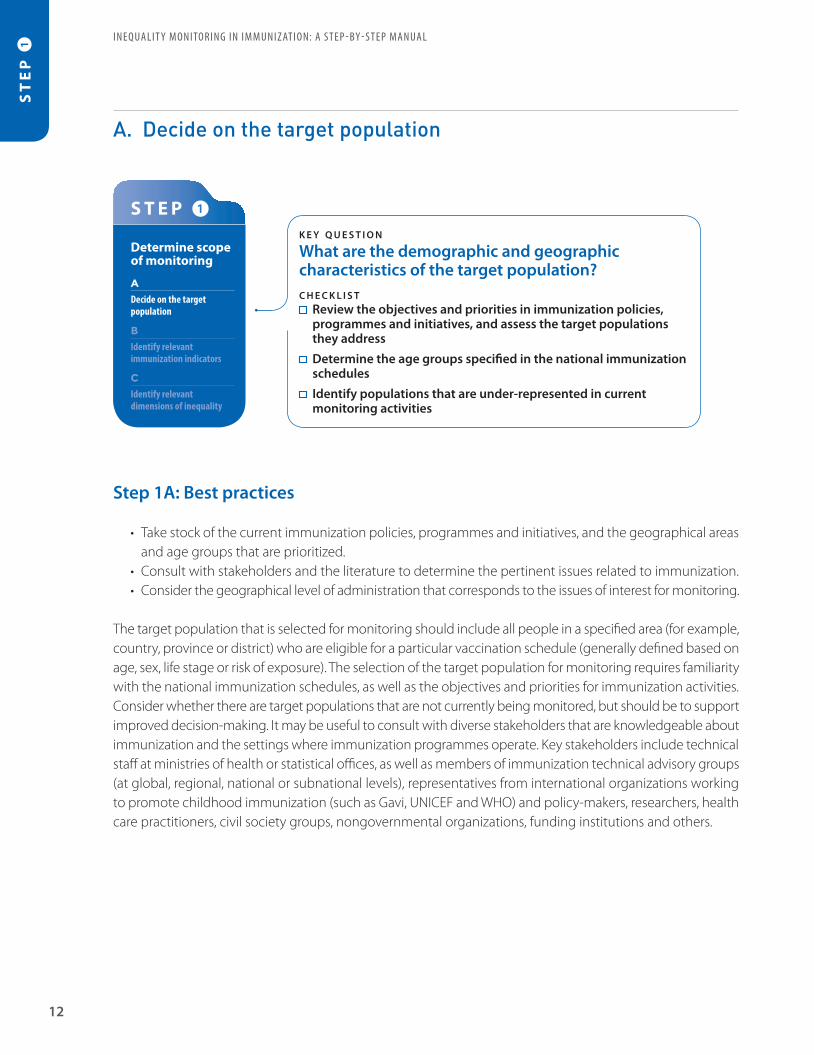
Decide on the target populationk e y q u e s t i o nWhat are the demographic and geographic characteristics of the target population?c h e c k l i s t
Review the objectives and priorities in immunization policies, programmes and initiatives, and assess the target populations they address
Determine the age groups specified in the national immunization schedules Identify populations that are under-represented in current monitoring activities
B
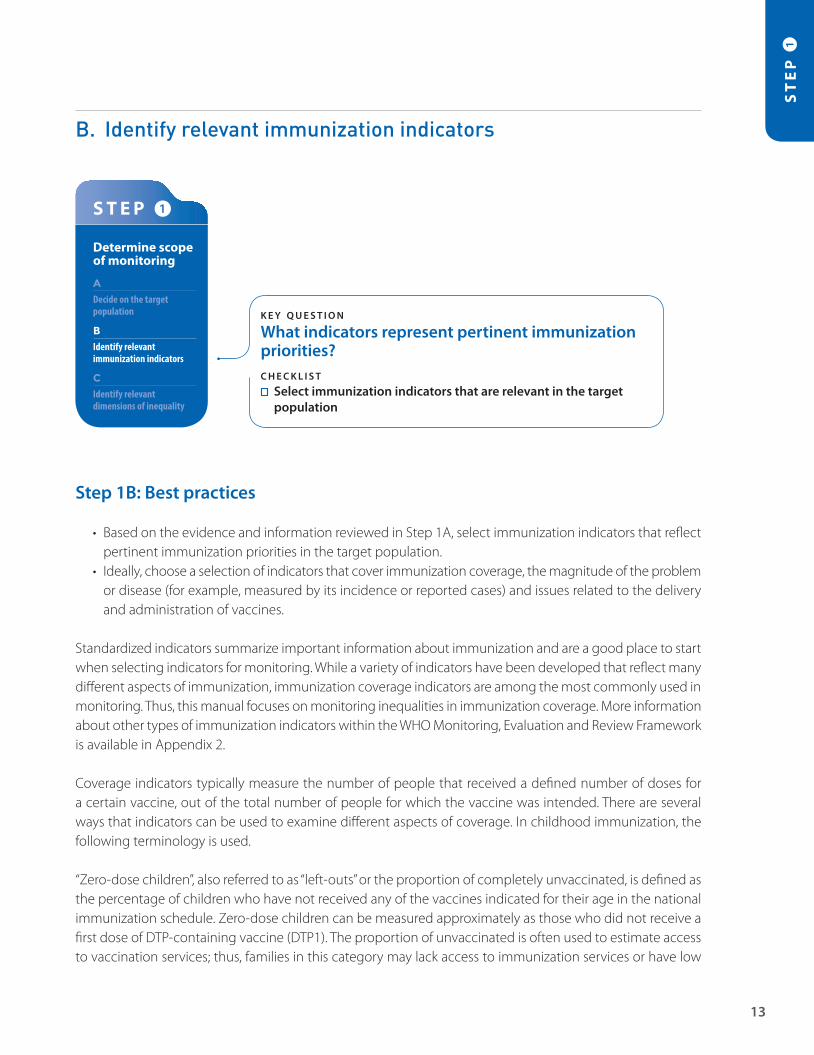
Identify relevant immunization indicatorsk e y q u e s t i o nWhat indicators represent pertinent immunization priorities?c h e c k l i s t
Select immunization indicators that are relevant in the target population
C
Identify relevant dimensions of inequalityk e y q u e s t i o nWhat dimensions of inequality are relevant to immunization in the target population?c h e c k l i s t
Consider common dimensions of inequality: household economic status, parental education level (especially maternal), place of residence, sex, mother’s age and other country or context-specific factors such as religion, tribe and ethnicity
Consider whether dimensions of inequality intersect and if double disaggregation should be done For each inequality dimension identified above, determine the criteria for how to measure it
Determine scope of monitoringS T E P 1
ST
EP
1
11
OverviewS T E P 1 in monitoring inequalities in immunization considers the purpose and scope of monitoring, beginning with why monitoring is being undertaken and how the results will be used. Then, the step poses questions such as: What population will the monitoring activities cover (for example, the whole country or specific provinces or districts)? Which immunization indicators will be used for monitoring? And how will subgroups within the population be identified? Bear in mind, this step is the most conceptual in nature and will require thinking through and planning how the inequality monitoring activities, on the whole, will be focused. Recognizing that the monitoring process is iterative, this step involves starting to think ahead to the desired impact of the monitoring activity, the target audience, the approach to reporting and the availability of data (Step 1A). In Step 1B and Step 1C, decisions surrounding the selection of immunization indicators and dimensions of inequality may be, in part, informed by data availability.
Identifying the objectives and target audience for the monitoring activity, even if tentative, may be helpful. Key stakeholders, reports or other literature may be useful sources of background information to inform the selection of the target population, immunization indicators and dimensions of inequality.
For the sake of simplicity, the immunization indicators featured in this resource reflect those most commonly used for monitoring: coverage indicators. A more detailed discussion of other types of immunization indicators captured in the WHO Monitoring, Evaluation and Review Framework can be found in Appendix 2. While this manual tends to focus on the application of single dimensions of inequality, Appendix 3 outlines additional considerations related to intersectionality and the use of multiple dimensions of inequality, a process known as double or multiple disaggregation.
ST
EP
1
Step 1A: Best practices
• Take stock of the current immunization policies, programmes and initiatives, and the geographical areas and age groups that are prioritized.
• Consult with stakeholders and the literature to determine the pertinent issues related to immunization.• Consider the geographical level of administration that corresponds to the issues of interest for monitoring.
The target population that is selected for monitoring should include all people in a specified area (for example, country, province or district) who are eligible for a particular vaccination schedule (generally defined based on age, sex, life stage or risk of exposure). The selection of the target population for monitoring requires familiarity with the national immunization schedules, as well as the objectives and priorities for immunization activities. Consider whether there are target populations that are not currently being monitored, but should be to support improved decision-making. It may be useful to consult with diverse stakeholders that are knowledgeable about immunization and the settings where immunization programmes operate. Key stakeholders include technical staff at ministries of health or statistical offices, as well as members of immunization technical advisory groups (at global, regional, national or subnational levels), representatives from international organizations working to promote childhood immunization (such as Gavi, UNICEF and WHO) and policy-makers, researchers, health care practitioners, civil society groups, nongovernmental organizations, funding institutions and others.
Determine scope of monitoring
S T E P 1
ADecide on the target population
BIdentify relevant immunization indicators
CIdentify relevant dimensions of inequality
12
I N E Q UA L I T Y M O N I TO R I N G I N I M M U N I Z AT I O N: A S T E P - BY - S T E P MA N UA L
A. Decide on the target population
k e y q u e s t i o n
What are the demographic and geographic characteristics of the target population?c h e c k l i s t
Review the objectives and priorities in immunization policies, programmes and initiatives, and assess the target populations they address
Determine the age groups specified in the national immunization schedules
Identify populations that are under-represented in current monitoring activities
ST
EP
1
Step 1B: Best practices
• Based on the evidence and information reviewed in Step 1A, select immunization indicators that reflect pertinent immunization priorities in the target population.
• Ideally, choose a selection of indicators that cover immunization coverage, the magnitude of the problem or disease (for example, measured by its incidence or reported cases) and issues related to the delivery and administration of vaccines.
Standardized indicators summarize important information about immunization and are a good place to start when selecting indicators for monitoring. While a variety of indicators have been developed that reflect many different aspects of immunization, immunization coverage indicators are among the most commonly used in monitoring. Thus, this manual focuses on monitoring inequalities in immunization coverage. More information about other types of immunization indicators within the WHO Monitoring, Evaluation and Review Framework is available in Appendix 2.
Coverage indicators typically measure the number of people that received a defined number of doses for a certain vaccine, out of the total number of people for which the vaccine was intended. There are several ways that indicators can be used to examine different aspects of coverage. In childhood immunization, the following terminology is used.
“Zero-dose children”, also referred to as “left-outs” or the proportion of completely unvaccinated, is defined as the percentage of children who have not received any of the vaccines indicated for their age in the national immunization schedule. Zero-dose children can be measured approximately as those who did not receive a first dose of DTP-containing vaccine (DTP1). The proportion of unvaccinated is often used to estimate access to vaccination services; thus, families in this category may lack access to immunization services or have low
Determine scope of monitoring
S T E P 1
ADecide on the target population
BIdentify relevant immunization indicators
CIdentify relevant dimensions of inequality
13
B. Identify relevant immunization indicators
k e y q u e s t i o n
What indicators represent pertinent immunization priorities?c h e c k l i s t
Select immunization indicators that are relevant in the target population
ST
EP
1
levels of trust in them. Data about zero-dose children are most often collected directly in household surveys, but also can be calculated on administrative reports of coverage.
The drop-out rate measures children who have received at least one initial dose of a vaccine but have not received the full set of vaccinations appropriate for their age. A high drop-out rate reflects low utilization of services among those who have access. The drop-out rate is the proportion of children who have received DTP1, but not DTP3; it can also be calculated as the proportion of children who have received the first, but not the second, dose of measles-containing vaccine (MCV).
Fully immunized child coverage refers to the proportion of children who have received all recommended vaccines, according to their age and the national schedule. This indicator is usually assessed during surveys, though it is often approximated by tracer indicators. For example, the first dose of MCV (MCV1) or DTP3 coverage (whichever is lower) is often used as a proxy for full vaccination in the first year of life, and the second dose of MCV (MCV2), as a proxy for full vaccination in the second year of life.
While the choice of indicators to be used in monitoring is dependent on data availability (see Step 2), a starting point for inequality analyses is to include: an indicator of zero-dose children (often available in household surveys or administrative data); DTP3, MCV1 and MCV2 coverage; and full immunization coverage among one-year-olds. These data are often available from household surveys or administrative data sources.
14
I N E Q UA L I T Y M O N I TO R I N G I N I M M U N I Z AT I O N: A S T E P - BY - S T E P MA N UA L

ST
EP
1
Step 1C: Best practices
• Identify possible sources of discrimination or social exclusion that might reasonably affect immunization. • Select a range of both universally applicable dimensions of inequality as well as context-specific
dimensions.
Dimensions of inequality represent factors that may constitute sources of discrimination or social exclusion that negatively impact immunization. Applied to monitoring, they are the categories that define how subgroups are formed for monitoring. Some of the common dimensions of inequality with regards to immunization coverage include place of residence (urban or rural), parental education and household income.
While certain dimensions of inequality can be widely applied across most settings (although their relevance may vary), other dimensions of inequality are more relevant within specific regions or countries. Universally applicable dimensions of inequality, as listed in Table 1, include characteristics related to the child, parents (especially the mother), household or geographic setting.
Country-specific dimensions of inequality reflect other factors that are relevant to a particular target population. Depending on the context,
* While many countries do not have inequalities in immunization coverage on the basis of child’s sex, continual monitoring according to this dimension is warranted to detect emergent variation.
Table 1. Universally applicable dimensions of inequality for childhood immunization
Classification Dimension of inequality
Child characteristics • Child’s sex*• Birth order
Parental characteristics • Mother’s age at birth• Mother’s or father’s education
Household characteristics • Sex of household head• Household economic status
Geographic characteristics • Place of residence (for example, urban or rural)• Subnational region
Determine scope of monitoring
S T E P 1
ADecide on the target population
BIdentify relevant immunization indicators
CIdentify relevant dimensions of inequality
15
C. Identify relevant dimensions of inequality
k e y q u e s t i o n
What dimensions of inequality are relevant to immunization in the target population?c h e c k l i s t
Consider common dimensions of inequality: household economic status, parental education level (especially maternal), place of residence, sex, mother’s age and other country or context-specific factors such as religion, tribe and ethnicity
Consider whether dimensions of inequality intersect and if double disaggregation should be done
For each inequality dimension identified above, determine the criteria for how to measure it
ST
EP
1
these may include: religious affiliation; remoteness; climatic zone; migrant status; conflict area; ethnicity; parental occupation; or language.
In some cases, double (or multiple) disaggregation may be warranted to explore the intersection of two (or more) dimensions of inequality at the same time. For example, the urban poor typically experience lower health service use than the urban rich. To assess whether poor children in urban areas are less likely to be vaccinated, examine coverage using two dimensions of inequality: economic status; and place of residence. In some cases, the comparison of these two subgroups (urban poor versus urban rich) may be more striking than comparisons based on either dimension considered separately. For examples and more information about double disaggregation, see Appendix 3.
16
I N E Q UA L I T Y M O N I TO R I N G I N I M M U N I Z AT I O N: A S T E P - BY - S T E P MA N UA L
S T E P1
S T E P2

S T E P 5
Report resultsKnowledge translation
S T E P 4
Report results
S T E P 3
I N E Q UA L I T Y M O N I TO R I N G I N I M M U N I Z AT I O N: A S T E P - BY - S T E P MA N UA L
Analyse data
18
A
Conduct data source mappingk e y q u e s t i o nWhat sources contain data about immunization indicators and dimensions of inequality?c h e c k l i s t
List available data sources by type (including name, year, etc.) For each data source, determine availability of data for dimensions of inequality For each data source, determine availability of data about immunization indicators Combine the information about immunization indicators and dimensions of inequality to assess data availability for
inequality monitoring
B
Determine whether sufficient data are currently availablek e y q u e s t i o nAre appropriate data available about both immunization indicators and dimensions of inequality to proceed with inequality monitoring in immunization?c h e c k l i s t
Assess the findings from the data source mapping exercise in Step 2A Consider whether data from different sources may be linked
Obtain dataS T E P 2
S T E P 2
Obtain dataDetermine scope of monitoring
S T E P 1
ST
EP
2
19
OverviewS T E P 2 addresses the need for data in order to proceed with inequality monitoring. Two streams of data are required: data about immunization indicators; and data about dimensions of inequality (as identified in Step 1). Initially, it is important to take stock of the data sources that cover the target population. Step 2A outlines the process of data source mapping, which enumerates potential data sources for monitoring. In Step 2B, which involves weighing the strengths and limitations of each data source, a determination is made about whether the available data enable inequality monitoring to proceed as planned in Step 1. Remember to note the potential limitations of the data source – this will be important for reporting (Step 4) to help the target audience more fully understand and contextualize the results.
For immunization coverage indicators, data sources often include household surveys or administrative data; in some countries, EIRs or civil registration and vital statistics (CRVS) may be used for target population (denominator) estimations. More information about immunization data sources are outlined in Appendix 4. Stakeholders at the Ministry of Health, National Statistical Bureau or elsewhere may need to be contacted to gain access to data that are not publicly available.
In situations where sufficient data are not available to proceed as planned, it may be necessary to return to Step 1. In cases of limited data availability, or where existing data are of poor quality, efforts to improve and expand data systems may be warranted (see Appendix 5).
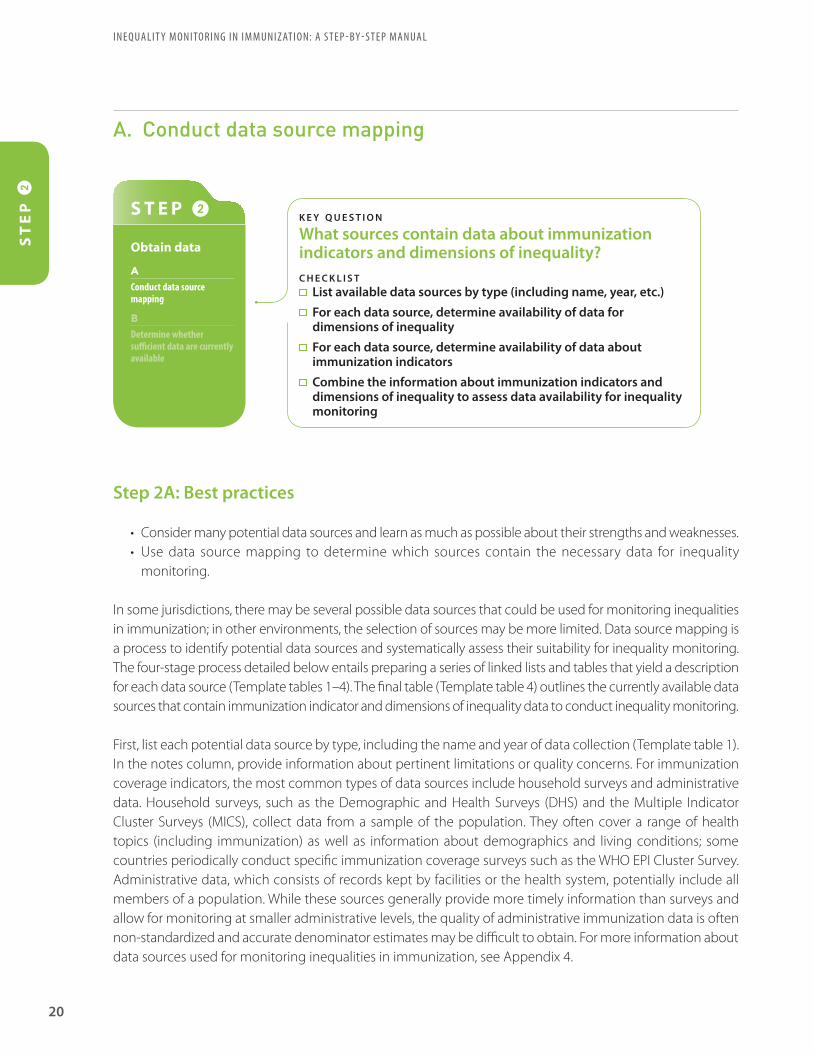
Step 2A: Best practices
• Consider many potential data sources and learn as much as possible about their strengths and weaknesses.• Use data source mapping to determine which sources contain the necessary data for inequality
monitoring.
In some jurisdictions, there may be several possible data sources that could be used for monitoring inequalities in immunization; in other environments, the selection of sources may be more limited. Data source mapping is a process to identify potential data sources and systematically assess their suitability for inequality monitoring. The four-stage process detailed below entails preparing a series of linked lists and tables that yield a description for each data source (Template tables 1–4). The final table (Template table 4) outlines the currently available data sources that contain immunization indicator and dimensions of inequality data to conduct inequality monitoring.
First, list each potential data source by type, including the name and year of data collection (Template table 1). In the notes column, provide information about pertinent limitations or quality concerns. For immunization coverage indicators, the most common types of data sources include household surveys and administrative data. Household surveys, such as the Demographic and Health Surveys (DHS) and the Multiple Indicator Cluster Surveys (MICS), collect data from a sample of the population. They often cover a range of health topics (including immunization) as well as information about demographics and living conditions; some countries periodically conduct specific immunization coverage surveys such as the WHO EPI Cluster Survey. Administrative data, which consists of records kept by facilities or the health system, potentially include all members of a population. While these sources generally provide more timely information than surveys and allow for monitoring at smaller administrative levels, the quality of administrative immunization data is often non-standardized and accurate denominator estimates may be difficult to obtain. For more information about data sources used for monitoring inequalities in immunization, see Appendix 4.
Obtain data
S T E P 2
AConduct data source mapping
BDetermine whether sufficient data are currently available
20
I N E Q UA L I T Y M O N I TO R I N G I N I M M U N I Z AT I O N: A S T E P - BY - S T E P MA N UA LS
TE
P 2
A. Conduct data source mapping
k e y q u e s t i o n
What sources contain data about immunization indicators and dimensions of inequality?c h e c k l i s t
List available data sources by type (including name, year, etc.) For each data source, determine availability of data for
dimensions of inequality For each data source, determine availability of data about
immunization indicators Combine the information about immunization indicators and
dimensions of inequality to assess data availability for inequality monitoring

Template table 1. List data sources by type
Data source type Data source name Year(s) of data collection Notes
Household survey
Administrative data
Other
Next, prepare the second table (Template table 2). For each potential data source, consider: What dimensions of inequality data are covered? The dimensions can be listed as column headers; be sure to number the rows for easy reference in the following stages.
Template table 2. List data sources and dimensions of inequality
No. Data source and year[ list all applicable]
Dimension of inequality Notes
[specify dimension] [specify dimension] [specify dimension]
Household survey (year)[specify and expand list to include other years, as required ]
Administrative data (year)[specify and expand list to include other years, as required ]
Other (year)[specify and expand list to include other years, as required ]
Then, in the third table (Template table 3), list the immunization indicators that are included in each data source (referring to the indicators selected in Step 1B). In general, vaccination coverage indicators derived from administrative reports are defined as the percentage of the estimated target population that was vaccinated with a certain vaccine and dose. Coverage indicators based on household survey data reflect the percentage of the sampled population that was vaccinated with a certain vaccine. List the indicators as rows and specify the sources that contain the indicator data in an adjacent column, using the row numbers from the previous table. Note that attention should be paid to whether indicators retain a common definition across different data sources: for example, the definition of what constitutes full immunization coverage may differ between surveys and/or administrative data reports. If the indicator definitions are not aligned, the indicators should be listed separately.
Template table 3. List the immunization indicators and corresponding data sources
Immunization indicator[ list all applicable]
Data source numbers [ insert from Template table 2]
Notes
Indicator 1
Indicator 2
Indicator 3
Indicator 4
Indicator 5
Indicator 6
[expand as required]
ST
EP
2
21
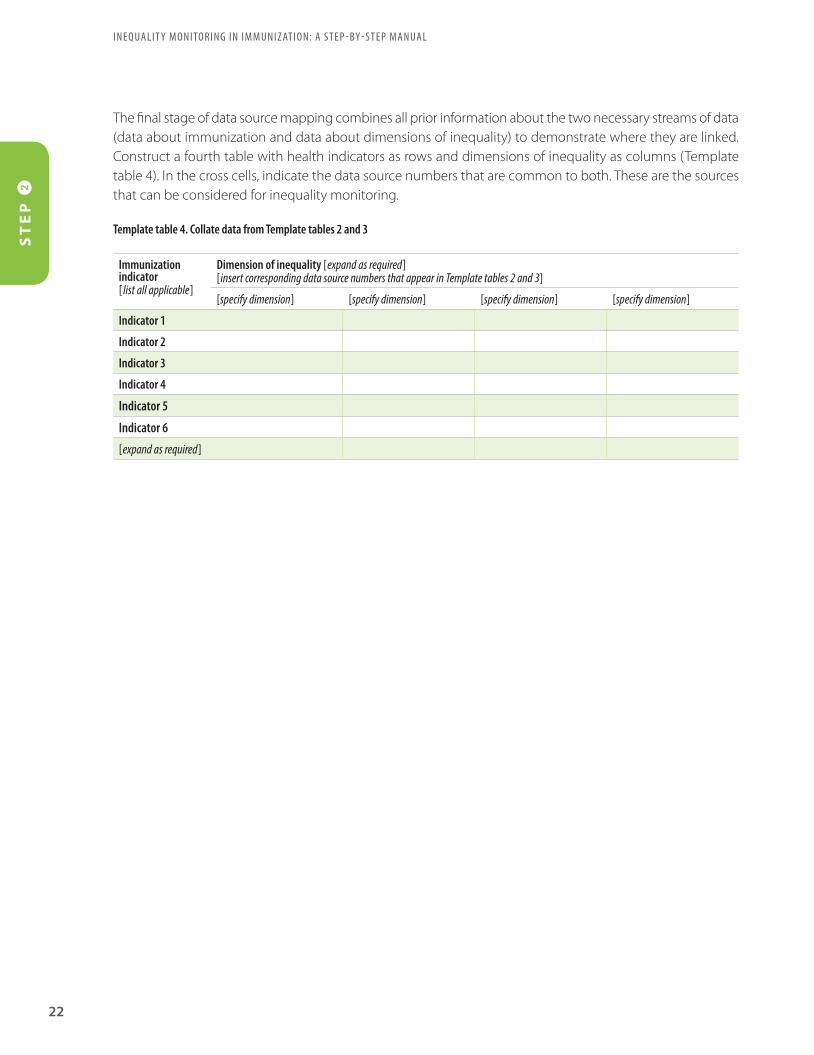
The final stage of data source mapping combines all prior information about the two necessary streams of data (data about immunization and data about dimensions of inequality) to demonstrate where they are linked. Construct a fourth table with health indicators as rows and dimensions of inequality as columns (Template table 4). In the cross cells, indicate the data source numbers that are common to both. These are the sources that can be considered for inequality monitoring.
Template table 4. Collate data from Template tables 2 and 3
Immunization indicator[ list all applicable]
Dimension of inequality [expand as required][insert corresponding data source numbers that appear in Template tables 2 and 3]
[specify dimension] [specify dimension] [specify dimension] [specify dimension]
Indicator 1
Indicator 2
Indicator 3
Indicator 4
Indicator 5
Indicator 6
[expand as required]
22
I N E Q UA L I T Y M O N I TO R I N G I N I M M U N I Z AT I O N: A S T E P - BY - S T E P MA N UA LS
TE
P 2

Step 2A: Best practices
• Select the best available, reputable data sources that contain recent data and also comparable data across multiple time points – immunization coverage can fluctuate from year to year.
• Use data triangulation (critical synthesis of data from two or more sources) to address relevant questions around inequality.
• If data availability and quality is a challenge, then this may be an opportunity to advocate for improved or expanded health information systems.
Based on the data source mapping exercise outlined in Step 2A, determine which data sources contain data about both the immunization indicators and dimensions of inequality identified in Steps 1B and 1C, respectively. If sufficient data are available, then inequality monitoring can proceed. When selecting among potential data sources for monitoring, try to choose sources that contain high-quality data and have strong legitimacy among policy, technical, academic and civil society constituencies. All data sources have limitations and potential biases, which do not necessarily mean that they should not be used. Note these shortcomings and understand how they might influence the conclusions of monitoring; convey this information to the target audience when reporting the results (Step 4).
If either type of data is lacking, then explore the possibility of linking data about immunization indicators and dimensions of inequality from different sources. Linked data are merged through individual or small-area identifiers contained in both sources (1). For instance, different data sources that each contain personal identification numbers can be used to link information about an individual’s immunization coverage with information about dimensions of inequality. Similarly, data sources that contain small-area identifiers, such as postal codes, can be linked to ecological data about the area (2). If the data sources contain such identifiers, then data managers or those with the requisite expertise may be consulted to assist with merging the
Obtain data
S T E P 2
AConduct data source mapping
BDetermine whether sufficient data are currently available
ST
EP
2
23
B. Determine whether sufficient data are currently available
k e y q u e s t i o n
Are appropriate data available about both immunization indicators and dimensions of inequality to proceed with inequality monitoring in immunization?c h e c k l i s t
Assess the findings from the data source mapping exercise in Step 2A
Consider whether data from different sources may be linked
sources. Recognizing that some data sources may not contain individual or small-area identifiers, including the collection of this information in data sources in the future is recommended to strengthen the usability of the source.
If data are not available (that is, have not been collected), then it is not possible for inequality monitoring in immunization to proceed as planned. Data availability is often limited in urban poor settings, remote rural settings and for children affected by conflict; additionally, information about underlying gender-related barriers and inequalities, typically measured through proxy indicators, may sometimes be lacking. The lack of data from these situations precludes the inclusion of some of the most disadvantaged subgroups in monitoring efforts, and warrants attention to expand and improve data collection. For more information about how to overcome limited data availability, see Appendix 5. In the meantime, however, consider returning to Step 1 to identify other immunization indicators and inequality dimensions for which data are currently available.
References
1. Hosseinpoor AR, Bergen N. Area-based units of analysis for strengthening health inequality monitoring. Bull World Health Organ. 2016 Nov 1;94(1564–0604 [Electronic]):856–8.
2. Hughes A, Mesher D, White J, Soldan K. Coverage of the English national human papillomavirus (HPV) immunisation programme among 12 to 17 year-old females by area-level deprivation score, England, 2008 to 2011. Eurosurveillance. 2014 Jan 16;19(2):20677.
24
I N E Q UA L I T Y M O N I TO R I N G I N I M M U N I Z AT I O N: A S T E P - BY - S T E P MA N UA LS
TE
P 2
S T E P1
S T E P3
S T E P 5
Report resultsKnowledge translation
S T E P 4
Report results
I N E Q UA L I T Y M O N I TO R I N G I N I M M U N I Z AT I O N: A S T E P - BY - S T E P MA N UA L
26
A
Prepare disaggregated datak e y q u e s t i o nWhat is the level of the immunization indicator in each population subgroup?c h e c k l i s t
Prepare the dataset for analysis Define how to measure the immunization indicator, including the numerator and denominator Define the number of subgroups for each dimension of inequality Calculate disaggregated data estimates
B
Calculate summary measures of inequalityk e y q u e s t i o nWhat are the absolute and relative levels of inequality in immunization?c h e c k l i s t
For each immunization indicator and dimension of inequality combination, calculate absolute inequality For each immunization indicator and dimension of inequality combination, calculate relative inequality
Analyse dataS T E P 3
S T E P 3
Analyse data
S T E P 2
Obtain dataDetermine scope of monitoring
S T E P 1

ST
EP
3
27
OverviewS T E P 3 of monitoring inequalities in immunization involves analysing the data and generating numerical outputs that describe inequalities. To start, Step 3A entails compiling data about each immunization indicator broken down by population subgroups. (Recall that the population subgroups reflect the relevant dimensions of inequality identified in Step 1C.) This process yields disaggregated estimates, which can be visually compared for an initial assessment of inequality. In Step 3B, the disaggregated estimates are used as inputs to calculate summary measures of inequality. Summary measures of inequality provide a single number that demonstrates the level of inequality between two or more subgroups. Step 3B also raises the possibility of using complementary forms of analysis. While this step is technical in nature, analysis approaches range from simple and intuitive to highly advanced. In most cases, simple approaches are preferable as they are easier to communicate to the target audience; however, more advanced analysis approaches, as resources and expertise allow, may be warranted to reveal nuanced findings. Thus, this (introductory) manual primarily focuses on simple measures of inequality, with a brief overview of complex measures of inequality. For more information and resources about complex measures of inequality, see Appendix 6. Further data analysis approaches, namely multiple regression analysis and compounded vulnerability calculations, are discussed in Appendix 7.
Throughout Step 3, readers may wish to explore possibilities to use existing software and online tools to facilitate the analysis process. This manual highlights the WHO Health Equity Assessment Toolkit (HEAT) software application.
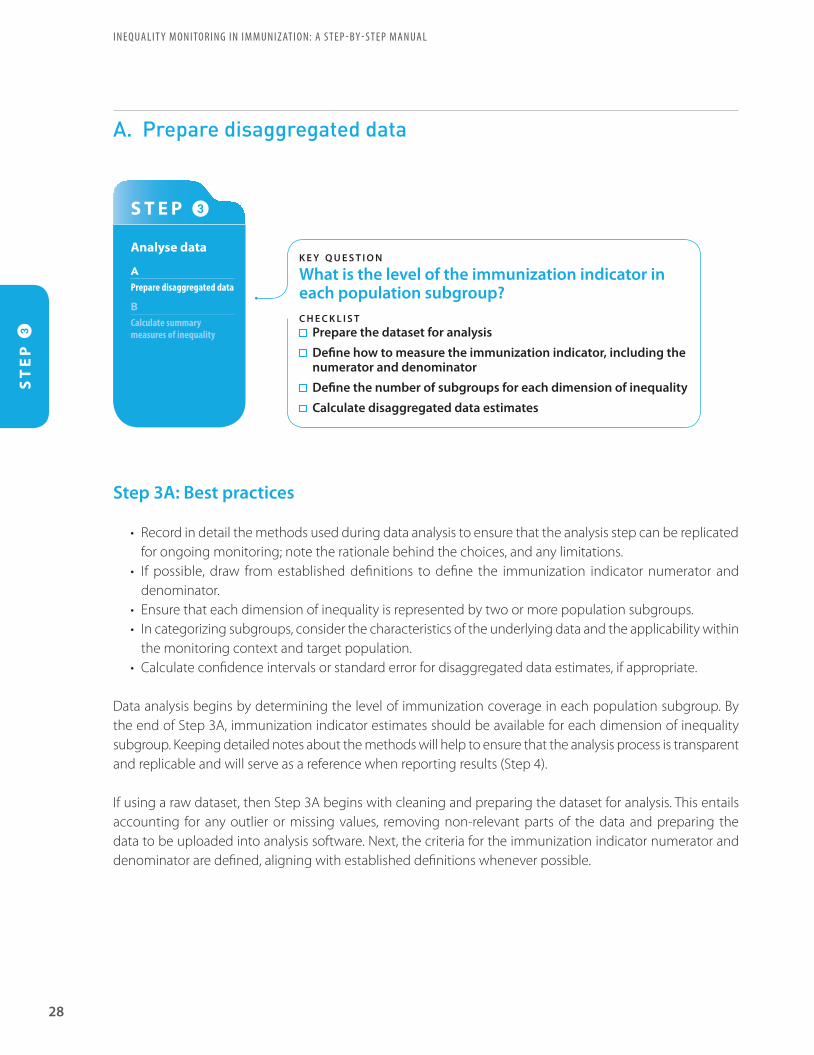
Step 3A: Best practices
• Record in detail the methods used during data analysis to ensure that the analysis step can be replicated for ongoing monitoring; note the rationale behind the choices, and any limitations.
• If possible, draw from established definitions to define the immunization indicator numerator and denominator.
• Ensure that each dimension of inequality is represented by two or more population subgroups.• In categorizing subgroups, consider the characteristics of the underlying data and the applicability within
the monitoring context and target population.• Calculate confidence intervals or standard error for disaggregated data estimates, if appropriate.
Data analysis begins by determining the level of immunization coverage in each population subgroup. By the end of Step 3A, immunization indicator estimates should be available for each dimension of inequality subgroup. Keeping detailed notes about the methods will help to ensure that the analysis process is transparent and replicable and will serve as a reference when reporting results (Step 4).
If using a raw dataset, then Step 3A begins with cleaning and preparing the dataset for analysis. This entails accounting for any outlier or missing values, removing non-relevant parts of the data and preparing the data to be uploaded into analysis software. Next, the criteria for the immunization indicator numerator and denominator are defined, aligning with established definitions whenever possible.
Analyse data
S T E P 3
APrepare disaggregated data
BCalculate summary measures of inequality
28
I N E Q UA L I T Y M O N I TO R I N G I N I M M U N I Z AT I O N: A S T E P - BY - S T E P MA N UA LS
TE
P 3
A. Preparedisaggregateddata
k e y q u e s t i o n
What is the level of the immunization indicator in each population subgroup?c h e c k l i s t
Prepare the dataset for analysis Define how to measure the immunization indicator, including the
numerator and denominator Define the number of subgroups for each dimension of inequality Calculate disaggregated data estimates
The target population is then divided into subgroups based on the dimensions of inequality identified in Step 1C. While this may seem straightforward, there are nuanced issues in categorizing individuals of the target population. Defining subgroups on the basis of economic status, for example, may entail categorization by quintiles, deciles or as two groupings (sometimes configured as the poorest 40% and the richest 60%). Similarly, place of residence may consist of rural and urban subgroups, or may also include other specifications such as main rural, remote rural, peri-urban or suburban. The categorization of population subgroups depends, in part, on the characteristics of the data (What information is available?) and, in part, on the monitoring context (What distinctions are commonly used and make sense within the target population?). Box 2 demonstrates how population subgroup categorization has been applied in Ethiopia.
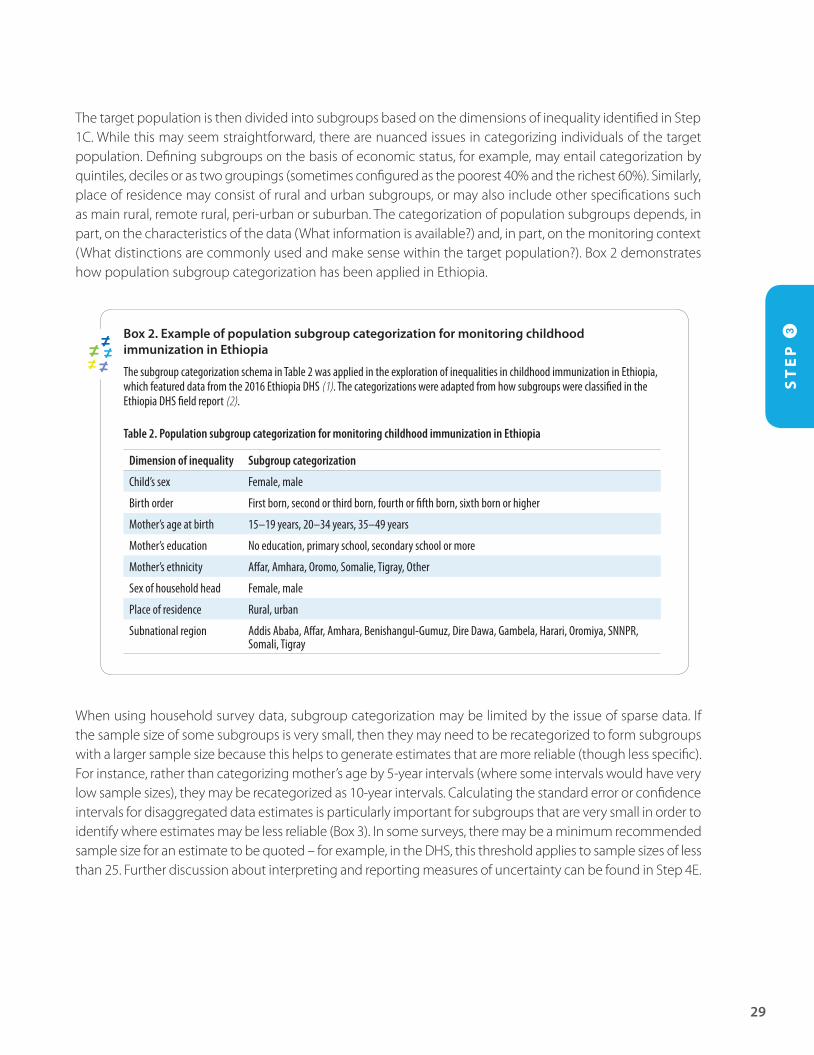
Box 2. Example of population subgroup categorization for monitoring childhood immunization in Ethiopia
The subgroup categorization schema in Table 2 was applied in the exploration of inequalities in childhood immunization in Ethiopia, which featured data from the 2016 Ethiopia DHS (1). The categorizations were adapted from how subgroups were classified in the Ethiopia DHS field report (2).
Table 2. Population subgroup categorization for monitoring childhood immunization in Ethiopia
Dimension of inequality Subgroup categorization
Child’s sex Female, male
Birth order First born, second or third born, fourth or fifth born, sixth born or higher
Mother’s age at birth 15–19 years, 20–34 years, 35–49 years
Mother’s education No education, primary school, secondary school or more
Mother’s ethnicity Affar, Amhara, Oromo, Somalie, Tigray, Other
Sex of household head Female, male
Place of residence Rural, urban
Subnational region Addis Ababa, Affar, Amhara, Benishangul-Gumuz, Dire Dawa, Gambela, Harari, Oromiya, SNNPR, Somali, Tigray
When using household survey data, subgroup categorization may be limited by the issue of sparse data. If the sample size of some subgroups is very small, then they may need to be recategorized to form subgroups with a larger sample size because this helps to generate estimates that are more reliable (though less specific). For instance, rather than categorizing mother’s age by 5-year intervals (where some intervals would have very low sample sizes), they may be recategorized as 10-year intervals. Calculating the standard error or confidence intervals for disaggregated data estimates is particularly important for subgroups that are very small in order to identify where estimates may be less reliable (Box 3). In some surveys, there may be a minimum recommended sample size for an estimate to be quoted – for example, in the DHS, this threshold applies to sample sizes of less than 25. Further discussion about interpreting and reporting measures of uncertainty can be found in Step 4E.
ST
EP
3
29
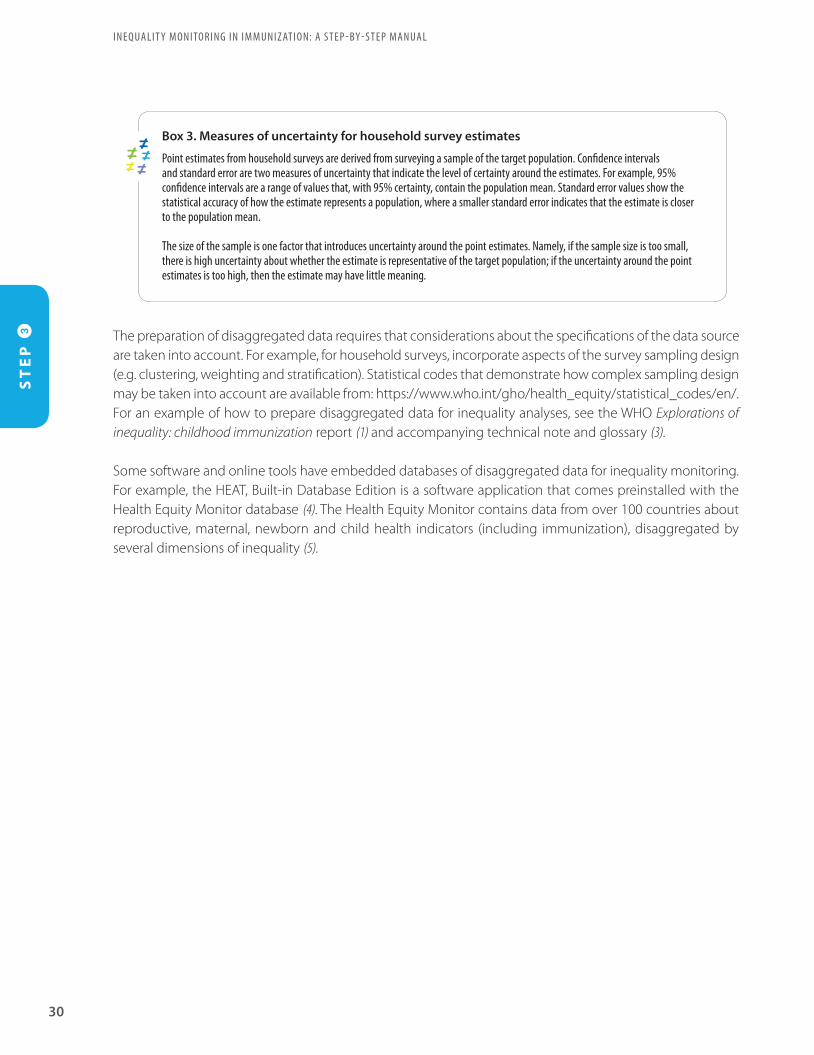
Box 3. Measures of uncertainty for household survey estimates
Point estimates from household surveys are derived from surveying a sample of the target population. Confidence intervals and standard error are two measures of uncertainty that indicate the level of certainty around the estimates. For example, 95% confidence intervals are a range of values that, with 95% certainty, contain the population mean. Standard error values show the statistical accuracy of how the estimate represents a population, where a smaller standard error indicates that the estimate is closer to the population mean.
The size of the sample is one factor that introduces uncertainty around the point estimates. Namely, if the sample size is too small, there is high uncertainty about whether the estimate is representative of the target population; if the uncertainty around the point estimates is too high, then the estimate may have little meaning.
The preparation of disaggregated data requires that considerations about the specifications of the data source are taken into account. For example, for household surveys, incorporate aspects of the survey sampling design (e.g. clustering, weighting and stratification). Statistical codes that demonstrate how complex sampling design may be taken into account are available from: https://www.who.int/gho/health_equity/statistical_codes/en/. For an example of how to prepare disaggregated data for inequality analyses, see the WHO Explorations of inequality: childhood immunization report (1) and accompanying technical note and glossary (3).
Some software and online tools have embedded databases of disaggregated data for inequality monitoring. For example, the HEAT, Built-in Database Edition is a software application that comes preinstalled with the Health Equity Monitor database (4). The Health Equity Monitor contains data from over 100 countries about reproductive, maternal, newborn and child health indicators (including immunization), disaggregated by several dimensions of inequality (5).
30
I N E Q UA L I T Y M O N I TO R I N G I N I M M U N I Z AT I O N: A S T E P - BY - S T E P MA N UA LS
TE
P 3
Step 3B: Best practices
• Based on the characteristics of the underlying disaggregated data, select the appropriate summary measures of inequality. Summary measures may be simple or complex, ordered or non-ordered, and weighted or unweighted; certain measures may require the selection of a reference group.
• Calculate both absolute and relative summary measures of inequality, as they capture different aspects of inequality.
Building on the disaggregated data in Step 3A, this stage of data analysis entails calculating summary measures of inequality. Summary measures of inequality are a concise way to represent the level of inequality across multiple subgroups using one number.
There are two broad types of summary measures: those that measure absolute inequality (for example, difference in coverage between two subgroups, showing the magnitude of inequality); and those that measure relative inequality (for example, the ratio of coverage between two subgroups, showing proportional inequality). When analysing data for monitoring inequalities in immunization, both absolute and relative measures should be used.
Another distinction can be made between simple and complex measures of inequality: while simple measures draw on data from two subgroups, complex measures integrate data from more than two subgroups. There are absolute and relative versions of simple and complex measures.
Simple measures of inequality include difference (absolute) and ratio (relative) (Box 4). While simple measures are particularly intuitive to compare between dimensions of inequality that consist of only two subgroups
Analyse data
S T E P 3
APrepare disaggregated data
BCalculate summary measures of inequality
ST
EP
3
31
B. Calculate summary measures of inequality
k e y q u e s t i o n
What are the absolute and relative levels of inequality in immunization?c h e c k l i s t
For each immunization indicator and dimension of inequality combination, calculate absolute inequality
For each immunization indicator and dimension of inequality combination, calculate relative inequality
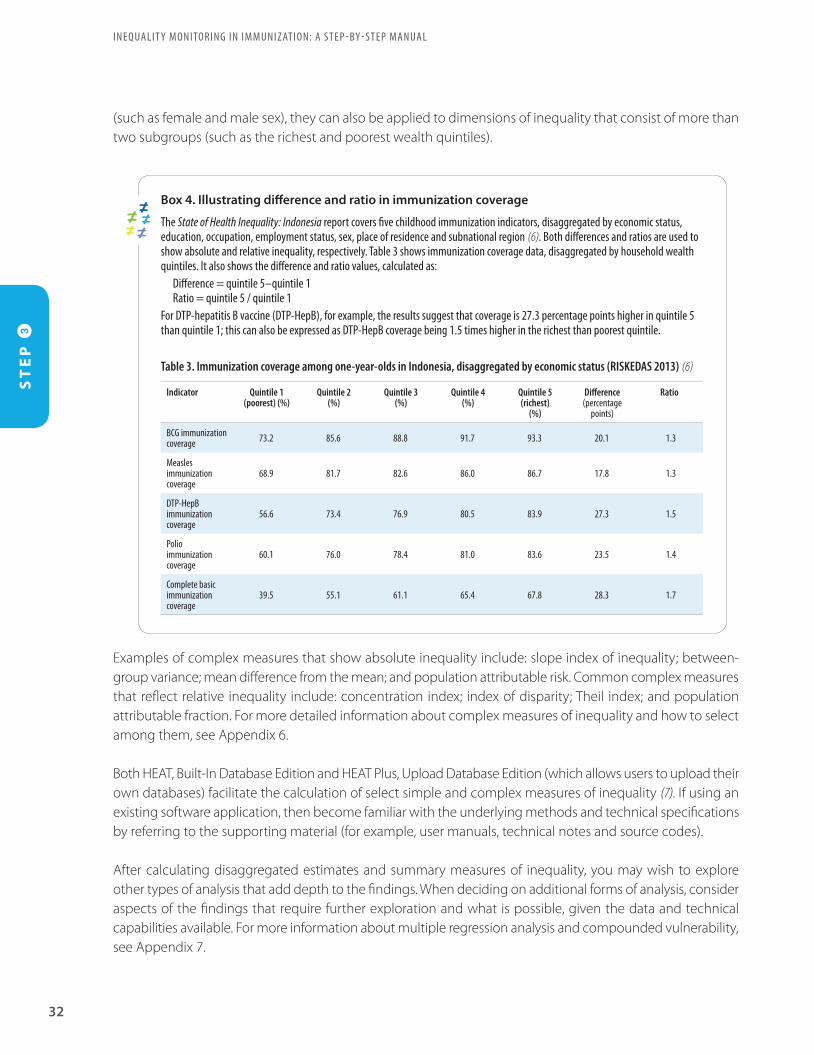
(such as female and male sex), they can also be applied to dimensions of inequality that consist of more than two subgroups (such as the richest and poorest wealth quintiles).
Box 4. Illustrating difference and ratio in immunization coverage
The State of Health Inequality: Indonesia report covers five childhood immunization indicators, disaggregated by economic status, education, occupation, employment status, sex, place of residence and subnational region (6). Both differences and ratios are used to show absolute and relative inequality, respectively. Table 3 shows immunization coverage data, disaggregated by household wealth quintiles. It also shows the difference and ratio values, calculated as:
Difference = quintile 5–quintile 1Ratio = quintile 5 / quintile 1
For DTP-hepatitis B vaccine (DTP-HepB), for example, the results suggest that coverage is 27.3 percentage points higher in quintile 5 than quintile 1; this can also be expressed as DTP-HepB coverage being 1.5 times higher in the richest than poorest quintile.
Table 3. Immunization coverage among one-year-olds in Indonesia, disaggregated by economic status (RISKEDAS 2013) (6)
Indicator Quintile 1(poorest) (%)
Quintile 2(%)
Quintile 3(%)
Quintile 4(%)
Quintile 5(richest)
(%)
Difference (percentage
points)
Ratio
BCG immunization coverage 73.2 85.6 88.8 91.7 93.3 20.1 1.3
Measles immunization coverage
68.9 81.7 82.6 86.0 86.7 17.8 1.3
DTP-HepB immunization coverage
56.6 73.4 76.9 80.5 83.9 27.3 1.5
Polio immunization coverage
60.1 76.0 78.4 81.0 83.6 23.5 1.4
Complete basic immunization coverage
39.5 55.1 61.1 65.4 67.8 28.3 1.7
Examples of complex measures that show absolute inequality include: slope index of inequality; between-group variance; mean difference from the mean; and population attributable risk. Common complex measures that reflect relative inequality include: concentration index; index of disparity; Theil index; and population attributable fraction. For more detailed information about complex measures of inequality and how to select among them, see Appendix 6.
Both HEAT, Built-In Database Edition and HEAT Plus, Upload Database Edition (which allows users to upload their own databases) facilitate the calculation of select simple and complex measures of inequality (7). If using an existing software application, then become familiar with the underlying methods and technical specifications by referring to the supporting material (for example, user manuals, technical notes and source codes).
After calculating disaggregated estimates and summary measures of inequality, you may wish to explore other types of analysis that add depth to the findings. When deciding on additional forms of analysis, consider aspects of the findings that require further exploration and what is possible, given the data and technical capabilities available. For more information about multiple regression analysis and compounded vulnerability, see Appendix 7.
32
I N E Q UA L I T Y M O N I TO R I N G I N I M M U N I Z AT I O N: A S T E P - BY - S T E P MA N UA LS
TE
P 3

References
1. Explorations of inequality: childhood immunization. Geneva: World Health Organization; 2018.
2. Central Statistical Agency. Ethiopia Demographic and Health Survey 2016. Rockville, MD, USA: The DHS Program; 2017.
3. Explorations of inequality: childhood immunization. Technical note and glossary [Internet]. World Health Organization; 2018 (https://www.who.int/gho/health_equity/report_2018_immunization/technical_notes.pdf?ua=1, accessed 8 September 2019).
4. Health Equity Assessment Toolkit: HEAT, Built-in Database Edition [Internet]. Global Health Observatory. World Health Organization; 2019 (https://www.who.int/gho/health_equity/assessment_toolkit/en/index1.html, accessed 8 September 2019).
5. Health Equity Monitor [Internet]. Global Health Observatory. World Health Organization; 2019 (http://www.who.int/gho/health_equity/en/, accessed 8 September 2019).
6. State of health inequality: Indonesia. Geneva: World Health Organization; 2017.
7. Health Equity Assessment Toolkit: HEAT Plus, Upload Database Edition [Internet]. Global Health Observatory. World Health Organization; 2019 (https://www.who.int/gho/health_equity/assessment_toolkit/en/index2.html, accessed 8 September 2019).
ST
EP
3
33


S T E P1
S T E P4
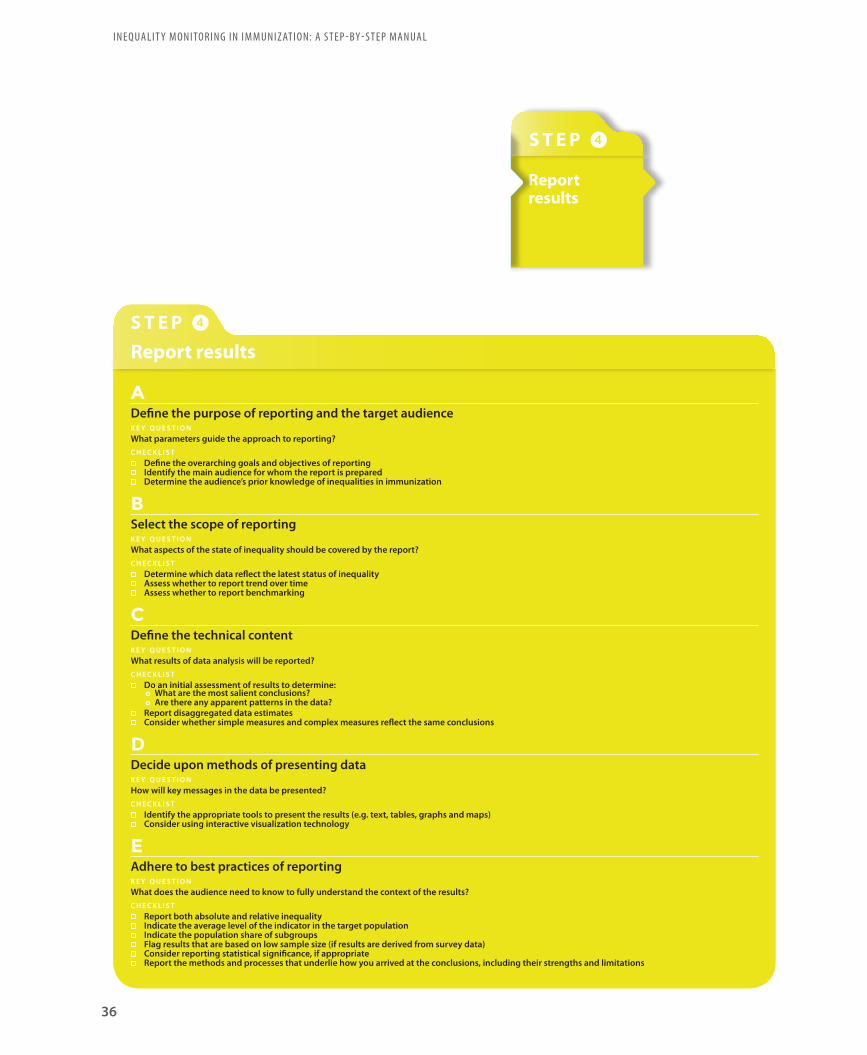
S T E P 5
Report resultsKnowledge translation
I N E Q UA L I T Y M O N I TO R I N G I N I M M U N I Z AT I O N: A S T E P - BY - S T E P MA N UA L
36
ADefine the purpose of reporting and the target audiencek e y q u e s t i o nWhat parameters guide the approach to reporting?c h e c k l i s t
Define the overarching goals and objectives of reporting Identify the main audience for whom the report is prepared Determine the audience’s prior knowledge of inequalities in immunization
BSelect the scope of reportingk e y q u e s t i o nWhat aspects of the state of inequality should be covered by the report?c h e c k l i s t
Determine which data reflect the latest status of inequality Assess whether to report trend over time Assess whether to report benchmarking
CDefine the technical contentk e y q u e s t i o nWhat results of data analysis will be reported?c h e c k l i s t
Do an initial assessment of results to determine: What are the most salient conclusions? Are there any apparent patterns in the data?
Report disaggregated data estimates Consider whether simple measures and complex measures reflect the same conclusions
DDecide upon methods of presenting datak e y q u e s t i o nHow will key messages in the data be presented?c h e c k l i s t
Identify the appropriate tools to present the results (e.g. text, tables, graphs and maps) Consider using interactive visualization technology
EAdhere to best practices of reportingk e y q u e s t i o nWhat does the audience need to know to fully understand the context of the results? c h e c k l i s t
Report both absolute and relative inequality Indicate the average level of the indicator in the target population Indicate the population share of subgroups Flag results that are based on low sample size (if results are derived from survey data) Consider reporting statistical significance, if appropriate Report the methods and processes that underlie how you arrived at the conclusions, including their strengths and limitations
Report resultsS T E P 4
S T E P 4
Report results
S T E P 3
Analyse data
S T E P 2
Obtain dataDetermine scope of monitoring
S T E P 1
ST
EP
4
37
OverviewS T E P 4 focuses on reporting the state of inequality in immunization to the target audience. In this step, the decisions taken around the scope of monitoring, data sources and analysis (Steps 1–3) will inform how the results are reported, and to whom. Importantly, before embarking on reporting, have a thorough understanding of the results and the inherent limitations of the data sources and analysis approaches on which they are based.
In this step, a useful starting point is to revisit the original objectives of the monitoring activity, and recall why the monitoring was undertaken. This helps to clarify the desired impact of reporting (for example, to inform policy, programme and practice decisions) and to identify the appropriate target audience that has a role in using the results for implementing changes (Step 4A). These considerations influence all subsequent reporting decisions surrounding the scope of reporting (Step 4B), the technical content (Step 4C) and the methods of presenting data (Step 4D). Step 4E calls attention to the best practices of reporting. Appendix 8 provides a case study of how results of inequality monitoring in immunization have been reported, attending to each of the sub-Steps 4A–E.
Reporting immunization inequalities may take many forms, such as written reports, multimedia presentations, policy briefs or online interactive platforms. Keep in mind that the same analysis may be adapted for different target audiences: a research paper may be prepared to target academic audiences; a technical report for monitoring and evaluation officers; and a policy brief for target policy-makers. The general considerations outlined throughout Step 4 can be applied to most types of reporting outputs, though the successful execution will require in-depth knowledge specific to the reporting format. One way to ensure that the reporting will have the desired impact is to do a pilot test of the approach with a few members of the target audience to solicit feedback and make necessary changes.

Step 4A: Best practices
• Take a practical stance in determining the approach to reporting: establish goals and objectives that the findings can fulfil, and that will resonate within the context of reporting.
• Identify the target audience that is best positioned to act on or benefit from the findings.
In defining the purpose of reporting, recall the broad, underlying reason for monitoring inequalities in immunization in order to ensure that the benefits of vaccination are extended equally to all people. Ideally, the purpose of reporting addresses this broader vision, albeit in a more narrow and focused manner.
When determining the purpose for reporting, it is useful to establish the overarching goals and objectives for the reporting output. For example, it may seek to facilitate a better understanding of the gaps in immunization between districts of a country. Clearly stated goals and objectives help to ensure that all aspects of reporting support these intended outcomes.
Reporting may entail communicating information to one or more target audiences. Having a clear understanding of the audience, including their abilities, interests and needs, will help to make the communication of the results more effective. Target audiences may include, for example: National Immunization Technical Advisory Group (NITAG) members; researchers with a focus on immunization topics; technical experts who develop guidelines about vaccine delivery protocols; public health practitioners responsible for community mobilization for immunization; politicians or policy-makers who allocate resources for immunization programmes; and advocacy groups involved in increasing awareness about immunization. In some cases, the target audience might be outside of the health sector.
ST
EP
4I N E Q UA L I T Y M O N I TO R I N G I N I M M U N I Z AT I O N: A S T E P - BY - S T E P MA N UA L
38
A. Define the purpose of reporting and the target audience
Report results
S T E P 4
ADefine the purpose of reporting and the target audienceBSelect the scope of reportingCDefine the technical content of the reportDDecide upon methods of presenting data
EAdhere to best practices of reporting
k e y q u e s t i o n
What parameters guide the approach to reporting?c h e c k l i s t
Define the overarching goals and objectives of reporting
Identify the main audience for whom the report is prepared
Determine the audience’s prior knowledge of inequalities in immunization

Step 4B: Best practices
• Report the current state of inequality using the latest available data.• When possible, contextualize the results by indicating how inequalities have changed over time, and
how the state of inequality in the monitoring jurisdiction compares to other similar jurisdictions.
While the data analysis step (Step 3) may have generated many results, the reporting stage requires careful consideration of which results are most pertinent to report to the target audience. At a minimum, reporting should present the latest status of immunization inequality. If reporting on immunization coverage, for example, then this updates the target audience with information such as: the current coverage in the target population and its subgroups; how the target population and its subgroups are faring with regards to immunization targets; and priority areas for further action.
The scope of reporting may also encompass trends over time or benchmarking. Given that immunization can vary from year to year, especially in fragile settings, reporting multi-year trends can help to get an overall picture of performance over time. The interval between monitoring depends largely on the availability of data: while household surveys are generally conducted every 3–5 years, inequality analyses based on routinely collected administrative data sources may be possible on an annual basis.
If reporting trend over time, it may be pertinent to highlight key milestones related to immunization – such as major changes to immunization policies or procedures in the country – that help readers to contextualize the results. Similarly, benchmarking, the process of comparing data from similar areas to get an idea of the level of inequality in one area in relation to other areas adds context and depth to the state of inequality (Box 5).
ST
EP
4
39
B. Select the scope of reporting
Report results
S T E P 4
ADefine the purpose of reporting and the target audienceBSelect the scope of reportingCDefine the technical content of the reportDDecide upon methods of presenting data
EAdhere to best practices of reporting
k e y q u e s t i o n
What aspects of the state of inequality should be covered by the report?c h e c k l i s t
Determine which data reflect the latest status of inequality
Assess whether to report trend over time Assess whether to report benchmarking
Box 5. Best practices of benchmarking
When used in inequality reporting, benchmarking presents the results for the target population alongside one or more other populations or targets, for the sake of comparison. Absolute benchmarking (such as reaching 80% coverage in all groups) is one approach. Other approaches involve making comparisons between countries, between subnational regions within a country, or against the national mean. Relevant contextual information should be provided to illustrate how the populations are similar and different. Populations may be chosen for benchmarking because they are located in the same geographical region, belong to the same country-income level grouping, or have the same population size as the target population. Note any exceptional circumstances that may account for high or low performers, such as differences in funding or other resources. Ensure that the data sources and analysis methods are comparable between the populations, or highlight where differences exist.
ST
EP
4I N E Q UA L I T Y M O N I TO R I N G I N I M M U N I Z AT I O N: A S T E P - BY - S T E P MA N UA L
40
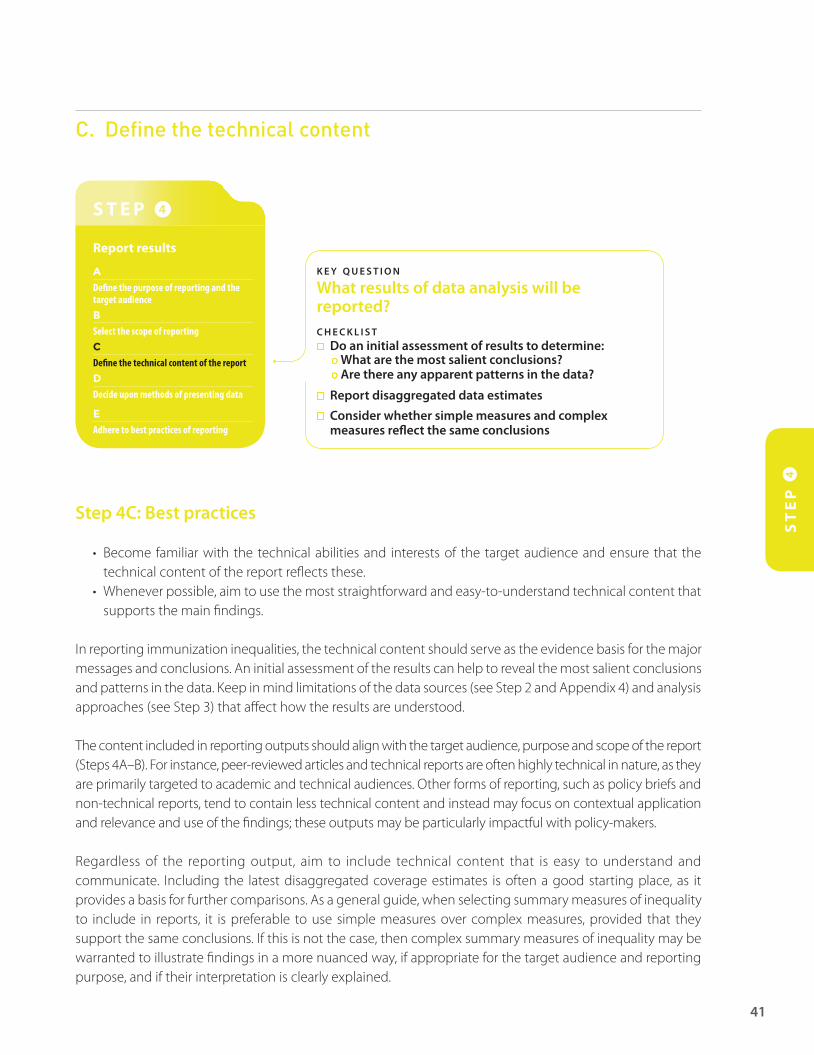
Step 4C: Best practices
• Become familiar with the technical abilities and interests of the target audience and ensure that the technical content of the report reflects these.
• Whenever possible, aim to use the most straightforward and easy-to-understand technical content that supports the main findings.
In reporting immunization inequalities, the technical content should serve as the evidence basis for the major messages and conclusions. An initial assessment of the results can help to reveal the most salient conclusions and patterns in the data. Keep in mind limitations of the data sources (see Step 2 and Appendix 4) and analysis approaches (see Step 3) that affect how the results are understood.
The content included in reporting outputs should align with the target audience, purpose and scope of the report (Steps 4A–B). For instance, peer-reviewed articles and technical reports are often highly technical in nature, as they are primarily targeted to academic and technical audiences. Other forms of reporting, such as policy briefs and non-technical reports, tend to contain less technical content and instead may focus on contextual application and relevance and use of the findings; these outputs may be particularly impactful with policy-makers. Regardless of the reporting output, aim to include technical content that is easy to understand and communicate. Including the latest disaggregated coverage estimates is often a good starting place, as it provides a basis for further comparisons. As a general guide, when selecting summary measures of inequality to include in reports, it is preferable to use simple measures over complex measures, provided that they support the same conclusions. If this is not the case, then complex summary measures of inequality may be warranted to illustrate findings in a more nuanced way, if appropriate for the target audience and reporting purpose, and if their interpretation is clearly explained.
ST
EP
4
41
C. Define the technical content
Report results
S T E P 4
ADefine the purpose of reporting and the target audienceBSelect the scope of reportingCDefine the technical content of the reportDDecide upon methods of presenting data
EAdhere to best practices of reporting
k e y q u e s t i o n
What results of data analysis will be reported?c h e c k l i s t
Do an initial assessment of results to determine: What are the most salient conclusions? Are there any apparent patterns in the data?
Report disaggregated data estimates Consider whether simple measures and complex
measures reflect the same conclusions
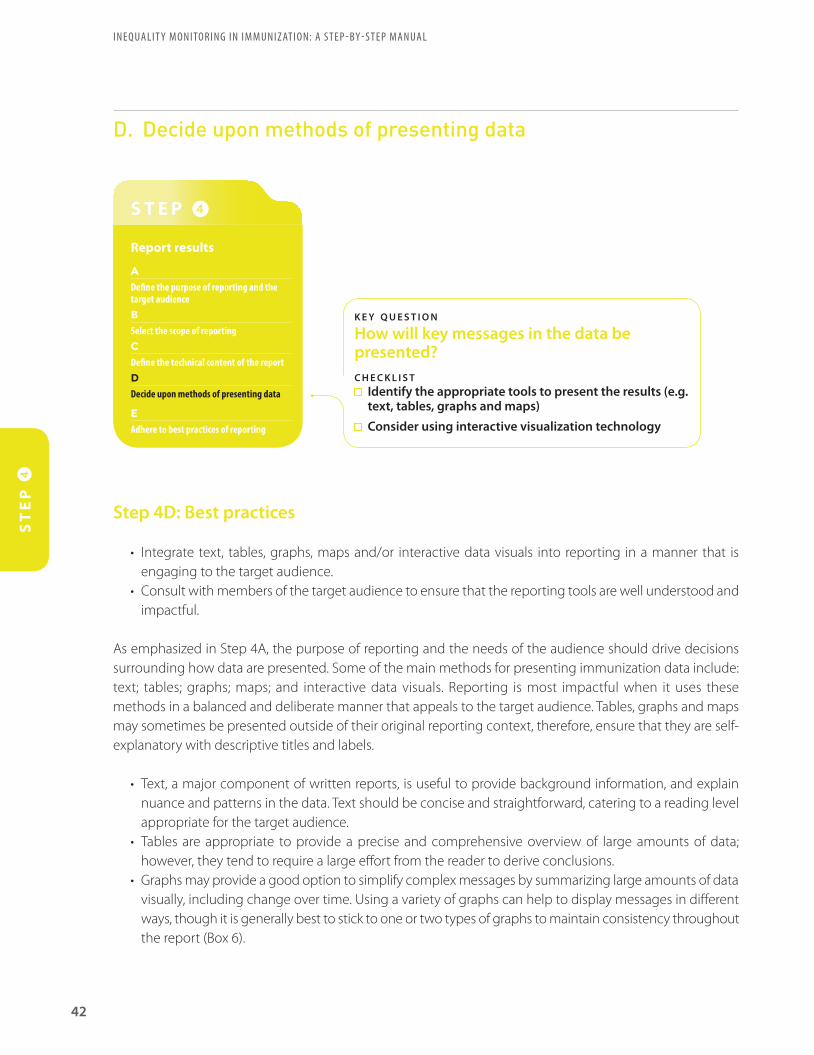
Step 4D: Best practices
• Integrate text, tables, graphs, maps and/or interactive data visuals into reporting in a manner that is engaging to the target audience.
• Consult with members of the target audience to ensure that the reporting tools are well understood and impactful.
As emphasized in Step 4A, the purpose of reporting and the needs of the audience should drive decisions surrounding how data are presented. Some of the main methods for presenting immunization data include: text; tables; graphs; maps; and interactive data visuals. Reporting is most impactful when it uses these methods in a balanced and deliberate manner that appeals to the target audience. Tables, graphs and maps may sometimes be presented outside of their original reporting context, therefore, ensure that they are self-explanatory with descriptive titles and labels.
• Text, a major component of written reports, is useful to provide background information, and explain nuance and patterns in the data. Text should be concise and straightforward, catering to a reading level appropriate for the target audience.
• Tables are appropriate to provide a precise and comprehensive overview of large amounts of data; however, they tend to require a large effort from the reader to derive conclusions.
• Graphs may provide a good option to simplify complex messages by summarizing large amounts of data visually, including change over time. Using a variety of graphs can help to display messages in different ways, though it is generally best to stick to one or two types of graphs to maintain consistency throughout the report (Box 6).
ST
EP
4I N E Q UA L I T Y M O N I TO R I N G I N I M M U N I Z AT I O N: A S T E P - BY - S T E P MA N UA L
42
D. Decide upon methods of presenting data
Report results
S T E P 4
ADefine the purpose of reporting and the target audienceBSelect the scope of reportingCDefine the technical content of the reportDDecide upon methods of presenting data
EAdhere to best practices of reporting
k e y q u e s t i o n
How will key messages in the data be presented?c h e c k l i s t
Identify the appropriate tools to present the results (e.g. text, tables, graphs and maps)
Consider using interactive visualization technology

• Maps can be used to show data with a geographical component; keep in mind, however, that the size of the areas on the map may not correspond with the population size or density.
• Interactive visualization technology offers expanding possibilities for data exploration digitally. Numerous software programmes are available to assist with creating data visuals, from widely available software with many applications to more specialized statistics and visual analytics software.
ST
EP
4
43
Box 6. Showing immunization data graphically
There are many possible types of graphs that can be used to illustrate inequalities in immunization (1,2). The choice of graph should correspond with the amount and type of information that needs to be presented (for example, national averages, disaggregated data, summary measures or change over time). It should also reflect the needs and preferences of the target audience. Examples of graphs that are commonly employed when reporting inequalities include:
• Horizontal bar chart: These graphs are useful to show national data for several countries, or to show disaggregated data across multiple subgroups. A vertical line through the bars can be used to indicate the median value (middle point of all values) or national average. Bar charts can also be drawn vertically with a horizontal line showing the median value or national value (see Figure 1).
Figure 1. Horizontal bar chart showing national average of DTP3 immunization coverage in 13 countries from the WHO South-East Asia and Western Pacific regions (DHS and MICS, 2008–2017)
l10
l0
l30
l20
l40
l60
l50
l80
l70
l90
l100
Median=83.8%
National average (%)
Mongolia
Lao People’s Democratic Republic
Maldives
Bangladesh
Thailand
Viet Nam
Nepal
Cambodia
Philippines
India
Indonesia
Myanmar
Timor-Leste
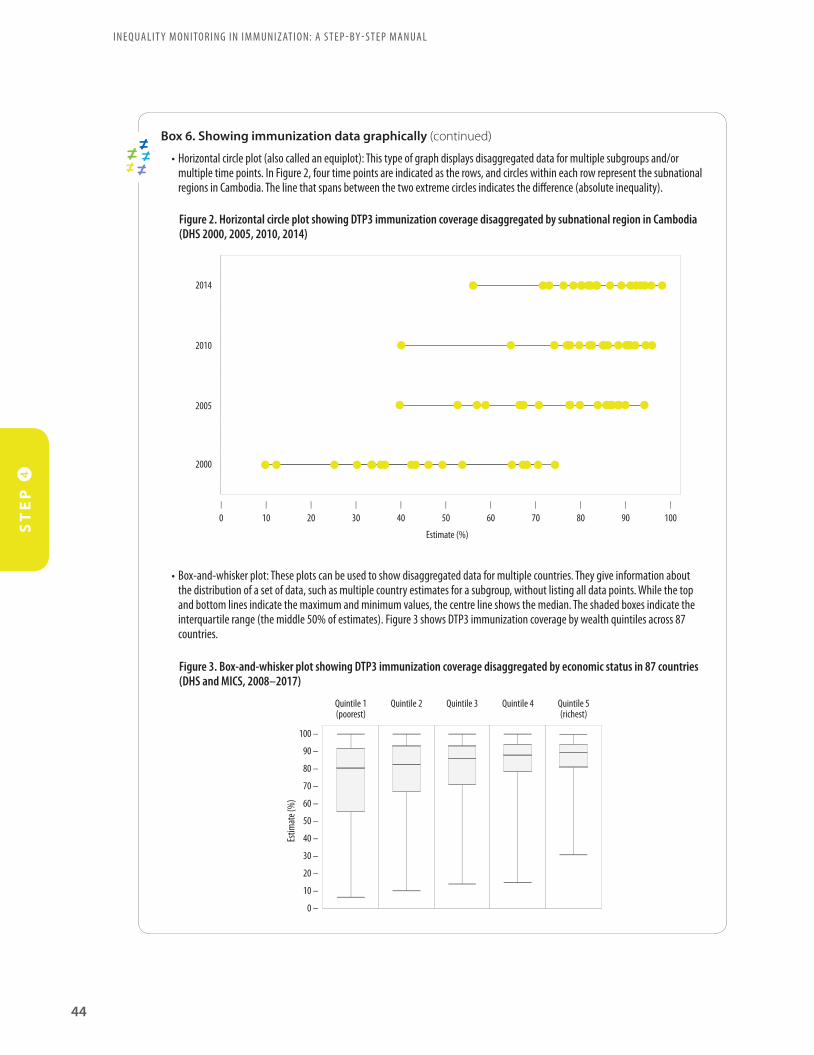
ST
EP
4I N E Q UA L I T Y M O N I TO R I N G I N I M M U N I Z AT I O N: A S T E P - BY - S T E P MA N UA L
44
Box 6. Showing immunization data graphically (continued)
• Horizontal circle plot (also called an equiplot): This type of graph displays disaggregated data for multiple subgroups and/or multiple time points. In Figure 2, four time points are indicated as the rows, and circles within each row represent the subnational regions in Cambodia. The line that spans between the two extreme circles indicates the difference (absolute inequality).
Figure 2. Horizontal circle plot showing DTP3 immunization coverage disaggregated by subnational region in Cambodia (DHS 2000, 2005, 2010, 2014)
2014
2010
2005
2000
l10
l0
l30
l20
l40
l60
l50
l80
l70
l90
l100
Estimate (%)
• Box-and-whisker plot: These plots can be used to show disaggregated data for multiple countries. They give information about the distribution of a set of data, such as multiple country estimates for a subgroup, without listing all data points. While the top and bottom lines indicate the maximum and minimum values, the centre line shows the median. The shaded boxes indicate the interquartile range (the middle 50% of estimates). Figure 3 shows DTP3 immunization coverage by wealth quintiles across 87 countries.
Figure 3. Box-and-whisker plot showing DTP3 immunization coverage disaggregated by economic status in 87 countries (DHS and MICS, 2008–2017)
100 –
Estim
ate (
%)
Quintile 1(poorest)
Quintile 2 Quintile 5(richest)
Quintile 3 Quintile 4
0 –
90 –
80 –
70 –
60 –
50 –
40 –
30 –
20 –
10 –
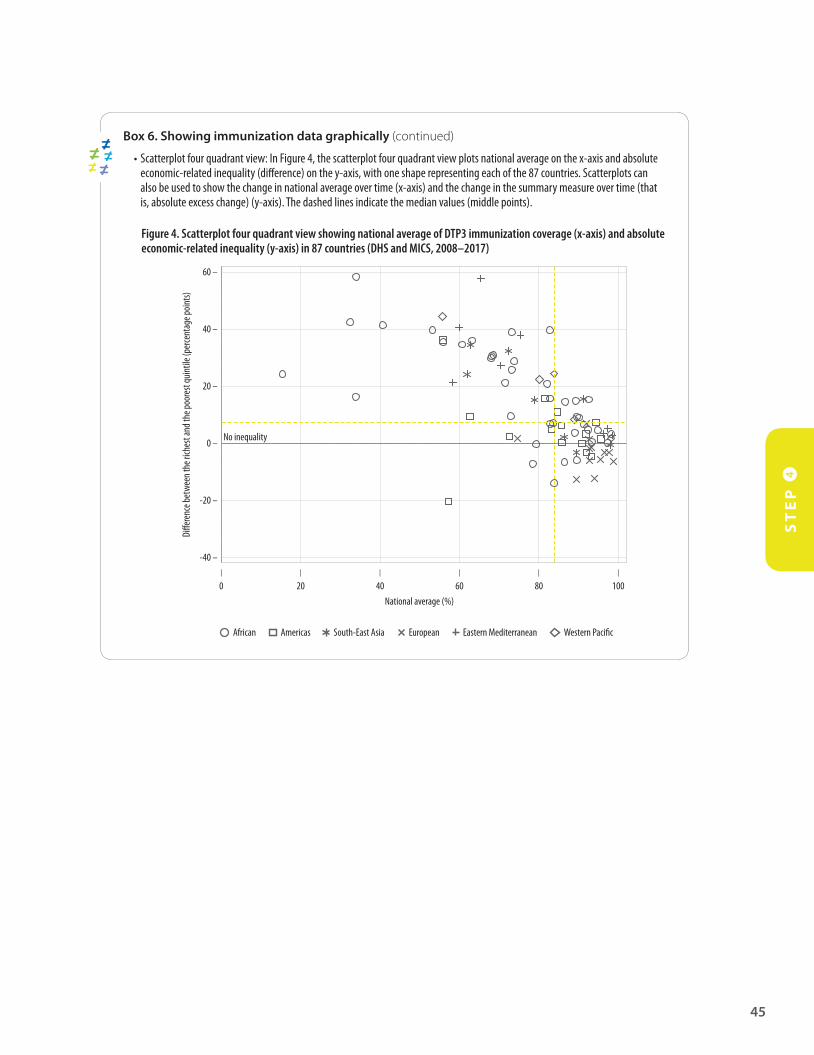
ST
EP
4
45
Box 6. Showing immunization data graphically (continued)
• Scatterplot four quadrant view: In Figure 4, the scatterplot four quadrant view plots national average on the x-axis and absolute economic-related inequality (difference) on the y-axis, with one shape representing each of the 87 countries. Scatterplots can also be used to show the change in national average over time (x-axis) and the change in the summary measure over time (that is, absolute excess change) (y-axis). The dashed lines indicate the median values (middle points).
Figure 4. Scatterplot four quadrant view showing national average of DTP3 immunization coverage (x-axis) and absolute economic-related inequality (y-axis) in 87 countries (DHS and MICS, 2008–2017)
National average (%)
60 –
Diffe
renc
e bet
ween
the r
iches
t and
the p
oore
st qu
intile
(per
cent
age p
oints)
-40 –
40 –
20 –
0 –
-20 –
0
0
0
0
0
0
l20
l40
l60
l80
l100
l0
No inequality
Eastern Mediterranean Western PacificAfrican Americas South-East Asia European
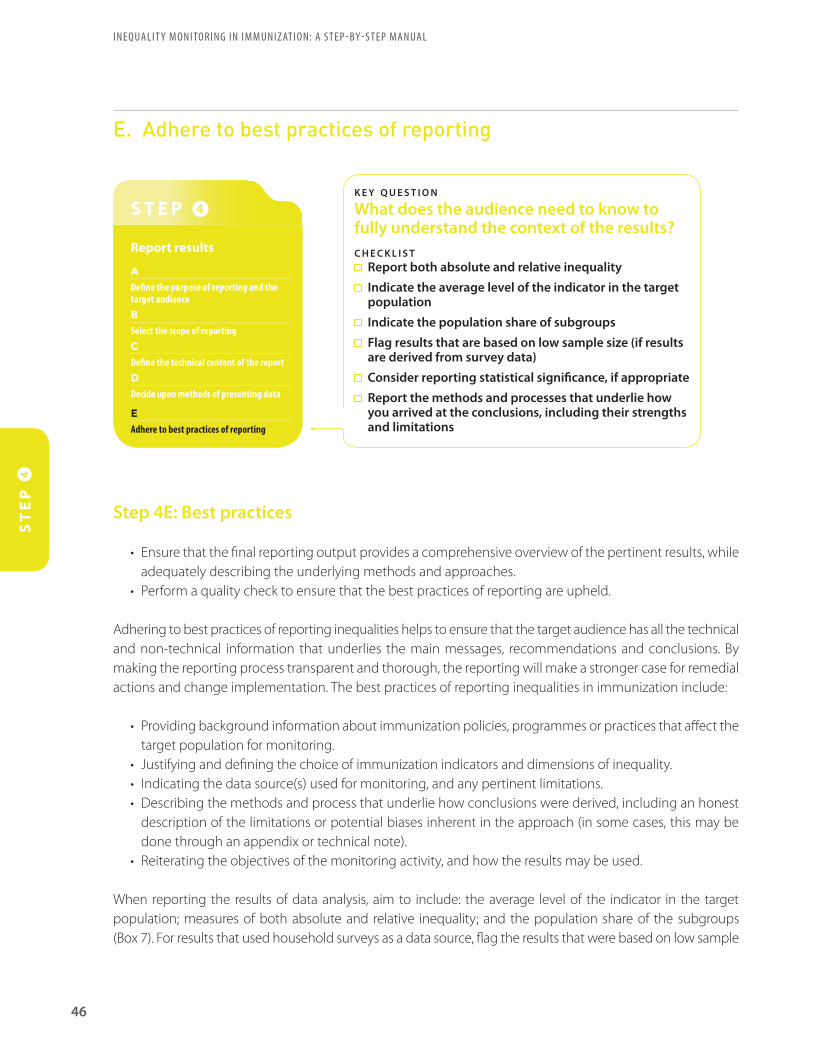
Step 4E: Best practices
• Ensure that the final reporting output provides a comprehensive overview of the pertinent results, while adequately describing the underlying methods and approaches.
• Perform a quality check to ensure that the best practices of reporting are upheld.
Adhering to best practices of reporting inequalities helps to ensure that the target audience has all the technical and non-technical information that underlies the main messages, recommendations and conclusions. By making the reporting process transparent and thorough, the reporting will make a stronger case for remedial actions and change implementation. The best practices of reporting inequalities in immunization include:
• Providing background information about immunization policies, programmes or practices that affect the target population for monitoring.
• Justifying and defining the choice of immunization indicators and dimensions of inequality.• Indicating the data source(s) used for monitoring, and any pertinent limitations.• Describing the methods and process that underlie how conclusions were derived, including an honest
description of the limitations or potential biases inherent in the approach (in some cases, this may be done through an appendix or technical note).
• Reiterating the objectives of the monitoring activity, and how the results may be used.
When reporting the results of data analysis, aim to include: the average level of the indicator in the target population; measures of both absolute and relative inequality; and the population share of the subgroups (Box 7). For results that used household surveys as a data source, flag the results that were based on low sample
ST
EP
4I N E Q UA L I T Y M O N I TO R I N G I N I M M U N I Z AT I O N: A S T E P - BY - S T E P MA N UA L
46
E. Adhere to best practices of reporting
Report results
S T E P 4
ADefine the purpose of reporting and the target audienceBSelect the scope of reportingCDefine the technical content of the reportDDecide upon methods of presenting data
EAdhere to best practices of reporting
k e y q u e s t i o n
What does the audience need to know to fully understand the context of the results?c h e c k l i s t
Report both absolute and relative inequality Indicate the average level of the indicator in the target
population Indicate the population share of subgroups Flag results that are based on low sample size (if results
are derived from survey data) Consider reporting statistical significance, if appropriate Report the methods and processes that underlie how
you arrived at the conclusions, including their strengths and limitations

sizes. Consider whether it is appropriate to report statistical significance (Box 8). For a case study of how the best practices of reporting health inequalities have been followed, see Appendix 8.
Box 7. Population share: why it is important and how to report it
Population share refers to the percentage of the total affected population that belongs to a given population subgroup. When monitoring immunization coverage among one-year-olds, for example, the population share would express the percentage of one-year-olds belonging to a particular subgroup out of all one-year-olds in the population. Table 4 demonstrates the population share of one-year-olds in Indonesia across six maternal education subgroups (3).
Table 4. Population share of one-year-olds in Indonesia across subgroups defined by mother’s education level and corresponding BCG immunization coverage (RISKEDAS 2013)
Maternal education Population share (%) BCG immunization coverage (%)
No education 3.0 3.0
Incomplete primary school 8.6 8.6
Primary school 30.8 30.8
Junior high school 23.9 23.9
High school 26.5 26.5
Diploma/higher 7.2 7.2
National 100.0 100.0
Reporting population share provides information that helps the audience better understand how inequalities affect a population. In the case of Indonesia, bacille Calmette-Guérin vaccine (BCG) immunization coverage was lowest in the no education subgroup, though this subgroup consisted of just 3.0% of one-year-olds in the survey. Information about population share is especially important if the population share shifts over time. Depending on the nature of the report, population share could be included in tables or text; in interactive data visuals, it may be possible to include the population share in a pop-up tool tip box, depending on the features of the software.
Box 8. Interpreting and reporting measures of uncertainty
Reporting measures of uncertainty, such as 95% confidence intervals, can help audiences understand whether the indicator estimates based on survey data are significantly different between population subgroups (see Step3A). The mathematical calculation of measures of uncertainty takes survey sample size into account. On the one hand, concerns may arise when the sample size is too low to generate a meaningful estimate. The WHO Health Equity Monitor, for example, does not report point estimates based on subgroup sample sizes below 25, and flags “low sample size” estimates based on 25–49 cases. In cases where subgroup estimates are based on small sample sizes, the results may indicate large differences in point estimates that are not statistically significant (for example, the 95% confidence intervals are large and overlapping).
Conversely, there may be cases where small differences are significant statistically (because they are based on a large sample), but these differences are not important from a public health perspective. For instance, according to the 2015 India DHS, DTP3 immunization coverage among one-year-olds was 80.5% in urban areas and 78.0% in rural areas, with non-overlapping 95% confidence intervals (95% confidence intervals were 79.2–81.8 for urban areas and 77.4–78.6 for rural areas). While this 2.5 percentage point difference may have statistical significance, it is probably not significant in terms of public health policies, programmes and practices.
When considering whether and how to report measures of uncertainty, consider the technical expertise of the target audience, and whether the measures are likely to add weight to the findings, or create unnecessary confusion. In either case, ensure that the findings do not lead to false conclusions or misinformed policy.
ST
EP
4
47

ST
EP
4I N E Q UA L I T Y M O N I TO R I N G I N I M M U N I Z AT I O N: A S T E P - BY - S T E P MA N UA L
48
References
1. Asada Y, Abel H, Skedgel C, Warner G. On effective graphic communication of health inequality: considerations for health policy researchers. Milbank Q. 2017;95(4):801–35.
2. State of inequality: reproductive, maternal, newborn and child health. Geneva: World Health Organization; 2015.
3. State of health inequality: Indonesia. Geneva: World Health Organization; 2017.
S T E P1
S T E P5

S T E P 5
Report resultsKnowledge translation
I N E Q UA L I T Y M O N I TO R I N G I N I M M U N I Z AT I O N: A S T E P - BY - S T E P MA N UA L
50
Identify priority areas for action
Integrate equity considerations into immunization programmes and policies
Identify opportunities for intersectoral collaboration
Knowledge translationS T E P 5
S T E P 4
Report results
S T E P 3
Analyse data
S T E P 2
Obtain dataDetermine scope of monitoring
S T E P 1
ST
EP
51
OverviewS T E P 5 , knowledge translation, promotes the uptake of results to implement changes in policies, programmes or practices that affect immunization. This step is, perhaps, the least straightforward aspect of inequality monitoring, as it is highly context-dependent and iterative. The process of using results to implement changes requires in-depth knowledge about the landscape of policies, programmes and practices within the monitoring jurisdiction, as well as political agendas, policy processes and competing interests. Making long-term and sustainable changes to improve situations of inequality requires ongoing and multifaceted efforts. It also requires collaboration across diverse stakeholder groups and sustained political commitment.
Due to the non-linear nature of this process, this section outlines three knowledge translation activities to improve situations of inequality in immunization topics: identifying priority areas for action; integrating equity considerations into immunization activities; and identifying opportunities for intersectoral collaboration.
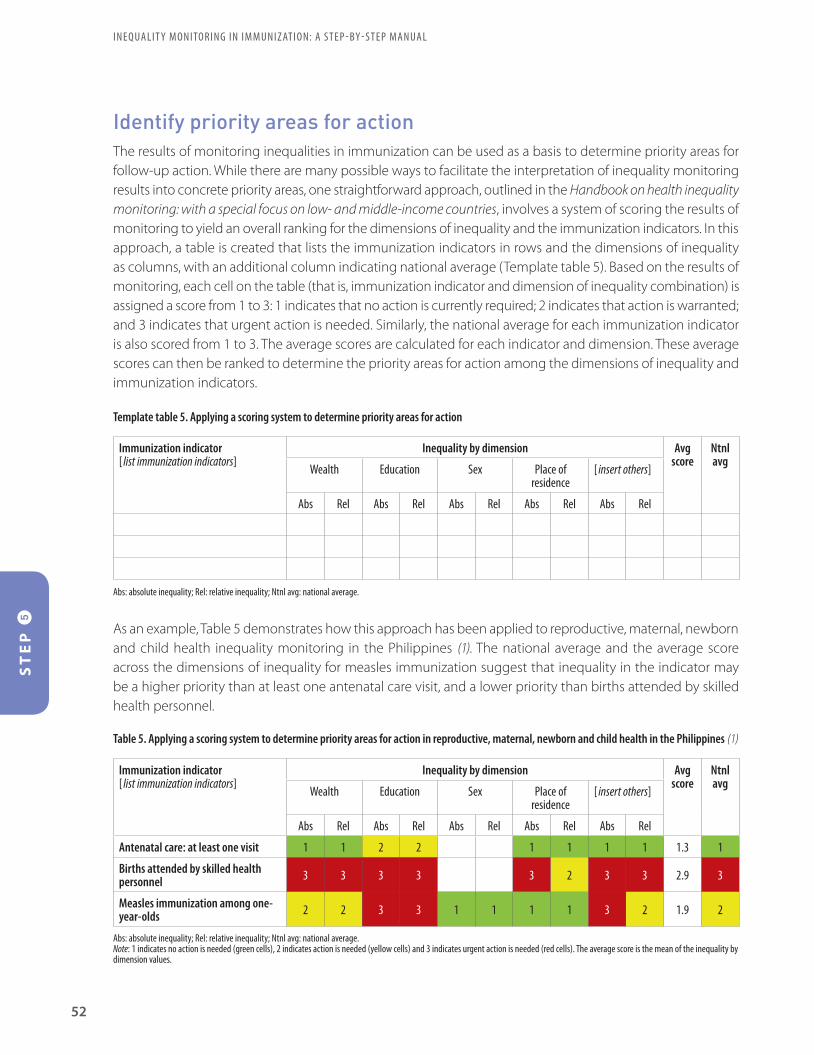
Identify priority areas for actionThe results of monitoring inequalities in immunization can be used as a basis to determine priority areas for follow-up action. While there are many possible ways to facilitate the interpretation of inequality monitoring results into concrete priority areas, one straightforward approach, outlined in the Handbook on health inequality monitoring: with a special focus on low- and middle-income countries, involves a system of scoring the results of monitoring to yield an overall ranking for the dimensions of inequality and the immunization indicators. In this approach, a table is created that lists the immunization indicators in rows and the dimensions of inequality as columns, with an additional column indicating national average (Template table 5). Based on the results of monitoring, each cell on the table (that is, immunization indicator and dimension of inequality combination) is assigned a score from 1 to 3: 1 indicates that no action is currently required; 2 indicates that action is warranted; and 3 indicates that urgent action is needed. Similarly, the national average for each immunization indicator is also scored from 1 to 3. The average scores are calculated for each indicator and dimension. These average scores can then be ranked to determine the priority areas for action among the dimensions of inequality and immunization indicators.
Template table 5. Applying a scoring system to determine priority areas for action
Immunization indicator[ list immunization indicators]
Inequality by dimension Avg score
Ntnl avg
Wealth Education Sex Place of residence
[ insert others]
Abs Rel Abs Rel Abs Rel Abs Rel Abs Rel
Abs: absolute inequality; Rel: relative inequality; Ntnl avg: national average.
As an example, Table 5 demonstrates how this approach has been applied to reproductive, maternal, newborn and child health inequality monitoring in the Philippines (1). The national average and the average score across the dimensions of inequality for measles immunization suggest that inequality in the indicator may be a higher priority than at least one antenatal care visit, and a lower priority than births attended by skilled health personnel.
Immunization indicator[ list immunization indicators]
Inequality by dimension Avg score
Ntnl avg
Wealth Education Sex Place of residence
[ insert others]
Abs Rel Abs Rel Abs Rel Abs Rel Abs Rel
Antenatal care: at least one visit 1 1 2 2 1 1 1 1 1.3 1
Births attended by skilled health personnel 3 3 3 3 3 2 3 3 2.9 3
Measles immunization among one-year-olds 2 2 3 3 1 1 1 1 3 2 1.9 2
Abs: absolute inequality; Rel: relative inequality; Ntnl avg: national average.Note: 1 indicates no action is needed (green cells), 2 indicates action is needed (yellow cells) and 3 indicates urgent action is needed (red cells). The average score is the mean of the inequality by dimension values.
Table 5. Applying a scoring system to determine priority areas for action in reproductive, maternal, newborn and child health in the Philippines (1)
ST
EP
I N E Q UA L I T Y M O N I TO R I N G I N I M M U N I Z AT I O N: A S T E P - BY - S T E P MA N UA L
52

When identifying priority areas, consulting with stakeholders who are familiar with the results of monitoring as well as immunization and the monitoring context helps to ensure that the recommendations are feasible and appropriate. For example, a panel of advisors with experience in interpreting statistics may convene to assess the situation and decide how to proceed. This involves considering which parts of the analysis results have tangible and practical implications within the resources and mandate of the target audience. Policy briefs are a useful tool to summarize how actions are prioritized (and the underlying justification), and communicate concrete, concise advice to policy-makers. Box 9 provides an example to illustrate how the results of health inequality monitoring in Indonesia were used to identify policy priorities.
Box 9. Assessing the state of health inequality in Indonesia
In 2016–2017, with support from WHO, stakeholders in Indonesia undertook an extensive assessment of health inequalities spanning 11 health topics (including childhood immunization), 53 health indicators and 8 dimensions of inequality. The aims of the analyses were to quantify the magnitude of health inequalities, and then use this evidence to identify priority areas for the development of policies oriented towards the reduction of inequality (2).
The results of this assessment, summarized in the State of health inequality: Indonesia report (2), demonstrated that health inequalities are variable across health topics, health indicators and dimensions of inequality. Childhood immunization inequalities, for instance, were most pronounced according to household economic status, mother’s education, place of residence and subnational region. The report also highlighted how health inequality is a distinct measure from the national average. For some maternal, newborn and child health indicators, indicators with satisfactory national averages demonstrated high levels of inequality; certain behaviour-related health indicators, such as low fruit and vegetable consumption, showed poor performance across the entire population.
The results of these analyses have implications for identifying policy priorities in Indonesia. By demonstrating province- and district-level inequalities in improved drinking water and sanitation facilities, the analyses suggest how uneven development across the country has affected access to essential services. This analysis highlights the need for capacity-building efforts in low-performing areas (3). Inequalities in cigarette smoking among adolescents, which was found to be higher in males than females and among those in the poorest households, help to identify which populations require stronger support and action with regards to tobacco control programmes (4).
Integrate equity considerations into immunization programmes and policies The results of inequality monitoring can provide important inputs to guide the planning and implementation of immunization activities. In the context of immunization programmes, results of inequality monitoring should be considered at multiple strategic points to maximize potential for impact. First, they should be considered during programme reviews. An EPI Review, also referred to as a National Immunization Programme Review, is the comprehensive assessment of the strengths and weaknesses of an immunization programme at national, subnational and service-delivery levels (5). A desk review occurs early in the EPI Review process and should include inequality monitoring to help identify field sites to be visited and equity issues to be addressed during the review. In addition, strategies such as reducing missed opportunities for vaccination (6) and tailoring immunization programmes (7) can use the findings of inequality monitoring to help identify underlying causes of the inequity. Any proposed equity-oriented immunization interventions should be included in cMYPs to improve the likelihood of the activities being budgeted, planned and implemented. Thus, considerations of the results of inequality monitoring, particularly for EPI Reviews, should be conducted before the immunization programme strategic planning cycle.
ST
EP
53

Box 10 outlines how equity considerations can be integrated in programming and planning processes of Gavi.
Box 10. Integrating equity considerations in Gavi, the Vaccine Alliance joint appraisals and applications
For those countries eligible for support from Gavi, another opportunity to integrate equity considerations into programmes and plans are Gavi joint appraisals and applications (8). Joint appraisals are annual, in-country multi-stakeholder reviews of implementation progress, performance and results across all Gavi support to the country. While not as comprehensive as a holistic EPI Review, joint appraisals offer a key opportunity to review successes and challenges, agree on programmatic priorities for the coming period and, in certain cases, to revisit and potentially reprogramme Gavi support to communities and populations most in need. The desire to have robust analyses related to inequities is emphasized in Gavi’s Joint appraisal analysis guidance (9), and steps outlined in this manual could strengthen the preparation and analyses reviewed and discussed as part of joint appraisals. Similarly, eligible countries have the opportunity every three to five years to apply for new health system strengthening support through a full portfolio planning process (10). This support, as well as vaccine and cold-chain equipment support, should all be focused towards sustainably improving coverage and equity in countries. Gavi places a heavy emphasis on targeting and tailoring its support to those most in need, namely, underserved communities, zero-dose children and under-immunized children. As such, performing the steps laid out in this manual and making maximum use of inequality monitoring and analyses can prove foundational to informing Gavi applications.
Translating evidence into action is not a one-size-fits-all-approach, but rather takes different forms in different contexts. Countries may, for example, use the results of inequality monitoring to allocate funding to poor-performing districts, or concentrate efforts to improve coverage in populations where vaccine-preventable disease burden is higher. Importantly, the actions taken to address inequality require monitoring to assess whether they are effective in reducing inequalities. A variety of approaches have been developed to facilitate the integration of equity considerations into planning and policy-making processes. Organizations such as WHO and UNICEF have developed general resources to facilitate equity-based policy-making processes at the national level, which can be applied to the topic of immunization (Box 11):
• The WHO Innov8 approach to review national health programmes to leave no one behind outlines a multi-step methodology for multidisciplinary review teams that focuses on enhancing the equity orientation of national health programming (12). As the name suggests, the Innov8 approach consists of eight steps that are undertaken by a multidisciplinary review team. The inequality monitoring activities outlined in this manual can yield evidence and inputs to several aspects of the process (in particular, Innov8’s first step of understanding the baseline of the programme through a diagnostic checklist, third step of identifying who is being left out of the programme, and eighth step of strengthening monitoring and evaluation practices).
• UNICEF’s EQUIST (Equitable Impact Sensitive Tool) is an online platform designed to provide policy-makers
and programme managers with the best available global evidence, data and tools to inform strategies and approaches to reduce inequalities in the area of maternal, newborn and child health (13). Using features such as the EQUIST Scenario Analysis, equity-oriented solutions (intervention packages) can be identified to address inequalities, taking into account the number of deaths averted, and the overall cost effectiveness.
ST
EP
I N E Q UA L I T Y M O N I TO R I N G I N I M M U N I Z AT I O N: A S T E P - BY - S T E P MA N UA L
54

While it is beyond the scope of this resource to provide detailed discussions about developing equity-oriented immunization interventions, Box 11 highlights examples of how countries have integrated equity considerations into health sector programmes and policies. Expanded efforts are warranted to document examples of how equity considerations are integrated into immunization programmes and policies.
Box 11. Country responses to move forward on an equity agenda
Efforts to increase the equity orientation of policies and programmes across the health sector have been reinforced through health equity analysis tools, including HEAT and HEAT Plus, and Innov8. In the WHO South-East Asia Region, six countries have been particularly instrumental in the development and piloting of these tools. As a result, these countries have taken steps to incorporate equity considerations into various health arenas (11): • In Bangladesh, analytical reports on health equity topics, as well as a workshop on monitoring health inequalities, have helped to
guide government actions to achieve universal health coverage by 2032. • In India, a series of health inequality analyses and publications led to the formation of the Health Equity Network India, and have
prompted further research and monitoring in key priority areas. • In Indonesia, health equity analyses and the use of HEAT Plus contributed to the reorientation of national maternal and child health
action plans. • Nepal used HEAT Plus and Innov8 tools to identify subpopulations of adolescents that were either missed or received suboptimal
benefits from the adolescent sexual and reproductive health programme. The country has since incorporated these findings into the revised Adolescent Development Health Strategy.
• Sri Lanka hosted an integrated, multisector health equity capacity-building event, and identified key areas for further study and policy action, such as addressing district-level inequalities in child stunting and wealth-related inequalities in intimate partner violence.
• Thailand has successfully integrated equity considerations into routine programming to advance universal health coverage. The country has adopted a model of national health assemblies that facilitate public engagement with decision-making and priority-setting in the health sector.
Identify opportunities for intersectoral collaborationAddressing inequalities in immunization also benefits other aspects of health, development and well-being. For instance, improving childhood immunization coverage among underserved population groups enables more children to go to school, and more families to avoid financial costs associated with vaccine-preventable illness. Conditional cash transfer programmes have shown to increase immunization coverage by making vaccination a conditionality for receiving cash payments (14). Partnerships with non-health sectors can provide a strong basis to advocate for action to address inequalities in immunization.
Immunization resonates broadly across the 2030 Sustainable Development Agenda, suggesting the importance of multisectoral action to further health and other development initiatives. Moreover, the broader conditions that contribute to inequalities require multisectoral action to address them. Figure 5 demonstrates the linkages between immunization and select Sustainable Development Goals.
ST
EP
55
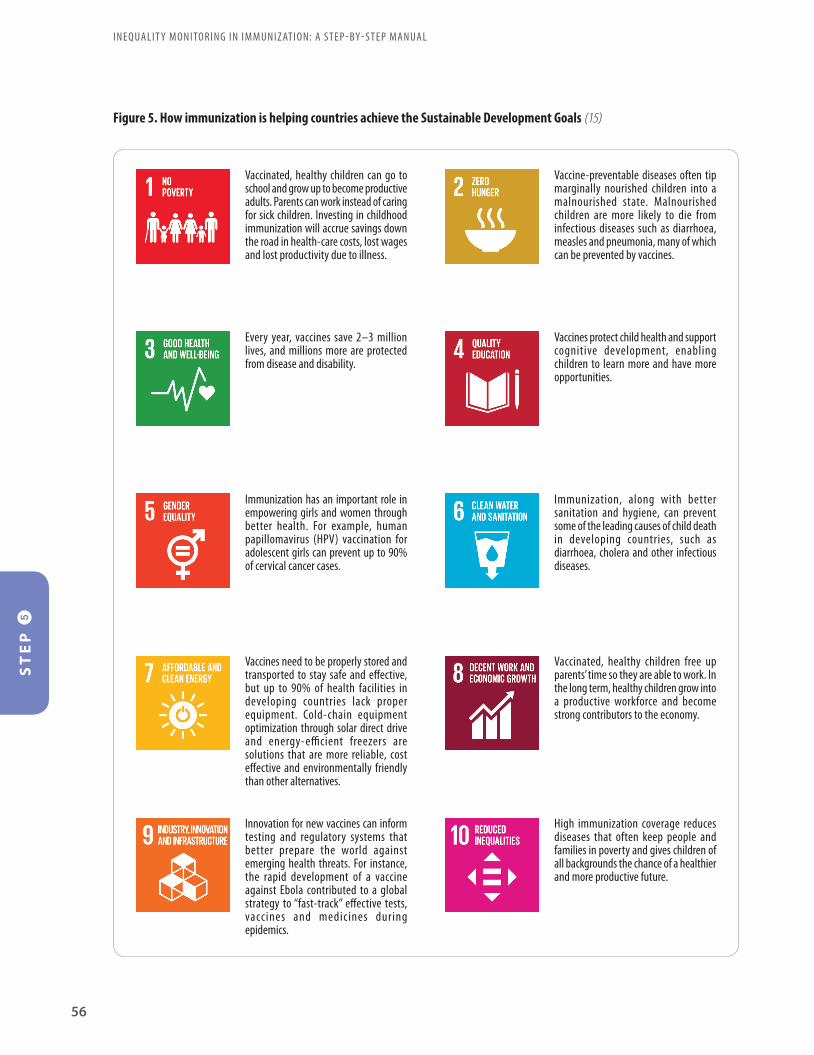
ST
EP
I N E Q UA L I T Y M O N I TO R I N G I N I M M U N I Z AT I O N: A S T E P - BY - S T E P MA N UA L
56
Vaccinated, healthy children can go to school and grow up to become productive adults. Parents can work instead of caring for sick children. Investing in childhood immunization will accrue savings down the road in health-care costs, lost wages and lost productivity due to illness.
Every year, vaccines save 2–3 million lives, and millions more are protected from disease and disability.
Immunization has an important role in empowering girls and women through better health. For example, human papillomavirus (HPV) vaccination for adolescent girls can prevent up to 90% of cervical cancer cases.
Vaccines need to be properly stored and transported to stay safe and effective, but up to 90% of health facilities in developing countries lack proper equipment. Cold-chain equipment optimization through solar direct drive and energy-efficient freezers are solutions that are more reliable, cost effective and environmentally friendly than other alternatives.
Innovation for new vaccines can inform testing and regulatory systems that better prepare the world against emerging health threats. For instance, the rapid development of a vaccine against Ebola contributed to a global strategy to “fast-track” effective tests, vaccines and medicines during epidemics.
Vaccine-preventable diseases often tip marginally nourished children into a malnourished state. Malnourished children are more likely to die from infectious diseases such as diarrhoea, measles and pneumonia, many of which can be prevented by vaccines.
Vaccines protect child health and support cognitive development, enabling children to learn more and have more opportunities.
Immunization, along with better sanitation and hygiene, can prevent some of the leading causes of child death in developing countries, such as diarrhoea, cholera and other infectious diseases.
Vaccinated, healthy children free up parents’ time so they are able to work. In the long term, healthy children grow into a productive workforce and become strong contributors to the economy.
High immunization coverage reduces diseases that often keep people and families in poverty and gives children of all backgrounds the chance of a healthier and more productive future.
Figure 5. How immunization is helping countries achieve the Sustainable Development Goals (15)
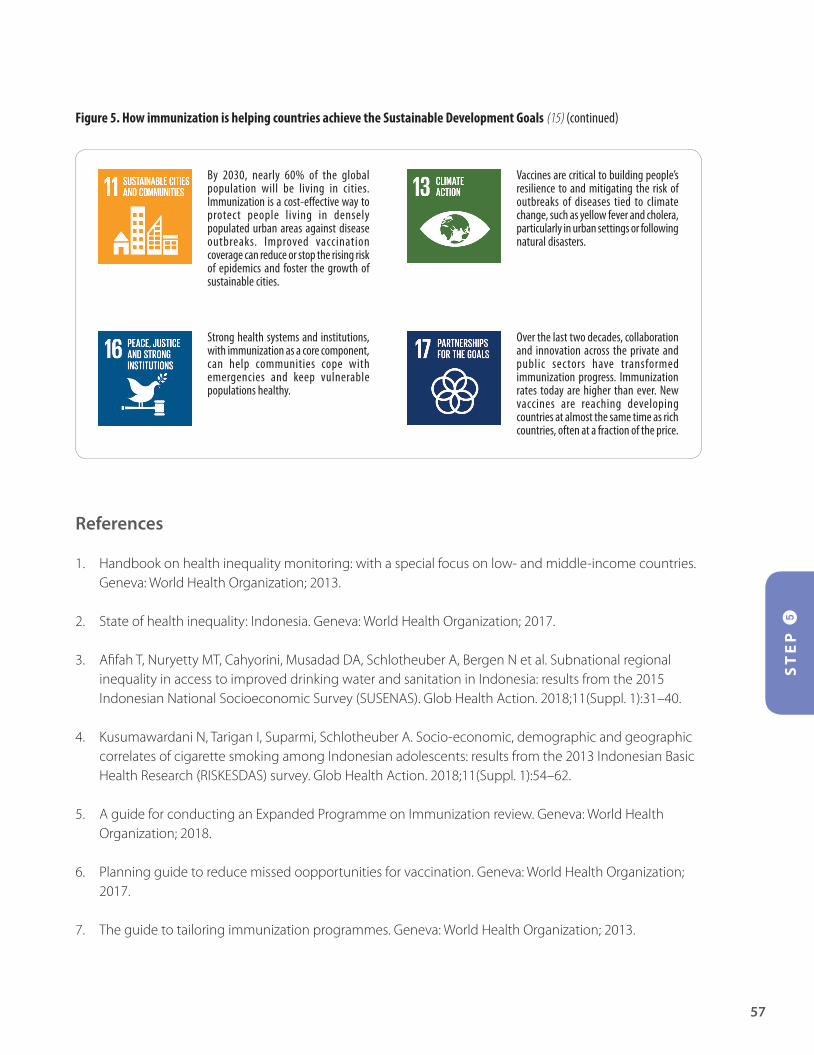
ST
EP
57
By 2030, nearly 60% of the global population will be living in cities. Immunization is a cost-effective way to protect people living in densely populated urban areas against disease outbreaks. Improved vaccination coverage can reduce or stop the rising risk of epidemics and foster the growth of sustainable cities.
Strong health systems and institutions, with immunization as a core component, can help communities cope with emergencies and keep vulnerable populations healthy.
Vaccines are critical to building people’s resilience to and mitigating the risk of outbreaks of diseases tied to climate change, such as yellow fever and cholera, particularly in urban settings or following natural disasters.
Over the last two decades, collaboration and innovation across the private and public sectors have transformed immunization progress. Immunization rates today are higher than ever. New vaccines are reaching developing countries at almost the same time as rich countries, often at a fraction of the price.
References
1. Handbook on health inequality monitoring: with a special focus on low- and middle-income countries. Geneva: World Health Organization; 2013.
2. State of health inequality: Indonesia. Geneva: World Health Organization; 2017.
3. Afifah T, Nuryetty MT, Cahyorini, Musadad DA, Schlotheuber A, Bergen N et al. Subnational regional inequality in access to improved drinking water and sanitation in Indonesia: results from the 2015 Indonesian National Socioeconomic Survey (SUSENAS). Glob Health Action. 2018;11(Suppl. 1):31–40.
4. Kusumawardani N, Tarigan I, Suparmi, Schlotheuber A. Socio-economic, demographic and geographic correlates of cigarette smoking among Indonesian adolescents: results from the 2013 Indonesian Basic Health Research (RISKESDAS) survey. Glob Health Action. 2018;11(Suppl. 1):54–62.
5. A guide for conducting an Expanded Programme on Immunization review. Geneva: World Health Organization; 2018.
6. Planning guide to reduce missed oopportunities for vaccination. Geneva: World Health Organization; 2017.
7. The guide to tailoring immunization programmes. Geneva: World Health Organization; 2013.
Figure 5. How immunization is helping countries achieve the Sustainable Development Goals (15) (continued)
ST
EP
I N E Q UA L I T Y M O N I TO R I N G I N I M M U N I Z AT I O N: A S T E P - BY - S T E P MA N UA L
58
8. Joint appraisals [Internet]. Gavi, the Vaccine Alliance; 2019 (https://www.gavi.org/support/process/joint-appraisals/, accessed 8 September 2019).
9. Joint appraisal analysis guidance 2019. Gavi, the Vaccine Alliance; 2019 (https://www.gavi.org/library/gavi-documents/guidelines-and-forms/joint-appraisal-analysis-guidance/, accessed 8 September 2019).
10. Apply for health system strengthening support [Internet]. Gavi, the Vaccine Alliance; 2019 (https://www.gavi.org/support/process/apply/hss/, accessed 9 September 2019).
11. Nambiar D, Rajbhandary R, Koller TS, Hosseinpoor AR. Building capacity for health equity analysis in the WHO South-East Asia Region. WHO South-East Asia J Public Health. 2019;8(1):4–9.
12. Innov8 approach for reviewing national health programmes to leave no one behind: technical handbook. Geneva: World Health Organization; 2016.
13. EQUIST: equitable strategies to save lives [Internet]. UNICEF; 2017 (www.equist.info, accessed 8 September 2019).
14. de Souza Cruz RC, de Moura LBA, Neto JJS. Conditional cash transfers and the creation of equal opportunities of health for children in low- and middle-income countries: a literature review. Int J Equity Health. 2017;16(1):161.
15. Sustainable Development Goals [Internet]. Gavi, the Vaccine Alliance; 2019 (https://www.gavi.org/about/ghd/sdg/, accessed 9 September 2019).
59
Appendix 1. Additional resources
Health inequality monitoring (general theory and instruction)
TitleAuthor, year
Brief description
National health inequality monitoring: a step-by-step manual
World Health Organization (WHO), 2017
Describes a step-by-step approach to navigate practical considerations of health inequality monitoring, including pertinent examples and resources that elaborate on each step.
Handbook for health inequality monitoring: with a special focus on low- and middle-income countries
WHO, 2013
Details the steps of health inequality monitoring, serving as a resource for countries to establish and strengthen health inequality monitoring practices.
Health inequality monitoring: a practical application of population health monitoring
Hosseinpoor and Bergen, 2019
This chapter (in Population health monitoring: climbing the information pyramid, Verschuuren and van Oers, editors) shows how monitoring health inequalities has been applied across global and national contexts.
I N E Q UA L I T Y M O N I TO R I N G I N I M M U N I Z AT I O N: A S T E P - BY - S T E P MA N UA L
60
Reports and resources about immunization
TitleAuthor, year
Brief description
State of inequality: childhood immunization
WHO, 2016
Provides an overview of the latest situation and change over time in childhood immunization, with detailed descriptions of the state of inequality in priority countries.
Explorations of inequality: childhood immunization
WHO, 2018
Contains an in-depth exploration of inequality in 10 priority countries, including how a child’s likelihood of being vaccinated is affected by compounding advantage or vulnerability.
Handbook on the use, collection, and improvement of immunization data
WHO, under development
Outlines a range of data-related considerations for monitoring of immunization programme performance.
[under development]
Equity in immunization: an operational handbook for addressing inequities in immunization
WHO Regional Office for Europe (EURO), under development
Provides information and a catalogue of tools to guide the measurement and reduction of inequities in immunization uptake and service delivery.
[under development]
Data toolkits and repositories
TitleAuthor
Website
Global Health Observatory Health Equity Monitor
WHO
https://www.who.int/gho/health_equity/en/
Health Equity Assessment Toolkit (HEAT)
WHO
http://www.who.int/gho/health_equity/assessment_toolkit
EQUIST (Equitable Impact Sensitive Tool)
UNICEF
http://equist.info/

61
Appendix 2. Monitoring, Evaluation and Review Framework
The methods in this manual can be applied to indicators beyond immunization coverage. Ideally, inequality monitoring should aim to capture diverse aspects of the health system. If a Ministry of Health tracks the indicator “health workforce capacity per 100 000 population”, for example, then that indicator could be compared across districts to detect geographical inequalities related to the health workforce. To the extent that districts can be characterized as urban or rural, or according to income and poverty, inequalities along these dimensions also could be examined.
The Monitoring, Evaluation and Review Framework consists of four categories of health indicators: inputs and processes; outputs; outcomes; and impact (1). Applied to immunization, the four components address the following questions:
• Inputs and processes: How are resources (vaccines, human, financial) allocated across geographies and communities?
• Outputs: How do the availability and quality of immunization services vary across geographies and communities?
• Outcomes: Do high-quality vaccine services lead to highly equitable vaccination coverage across geographies and communities?
• Impact: Does high vaccination coverage lead to equal protection against disease outbreaks across geographies and communities?
Figure A2.1 indicates the types of immunization indicators that correspond to each of the four components of the framework. Inequality monitoring should encompass a set of indicators across multiple components.
Figure A2.1. Monitoring, Evaluation and Review Framework for immunization programmes, with examples of indicator domains
Inputs andprocesses
• Vaccines, funds, staff, equipment
• Effective vaccine management
Outputs
• Cases of adverse events following immunization
• Service availability and readiness assessments
Outcomes
• Administered vaccinations
• Vaccination coverage
Impact
• Cases of vaccine-preventable disease
• Deaths by age and cause • Cost-effectiveness• Mortality rates• Genotype prevalence
Reference
1. Monitoring, evaluation and review of national health strategies: a country-led platform for information and accountability. Geneva: World Health Organization; 2011.
I N E Q UA L I T Y M O N I TO R I N G I N I M M U N I Z AT I O N: A S T E P - BY - S T E P MA N UA L
62
Appendix 3. Double disaggregation
Double (or multiple) disaggregation can reveal new insights about disadvantaged subgroups, defined by more than one dimension of inequality. The process of double disaggregation, however, warrants a few considerations. First, if using household survey data, then sample size should be taken into account. When data are disaggregated into more precisely defined subgroups, the sample size decreases. If the subgroup estimates are based on too small of a sample size, then they may not be meaningful.
Methodological challenges may also sometimes arise when cross-tabulating two streams of data. Take, for example, the case of defining urban poor subgroups based on the analysis of household survey data. A methodologically rigorous approach to capture the urban poor is to construct the wealth index separately for the urban area, and then divide the urban data into quintiles whereby the poorest quintile reflects the urban poor. The common practice in major international household surveys such as the Demographic and Health Surveys (DHS) and Multiple Indicator Cluster Surveys (MICS), however, is less rigorous. It involves combining the wealth index calculated separately for urban and rural areas in the publicly available raw data set as the national wealth index (which will then be divided into wealth quintiles). This is often followed by a cross-tabulation of data by urban–rural place of residence and wealth quintiles. This approach poses limitations as the resulting data do not accurately reflect the urban poor (because it was constructed based on combined data).
63
Appendix 4. Data sources for immunization coverage
The two major types of data sources used to measure immunization coverage include household surveys and administrative data (see Table A4.1).
Household surveys generate estimates about immunization coverage, based on a specified survey sampling design. Household surveys serve as an efficient approach to generating estimates about immunization coverage where these estimates may be otherwise lacking or of poor quality. In addition to recurring household surveys (such as the Demographics and Health Surveys [DHS] and the Multiple Indicator Cluster Surveys [MICS]), immunization-specific coverage surveys are often conducted to evaluate the coverage achieved by an immunization campaign or to assess major changes to vaccination programmes (1). Importantly, if planned from the outset with sufficient technical expertise, then both routine Expanded Programme on Immunization (EPI) coverage surveys and post-campaign coverage surveys can be adapted to collect information about additional indicators and dimensions of inequality to facilitate inequality monitoring. The 2018 World Health Organization (WHO) Vaccination Coverage Cluster Survey manual provides methodological guidance for obtaining high standard immunization coverage measurements through surveys (2). The accompanying Vaccination Coverage Quality Indicators tool is a set of statistical programmes to aid with the analysis of survey data (3).
Administrative data are collected by staff at health facilities on an ongoing basis in the course of immunization activities. These data are periodically summarized and reported to centralized levels of the health system. While a rich source of information about immunization – they potentially include all who receive vaccinations in the target population, rather than relying on a survey sample – administrative data sources may be of variable quality and geographical coverage. The use of administrative data requires both accurate reporting systems to produce the numerator and recent, accurate census data for the denominator (4). Some of the data quality issues in administrative data sources include: recording errors such as missing data, manual errors and processing errors; numerator errors, where vaccinations and doses administered are not recorded correctly; denominator errors, where there is incomplete knowledge about the size of the target population; and inconsistent or non-standard definitions of what should be countered and measured. Often, there are substantial discrepancies between immunization coverage estimates derived from administrative data and household survey data (5). Thus, in many countries, initiatives are underway to improve the accuracy of administrative data.
Other sources that may be useful for inequality monitoring in immunization include census data and civil registration and vital statistics (CRVS); while these sources do not cover immunization, they may serve as valuable sources of information pertaining to the target population (denominator), or dimension of inequality. In some settings, electronic immunization registries (EIRs) may be better developed than CRVS systems.
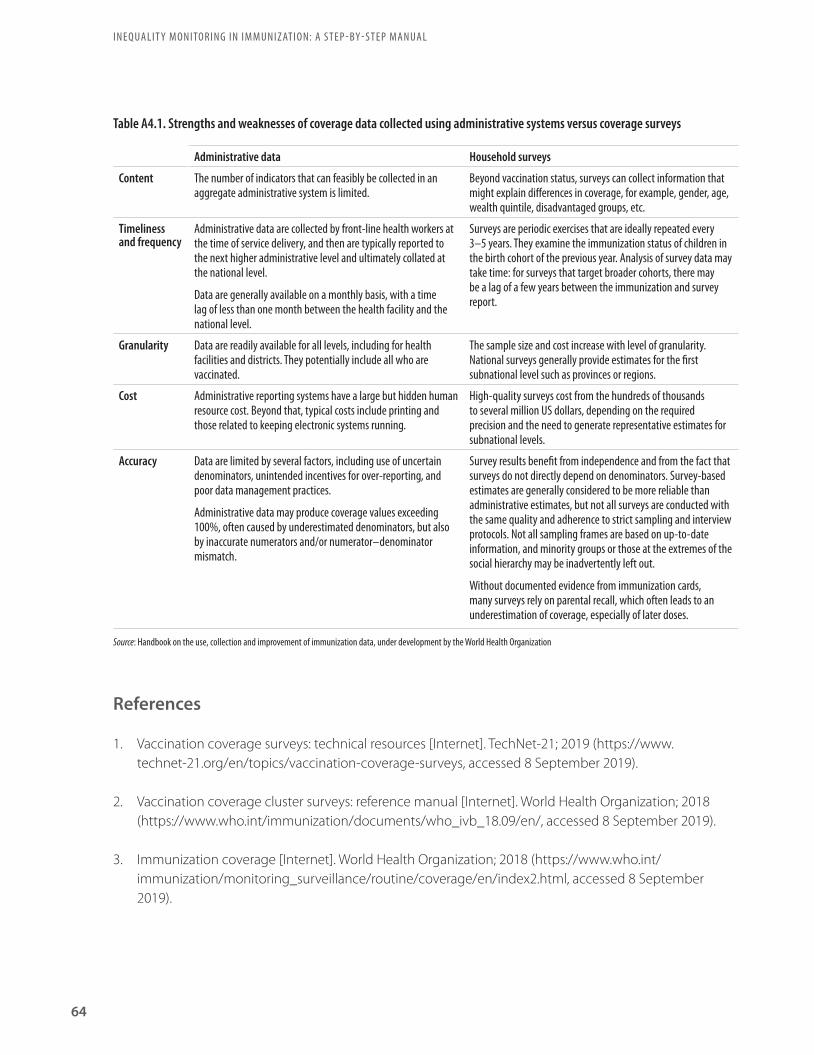
Table A4.1. Strengths and weaknesses of coverage data collected using administrative systems versus coverage surveys
Administrative data Household surveys
Content The number of indicators that can feasibly be collected in an aggregate administrative system is limited.
Beyond vaccination status, surveys can collect information that might explain differences in coverage, for example, gender, age, wealth quintile, disadvantaged groups, etc.
Timeliness and frequency
Administrative data are collected by front-line health workers at the time of service delivery, and then are typically reported to the next higher administrative level and ultimately collated at the national level.
Data are generally available on a monthly basis, with a time lag of less than one month between the health facility and the national level.
Surveys are periodic exercises that are ideally repeated every 3–5 years. They examine the immunization status of children in the birth cohort of the previous year. Analysis of survey data may take time: for surveys that target broader cohorts, there may be a lag of a few years between the immunization and survey report.
Granularity Data are readily available for all levels, including for health facilities and districts. They potentially include all who are vaccinated.
The sample size and cost increase with level of granularity. National surveys generally provide estimates for the first subnational level such as provinces or regions.
Cost Administrative reporting systems have a large but hidden human resource cost. Beyond that, typical costs include printing and those related to keeping electronic systems running.
High-quality surveys cost from the hundreds of thousands to several million US dollars, depending on the required precision and the need to generate representative estimates for subnational levels.
Accuracy Data are limited by several factors, including use of uncertain denominators, unintended incentives for over-reporting, and poor data management practices.
Administrative data may produce coverage values exceeding 100%, often caused by underestimated denominators, but also by inaccurate numerators and/or numerator–denominator mismatch.
Survey results benefit from independence and from the fact that surveys do not directly depend on denominators. Survey-based estimates are generally considered to be more reliable than administrative estimates, but not all surveys are conducted with the same quality and adherence to strict sampling and interview protocols. Not all sampling frames are based on up-to-date information, and minority groups or those at the extremes of the social hierarchy may be inadvertently left out.
Without documented evidence from immunization cards, many surveys rely on parental recall, which often leads to an underestimation of coverage, especially of later doses.
I N E Q UA L I T Y M O N I TO R I N G I N I M M U N I Z AT I O N: A S T E P - BY - S T E P MA N UA L
64
References
1. Vaccination coverage surveys: technical resources [Internet]. TechNet-21; 2019 (https://www.technet-21.org/en/topics/vaccination-coverage-surveys, accessed 8 September 2019).
2. Vaccination coverage cluster surveys: reference manual [Internet]. World Health Organization; 2018 (https://www.who.int/immunization/documents/who_ivb_18.09/en/, accessed 8 September 2019).
3. Immunization coverage [Internet]. World Health Organization; 2018 (https://www.who.int/immunization/monitoring_surveillance/routine/coverage/en/index2.html, accessed 8 September 2019).
Source: Handbook on the use, collection and improvement of immunization data, under development by the World Health Organization

65
4. Victora CG, Ryman TK. ERG Discussion paper No. 2. Potential approaches to better measure and track equity in immunization using survey and administrative data, and data triangulation [Internet]. Equity Reference Group for Immunization; 2018 (https://sites.google.com/view/erg4immunisation/discussion-papers, accessed 6 September 2019).
5. Global Vaccine Action Plan: monitoring, evaluation and accountability. Secretariat Annual Report 2015 [Internet]. World Health Organization; 2015 (https://www.who.int/immunization/global_vaccine_action_plan/gvap_secretariat_report_2015.pdf?ua=1, accessed 8 September 2019).
I N E Q UA L I T Y M O N I TO R I N G I N I M M U N I Z AT I O N: A S T E P - BY - S T E P MA N UA L
66
Appendix 5. Overcoming limited data availability
The compromised availability of immunization data in vulnerable populations may be linked to: underdeveloped health information systems; displacement or migration; loss of belongings/identification; and lack of political or social prioritization. One common challenge is the availability and quality of denominator data; that is, certain population subgroups are not reliably captured in the routine data collected through censuses or civil registration and vital statistics (CRVS). This compromises the ability to design rigorous representative household survey sampling frameworks. The World Health Organization (WHO) has drafted guidance on assessing and improving the accuracy of target population denominators derived from administrative data (see https://www.who.int/immunization/monitoring_surveillance/data/Denominator_guide.pdf ).
The Equity Reference Group for Immunization (ERG) has proposed recommendations to resolve data and information gaps, including (non-exhaustively) (1,2):
• Develop capacity on triangulation of data sources.
• Fund efforts to improve the collection timeliness and granularity of data.
• Promote data sharing across organizations or between sectors.
• Extract a finer level of detail from existing data sources to better understand the situations across vulnerable subgroups.
• Introduce, where possible, electronic immunization registries (EIRs) to help health workers identify which children need services and improve supply chain management.
References
1. Immunisation equity data gaps and related recommendations [Internet]. Equity Reference Group for Immunization; 2019 (https://sites.google.com/view/erg4immunisation/discussion-papers, accessed 6 September 2019).
2. Victora CG, Ryman TK. ERG Discussion paper No. 2. Potential approaches to better measure and track equity in immunization using survey and administrative data, and data triangulation [Internet]. Equity Reference Group for Immunization; 2018 (https://sites.google.com/view/erg4immunisation/discussion-papers, accessed 6 September 2019).
67
Appendix 6. Complex measures of inequality
Although less intuitive than simple measures of inequality such as difference and ratio, complex measures of inequality provide more nuanced insights into the underlying data. Complex measures can only be calculated for dimensions of inequality that consist of more than two subgroups. The characteristics of the dimension of inequality and associated subgroup categorizations should be taken into account when selecting summary measures of inequality (Table A6.1). Key considerations include:
• Are the subgroups ordered (that is, have a natural ranking, such as economic status or education level) or non-ordered (that is, do not have an inherent ranking, such as region or ethnicity)?
° For ordered subgroups, consider absolute summary measures such as absolute concentration index and slope index of inequality; for relative measures, consider relative concentration index and relative index of inequality.
° For non-ordered subgroups, consider absolute summary measures such as between-group standard deviation, between-group variance, population attributable risk, and mean difference from mean; for relative measures, consider coefficient of variation, population attributable fraction, Theil index and index of disparity, for instance.
• Should the population size of each subgroup be taken into consideration or not (that is, does the measure account for population size)? Note that weighting the population subgroups for data analysis is a different issue than survey sample weighting.
° For weighted subgroups, consider absolute summary measures such as absolute concentration index, between-group standard deviation, between-group variance, population attributable risk, slope index of inequality and weighted mean difference from mean; for relative measures, consider coefficient of variation, mean log deviation, population attributable fraction, relative concentration index, relative index of inequality, Theil index and weighted index of disparity.
° For unweighted subgroups, consider absolute summary measures such as unweighted mean difference from mean; for relative measures, consider unweighted index of disparity.
Certain summary measures require the use of a reference group, which provides a point of reference for comparison. In cases where the subgroups are non-ordered, the best-performing or most-advantaged subgroup is commonly selected as the reference group.

Table A6.1. Absolute and relative complex measures of inequality corresponding to ordered vs non-ordered and weighted vs unweighted considerations
Name of summary measure Ordered versus non-ordered complex measure
Weighted versus unweighted measure
Absolute measures of inequality
Absolute concentration index Ordered Weighted
Between-group variance Non-ordered Weighted
Mean difference from best-performing subgroup Non-ordered Weighted or unweighted
Mean difference from mean Non-ordered Weighted or unweighted
Population attributable risk Either ordered or non-ordered Weighted
Slope index of inequality Ordered Weighted
Relative measures of inequality
Index of disparity Non-ordered Weighted or unweighted
Mean log deviation Non-ordered Weighted
Population attributable fraction Either ordered or non-ordered Weighted
Relative concentration index Ordered Weighted
Relative index of inequality Ordered Weighted
Theil index Non-ordered Weighted
I N E Q UA L I T Y M O N I TO R I N G I N I M M U N I Z AT I O N: A S T E P - BY - S T E P MA N UA L
68
There are several resources available that explain technical details regarding the calculations of complex measures of inequality (1–3), or facilitate these calculations directly (4).
References
1. Handbook on health inequality monitoring: with a special focus on low- and middle-income countries. Geneva: World Health Organization; 2013.
2. Hosseinpoor AR, Bergen N, Schlotheuber A, Grove J. Measuring health inequalities in the context of sustainable development goals. Bull World Health Organ. 2018 Sep 1;96(9):654–9.
3. Harper S, Lynch J. Methods for measuring cancer disparities: using data relevant to Healthy People 2010 cancer-related objectives. Bethesda, MD: National Cancer Institute; 2005.
4. Health Equity Assessment Toolkit [Internet]. Global Health Observatory. World Health Organization; 2019 (https://www.who.int/gho/health_equity/assessment_toolkit/en/, accessed 8 September 2019).

69
Appendix 7. Multiple regression analysis and compounded vulnerability
Multiple regression analysis and compounded vulnerability calculations are types of analyses where a dependent variable (such as immunization coverage) can be associated with more than one explanatory variable (that is, dimension of inequality) simultaneously. These analyses can be done even if the explanatory variables are not independent.
Multiple regression analysis is used to demonstrate how multiple factors are associated with an immunization indicator, accounting for other characteristics and interaction effects. Note that, when multiple regression analysis is carried out, some factors may turn out to not have a statistically significant association with the immunization indicator. In the report Explorations of inequality: childhood immunization, multiple regression analysis was used to calculate adjusted associations between third dose of combined diphtheria, tetanus toxoid and pertussis vaccine (DTP3) coverage and selected socioeconomic, demographic and geographic factors (1). The results of multiple regression analysis were presented as odds ratios. For example, drawing from 2013 Demographic and Health Survey (DHS) data from Nigeria, the odds ratio of DTP3 immunization coverage among the subgroup of children whose mothers had more than secondary school was 6.64, indicating that the chance of vaccination was 6.64 times higher than for children whose mothers had no education, accounting for other socioeconomic, demographic and geographic factors.
Multiplying the odds ratios for several factors demonstrates the compounded impact of several dimensions of inequality experienced at the same time – compounded vulnerability (or advantage). For example, in Nigeria, children with mothers aged 20–34 years (odds ratio: 1.89) who had an education level of more than secondary school (odds ratio: 6.64) had a 12 times higher chance of being vaccinated (1.89*6.64 = 12.55) than children whose mothers were teenagers with no education.
Reference
1. Explorations of inequality: childhood immunization. Geneva: World Health Organization; 2018.

I N E Q UA L I T Y M O N I TO R I N G I N I M M U N I Z AT I O N: A S T E P - BY - S T E P MA N UA L
70
Appendix 8. Case study: reporting inequalities in immunization
The State of inequality report series highlights key findings across different health topics and settings. A closer look at the 2016 State of inequality: childhood immunization report – awarded a first place Medical Book Award in the digital and online resources category by the British Medical Association – illustrates an example of how sub-Steps 4A–E of reporting inequality have been applied (Table A8.1).
Table A8.1. The application of sub-steps of reporting inequality monitoring results in the State of inequality: childhood immunization report (1,2)
Sub-step Application in the State of inequality: childhood immunization report
4A • The purpose of the State of inequality: childhood immunization report is to serve “as source of high-quality data for those involved in making policy decisions affecting health or those working to improve childhood immunization coverage”.
• The report was developed for audiences with variable levels of experience in the area of health inequality monitoring. This included, primarily, technical staff, public health professionals and researchers.
4B • The scope of reporting in the State of inequality: childhood immunization report addresses two overarching questions: What inequalities in childhood immunization coverage exist? And how have childhood immunization inequalities changed over the past 10 years?
• The report contains data from 69 countries and makes comparisons of the levels of within-country inequality (benchmarking). The best- and worst-performing countries are identified, and an extended analysis of poor-performing countries is provided.
4C • The content of the State of inequality: childhood immunization report centres on four pertinent dimensions of inequality: household economic status; mother’s education; place of residence; and sex.
• The report contains disaggregated data and draws from two statistical measures – median and interquartile range – to describe patterns in disaggregated data from study countries.
• In addition to disaggregated data, the latest situation is presented using two simple measures of inequality (difference and ratio) and one complex measure of inequality (population attributable risk). Change over time is presented using the summary measure absolute excess change.
4D • The State of inequality: childhood immunization report uses text, tables and figures to communicate the key messages.• The report also interfaces with interactive visuals that permit further exploration of the data: all of the static figures in the text are also
available as interactive visuals. Additional interactive visuals containing story points and reference tables are available. The interactive visuals are referenced throughout the report using QR codes and URLs to direct the audience to the online visuals.
4E • The State of inequality: childhood immunization report adheres to the best practices of reporting inequality. Tooltip (pop-up) boxes in interactive visuals are used to indicate results based on low sample sizes and statistical significance.
References
1. State of inequality: childhood immunization. Geneva: World Health Organization; 2016.
2. Hosseinpoor AR, Bergen N. Health inequality monitoring: a practical application of population health monitoring. In: Verschuuren M, van Oers H, editors. Population Health Monitoring [Internet]. Cham: Springer International Publishing; 2019:151–73 (http://link.springer.com/10.1007/978-3-319-76562-4_8, accessed 6 September 2019).

71
Glossary of termsAbsolute inequality reflects the magnitude of difference in health between subgroups. Absolute measures of inequality retain the same unit of measure as the health indicator.
Administrative data reflect immunization data collected by health facility staff at the time of service delivery, including the number of doses administered to the target population and other types of information.
Benchmarking is the process of comparing data from similar areas or populations to get an idea of how one area/population performs in relation to others. Benchmarking provides context for a broader understanding of the state of inequality.
Complex measures of inequality draw on data from all subgroups to produce a single number that is an expression of the level of inequality. For example, they can express inequality across all wealth quintiles, or among all regions in a country.
Comprehensive multi-year plans for immunization (cMYPs) are costed multi-year plans for immunization at a national level. cMYPs should be reviewed and revised annually to reflect changing conditions and considerations, such as equity-oriented immunization interventions.
Coverage indicators measure the number of people that receive a specified vaccine (or number of doses of a specified vaccine), out of the total number of people eligible for the vaccine.
Data source mapping is a systematic process for cataloguing and describing all data that are available for health inequality monitoring in a given context. The process can be broken down into four sequential stages: (1) list available data sources by type; (2) for each data source, determine availability of data for dimensions of inequality; (3) for each data source, determine availability of data about health indicators; and (4) combine the lists about health indicators and dimensions of inequality. Note that this is a recommended approach, and that any of the stages may be modified to suit the needs of the user.
A dimension of inequality is the categorization upon which subgroups are formed for health inequality monitoring, such as wealth, education, region, sex, etc. The selection of dimensions of inequality typically reflects categories that are reasonably likely to reflect unfair differences between groups that could be corrected by changes to policies, programmes or practices.
Disaggregated estimates are data that are broken down by population subgroup (as opposed to overall average).
Double disaggregation is the practice of filtering data according to two dimensions of inequality simultaneously. Double disaggregation permits exploration of intersectionality.
I N E Q UA L I T Y M O N I TO R I N G I N I M M U N I Z AT I O N: A S T E P - BY - S T E P MA N UA L
72
Drop-out rate is a measure of the proportion of children who have received at least one initial dose of a multi-dose vaccine, but have not received the full set of doses appropriate for their age.
Equity stratifier – see: dimension of inequality.
An Expanded Programme on Immunization (EPI) Review is a comprehensive assessment of the strengths and weaknesses across various administrative levels of an immunization programme. Inequality monitoring in immunization serves as an input for the desk review: it can guide field site selection and can influence questions and interviews during an EPI Review.
Fully immunized children have received all recommended vaccines, according to their age and the national immunization schedule.
Health inequalities are observable health differences between subgroups within a population. Health inequalities can be measured and monitored.
Health inequity is a normative concept that describes systematic differences in health between population subgroups that are deemed to be unjust, unfair and avoidable. Health inequity is linked to forms of disadvantage that are socially produced, such as poverty, discrimination and lack of access to services or goods.
Household surveys generate estimates about immunization coverage based on a specified sampling design within a target population.
Intersectoral collaboration for immunization occurs when people from different sectors collectively work towards improving conditions that contribute to inequalities in immunization.
Knowledge translation refers to the process of putting knowledge into action; that is, using the results of inequality monitoring to inform changes to policies, programmes and practices that affect immunization.
Linked data, in the context of health inequality monitoring, are data about health indicators and dimensions of inequality that stem from different data sources, and are merged through an individual or small-area characteristic.
Measures of uncertainty indicate the level of certainty around a household survey point estimate. Common measures of certainty include 95% confidence intervals and standard error.
Monitoring is a process of repeatedly observing a situation to watch for changes over time. While monitoring can help to determine the impact of policies, programmes and practices, monitoring alone cannot typically explain the cause of troublesome trends. Rather, monitoring may be thought of as a warning system. Monitoring activities can both inform and direct research in a given area. Because monitoring tracks progress over time, it can be described as a continual cycle.
Non-ordered inequality dimensions are not based on criteria that can be logically ranked. For example, region, ethnicity and religion dimensions of inequality typically contain subgroups that are non-ordered.

73
Ordered inequality dimensions have an inherent positioning and can be logically ranked. For example, wealth and education level are dimensions of inequality that typically contain subgroups that can be ordered.
Population share describes the percentage of the population that is represented by a given population subgroup. In cases where the health indicator does not affect the entire population, population share expresses the percentage of the affected population represented by a given population subgroup. For example, if looking at service coverage among pregnant women, then population share would express the percentage of pregnant women in a given subgroup out of all pregnant women in the population.
Population subgroups, in the context of health inequality monitoring, reflect ways of grouping a population based on a dimension of inequality. For example, population subgroups based on wealth are commonly grouped as quintiles, ranging from the poorest 20% to the richest 20%.
A reference group provides a point of comparison when calculating health inequality, and is a feature of certain types of summary measures of inequality. For example, measures of impact such as population attributable risk often define a reference group as the best performing or most advantaged subgroup.
Relative inequality shows the proportional differences in health among subgroups. Relative measures of inequality are unit-less.
Simple measures of inequality make pairwise comparisons of health between two subgroups, such as the most and least wealthy. These are the most commonly used measures in inequality monitoring, as they are intuitive and easily understood. Simple measures of inequality are typically unweighted.
Summary measures of inequality yield a single number that reflects the level of inequality between two or more subgroups. Summary measures of inequality may indicate absolute or relative inequality, and may involve two subgroups (that is, simple pairwise measures) or more than two subgroups (that is, complex measures). Summary measures of inequality may be weighted or unweighted.
The target audience is the group of people to whom the results of inequality monitoring are intended to be communicated. For inequality monitoring in immunization, the target audience may include programme managers, members of the National Immunization Technical Advisory Group (NITAG), immunization researchers, technical experts, public health practitioners, policy-makers, advocacy groups and others.
The target population for monitoring refers to the entire group of people that monitoring encompasses, and includes all population subgroups. The target population for immunization monitoring includes all people in a specified area or sample who are eligible for a particular vaccination schedule, based on age, sex, life stage or exposure risk.
A tracer indicator is a specified health indicator chosen to represent a broader health topic. Tracer indicators have the advantage of being easy to understand and report, but may lead to more resources being dedicated to an area simply because it is being monitored.
I N E Q UA L I T Y M O N I TO R I N G I N I M M U N I Z AT I O N: A S T E P - BY - S T E P MA N UA L
74
Unweighted measures treat each subgroup as equally sized, and is a feature of simple measures of inequality and certain complex measures of inequality.
Weighted measures take into account the population size of each subgroup. This is a feature of certain complex measures of inequality.
Zero-dose children (also called “left-outs”) represent the proportion of children who have not received any of the vaccines indicated for their age according to the national immunization schedule.
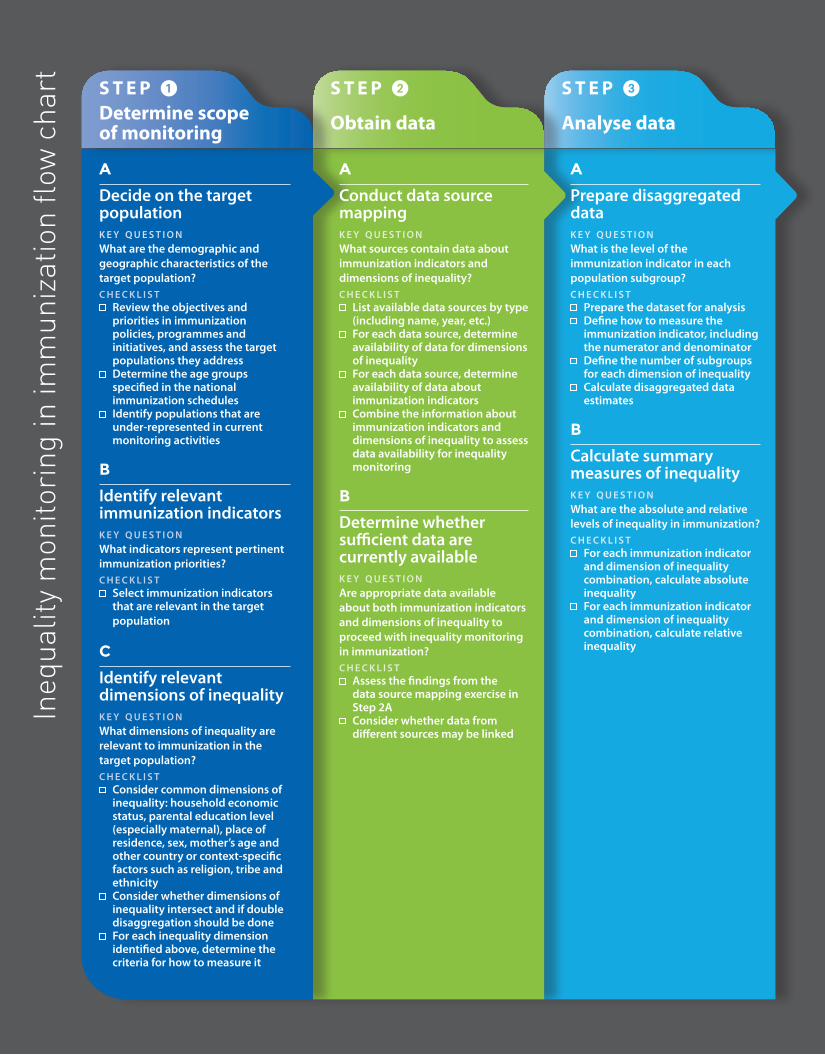
Ineq
ualit
y m
onito
ring
in im
mun
izat
ion
flow
cha
rt
Report results
S T E P 5
Knowledge translation
S T E P 4
Report results
S T E P 3
Analyse data
S T E P 2
Obtain data
S T E P 1
Determine scope of monitoring
A
Decide on the target populationk e y q u e s t i o nWhat are the demographic and geographic characteristics of the target population?c h e c k l i s t
Review the objectives and priorities in immunization policies, programmes and initiatives, and assess the target populations they addressDetermine the age groups specified in the national immunization schedulesIdentify populations that are under-represented in current monitoring activities
B
Identify relevant immunization indicatorsk e y q u e s t i o nWhat indicators represent pertinent immunization priorities?c h e c k l i s t
Select immunization indicators that are relevant in the target population
C
Identify relevant dimensions of inequalityk e y q u e s t i o nWhat dimensions of inequality are relevant to immunization in the target population?c h e c k l i s t
Consider common dimensions of inequality: household economic status, parental education level (especially maternal), place of residence, sex, mother’s age and other country or context-specific factors such as religion, tribe and ethnicityConsider whether dimensions of inequality intersect and if double disaggregation should be doneFor each inequality dimension identified above, determine the criteria for how to measure it
A
Conduct data source mappingk e y q u e s t i o nWhat sources contain data about immunization indicators and dimensions of inequality?c h e c k l i s t
List available data sources by type (including name, year, etc.)For each data source, determine availability of data for dimensions of inequalityFor each data source, determine availability of data about immunization indicatorsCombine the information about immunization indicators and dimensions of inequality to assess data availability for inequality monitoring
B
Determine whether sufficient data are currently availablek e y q u e s t i o nAre appropriate data available about both immunization indicators and dimensions of inequality to proceed with inequality monitoring in immunization?c h e c k l i s t
Assess the findings from the data source mapping exercise in Step 2AConsider whether data from different sources may be linked
A
Prepare disaggregated datak e y q u e s t i o nWhat is the level of the immunization indicator in each population subgroup?c h e c k l i s t
Prepare the dataset for analysis Define how to measure the immunization indicator, including the numerator and denominatorDefine the number of subgroups for each dimension of inequalityCalculate disaggregated data estimates
B
Calculate summary measures of inequalityk e y q u e s t i o nWhat are the absolute and relative levels of inequality in immunization?c h e c k l i s t
For each immunization indicator and dimension of inequality combination, calculate absolute inequalityFor each immunization indicator and dimension of inequality combination, calculate relative inequality
Identify priority areas for action
Integrate equity considerations into immunization programmes and policies
Identify opportunities for intersectoral collaboration
A
Define the purpose of reporting and the target audiencek e y q u e s t i o nWhat parameters guide the approach to reporting?c h e c k l i s t
Define the overarching goals and objectives of reportingIdentify the main audience for whom the report is preparedDetermine the audience’s prior knowledge of inequalities in immunization
B
Select the scope of reportingk e y q u e s t i o nWhat aspects of the state of inequality should be covered by the report?c h e c k l i s t
Determine which data reflect the latest status of inequalityAssess whether to report trend over timeAssess whether to report benchmarking
C
Define the technical content of the reportk e y q u e s t i o nWhat results of data analysis will be reported?c h e c k l i s t
Do an initial assessment of results to determine: What are the most salient conclusions?Are there any apparent patterns in the data?
Report disaggregated data estimatesConsider whether simple measures and complex measures reflect the same conclusions
D
Decide upon methods of presenting datak e y q u e s t i o nHow will key messages in the data be presented?c h e c k l i s t
Identify the appropriate tools to present the results (e.g. text, tables, graphs and maps)Consider using interactive visualization technology
E
Adhere to best practices of reportingk e y q u e s t i o nWhat does the audience need to know to fully understand the context of the results?c h e c k l i s t
Report both absolute and relative inequalityIndicate the average level of the indicator in the target populationIndicate the population share of subgroupsFlag results that are based on low sample size (if results are derived from survey data)Consider reporting statistical significance, if appropriateReport the methods and processes that underlie how you arrived at the conclusions, including their strengths and limitations

Ineq
ualit
y m
onito
ring
in im
mun
izat
ion
flow
cha
rt
Report results
S T E P 5
Knowledge translation
S T E P 4
Report results
S T E P 3
Analyse data
S T E P 2
Obtain data
S T E P 1
Determine scope of monitoring
A
Decide on the target populationk e y q u e s t i o nWhat are the demographic and geographic characteristics of the target population?c h e c k l i s t
Review the objectives and priorities in immunization policies, programmes and initiatives, and assess the target populations they addressDetermine the age groups specified in the national immunization schedulesIdentify populations that are under-represented in current monitoring activities
B
Identify relevant immunization indicatorsk e y q u e s t i o nWhat indicators represent pertinent immunization priorities?c h e c k l i s t
Select immunization indicators that are relevant in the target population
C
Identify relevant dimensions of inequalityk e y q u e s t i o nWhat dimensions of inequality are relevant to immunization in the target population?c h e c k l i s t
Consider common dimensions of inequality: household economic status, parental education level (especially maternal), place of residence, sex, mother’s age and other country or context-specific factors such as religion, tribe and ethnicityConsider whether dimensions of inequality intersect and if double disaggregation should be doneFor each inequality dimension identified above, determine the criteria for how to measure it
A
Conduct data source mappingk e y q u e s t i o nWhat sources contain data about immunization indicators and dimensions of inequality?c h e c k l i s t
List available data sources by type (including name, year, etc.)For each data source, determine availability of data for dimensions of inequalityFor each data source, determine availability of data about immunization indicatorsCombine the information about immunization indicators and dimensions of inequality to assess data availability for inequality monitoring
B
Determine whether sufficient data are currently availablek e y q u e s t i o nAre appropriate data available about both immunization indicators and dimensions of inequality to proceed with inequality monitoring in immunization?c h e c k l i s t
Assess the findings from the data source mapping exercise in Step 2AConsider whether data from different sources may be linked
A
Prepare disaggregated datak e y q u e s t i o nWhat is the level of the immunization indicator in each population subgroup?c h e c k l i s t
Prepare the dataset for analysis Define how to measure the immunization indicator, including the numerator and denominatorDefine the number of subgroups for each dimension of inequalityCalculate disaggregated data estimates
B
Calculate summary measures of inequalityk e y q u e s t i o nWhat are the absolute and relative levels of inequality in immunization?c h e c k l i s t
For each immunization indicator and dimension of inequality combination, calculate absolute inequalityFor each immunization indicator and dimension of inequality combination, calculate relative inequality
Identify priority areas for action
Integrate equity considerations into immunization programmes and policies
Identify opportunities for intersectoral collaboration
A
Define the purpose of reporting and the target audiencek e y q u e s t i o nWhat parameters guide the approach to reporting?c h e c k l i s t
Define the overarching goals and objectives of reportingIdentify the main audience for whom the report is preparedDetermine the audience’s prior knowledge of inequalities in immunization
B
Select the scope of reportingk e y q u e s t i o nWhat aspects of the state of inequality should be covered by the report?c h e c k l i s t
Determine which data reflect the latest status of inequalityAssess whether to report trend over timeAssess whether to report benchmarking
C
Define the technical content of the reportk e y q u e s t i o nWhat results of data analysis will be reported?c h e c k l i s t
Do an initial assessment of results to determine: What are the most salient conclusions? Are there any apparent patterns in the data?
Report disaggregated data estimatesConsider whether simple measures and complex measures reflect the same conclusions
D
Decide upon methods of presenting datak e y q u e s t i o nHow will key messages in the data be presented?c h e c k l i s t
Identify the appropriate tools to present the results (e.g. text, tables, graphs and maps)Consider using interactive visualization technology
E
Adhere to best practices of reportingk e y q u e s t i o nWhat does the audience need to know to fully understand the context of the results?c h e c k l i s t
Report both absolute and relative inequalityIndicate the average level of the indicator in the target populationIndicate the population share of subgroupsFlag results that are based on low sample size (if results are derived from survey data)Consider reporting statistical significance, if appropriateReport the methods and processes that underlie how you arrived at the conclusions, including their strengths and limitations

ISBN 978 92 4 151653 2
World Health Organization20 Avenue Appia1211-Geneva 27
Switzerland
Department of Data and AnalyticsDivision of Data, Analytics and Delivery for Impact