inequality of opportunities in education in the philippines
TRANSCRIPT

EDUCATIONAL INEQUALITY
AMONG ETHNIC GROUPS IN THE
PHILIPPINES
CHRISTIAN D. MINA
3 DECEMBER 2019
OUTLINE
Background
Objectives
Methodology
Key Findings
Some Recommendations
2
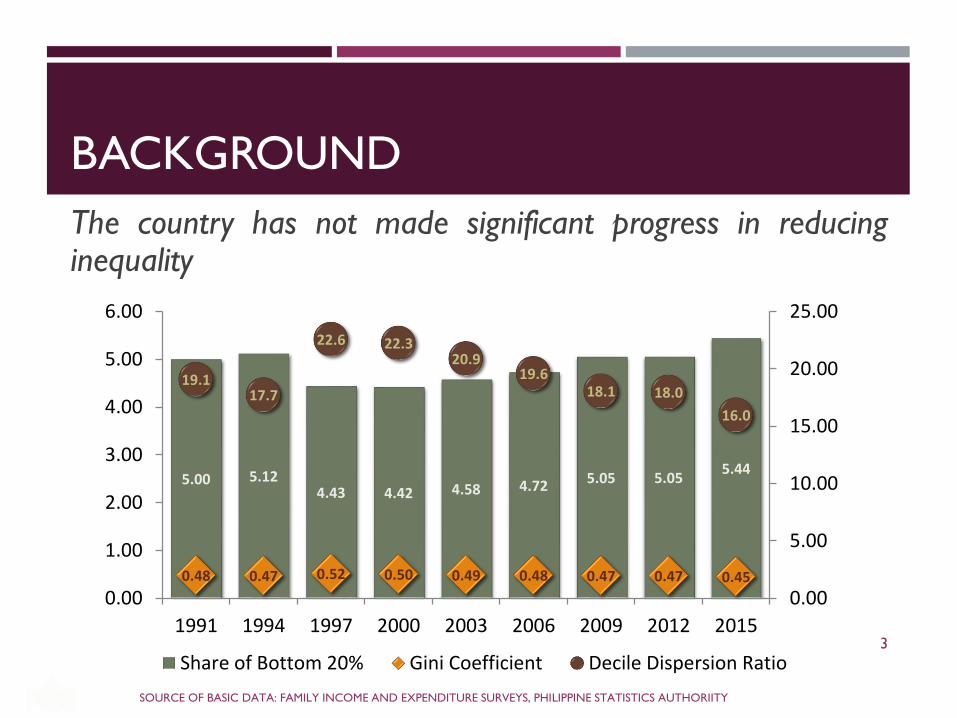
BACKGROUND
The country has not made significant progress in reducinginequality
SOURCE OF BASIC DATA: FAMILY INCOME AND EXPENDITURE SURVEYS, PHILIPPINE STATISTICS AUTHORIITY
3
5.00 5.124.43 4.42 4.58 4.72 5.05 5.05
5.44
0.48 0.47 0.52 0.50 0.49 0.48 0.47 0.47 0.45
19.117.7
22.6 22.320.9
19.618.1 18.0
16.0
0.00
5.00
10.00
15.00
20.00
25.00
0.00
1.00
2.00
3.00
4.00
5.00
6.00
1991 1994 1997 2000 2003 2006 2009 2012 2015
Share of Bottom 20% Gini Coefficient Decile Dispersion Ratio

OBJECTIVES
To examine educational inequality among ethnicgroups in the Philippines
o Show inequality trends
o Identify the ‘educationally excluded’ groups
o Determine the contributory factors to inequality
To provide insights on how to address suchinequality
www.pids.gov.ph 4

METHODOLOGY
Data
• 2000 and 2010 Census of Population and Housing (CPH)
• 2000 – 10% sample, 2010 – 20% sample
Variables
• Grouping: Ethnicity
• Outcome: Years of schooling (aged 25 & over); Literacy status (aged 10 & over)
Inequality measures
• Gini coefficient
• Theil’s index
5
METHODOLOGY:ETHNICITY
primary sense of belonging to an
ethnolinguistic group, which is blood-related
in nature in the sense that the ties are
reckoned by blood and traced through family
tree
denotes genealogical, paternal as well as
maternal lineage to any of the country’s
group of native population6
METHODOLOGY:ETHNIC GROUPS
182 ethnolinguistic groups; 142 are indigenous
people (IP) groups
Major ethnic groups (NCIP’s classification):
1) Muslim ethnic group (IPs and non-IPs)
2) Non-Muslim IPs ethnic group
3) Non-Muslim, non-IPs ethnic group
7

KEY FINDINGS
8
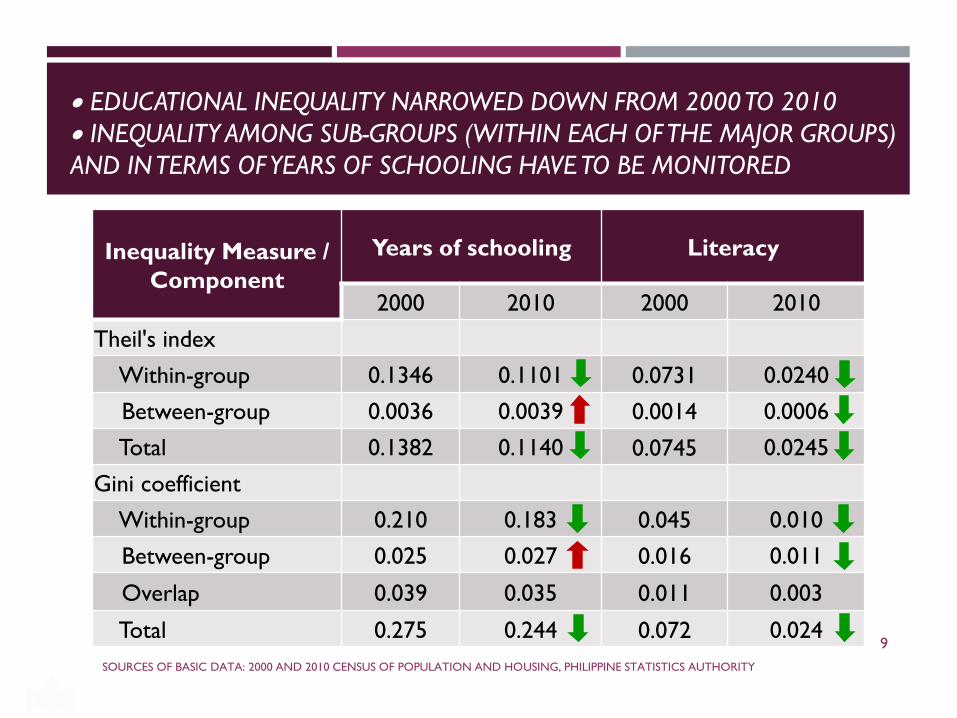
EDUCATIONAL INEQUALITY NARROWED DOWN FROM 2000 TO 2010
INEQUALITY AMONG SUB-GROUPS (WITHIN EACH OF THE MAJOR GROUPS)
AND IN TERMS OF YEARS OF SCHOOLING HAVE TO BE MONITORED
Inequality Measure /
Component
Years of schooling Literacy
2000 2010 2000 2010
Theil's index
Within-group 0.1346 0.1101 0.0731 0.0240
Between-group 0.0036 0.0039 0.0014 0.0006
Total 0.1382 0.1140 0.0745 0.0245
Gini coefficient
Within-group 0.210 0.183 0.045 0.010
Between-group 0.025 0.027 0.016 0.011
Overlap 0.039 0.035 0.011 0.003
Total 0.275 0.244 0.072 0.024
SOURCES OF BASIC DATA: 2000 AND 2010 CENSUS OF POPULATION AND HOUSING, PHILIPPINE STATISTICS AUTHORITY
9

MUSLIM ETHNIC GROUPS HAVE HIGH EDUCATIONAL INEQUALITY,
ESPECIALLY IN TERMS OF YEARS OF SCHOOLING
EDUCATIONAL DISPARITY AMONG NON-MUSLIM IP GROUPS HAS TO BE
MONITORED AS WELL
Inequality Measure /
Ethnic Group
Years of schooling Literacy
2000 2010 2000 2010
Theil's index
Muslim 0.4514 0.3619 0.3036 0.1586
Non-Muslim IPs 0.2377 0.2122 0.1635 0.0749
Non-Muslim, non-IPs 0.1185 0.0945 0.0572 0.0127
Gini coefficient
Muslim 0.4791 0.4307 0.2621 0.1468
Non-Muslim IPs 0.3559 0.3370 0.1510 0.0722
Non-Muslim, non-IPs 0.2584 0.2261 0.0557 0.0126
SOURCES OF BASIC DATA: 2000 AND 2010 CENSUS OF POPULATION AND HOUSING, PHILIPPINE STATISTICS AUTHORITY10

MUSLIM IP GROUPS LIKE SAMA LAUT, SAMA BADJAO AND BADJAO HAVE VERY LOW
EDUCATIONAL OUTCOMES
POSSIBLE REASONS: LOCATED IN CONFLICT-STRICKEN AREAS, MIGRATORY, LACK OF
UNDERSTANDING OF THE VALUE OF EDUCATION, FEAR OF DECULTURALIZATION, SOCIAL
DISTANCE WITH RELIGIOUS OUT-GROUPS, POVERTY
97.290.6 88.1 86.0 82.5 82.2
86.1
96.0
85.9 85.3 83.4 82.5 80.7
37.2 35.9
24.6
81.6
9.8
7.4
5.4 5.65.0
6.0 6.2
7.3
5.44.6
5.15.9 6.2
2.1 1.9 2.1
5.7
0
1
2
3
4
5
6
7
8
9
10
0.0
10.0
20.0
30.0
40.0
50.0
60.0
70.0
80.0
90.0
100.0
Muslim non-IPs Muslim IPs
Year
s
Per
cen
t
Literacy rate of aged 10 and over Years of schooling aged 25 and over
SOURCE OF BASIC DATA: 2010 CENSUS OF POPULATION AND HOUSING, PHILIPPINE STATISTICS AUTHORITY
11

SOME NON-MUSLIM IP GROUPS LIKE LANGILAN AND MAG-ANTSI HAVE
VERY LOW EDUCATIONAL OUTCOMES
POSSIBLE REASON: LACK OF UNDERSTANDING OF THE VALUE OF
EDUCATION, POVERTY
SOURCE OF BASIC DATA: 2010 CENSUS OF POPULATION AND HOUSING, PHILIPPINE STATISTICS AUTHORITY
12
Non-Muslim IPs Literacy Rate (%)Average years of
schooling(Years)
Agta-Agay 32.9 2.3
Buhid 54.7 2.0
Alangan 56.6 1.9
Mag-Antsi 48.6 1.9
Manobo-Dulangan 54.3 1.6
Langilan 18.3 1.1

SOME RECOMMENDATIONS
1) Promote higher participation among specific IP groups with very low educational outcomes (e.g., Mag-Antsi)
o Conduct dialogues on the importance and value of education between parents and educated members of each ethnic community
o Encourage parents (other than elders) to take part in the design of indigenous curriculum, preparation of instructional materials, and facilitation of school activities, among others
2) Design Muslim Education Program similar to IPEd and adopt similar strategies in (1)?
o Some developments: BARMM, RA 10908 (Integrated History Act of 2016) [CHED and DepEd may need to consult with Muslim historians and Islamic Institutions to ensure its proper implementation]
o Enhance madrasah education development programs for Muslims within and outside BARMM through dialogues between the government and madrasah administrators
13

SOME RECOMMENDATIONS
4) Intensify efforts in addressing armed conflicts and rebuilding war-torn communities
5) Establish vocational boarding schools for out-of-school youth and mobile boat schools in island and/or coastal provinces
o Partner with organizations that run these alternative schools through provision of technical and/or financial assistance
6) Design and implement scholarship programs for financially-challenged Muslims and IPs
o Fine-tune the targeting system of the IP component of Modified Conditional Cash Transfer
7) Build up comprehensive database of ethnic group population14

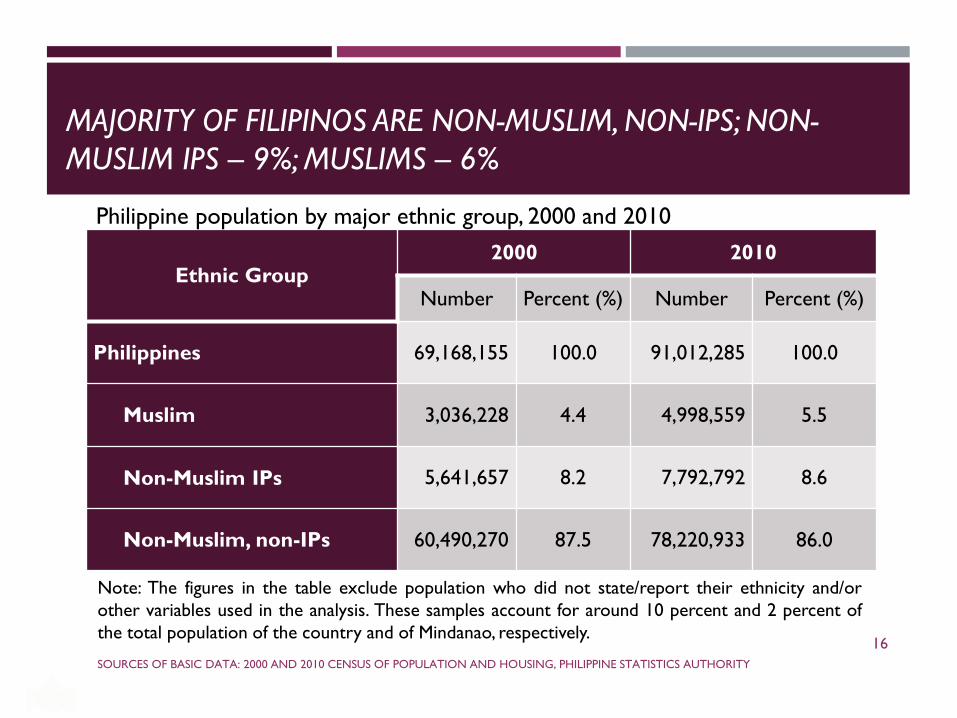
MAJORITY OF FILIPINOS ARE NON-MUSLIM, NON-IPS; NON-
MUSLIM IPS – 9%; MUSLIMS – 6%
Ethnic Group2000 2010
Number Percent (%) Number Percent (%)
Philippines 69,168,155 100.0 91,012,285 100.0
Muslim 3,036,228 4.4 4,998,559 5.5
Non-Muslim IPs 5,641,657 8.2 7,792,792 8.6
Non-Muslim, non-IPs 60,490,270 87.5 78,220,933 86.0
SOURCES OF BASIC DATA: 2000 AND 2010 CENSUS OF POPULATION AND HOUSING, PHILIPPINE STATISTICS AUTHORITY
16
Note: The figures in the table exclude population who did not state/report their ethnicity and/or
other variables used in the analysis. These samples account for around 10 percent and 2 percent of
the total population of the country and of Mindanao, respectively.
Philippine population by major ethnic group, 2000 and 2010

NON-MUSLIM, NON-IPS DOMINATE THE POPULATION IN ALL REGIONS, EXCEPT
ARMM & CAR; ARMM IS HOME FOR MOST OF MUSLIMS; CAR IS HOME FOR MANY
NON-MUSLIM IPS
SOURCES OF BASIC DATA: 2000 AND 2010 CENSUS OF POPULATION AND HOUSING, PHILIPPINE STATISTICS AUTHORITY
17
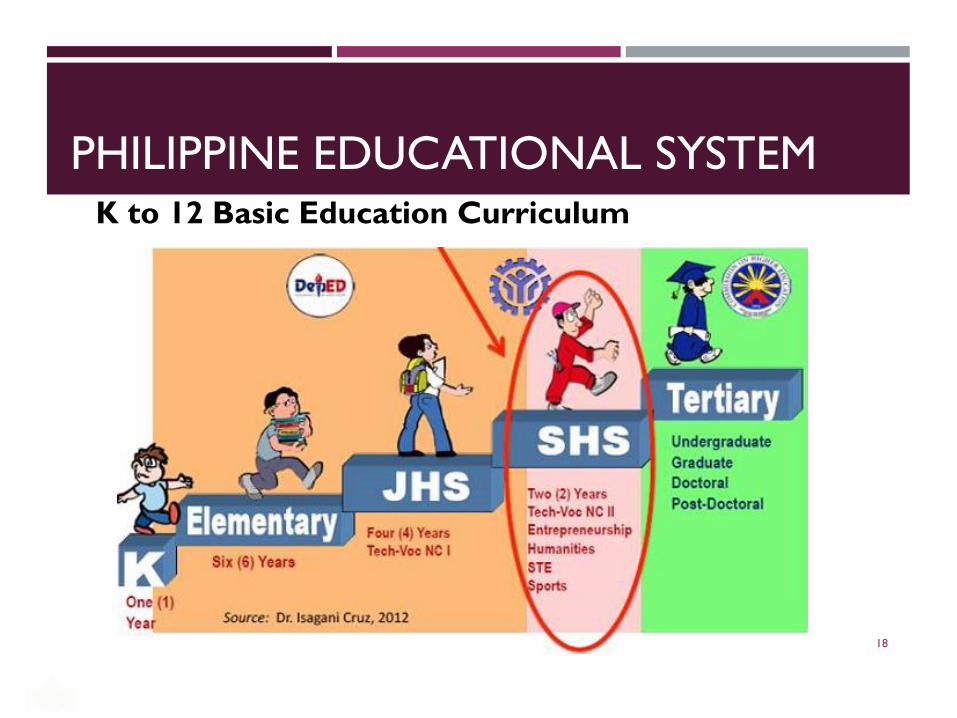
PHILIPPINE EDUCATIONAL SYSTEM
www.pids.gov.ph 18
K to 12 Basic Education Curriculum
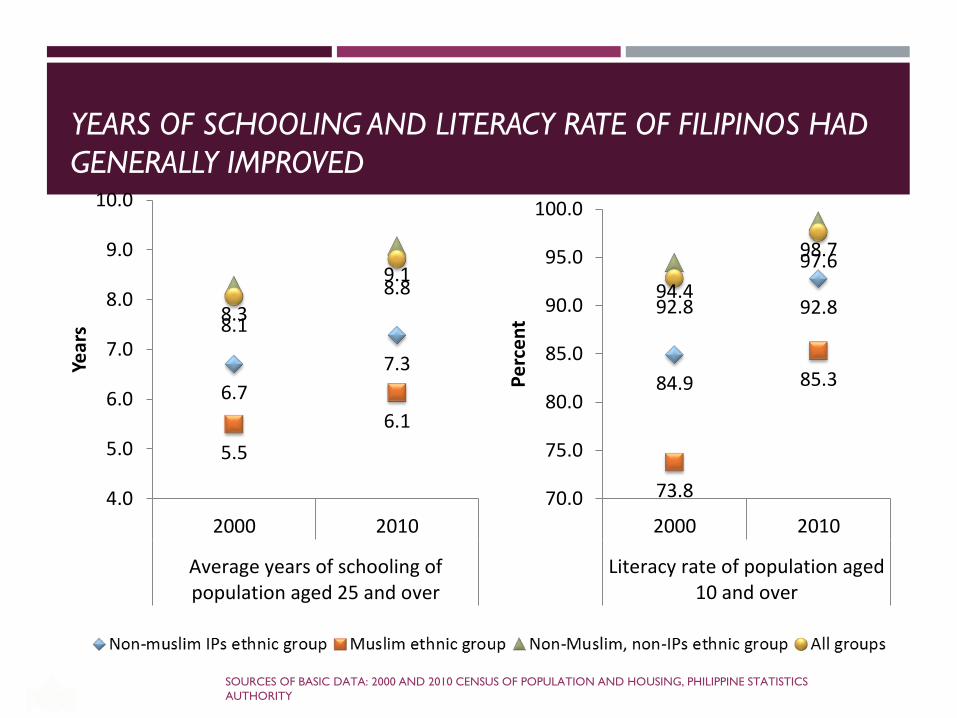
YEARS OF SCHOOLING AND LITERACY RATE OF FILIPINOS HAD
GENERALLY IMPROVED
6.7
7.3
5.5
6.1
8.3
9.1
8.1
8.8
4.0
5.0
6.0
7.0
8.0
9.0
10.0
2000 2010
Average years of schooling ofpopulation aged 25 and over
Year
s
84.9
92.8
73.8
85.3
94.4
98.7
92.8
97.6
70.0
75.0
80.0
85.0
90.0
95.0
100.0
2000 2010
Literacy rate of population aged10 and over
Pe
rce
nt
www.pids.gov.ph
SOURCES OF BASIC DATA: 2000 AND 2010 CENSUS OF POPULATION AND HOUSING, PHILIPPINE STATISTICS
AUTHORITY
19

THERE HAD BEEN EQUITABLE DISTRIBUTION OF PRIMARY
EDUCATION SERVICES; A NEED FOR A MORE EQUITABLE
DISTRIBUTION OF SECONDARY EDUCATION SERVICES
Indicator /
Major ethnic groupHuman opportunity
index (HOI)
Primary education (aged 6-11)
All groups 88.97
Muslim ethnic group 73.46
Non-Muslim IP ethnic group 82.12
Non-Muslim, non-IP ethnic group 91.68
Secondary education (aged 12-18)
All groups 72.16
Muslim ethnic group 60.56
Non-Muslim IP ethnic group 65.40
Non-Muslim, non-IP ethnic group 73.99
www.pids.gov.ph
SOURCES OF BASIC DATA: 2010 CENSUS OF POPULATION AND HOUSING, PHILIPPINE STATISTICS
AUTHORITY
20

SCHOOL PARTICIPATION AMONG YOUNGER CHILDREN
HAD BEEN HIGHER; LOWER AMONG OLDER CHILDREN
www.pids.gov.ph
SOURCES OF BASIC DATA: 2010 CENSUS OF POPULATION AND HOUSING, PHILIPPINE STATISTICS
AUTHORITY
21
Proportion of children attending school, by single year of age and by major ethnic group,
2000 & 2010