inequality of outcomes - escap
TRANSCRIPT

1
Inequality of Outcomes
1. Introduction
Economic inequality generally refers to the disproportionate distribution of income, assets or
wealth among households in a society. However, the overall welfare of a society is not only
limited to distribution of income and wealth, but also related to social, economic and political
inclusion of its members and well-being of the society. Three components - income, poverty and
inequality have distinct significance and needs consideration to achieve an overall assessment of
welfare in developing countries. Significant efforts have been made to reduce income inequality in many
developing countries, but income inequality is rooted to other components of the economy and society
and cannot be effectively tackled unless the underlying inequality of opportunities in social, economic and
political dimensions is addressed. A comprehensive study of inequality of outcomes thus requires
for understanding and monitoring of the disparities involved in all three dimensions of
sustainable development - economic, social and environment.
This paper presents a set of selected indicators for measuring inequalities in each dimension,
their data sources and descriptive analysis.
2. Economic inequality
2.1 GDP per capita
The change in GDP per capita represents the size and growth of national income distributed over
the population over time. A country with a higher GDP per capita is considered economically
better than a country with lower value. In past decade many countries in Asia, especially India,
Bangladesh, Russian Federation and the East Asian countries witnessed a rapid economic
growth. The Figure 1 shows a comparison of aggregated GDP per capita of ESACP region with
rest of the world over 15 years. It shows a steady growth of GDP per capita along all regions, but
the pace of GDP growth in ESCAP countries is lower than world aggregate and the aggregate
GDP per capita of regions with advanced economy - North America, Europe. The aggregate GDP
per capita of ESCAP region is increased to about two and half folds from USD 2447 in 2000 to
USD 6051 in 2015, but its growth rate is far behind than the GDP per capita growth rates of
other regions except Africa.
Figure 1. A comparison of GDP per capita, ESCAP and rest of the world
0
10000
20000
30000
40000
50000
60000
2000 2005 2010 2015
USD
ESCAP Aggregates World AggregatesAfrica EuropeLatin America and Carib. North America
GDP per capita (USD)

2
Data Source: ESCAP online statistical database.
The Table 1 below compares GDP per capita of sub-regions within ESCAP1. Among sub-regions
within ESCAP, the growth and aggregated value of GDP per capita of the Pacific region is
exceptionally higher (USD 36898 in 2015) than the ESCAP aggregate and other regions. It is
probably due to the smaller size of the population in Pacific countries. Unlike Pacific region, the
South and South-West Asia region has the lowest per capita GDP. As shown in the Table 1, all
five regions in ESCAP experienced a remarkable growth in GDP per capita in fifteen years. Among
them the North and Central Asia enjoyed the highest growth of GDP per capita (424.7%)
followed by South and South-West Asia (210.4%) and other.
Table 1. A comparison of GDP per capita within sub-regions of ESCAP
Region GDP Per Capita (USD) Change in GDP
(%) 2000 2015
East and North-East Asia 4599 10736 133.5
South-East Asia 1188 3846 223.7
South and South-West Asia 648 2010 210.4
North and Central Asia 1420 7449 424.7
Pacific 15492 36898 138.2
ESCAP Aggregates 2447 6051 147.3
World Aggregates 5477 10082 84.1
Data Source: ESCAP online statistical database.
2.2 Growth of GDP Per capita
The Figure 2 presents trends in annual growth of GDP per capita of Asian countries from 1990 to
2015. The 58 ESCAP member countries are grouped in three categories - Least developed
countries, Developing countries (excluding LDCs) and Developed countries. The trend lines
indicate that both least developed and developing countries have experienced a rapid growth in
GDP per capita, especially after the Asian financial crisis of 1997 until the global financial crisis of
2008. During the period 1999 to 2007 the growth rates of developing countries were remained
around 5 to 9 percent. The higher growth of developing countries is mostly attributed by the
higher growths of East-Asian countries, especially China, Korea republic and Malaysia. A similar
trend of a steady growth of 4 to 7 percent was also found in the least developed countries from
1999 to 2007. However, the higher growths of both sub-groups are started to fell down and
move towards convergence of GDP per capita growth of 4 to 5 percent- the difference in recent
years after 2012 remains mostly about 1 percentage point.
In contrast to the GDP per capita growths of least developed and developing countries, the
growth of developed countries has remained mostly constant in between 0 to 2 percent. In
addition the developed countries have experienced negative growths during the periods of Asian
and Global financial crisis.
1 The grouping of countries is taken as per the ESCAP Online Statistical Database.

3
Figure 2. Distribution of annual growth of GDP Per capita
Source: World Development Indicators, WB.
2.3 Tax revenue as percentage of GDP
The Figure 3 compares the share of government revenue on GDP of ESCAP region to world
aggregate and other parts of the world. It shows that in recent years the share of tax revenue in
GDP of ESCAP region has increased and reached to about 20% in 2015. The recent trend of
increase is found similar to that of Arica and LAC regions but it is still remained lower than the
world aggregates.
Figure 3. Tax revenue as a percent of GDP, ESCAP and the rest of the world
Data source: ESCAP Online Statistical Database based on data from the IMF, Government Finance Statistics, 24 April 2017.
Among various sub-regions of ESCAP, the Figure 4 shows that the Pacific, and North and Central
Asia region have higher tax share to GDP, bigger than ESCAP aggregates. The other three regions
- East and North-East Asia, South and South-West Asia and South-East Asia have tax share lower
0
5
10
15
20
25
30
Africa Europe Latin Americaand Caribbean
North America ESCAP Agregates WorldAggregates
Tax Revenue as Percent of GDP 2000 2015

4
than the ESCAP aggregates. The tax share of North and Central Asia havs decreased sharply after
2005. The Pacific has also suffered from the falling trend until 2010 and has started increasing
after 2010. The other regions, though the pace of increase is slow, have experienced steady
increases their shares in GDP.
Figure 4. Tax revenue as a percent of GDP, within ESCAP region
Data source: ESCAP Online Statistical Database based on data from the IMF, Government
Finance Statistics, 24 April 2017.
2.4 Income share of bottom 40% population
The Figure 5 below is based on data from Global Databases of Shared Prosperity of World Bank.
The country data are varied from 2007 to 2014 and each symbol inside the figure represents the
percent growth of income per capita of bottom 40% population of a country within the region in
a particular time span. As shown below in the figure the countries - China and Mongolia from
East and North-East Asia have higher growth of income per capita of bottom 40% during 2008 to
2014. In South and South-West Asia Bhutan has the highest (6.5%) and the Iran has the lowest
growth. Among the 19 studied countries in ESCAP, the Kyrgyz Republic has the lowest negative
growth 9-0.7%) and the China has the highest growth (8.9%) in annual income per capita of
bottom 40% population.
Figure 5. Annual growth in mean income per capita of bottom 40% population,
10
15
20
25
30
2000 2005 2010 2015
% o
f G
DP
Tax revenue in ESCAP region
East and North-East Asia South-East Asia
South and South-West Asia North and Central Asia
Pacific ESCAP Agregates

5
within ESCAP sub-regions
Source: Global Database of Shared Prosperity, World Bank.
The Figure 6 shows distribution of income per capita growth of countries located in different
region of the world. Among them the growth in High income countries has a larger variation
ranging from -11.7% of Greece to 4.5% of Malta in between 2007 to 2014. While in comparing
the growth pattern of ESCAP region with the other sub-regions of the world, the income per
capita growth of bottom 40% population in countries of ESCAP region is seen more favorable
than the rest of the world.
Figure 6. Annualized growth in mean income per capita of bottom 40% population in rest of the world
Source: Global Database of Shared Prosperity, World Bank.
2.5 Gini coefficient
Gini coefficients are aggregate inequality measures and can vary between 0 (perfect equality) to
1 (perfect inequality). It could be also expressed in percentage or index form ranging from 0 to
100. This section of the study analyses the distribution of income (or consumption expenditure)
-4.0
-2.0
0.0
2.0
4.0
6.0
8.0
10.0
0 1 2 3 4 5
Gro
wth
rat
e (%
)
East and North-East
Asia
South-East Asia
South and South-
West Asia
North and Central
-12.0
-10.0
-8.0
-6.0
-4.0
-2.0
0.0
2.0
4.0
6.0
8.0
10.0
12.0
0 1 2 3 4 5 6
Gro
wth
rat
e (%
)
Europe and Cenral Asia
Latin America & Carebbean
Sub Sahara Africa
High Income
countries
Middle East & North
Africa

6
in countries and region over a period of 15 years from 2000 to 2014 based on the value of Gini
index obtained from ESCAP Online Statistical Database.
The Figure 7 provides variation of income distribution in various sub-regions of ESCAP and in
ESCAP in aggregates based on available country data of Gini coefficient. Particularly the Figure
7.1 shows the distribution of income in three countries - China, Japan and Mongolia from East
and North-East Asia. It shows that the China has the highest income inequality and almost it
remains same in both years, 42.8 in 2008 and 42.2 in 2012. The other two countries have Gini
values in between 32 to 34. The overall income inequality in the region is in falling trend based
on the Gini values of the three countries.
Figure 7: Gini coefficient within ESCAP sub-regions
Data Source: ESCAP online statistical database.
The Figure 7.2 shows distribution of income of seven countries of South-East Asia. In this region three countries - Malaysia, Philippines, and Thailand until 2007 have higher income inequality

7
over the value of Gini coefficient 40. But, overall trend of inequalities in this region is also seen decreasing based on the seven countries data.
Based on the Gini values of nine countries the South and South-East Asia region shows a constant trend of income distribution (Figure 7.3). The Gini coefficients vary from 46.8 of Bhutan in 2003 - the highest to 29.8 of Pakistan in 2010 - the lowest.
The North and Central Asia region has a mixed pattern of income distribution (Figure 7.4). Among eight countries, the Russian Federation and Georgia have Gini values around 40 and above and are in increasing trend. The other countries - Armenia, Azerbaijan, Kazakhstan, Kyrgyzstan, Tajikistan and Uzbekistan have Gini mostly below 35 and are in decreasing in trend.
The Gini values of only 10 countries for certain years are available from the Pacific region. Based on the available data, the Fiji, Micronesia, Papua New Guinea, Samoa, Solomon Islands and Tuvalu have Gini values higher than 40. The rest of the countries Australia, Kiribati, Tonga and Tuvalu have Gini values ranging from 38 to 34, but there is no clear sign of decreasing trend.
The Figure 7.6 shows income distribution of 37 countries of Asia and the Pacific region in a scatter plot which Gini values are available for the period of 2000 to 2014. The figure shows that the Micronesia F.S. has exceptionally a high Gini value of 63.3 in 2000 and the Azerbaijan has exceptionally lower Gini of around 17 in between 2002 to 2005. Apart from the two exceptional cases, the Gini coefficients of the other countries are varied in between 23 to 45 and from the figure it could be inferred a decreasing trend of income inequality in Asia and Pacific region after the year 2000.
Figure 8. Trends of the market income Gini coefficient, 1990-2014, regions
Source: Do data show divergence? Revisiting global income inequality trends. Working Paper Series
(WP/17/3), Macroeconomic Policy and Financing for Development Division, ESCAP.
The Figure 8 is taken from ESCAP working paper, WP/17/3 by Sudip Ranjan Basu, where the
author uses population-weighted market income Gini coefficients from 1990 to 2014 to show
the trends in income inequalities in different parts of the world based on the regional grouping
of the United Nations regional classification of countries. According to the author the Gini
coefficients of ESCAP member countries are obtained from the Statistics Division of ESCAP and
the findings show "the Gini coefficient of ESCAP rose sharply, by 5.4 per cent, from 1990-1994 to
2010-2014. Although the increase, which was mainly driven by China and India, is the largest
among the five regions, the level of market income inequality in ESCAP was still low compared to
ECLAC, ECE, ECA and ESCWA" (Basu, S.R.WP/17/3, Figure 4, P.16).

8
It could be, however seen in the Figure 8 that the trend line of income inequalities between
2000 and 2014 is almost constant or slightly increasing. The difference in inequality trend in
ESCAP region between current study and the study by Mr. Basu could be because of the
different number of countries are included and the method of calculating aggregates Gini for
different periods. The current study is simply based on the scatter plot diagram of observed
values of Gini coefficients obtained from ESCAP online statistical database.
2.6 Palma ratio
The Palma ratio is a measure of inequality which shows the income share of the richest 10% of the population divided by the share of income received by the poorest 40% people. Simply defined, the higher the value of the Palma ratio, the higher the inequality of income distribution; the lower it is, the more equal the distribution of income.
The Palma ratios in various sub-regions of ESCAP mostly follow similar patterns of income distribution described by Gini coefficients in Figure 7. For example, in East and North-East Asia the China has higher values for both Gini and Palma ratios. The Palma ratio of China in 2012 is 2.1 indicates that the richest 10% holds about 2.1 times more income than the bottom 40% of the population. Likewise, in South-East Asia the Malaysia (2.6 in 2004, 2007 and 2009), Philippines (2.6 in 2000) and Thailand (2.1 in 2000) have higher values of Palma ratios. However, the Palma ratios of Philippines and Thailand are in decreasing trend.
The other sub-regions also follow the similar trends of income distribution as found in distribution of Gini coefficients in Figures 7.3, 7.4 & 7.5. The Figure 9.6 shows the distribution of Palma ratios of 36 countries in a single scatter plot. It shows that the Philippines in 2000, Bhutan in 2003, Malaysia in 2004 to 2009, and Solomon Islands in 2005 have higher values of Palma ratio above 2.5. On the other hand, the Azerbaijan has exceptionally low ratios of 0.6 from 2002 to 2005. Besides those cases, normally the Palma ratios in 35 member countries are distributed in between 1 to 2.3 points and overall trend of the income ratios between top 10% and bottom 40% population seems either constant or in decreasing trend.
Figure 9. Palma ratio among countries within ESCAP region

9
Data Source: ESCAP online statistical database. 2.7 Income share of Top and Bottom 10%
Table 2 presents ratio of income share of top 10% to bottom 10% population in 36 ESCAP
member countries. Among them the Malaysia has the largest income share between the top and
bottom deciles of above 19 points followed by Georgia with about 17 in 2009, 2010 and 2011,
China 15.7 in 2012. However, the ratios of income in those countries are gradually decreasing in
recent years. The data show that most of the countries in ESCAP region still have more than 10
folds differences in income between the top and bottom 10% population. In contrast, the other
member of Central Asian countries, specifically Azerbaijan, Kazakhstan and Kyrgyz Republic have
comparatively lower income ratios of about 5 to 7 points.

10
Table 2. Ratio of income share of Top 10% and Bottom 10% population
Source: Database, World Development Indicators, World Bank.
2000 2001 2002 2003 2004 2005 2006 2007 2008 2009 2010 2011 2012 2013 2014 2015
East and North-East Asia
China 15.9 15.7 -1.3 2008, 2012
Korea, Rep. 8.9 9.4 9.3 9.2 3.0 2006, 2012
Japan 9.2
Mongolia 8.2 9.3 8.0 8.3 8.2 7.7 -5.8 2002, 2014
South-East Asia
Indonesia 10.3
Lao PDR 8.9 9.3 4.9 2007, 2012
Malaysia 19.3 19.3 19.2 -0.3 2004, 2009
Myanmar
Philippines 13.1 12.5 13.3 12.6 13.16 11.6 -11.6 2000, 2015
Thailand 13.0 12.8 13.5 13 11.4 11.5 11.4 11.4 10.0 10.9 10.1 -22.3 2000, 2013
Timor-Leste 9.4 6.4
Vietnam 9.3 9.9 9.6 9.3 12.4 9.9 9.9 6.2 2002, 2014
South and South-West Asia
Bangladesh 7.5 7.4 7.1 -6.1 2000, 2009
Bhutan 17.0 10.9 11.0 -35.7 2003, 2012
India 8.3
Maldives 12.9 12.0 -7.2 2002, 2009
Nepal 13.7 7.5 -44.8 2003, 2010
Pakistan 6.4 7.1 6.1 6.5 1.7 2001, 2013
Sri Lanka 11.4 11.3 10.7 -6.2 2002, 2012
North and Central Asia
Armenia 9.1 8.8 7.6 10.2 9.3 7.6 6.6 6.7 6.3 6.9 7.1 6.7 7.3 7.3 7.9 -13.6 2001, 2015
Azerbaijan 9.5 3.0 3.3 2.8 2.9
Georgia 16.8 15.0 15.0 14.7 15.6 15.1 14.3 15.5 15.3 16.6 17.4 17.2 16.3 14.2 14.9 12.6 -25.4 2000, 2015
Kazakhstan 9.9 8.7 8.2 7.3 6.5 6.7 6.0 6.1 6.1 5.9 5.5 5.5 5.1 5.2 5.2 -47.6 2001, 2015
Kyrgyz Republic 6.7 6.5 6.7 6.0 8.5 7.5 9.8 8.5 7.2 6.3 7.0 5.6 5.8 6.0 5.2 6.0 -9.8 2000, 2015
Russian Federation11.0 12.2 10.8 12.6 13.3 13.7 13.6 14.3 13.5 12.0 12.2 12.0 12.9 12.5 11.8 10.6 -3.9 2000, 2015
Tajikistan 7.8 8.3 9.7 7.1 6.8 6.7 6.9 8.8 13.4 2003, 2015
Pacific
Australia 9.3 9.3 9.8 9.5 1.8 2001, 2010
Fiji 11.0 12.2 9.2 -16.2 2002, 2013
Kiribati 11.7
Micronesia, Fed. Sts. 14.8 15.6 5.8 2005, 2013
Papua New Guinea 16.3
Samoa 12.6
Solomon Islands 18.8 10.5 -44.5 2005, 2013
Tonga 11.8 10.7 -9.2 2001, 2009
Tuvalu 11.4
Vanuatu 10.8
Ratio of Income Share of Top 10%/Bottom 10%
Survey YearCountry/RegionBaseline and
latest survey
year
% change in ratio
of income share
of T10/B10 in
baseline & latest
survey year

11
3. Social Inequality
3.1 Health care
i. Access to professional help during childbirth
The Figure 10 and 11 present access to professional help during childbirth, i.e. birth attended by
skilled health personnel in different sub-regions of ESCAP and in rest of the world. The Figure 10
shows that within ESCAP the East and North-East Asia, North and Central Asia and the Pacific
have almost 100% of birth attended by skilled health personnel. But the access to professional
help during childbirth in South and South-West Asia was miserably low until 2006, far below
than the ESCAP aggregates. After 2006 the birth attended in the South and South-West Asia was
started to increase and reached to 76.4% of total live births in 2014. It can be seen that the
ESCAP aggregates follows similar trend of birth attended as of South and South-West Asia, i.e.
the ESCAP aggregates could have guided by the higher birth cases in the South and South-West
Asia region, especially in India, Bangladesh and Pakistan - three of the most populated countries
in the world. The figure also shows that the ESCAP aggregates of birth attended was similar to
that of world aggregate until 2006, but it surpasses the world aggregates after 2006 and reached
86.3% in 2014.
Since an aggregated value of birth attended in South-East Asia is not directly available from the
ESCAP statistical database, the Figure 11 presents a scatter plot of birth attended in ten
countries of South-East Asia sub-region. Among the 10 countries, the Brunei Darussalam,
Malaysia, Singapore and Thailand have the birth attended rates nearly 100%. Similarly, the
Philippines, Indonesia, Myanmar, Cambodia (after 2010) have the rates middle in rank and are
continually increasing. On the opposite, the Lao PDR, Timor-Leste have the rates below 40% and
have been increasing very slowly.
Figure 10. Birth attended by skilled health personnel, ESCAP and rest of the world
Source: ESCAP online statistical database.
40
50
60
70
80
90
100
110
2000 2001 2002 2003 2004 2005 2006 2007 2008 2009 2010 2011 2012 2013 2014
% o
f liv
ebir
ths
East and North-East Asia South and South-West Asia North and Central Asia
Pacific ESCAP Aggregates World Aggregates
Latin America and Carib.

12
Figure 11. Birth attended by skilled health personnel, South-East Asia
Source: ESCAP online statistical database.
ii. Access to modern contraception for women
The Figure 12 below depicts the percentage of women ages 15-49 years using modern methods
of contraceptives. Since the aggregated values for only two sub-regions of ESCAP are available,
the figure does not provide a complete scenario of access to modern contraception for women
in ESCAP member countries. However, based on the available data the Figure shows the highest
rate of modern methods of contraceptive uses by women (74.4%) in the Asia and Pacific region
in 2000. On the other hand, the South Asia region has a moderate and an increasing rate of
contraceptive uses, i.e. 40% in 2000 and 46% in 2012.
A close observation of country data shows that the East Asian countries - China, Thailand, Hong
Kong SAR, China and Korea Republic have the contraceptive uses rate in female more than 70%.
In fact, all countries (China, Korea Rep, Korea DPR, Japan, Hong Kong SAR, China, Macao SAR,
China and Mongolia) in North and North-East Asia have the contraceptive uses rates in women
above 44%. In opposite, the Timor-Leste from South-East Asia, Afghanistan and Pakistan from
South and South-West Asia, Armenia and Azerbaijan from North and Central Asia and many
countries from Pacific region have the contraceptive uses rates in women less than 30%2.
2 Country data are provided in the related Excel sheet.
0
20
40
60
80
100
120
1996 2001 2006 2011 2016
% o
f liv
eb
irth
s South-East Asia
Brunei Darussalam Cambodia Indonesia Lao PDRMalaysia Myanmar Philippines SingaporeThailand Timor-Leste

13
Figure 12. Contraceptive prevalence, modern methods (% of women ages 15-49)
Source: Health Nutrition and Population Statistics, Data bank, World Bank
3.2 Education achievements
The completion rate of primary education is defined as total number of new entrants in the last
grade of primary education, regardless of age, expressed as percentage of the total population
of the theoretical entrance age to the last grade of primary. The ratio can exceed 100% due to
over-aged and under-aged children who enter primary school late/early and/or repeat grades.
The Figure 13 shows trends of primary education completion rates across different regions of
the world. The country grouping is based on World Bank classification of countries in different
regions and income level. The East Asia and Pacific comprises 37 countries and the South Asia is
a group of 8 countries of SAARC region. The two regions consist 45 countries out of 58 member
countries of ESCAP. Additional nine countries of Central Asia (Armenia, Azerbaijan, Georgia,
Kazakhstan, Kyrgyzstan, Russian Fed., Tajikistan, Turkmenistan and Uzbekistan) are included in
the North and Central Asia region. Since a separate grouping for ESCAP is not included in World
Bank country groupings, the changes in education achievements in ESCAP region are reflected
mainly through the two sub-groupings - East Asia and Pacific, and South Asia.
As shown in the figure the primary completion rate of East Asia and Pacific is above the world
aggregates and is already surpassed the saturation ratio 100% in 2009. Similarly the primary
completion rate of South Asia is also in increasing trend and reached to the level of World
aggregates (91.3%) in 2014. In South Asia all countries except Pakistan (72% in 2014) have the
primary completion rates around 100%. As per the trend line of Europe and Central Asia, all nine
Central Asian countries have 100% primary completion rates.
0
10
20
30
40
50
60
70
80
2000 2012
% o
f w
om
en o
f ag
e 1
5-4
9
Contraceptive prevalence, modern methods
East Asia & Pacific Middle East & North Africa
South Asia World
Sub-Saharan Africa North America

14
Figure 13. Completion rate of primary education
Source: Education Statistics - All Indicators, WB
Similarly to primary education completion rates, the completion rate of lower secondary
education of Asia and Pacific (99.1% in 2014) is on the top of all regions and well above the
world aggregates (76.3% in 2014). The completion rate of South Asia is also increasing in trend
and reached to be the level of world aggregates in 2014.
Figure 14. Completion rate of Lower secondary education
Source: Education Statistics - All Indicators, WB
3.3 Child nutrition
The three important measures of child malnutrition are stunting, wasting and overweight among
children under five years old. The figures below use the ESCAP online database to show the
situation of child malnutrition in different sub-regions of ESCAP. The stunting is related to the
inappropriate height-for-age, wasting is insufficient weight-for-height and overweight is
50
60
70
80
90
100
110
2000 2001 2002 2003 2004 2005 2006 2007 2008 2009 2010 2011 2012 2013 2014
Co
mp
leti
on
rat
e (%
) Primary eduction completion rate
East Asia & Pacific South Asia Sub-Saharan Africa
World Middle East & North Africa Europe & Central Asia
20
30
40
50
60
70
80
90
100
2000 2001 2002 2003 2004 2005 2006 2007 2008 2009 2010 2011 2012 2013 2014
Co
mp
leti
on
rat
e (%
)
Lower secondary completion rate
East Asia & Pacific South Asia Sub-Saharan Africa
World Middle East & North Africa Europe & Central Asia

15
excessive weight-for-height than the World Health Organization (WHO) Child Growth Standards
among children under 5 years of age.
i. Stunting
The Figure 15 shows that the stunting in Asia and in the world is decreasing rapidly with time.
Although decreasing, the South and South-West Asia has the highest stunting among ESCAP sub-
regions. About 38% children under 5 years age are facing stunting is the region in 2015. In
contrast, the East and North-East Asia has the lowest stunting (9% in 2010) among the ESCAP
sub-regions.
Figure 15. Prevalence of stunting under 5 years old.
Source: ESCAP online statistical database.
ii. Wasting
The Figure 16 shows the wasting in South and South-West Asia is almost constant and it is
around 19% of children under 5 years age. Similar to the stunting the East and North-East Asia
has the lowest wasting percentage, about 2.3% in 2010.
Figure 16. Prevalence of wasting under 5 years old.
Source: ESCAP online statistical database.
0
10
20
30
40
50
60
70
19
90
19
91
19
92
19
93
19
94
19
95
19
96
19
97
19
98
19
99
20
00
20
01
20
02
20
03
20
04
20
05
20
06
20
07
20
08
20
09
20
10
20
11
20
12
20
13
20
14
20
15
20
16
% o
f ch
ildre
n
Stunting
East and North-East Asia South-East Asia South and South-West Asia
ESCAP Aggregates World Aggregates
0
5
10
15
20
25
19
90
19
91
19
92
19
93
19
94
19
95
19
96
19
97
19
98
19
99
20
00
20
01
20
02
20
03
20
04
20
05
20
06
20
07
20
08
20
09
20
10
20
11
20
12
20
13
20
14
20
15
20
16
% o
f ch
ildre
n
Wasting
East and North-East Asia South-East Asia South and South-West Asia
ESCAP Aggregates World Aggregates

16
iii. Overweight
The Figure 17 reveals that the overweight problem in children under 5 years old is remained
higher in East and North-East Asia. It was 13.6% in 1995, but gradually decreased and stabilized
at around 6% after 2006. The sub-region, South and South-West Asia also follows the same
pattern as of East and North-East Asia, but the problem is less severe (1.7% in 2006) and even
lower than the world aggregates (5.9% in 2015).
Figure 17. Prevalence of overweight in children under 5 years old.
Source: ESCAP online statistical database.
3.4 Labour force participation rates
The labour force participation rate expresses as the proportion of the population aged 15 and
above that engages actively in the labour market, either by working or looking for work,
disaggregated by sex. The working age population normally refers to the people aged 15-64
years, but it may vary country to country.
The Figure 18 presents the labour force participation rate of male as % of males aged 15 and
above in different sub-regions of ESCAP. As shown in the figure, the aggregates labour force
participation rate of ESCAP is higher than the world aggregates and reached at around 78% in
2016. Among ESCAP sub-regions the South-East Asia has the highest participation rate of about
82% in 2016 followed by South and South-West Asia, 79% in 2016. The other three sub-regions -
East and North-East Asia, North and Central Asia and the Pacific have male participation rates
below ESCAP aggregates. It is worth noticing that all four sub-regions of ESCAP except North and
Central Asia have decreasing participation rates of males in labour force.
0
2
4
6
8
10
12
14
19
90
19
91
19
92
19
93
19
94
19
95
19
96
19
97
19
98
19
99
20
00
20
01
20
02
20
03
20
04
20
05
20
06
20
07
20
08
20
09
20
10
20
11
20
12
20
13
20
14
20
15
20
16
% o
f ch
ildre
n
Overweight
East and North-East Asia South-East Asia
South and South-West Asia World Aggregates

17
Figure 18. Labour force participation rate, male
Source: ESCAP online statistical database.
The Figure 19 shows the labour force participation rate of female in different sub-regions of
ESCAP. In opposite to male participation, the South and South-West Asia has lowest rate of
female participation in labour force and it is also diminishing in recent year (28.5% in 2016). It is
interesting to note that the ESCAP aggregates of female participation rate are almost similar to
world aggregates of around 47-49% in recent years. The North and North-East has the highest
female participation in labour force (61.2% in 2016) among sub-regions of ESCAP followed by
Pacific (59.6% in 2016), South-East Asia (58.8% in 2016) and North and Central Asia (56% in
2016). Except South and South-West Asia, all other four sub-regions have labour force
participation rates of female higher than ESCAP and World aggregates.
Figure 19. Labour force participation rate, female
Source: ESCAP online statistical database.
65
70
75
80
85
2000 2001 2002 2003 2004 2005 2006 2007 2008 2009 2010 2011 2012 2013 2014 2015 2016
% o
f m
ale
Male
East and North-East Asia South-East Asia South and South-West Asia
North and Central Asia Pacific ESCAP Aggregates
World Aggregates
25
30
35
40
45
50
55
60
65
70
2000 2001 2002 2003 2004 2005 2006 2007 2008 2009 2010 2011 2012 2013 2014 2015 2016
% o
f fe
mal
e
Female
East and North-East Asia South-East Asia
South and South-West Asia North and Central Asia
Pacific ESCAP Aggregates
World Aggregates

18
3.5 Vulnerable employment
Vulnerable employment is expressed as contributing family workers and own-account workers
as a percentage of total employment. This section uses the data from Database, Gender
Statistics of World Bank. The regional abbreviations refer to the various sub-regions according to
the World Bank classification of countries excluding high income countries. That is, the EAP (East
Asia and Pacific), ECA (Europe and Central Asia), LAC (Latin America and Caribbean), MNA
(Middle East and North Africa), SSA (Sub Saharan Africa), SAS (South Asia) and WLD (World
aggregates).
The Figure 20 shows that the two sub-regions of Asia - East Asia and Pacific (EAP) and South Asia
(SAS) have higher percentages of female in vulnerable employment. It is noticed that the South
Asia (SA) has the highest percentage of vulnerable employment of female than other sub-
regions of Asia and the world. The percentage is though decreasing; still about 79% of females
are in vulnerable employment. Likewise the East Asia and Pacific still has 42.1% female in 2015
as vulnerably employed, which is about a percentage point above the world aggregates.
Figure 20. Vulnerable employment, female (% of female employment)
Source: Gender Statistics, WB.
The Figure 21 presents the male percentage in vulnerable employment and the trend lines show
similar patterns of vulnerable employment of males as females in Asian sub-regions. Among
various sub-regions of developing countries, the South Asia sub-region has the largest
percentage of males (72.6% in 2015) engaged in vulnerable employment. Likewise, the East Asia
and Pacific sub-region is found in third higher in row and about 35.4% of males are employed in
vulnerable employments. Although, the patterns of vulnerable employments of males and
females in the mentioned two sub-regions are similar and decreasing, comparatively less
percentage of males are vulnerably employed than females.
10
20
30
40
50
60
70
80
90
100
2000 2001 2002 2003 2004 2005 2006 2007 2008 2009 2010 2011 2012 2013 2014 2015
%
Female
EAP ECA LAC MNA SSA SAS WLD

19
Figure 21. Vulnerable employment, male (% of male employment)
Source: Gender Statistics, WB.
3.6 Government expenditure
i. Government expenditure on health
This section uses country data from Health Nutrition and Population Statistics of the World Bank
on government expenditure on health as percent of GDP. The sub-regional and ESCAP
aggregates are calculated by using country GDP of corresponding year as weight. The Figure 22
shows that the ESCAP aggregate of government expenditure on health is about 4% of the GDP
throughout the period of 2000 to 2014. The Pacific has the highest percentage of GDP on health
expenditure which has been gradually increasing and reached to 6.6% of GDP in 2014. The East
and North-East Asia spends about 5% of GDP on health in aggregates. The sub-regions - North
and Central Asia, South and South-West Asia and the South-East Asia have expenditure share in
GDP below the ESCAP aggregates.
Figure 22. Government expenditure on health as percent of GDP
Source: Health Nutrition and Population Statistics, Data bank, World Bank.
10
20
30
40
50
60
70
80
90
2000 2001 2002 2003 2004 2005 2006 2007 2008 2009 2010 2011 2012 2013 2014 2015
%
Male
EAP ECA LAC MNA SSA SAS WLD
0.0
1.0
2.0
3.0
4.0
5.0
6.0
7.0
2000 2001 2002 2003 2004 2005 2006 2007 2008 2009 2010 2011 2012 2013 2014
% o
f G
DP
Health expenditure, public (% of GDP)
East & North-East Asia South-East Asia South & South-West Asia
North and Central Asia Pacific ESCAP aggregates

20
ii. Government expenditure on education
The country data on government expenditure to education as percent of GDP are taken from
Education Statistics of the World Bank. The sub-regional and ESCAP aggregates are calculated by
using country GDP of corresponding year as weight. The Figure 23 shows irregular patterns of
expenditure on education in each sub-region. However, a close observation of the country data
and regional aggregates show that the ESCAP aggregate on education expenditure is remained
about 3% of GDP. The expenditure on education of East and North-East Asia, and South-East Asia
are found similar or slightly higher than ESCAP aggregate. But, the sub-regional aggregates of
South and South-West Asia (about 2.3% of GDP), and North and Central Asia (about 2% of GDP)
are seen lower than the ESCAP aggregate. The Pacific aggregate, especially from 2005 to 2014
has remained as 5% of GDP, a well above the ESCAP aggregate.
Figure 23. Government expenditure on education as percent of GDP
Source: Education Statistics - All Indicators, WB.
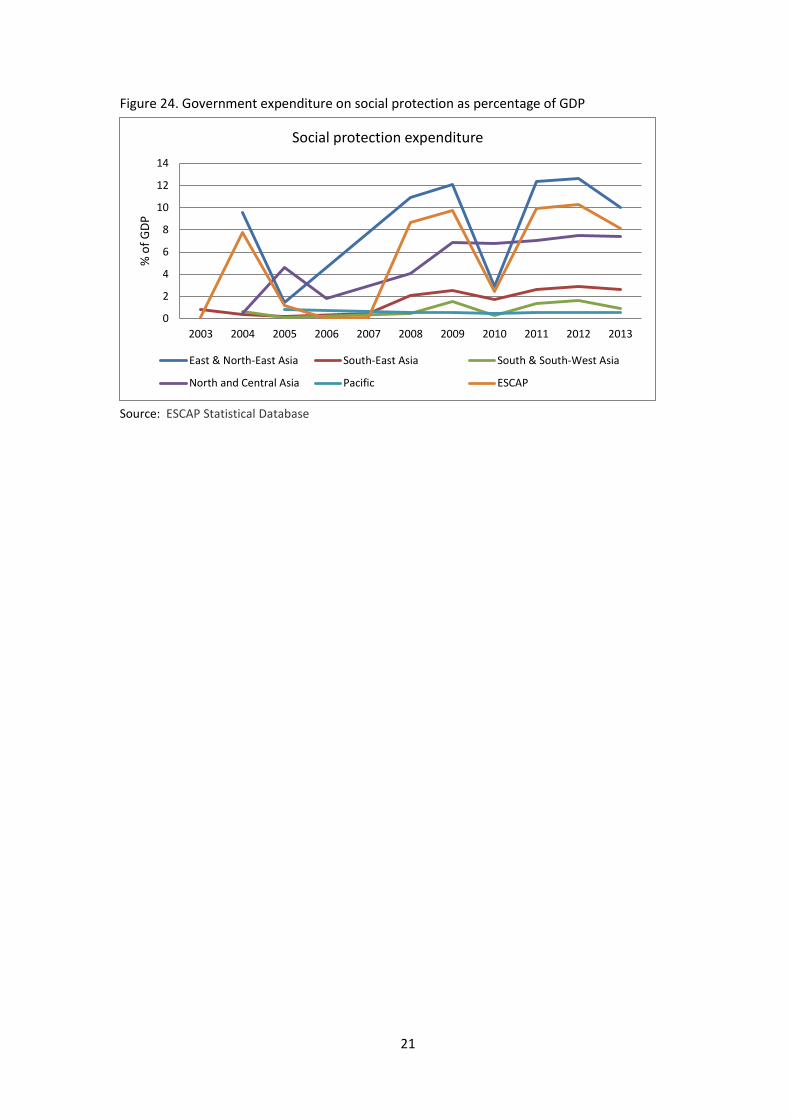
iii. Government expenditure on social protection
The data on government expenditure on social protection programs is taken from ESCAP online
statistical database which measures social protection programs on social insurance (SI), social
assistance (SA) and labour market programs (LMP). The sub-regional and ESCAP aggregates are
calculated by using country GDP of corresponding year as weight. The Figure 24 shows that the
East and North-East Asia has the highest expenditure of about 12% of GDP on social protection
and the Pacific sub-region has the lowest expenditure below 1% of GDP. The South and South-
West sub-region has the expenditure of about 1.5% and the South-East Asia has just above 2.5%
of GDP on social protection which are far below than the ESCAP aggregates of about 10% of GDP
except in 2010. In contrast to other sub-regions, the North and Central Asia has continuously
increasing expenditure on social protection of about 7% of GDP after 2009.
0.0
1.0
2.0
3.0
4.0
5.0
6.0
2000 2001 2002 2003 2004 2005 2006 2007 2008 2009 2010 2011 2012 2013 2014 2015
% o
f G
DP
Government expenditure on education
East & North-East Asia South-East AsiaSouth & South-West Asia North and Central AsiaPacific ESCAP aggregates
21
Figure 24. Government expenditure on social protection as percentage of GDP
Source: ESCAP Statistical Database
0
2
4
6
8
10
12
14
2003 2004 2005 2006 2007 2008 2009 2010 2011 2012 2013
% o
f G
DP
Social protection expenditure
East & North-East Asia South-East Asia South & South-West Asia
North and Central Asia Pacific ESCAP

22
4. Environmental inequality
4.1 Access to basic water services ("improved" in MDGs)
The data on access to basic water services is taken from the database - Health Nutrition and
Population Statistics of the World Bank. The access to basic water services is defined as the
percentage of people using at least basic water services, which encompasses both people using
basic water services as well as those using safely managed water services. The Figure 25 shows
both sub-regions from Asia - East Asia and Pacific and South Asia have increasing trends in access
to basic water services. In 2015 about 94% of population in East Asia and Pacific have access to
basic water services. Likewise, the percentage of people using basic water services in South Asia
has increased steady and equalizes with world aggregates from 2005. Recently about 88% of
people in South Asia have easy access to basic water, which is far higher than the percentage of
people having such facility in Sub-Saharan Arica (57.5% in 2015).
Figure 25. Access to basic water services
Source: Health Nutrition and Population Statistics, WB (taken from WHO/UNICEF Joint Monitoring
Programme (JMP) for Water Supply, Sanitation and Hygiene (washdata.org)).
4.2 Access to basic sanitation services ("improved" in MDGs)
Access to basic sanitation services encompasses percentage of population using basic sanitation
services as well as those using safely managed sanitation services. The Figure 26 below shows
the world aggregate for access to basic sanitation services is 68% in 2015. The percentage of
people using basic sanitation in East Asia and Pacific is 77% in 2015 which is 9 percentage points
higher than the world aggregates. But, there are only 46.5% of people in South Asia are using the
basic sanitation facilities in 2015, which is 21.5 percentage points lower than the world
aggregate.
75
80
85
90
95
100
2000 2001 2002 2003 2004 2005 2006 2007 2008 2009 2010 2011 2012 2013 2014 2015
% o
f p
op
ula
tio
n
Access to basic water services
East Asia & Pacific Latin America & CaribbeanMiddle East & North Africa Pacific island small statesSouth Asia World

23
Figure 26. Access to basic sanitation services
Source: Health Nutrition and Population Statistics, WB (taken from WHO/UNICEF Joint Monitoring
Programme (JMP) for Water Supply, Sanitation and Hygiene (washdata.org)).
4.3 Access to electricity
Data on access to electricity are obtained from ESCAP online statistical database. The Figure 27
below compares the percentage of population having the electricity facilities among different
sub-regions of ESCAP and with world aggregates. The Figure shows that about 90% of population
in 2015 in ESCAP region have access to electricity facility, which is about 5 percentage points
higher than the world aggregate (85.4% in 2015) for such facility. Among ESCAP sub-regions the
people in North and Central Asia have 100% access to electricity from begging of the study year
in past. The facility is access to almost all population in recent years in East and North-East Asia
too. The South-East Asia is also mostly equalizes with ESCAP aggregates. More than 80% of the
population in the Pacific has been enjoying the facility. And, the South and South-East Asia which
had initially less percentage of population using electricity, is gradually catching up with the
World and ESCAP aggregates.
10
20
30
40
50
60
70
80
90
100
2000 2001 2002 2003 2004 2005 2006 2007 2008 2009 2010 2011 2012 2013 2014 2015
% o
f p
op
ula
tio
n
People using basic sanitation services
East Asia & Pacific Latin America & CaribbeanMiddle East & North Africa Pacific island small statesSouth Asia Sub-Saharan AfricaWorld

24
Figure 27. Access to electricity
Source: ESCAP Online Statistical Database based on data from the SE4ALL (Sustainable Energy for All),
3 November 2017.
4.4 Access to clean fuels and technology
The access to clean fuels and technology refers to the percentage of the population using clean
cooking fuels and technologies for cooking. The Figure 28 compares the facilities among ESCAP
sub-regions and with other parts of the world. The Figure shows 100% population in North
America use clean fuels and technologies for cooking. The ESCAP aggregate of the facility is 51%
in recent year, 2014. Among ESCAP sub-regions the North and Central Asia has the highest
percentage of population (95.6% in 2014) and the lowest in South and South-West Asia (35.4% in
2014) using the facility, clean fuels and technologies for every-day cooking.
Figure 28. Access to clean fuels and Technology
Source: ESCAP Online Statistical Database based on data from the GTF, 10 April 2017.
50
60
70
80
90
100
110
2000 2001 2002 2003 2004 2005 2006 2007 2008 2009 2010 2011 2012 2013 2014
% o
f p
op
ula
tio
n
Access to electricity
East and North-East Asia South-East AsiaSouth and South-West Asia North and Central AsiaPacific ESCAP AggregatesWorld Aggregates
10
20
30
40
50
60
70
80
90
100
110
2000 2001 2002 2003 2004 2005 2006 2007 2008 2009 2010 2011 2012 2013 2014
% o
f p
op
ula
tio
n
Reliance on clean fuel and Technology
East and North-East Asia South-East Asia South and South-West Asia
North and Central Asia Pacific ESCAP Aggregates
Latin America and Carib. North America