infant and child mortality rates for indigenous
TRANSCRIPT

A Linked Perinatal, Birth Death Data set was created by linking jurisdictional perinatal and birth registration records to the National Death Index to identify Indigenous under-5 deaths occurring in specified birth cohorts within jurisdictional Perinatal Data Collections. This report examines the feasibility of using this linked data collection for analysis and explores the associated methodology, data quality issues and analysis of risk factors associated with adverse pregnancy and birth outcomes.
Infant and child mortality rates for Indigenous Australians using linked and unlinked data
Linked Perinatal, Birth, Death Data set
aihw.gov.au
Stronger evidence, better decisions, improved health and welfare
Stronger evidence, better decisions, improved health and welfare


Australian Institute of Health and Welfare Canberra
Cat. no. IHW 240
Infant and child mortality rates for Indigenous Australians using linked
and unlinked data
Linked Perinatal, Birth, Death Data set

The Australian Institute of Health and Welfare is a major national agency whose purpose is to create authoritative and accessible information and statistics that inform decisions and improve the health and welfare of all Australians.
© Australian Institute of Health and Welfare 2021
This product, excluding the AIHW logo, Commonwealth Coat of Arms and any material owned by a third party or protected by a trademark, has been released under a Creative Commons BY 3.0 (CC-BY 3.0) licence. Excluded material owned by third parties may include, for example, design and layout, images obtained under licence from third parties and signatures. We have made all reasonable efforts to identify and label material owned by third parties.
You may distribute, remix and build upon this work. However, you must attribute the AIHW as the copyright holder of the work in compliance with our attribution policy available at <www.aihw.gov.au/copyright/>. The full terms and conditions of this licence are available at <http://creativecommons.org/licenses/by/3.0/au/>.
A complete list of the Institute’s publications is available from the Institute’s website <www.aihw.gov.au>. ISBN 978-1-76054-854-4 (PDF) ISBN 978-1-76054-853-7 (Print)
Suggested citation Australian Institute of Health and Welfare 2021. Infant and child mortality rates for Indigenous Australians using linked and unlinked data: Linked Perinatal, Birth, Death Data set. Cat. no. IHW 240. Canberra: AIHW.
Australian Institute of Health and Welfare Board Chair Acting Chief Executive Officer Mrs Louise Markus Mr Rob Heferen
Any enquiries relating to copyright or comments on this publication should be directed to: Australian Institute of Health and Welfare GPO Box 570 Canberra ACT 2601 Tel: (02) 6244 1000 Email: [email protected]
Published by the Australian Institute of Health and Welfare
This publication is printed in accordance with ISO 14001 (Environmental Management Systems) and ISO 9001 (Quality Management Systems). The paper is sourced from sustainably managed certified forests.
Please note that there is the potential for minor revisions of data in this report. Please check the online version at <www.aihw.gov.au> for any amendments.

Infant and child mortality rates for Indigenous Australians using linked and unlinked data iii
Contents Summary ............................................................................................................................... v
Modelling risk factors for adverse pregnancy and birth outcomes .............................. v
Feasibility of linking perinatal and birth records to the NDI ......................................... v
Comparing cross-sectional and cohort-specific under-5 deaths ................................. v
Modelling risk factors for adverse pregnancy and birth outcomes ............................. vi
Modelling the risk factors associated with cause of death ......................................... vi
Improvements in data quality .................................................................................... vi
1 Linked Perinatal, Birth, Death Data set ........................................................................ 1
Objective of the Dataset ............................................................................................ 1
Purpose of this report ................................................................................................ 1
Structure of this report ..................................................................................................... 2
2 Data and methods ......................................................................................................... 3
Sources of data ............................................................................................................... 3
Jurisdictional Perinatal Data Collections .................................................................... 3
Jurisdictional birth registrations .................................................................................. 6
National Death Index and National Mortality Database .............................................. 7
Enhanced Mortality Database .................................................................................... 7
Methods .......................................................................................................................... 8
Justification for 2-step process .................................................................................. 8
Ethics approval .......................................................................................................... 8
Data custodian approval ............................................................................................ 8
Protection of data privacy .......................................................................................... 8
Protection of data confidentiality ................................................................................ 9
3 Linkage of perinatal and birth records ....................................................................... 10
Overview ....................................................................................................................... 10
Data linkage process ..................................................................................................... 11
Quality of linkage variables ...................................................................................... 12
Linkage rate: perinatal to birth registration records .................................................. 15
Quality of linkage of perinatal to birth registration records ........................................ 16
4 Linkage of perinatal to death records ........................................................................ 18
Overview ....................................................................................................................... 18
Quality of data linkage ................................................................................................... 19
Consistency between cohort-specific and cross-sectional deaths ............................ 19
iv Infant and child mortality rates for Indigenous Australians using linked and unlinked data
Age at death .................................................................................................................. 19
All under–5 deaths ................................................................................................... 19
Indigenous under-5 deaths ...................................................................................... 21
Birth cohorts .................................................................................................................. 22
All under-5 deaths ................................................................................................... 22
Indigenous under-5 deaths ...................................................................................... 24
5 Indigenous identification ............................................................................................ 28
Sources of information on Indigenous identification ....................................................... 28
6 Cause of death ............................................................................................................. 35
Records with missing cause of death information .......................................................... 35
Age at death ............................................................................................................ 37
7 Pregnancy and birth outcomes .................................................................................. 40
Data availability ............................................................................................................. 41
8 Cohort-specific under-5 mortality .............................................................................. 46
Trends in cohort-specific under-5 mortality rates ........................................................... 46
Trends for Australia ................................................................................................. 47
Trends for each jurisdiction ...................................................................................... 48
Trends for each jurisdiction ...................................................................................... 53
Conclusion .................................................................................................................... 55
Appendix A: Estimating cohort-specific deaths with or without data linkage ............ 56
Estimating cohort-specific child mortality using data linkage .......................................... 56
Estimating cohort-specific child mortality without data linkage ....................................... 57
Appendix B: Cross-sectional and cohort-specific under-5 mortality rates ................ 58
Current approach to estimating the under-5 mortality rate ............................................. 58
Issues with cross-sectional estimates of the infant mortality rate ............................. 58
References .......................................................................................................................... 61
Acknowledgments .............................................................................................................. 62
Abbreviations ..................................................................................................................... 62
Symbols .............................................................................................................................. 62
List of tables ....................................................................................................................... 63
List of figures ..................................................................................................................... 64

Infant and child mortality rates for Indigenous Australians using linked and unlinked data v
Summary Traditionally, child mortality rates are estimated using cross-sectional or point in time analysis. In this method, deaths (numerator) and population at risk (denominator) are derived from two different data sources resulting in lack of comparability between the two sources in terms of Indigenous identification, and inconsistency between the numerator and the population at risk.
In the cohort-specific method, birth cohorts are followed over time and child mortality can be estimated for this cohort. This method provides a more accurate measure of infant and child mortality because of the consistency in Indigenous identification of both deaths (numerator) and population at risk (denominator) as both these data are derived from the same data collection—the Perinatal Data Collection (PDC).
Modelling risk factors for adverse pregnancy and birth outcomes This report set out to examine the following:
• the feasibility of using linked perinatal, birth and national death data to estimate cohort specific deaths rates and how these compare with cross-sectional or point in time death rates of infant and under-5 child mortality
• the methodological and data quality issues associated with linking perinatal records to birth registration and death registration records to track deaths and the cause of death of Indigenous infants and children aged less than 5 years to their originating birth cohorts
• data quality issues relating to modelling the risk factors associated with adverse pregnancy and birth outcomes among Indigenous and non-Indigenous women.
To undertake these analyses, a Linked Perinatal, Birth Death Data set was created by linking jurisdictional perinatal and birth registration records to the National Death Index (NDI) to identify Indigenous under-5 deaths occurring in specified birth cohorts within jurisdictional Perinatal Data Collections (PDCs).
The results from these examinations are described in this Summary.
Feasibility of linking perinatal and birth records to the NDI The analysis showed that it is feasible to link jurisdictional perinatal and birth registration records to the National Death Index (NDI) to identify Indigenous under-5 deaths occurring in specified birth cohorts within jurisdictional Perinatal Data Collections (PDCs).
The quality of this linkage depends on the quality of linkage variables on the three named data sets. The quality of these variables has been improving over time.
Comparing cross-sectional and cohort-specific under-5 deaths • The National Mortality Database (NMD) contains records of all deaths that occurred in
Australia and were registered in Australia. Earlier evidence shows that the NMD underestimates the number of under-5 deaths of Indigenous children as it has not been enhanced for Indigenous misclassification.
• Cross-sectional or ‘point-in-time’ deaths are derived from the NMD. The NMD was not linked to the jurisdictional PDCs.

vi Infant and child mortality rates for Indigenous Australians using linked and unlinked data
• Cohort specific analysis of under-5 mortality using the Linked Perinatal, Birth, Death Dataset was able to identify about 90% of all cross-sectional under-5 deaths and about 84% of cross-sectional under-5 deaths of Indigenous children nationally.
• Excluding Tasmania and the Australian Capital Territory (both having extremely small number of deaths and small Indigenous populations), the percentage of cross-sectional Indigenous under-5 deaths on the NMD that was identified in the linked perinatal dataset ranged between 65% in Queensland and 97% in Western Australia.
• The lower percentage of Indigenous under-5 deaths identified in the linked perinatal data set (84%) compared to the number of Indigenous under-5 deaths estimated from cross-sectional data is due to known factors. – the change from a paper-based to an electronic platform for the recording and
collating of perinatal data in Victoria, particularly during 2008 and 2009. – the absence of personal identifiers on the Queensland perinatal data until 2008 – the absence of personal identifiers on the Northern Territory perinatal data for all
records in scope.
Modelling risk factors for adverse pregnancy and birth outcomes Linking perinatal to death records made it possible to model the risk factors associated with adverse pregnancy and birth outcomes, such as perinatal mortality (comprising stillbirth and neonatal mortality), pre-term birth, low birthweight, as well as infant and child mortality rates.
While the NDI contained information on date of death, age at death and cause of death, the perinatal data contained information on the maternal contextual, demographic and socioeconomic characteristics, health risk factors and pregnancy complications associated with adverse birth and pregnancy outcomes (such as stillbirth, pre-term birth, low birthweight, infant death and child death).
Modelling the risk factors associated with cause of death Cause of death information is not available on perinatal records except for a few early age at death records.
However, linking perinatal records to the NDI enabled nearly all under-5 deaths to be analysed in terms of cause of death and age at death, in conjunction with the maternal contextual, demographic and socioeconomic characteristics, health risk factors and pregnancy complications associated with the under-5 deaths.
Improvements in data quality • There has been continuous improvement in the quality of the perinatal data since 2010,
particularly in the availability and quality of linkage variables to enable jurisdictional PDCs to be linked to jurisdictional birth registration records and death records.
• Since 2010, there have also been improvements in the availability of key risk factors on jurisdictional PDCs for modelling the differentials in adverse pregnancy and birth outcomes between Indigenous and non-Indigenous women.

Infant and child mortality rates for Indigenous Australians using linked and unlinked data 1
1 Linked Perinatal, Birth, Death Data set Objective of the Dataset The Linked Perinatal, Births, Deaths Data set—referred to in this report, as the linked perinatal data set—was created as part of the Linked Perinatal, Birth, Death Data set project to test the feasibility of linking records of births on jurisdictional Perinatal Data Collections (PDCs) and on birth registration datasets to death records on the National Death Index (NDI). The linked perinatal data set would enable the Australian Institute of Health and Welfare (AIHW) to determine the survival outcome of babies born in Australia up to 5 years after birth, including whether they have a death record, and, if they do, when the death occurred, their age at death, and the cause of death.
The linked perinatal data set contained information on maternal contextual, demographic, socioeconomic and health characteristics, as well as health risk factors, which will enable the AIHW to analyse the risk factors associated with birth outcomes such as infant and child death.
Specifically, the AIHW used the linked perinatal dataset to undertake the following tasks:
• prepare a conceptually more robust estimates of cohort-specific under-5 (infant and child) mortality rates by linking perinatal and birth registration records to death records to determine and estimate under-5 deaths occurring within specified birth cohorts
• answer key questions to do with the risk factors associated with the disparities in birth outcomes—particularly infant and child mortality, and cause of death—between Indigenous and non-Indigenous babies.
This report examines the quality of data and linkage methods used to create the linked perinatal dataset.
Purpose of this report The cohort-specific approach to estimating under-5 mortality rates departs from current approaches that use cross-sectional data or point in time to estimate period rates, in which the numerator (deaths) and denominator (population at risk) of the rate are from different datasets.
Some of the deaths in the numerator of the cross-sectional or period rate may also relate to different birth cohorts from those in the denominator of the rate. These rates do not therefore represent the true probability of infant and child death among the cohort of babies in the denominator of the rate (Shryock & Siegel 1976).
Appendix B discusses in more detail the differences between cohort-specific under-5 mortality rates and the conventional period rates using cross-sectional data, including the conceptual and estimation advantages of the former over the latter.
In estimating Indigenous rates, there is also the issue of differences in Indigenous identification between the numerator (deaths) and the denominator (population at risk), if these data are derived from different datasets. The linked perinatal dataset will ensure consistency in Indigenous identification between the numerator and denominator, since both relate to the same birth cohorts.
The success of the cohort-specific approach depends on all infant and child deaths on the NDI being accurately linked to their originating birth cohorts and to their corresponding records on the perinatal and birth registration datasets.

2 Infant and child mortality rates for Indigenous Australians using linked and unlinked data
The main objective of this report was, therefore, to examine the methodological and data quality issues associated with linkage of perinatal and birth registration records to the NDI to identify infant and child deaths that occurred within specified birth cohorts over time.
The methodological and data issues to be examined in this report are the:
• quality of the datasets linked to form the linked perinatal dataset • quality of the data linkage, including the data linkage methodology • ability to identify and link under-5 deaths on the NDI to their originating birth cohorts • quality of Indigenous identification in the constituent datasets on the linked perinatal
dataset • quality of data to model the risk factors associated with the differentials in adverse birth
outcomes between babies born to Indigenous and non-Indigenous women.
This examination was carried out using historical perinatal data for babies born throughout Australia between 1 January 2003 and 31 December 2010, and deaths that occurred within these birth cohorts between 1 January 2010 and 31 December 2015.
Using historical data allows for sufficient time to have elapsed to enable all deaths to be registered. This improves the data quality by reducing the impact of lags in death registration.
Structure of this report This report is divided into 8 chapters and has 2 appendices. Chapter 2 describes the sources of data and methods used to undertake the analysis described in this report. Chapters 3 and 4 outline how the jurisdictional perinatal and birth registration datasets were linked to the NDI. Chapter 3 describes linkage of the jurisdictional perinatal datasets to their corresponding birth registration records, while Chapter 4 describes linkage of the linked perinatal and birth registration dataset to the NDI. Chapter 4 also compares the number of under-5 deaths derived from the linked perinatal dataset to the number of cross-sectional under-5 deaths derived from an unlinked external dataset such as the National Mortality Database (NMD). Chapter 5 examines the impact of various definitions of Indigenous status on the estimated number of under-5 Indigenous deaths from the linked perinatal dataset. Chapter 6 investigates whether linkage of the perinatal to death data will enable sufficiently complete and accurate cause of death information to be derived for all identified under-5 Indigenous deaths. Chapter 7 examines the availability and quality of data on key adverse pregnancy and birth outcomes in the linked perinatal dataset. Chapter 8 presents estimates of trends in cohort-specific under-5 mortality rates, by age at death for each jurisdiction, for purposes of evaluation and review. Appendix A examines the advantages and disadvantages of estimating cohort-specific under-5 mortality rates without or without the use of data linkage. Appendix B discusses the conceptual and data issues associated with estimating under-5 mortality using the cross-sectional approach compared with a cohort-specific approach.

Infant and child mortality rates for Indigenous Australians using linked and unlinked data 3
2 Data and methods
Sources of data Data for creating the linked perinatal dataset were obtained from 3 sources:
• records of births from jurisdictional midwives or PDCs compiled by jurisdictional health departments
• records of birth registrations compiled by jurisdictional Registries of Births, Deaths and Marriages
• records of death registrations compiled by jurisdictional Registries of Births, Deaths and Marriages, which are contained in 2 databases: the NDI and the NMD.
Jurisdictional Perinatal Data Collections The core dataset on which the linked perinatal dataset is based is the jurisdiction-specific PDCs, which were obtained separately from the health departments of each state and territory. Each jurisdictional PDC covered all pregnancies in that jurisdiction between 1 January 2003 and 31 December 2010 that resulted in a live birth or a stillbirth of at least 20 weeks gestation or with a birthweight of at least 400 grams (except for Tasmania, where the PDC covered births between 1 January 2005 and 31 December 2010).
Until 2012, the various jurisdictions collected information on the Indigenous status of the mother of the baby; from 2012, they also started to collect information on the Indigenous status of the baby. Since the cohort of births used for this study predated 2012, information was available only on babies born to Indigenous mothers. Information on the Indigenous status of the baby used in this report was derived from the Indigenous status of the mother in the PDC (see Box 2.1).
Data items obtained for the linked perinatal dataset comprise linkage variables (to facilitate linkage of the jurisdictional PDCs to other datasets) and content data (to estimate under-5 mortality as well as to model the risk factors associated with adverse pregnancy and birth outcomes and the causes of under-5 death).
Data items to link the jurisdictional PDCs to the jurisdictional birth registration datasets as well as to estimate under-5 mortality are shown in the table in Box 2.1. These are further discussed in chapters 3 and 4.
Jurisdictional perinatal data items for modelling risk factors associated with adverse pregnancy and birth outcomes are shown in Table 7.1.
Personal and identifying data items provided to the AIHW for the purpose of linking jurisdictional PDCs to other datasets were separated from their corresponding content or service data by the respective jurisdictional data custodians, and sent separately to the AIHW Data Linkage Unit (DLU) and the Project Team.
In other cases, such as in New South Wales, Western Australia and the Australian Capital Territory, the identifying data were linked to corresponding records on the jurisdictional birth registrations dataset by an authorised data linkage centre under the direction of the data custodian. The authorised data linkage centre then created a linked de-identified dataset which was sent to the Project Team at the AIHW.
4 Infant and child mortality rates for Indigenous Australians using linked and unlinked data
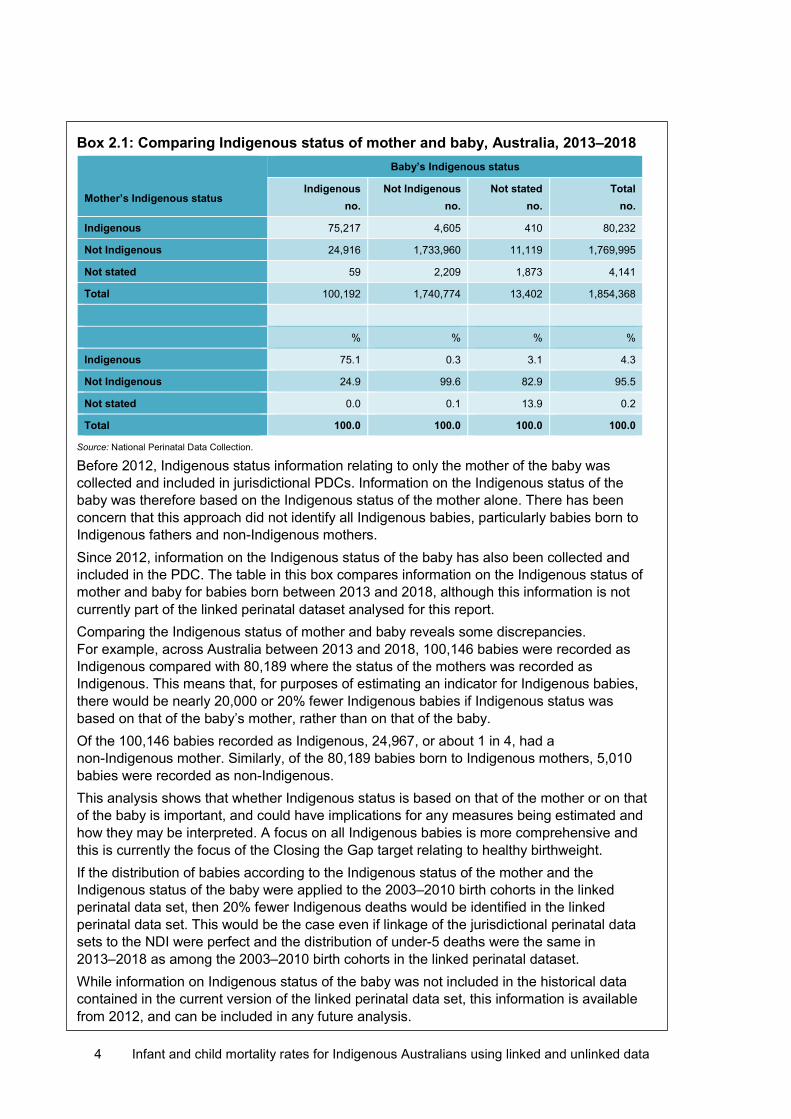
Box 2.1: Comparing Indigenous status of mother and baby, Australia, 2013–2018 Mother’s Indigenous status
Baby’s Indigenous status
Indigenous no.
Not Indigenous no.
Not stated no.
Total no.
Indigenous 75,217 4,605 410 80,232
Not Indigenous 24,916 1,733,960 11,119 1,769,995
Not stated 59 2,209 1,873 4,141
Total 100,192 1,740,774 13,402 1,854,368
% % % %
Indigenous 75.1 0.3 3.1 4.3
Not Indigenous 24.9 99.6 82.9 95.5
Not stated 0.0 0.1 13.9 0.2
Total 100.0 100.0 100.0 100.0
Source: National Perinatal Data Collection.
Before 2012, Indigenous status information relating to only the mother of the baby was collected and included in jurisdictional PDCs. Information on the Indigenous status of the baby was therefore based on the Indigenous status of the mother alone. There has been concern that this approach did not identify all Indigenous babies, particularly babies born to Indigenous fathers and non-Indigenous mothers. Since 2012, information on the Indigenous status of the baby has also been collected and included in the PDC. The table in this box compares information on the Indigenous status of mother and baby for babies born between 2013 and 2018, although this information is not currently part of the linked perinatal dataset analysed for this report. Comparing the Indigenous status of mother and baby reveals some discrepancies. For example, across Australia between 2013 and 2018, 100,146 babies were recorded as Indigenous compared with 80,189 where the status of the mothers was recorded as Indigenous. This means that, for purposes of estimating an indicator for Indigenous babies, there would be nearly 20,000 or 20% fewer Indigenous babies if Indigenous status was based on that of the baby’s mother, rather than on that of the baby. Of the 100,146 babies recorded as Indigenous, 24,967, or about 1 in 4, had a non-Indigenous mother. Similarly, of the 80,189 babies born to Indigenous mothers, 5,010 babies were recorded as non-Indigenous. This analysis shows that whether Indigenous status is based on that of the mother or on that of the baby is important, and could have implications for any measures being estimated and how they may be interpreted. A focus on all Indigenous babies is more comprehensive and this is currently the focus of the Closing the Gap target relating to healthy birthweight. If the distribution of babies according to the Indigenous status of the mother and the Indigenous status of the baby were applied to the 2003–2010 birth cohorts in the linked perinatal data set, then 20% fewer Indigenous deaths would be identified in the linked perinatal data set. This would be the case even if linkage of the jurisdictional perinatal data sets to the NDI were perfect and the distribution of under-5 deaths were the same in 2013–2018 as among the 2003–2010 birth cohorts in the linked perinatal dataset. While information on Indigenous status of the baby was not included in the historical data contained in the current version of the linked perinatal data set, this information is available from 2012, and can be included in any future analysis.

Infant and child mortality rates for Indigenous Australians using linked and unlinked data 5
Details of the data linkage process are provided in Chapter 3.
Table 2.1: Jurisdictional PDCs: list of data items available for data linkage and for estimating under-5 mortality
NSW Vic Qld(a)
SA WA(b) Tas NT ACT(c)
Mother’s characteristics
Surname e Given name e Maiden name e Birthdate Postcode of usual residence
Indigenous status Baby’s characteristics
Surname e e e e
Given name e e e e
Sex
Birth date
Birth status
Birthweight
Plurality
Birth order
Duration of gestation
Survival status of baby (d)
Date of death
Indigenous status of father
Notes (a) Mother’s surname and given name was only available for some years, that is, from the middle of 2007 (b) Mother’s surname and given name, and baby’s name and given name were not available to the AIHW Data Linkage Unit, but were
available to the West Australian Data Linkage Branch which linked the WA PDC to the WA birth registrations and provided the de-identified linked data to the AIHW.
(c) Mother’s surname and given name, and baby’s name and given name were available for confinements that took place in public hospitals only but not for those that took place in private hospitals.
(d) Often available on the PDCs for babies that died within 12 months of birth. (e) Not available/not provided
All live births were included in the estimation of under-5 mortality. However, only singleton live births were included in modelling the risk factors associated with the disparities in adverse pregnancy and birth outcomes between babies born to Indigenous and non-Indigenous women. This was to avoid the confounding effects of the association between multiple births and the risk of adverse pregnancy and birth outcomes, such as preterm birth, low birthweight and neonatal death.
While all data items for the estimation of under-5 mortality were available, Table 7.1 shows differences between jurisdictions in the types of data items available for modelling the risk factors associated with adverse pregnancy and birth outcomes. These differences relate to the actual data elements, their definition, and the years for which they were available.

6 Infant and child mortality rates for Indigenous Australians using linked and unlinked data
Jurisdictional birth registrations Birth registrations data used for this study were provided by jurisdictional Registries of Births, Deaths and Marriages.
All births in Australia must be registered within 60 days of the birth with the Registry of Births, Deaths and Marriages in the jurisdiction where the birth occurred. In practice, however, birth registration coverage is incomplete due to registration lags and non-registration (ABS 2015; Lanyon & John 2015). Apart from processing delays, registration lags and non-registration are often influenced by remoteness location and cost considerations, especially where a birth certificate ‘gives you nothing … and costs money’ (Lanyon & John 2015).
For example, birth certificates are not required to access certain government services as parents can access Centrelink child payments or related family allowances on presentation of a birth notification or a sticker from the hospital where the birth took place.
Analysis of the timeliness of birth registration in 5 jurisdictions (Victoria, Queensland, South Australia, Western Australia and Tasmania) revealed an under-registration rate of 3.2% for 2009 births and 3.6% for 2013 births that were yet to be registered by 2014. The estimated under-registration rate over the 5 years between 2009 and 2014 amounted to about 6,400 unregistered births of children within the 5 jurisdictions considered in the study (Lanyon & John 2015).
Birth registration data provided for this study included personal identifiers for linkage, as well as information on the Indigenous status of the mother and father of the baby. These data items are shown in Table 2.2.
Table 2.2: List of data items provided on jurisdictional birth registration datasets
NSW Vic Qld SA WA Tas NT ACT
Mother’s characteristics
Surname Given name Maiden name Birthdate Postcode of usual residence Baby’s characteristics
Surname Given name Sex Birth date
Birthweight
Plurality
Birth order
Indigenous status of mother
Indigenous status of father
(a) Data items were available for all years.
While all these data items were available on birth registration records for all years, their availability was incomplete, and varied between jurisdictions. Not all records had all the listed data items. The availability of these data items on each jurisdictional birth registration dataset is further discussed in Chapter 3.

Infant and child mortality rates for Indigenous Australians using linked and unlinked data 7
National Death Index and National Mortality Database It is compulsory to register all deaths that occur in Australia with the Registry of Births, Deaths and Marriages in the jurisdiction where the death occurred. In most jurisdictions, deaths are expected to be registered within 7–14 days of the burial or cremation.
The AIHW receives from each jurisdictional Registry of Births, Deaths and Marriages monthly ‘fact of death’ files that include the names and demographic characteristics of all deaths registered with each state and territory Registry. The AIHW uses this monthly data file to compile the NDI. The NDI is used for data linkage only.
The demographic information on the NDI includes sex, date of birth, date of death, age at death, place of death, place of usual residence of the deceased at the time of death, as well as information on the name and date of birth of the mother and father of the deceased.
The AIHW also receives from the Australian Coordinating Registry a yearly mortality data file which the AIHW refers to as the National Mortality Database or NMD. The NMD includes similar demographic and fact of death information to that available on the NDI. It also contains coded information on cause of death, which is not available on the NDI.
Before the NDI is made available to be used, it is enhanced by linking it to the NMD to check for completeness and consistency of information on the NDI, such as sex, date of birth, date of death, age at death, and place of usual residence at time of death. Linkage of the NDI to the NMD also enables the AIHW to obtain additional information, such as cause of death and Indigenous status, and to check for duplicate and missing records (see AIHW (2012, 2017)).
Enhanced Mortality Database While the Enhanced Mortality Database (EMD) was not one of the datasets linked to create the linked perinatal dataset, cross-sectional or period information on the number of under-5 deaths derived from the EMD was used in the comparative analysis shown in tables 5.1–5.3.
The EMD was developed in 2010 by the AIHW to explore the feasibility of creating an ongoing enhanced mortality database that allows estimation and analysis of key mortality indicators, including life expectancy and causes of death, to assist with monitoring ‘Closing the Gap’ health targets. It involves using data linkage to enhance the identification of Aboriginal and Torres Strait Islander people in death registrations.
The method used to create the EMD involved: • linking the NDI to 3 independent datasets containing information on Indigenous
identification • comparing Indigenous identification across the linked datasets • using the results of the comparison to develop algorithms for enhancing Indigenous
identification on the NDI. The following independent datasets were linked to the NDI to create the EMD: • National Hospital Morbidity Database • Residential Aged Care Database • jurisdictional PDC in each state and territory.
The enhancement method employed to create the EMD enables the Indigenous status recorded on death records to be compared across a number of independent datasets. This improves the prospect of deriving a consistent and more robust Indigenous status for all death records.
8 Infant and child mortality rates for Indigenous Australians using linked and unlinked data
Methods The main method used for this study was data linkage to create the linked perinatal dataset. This involved a 2-step process:
• Each jurisdictional PDC was first linked to its corresponding jurisdictional birth registration dataset. This linkage is described in Chapter 3.
• Each linked jurisdictional PDC and birth registrations dataset was then linked, in turn, to the NDI. This linkage is described in Chapter 4.
Justification for 2-step process A number of data quality considerations influenced the adoption of the 2-step process rather than linking the jurisdictional PDCs directly to the NDI. The key consideration was the unavailability of personal identifiers, such as the baby’s names and full date of birth, on the jurisdictional PDCs to enable them to be linked directly to the NDI.
Ethics approval The Linked Perinatal, Birth, Death Dataset project has ethics approval from the AIHW Ethics Committee and from all relevant jurisdictional human research ethics committees (HRECs) except in Queensland, where approval was granted under section 280 of the Public Health Act 2005 (Qld). Where required, ethics approval was also obtained from specific Aboriginal HRECS.
All HRECS that provided ethical approval for this study have been set up and operate according to guidelines established by the National Health and Medical Research Council. These guidelines include the National Statement on Ethical Conduct in Human Research (National Health and Medical Research Council 2007).
Data custodian approval Jurisdictional data custodians approved all datasets used for this study.
Protection of data privacy Data separation and operational separation were used to protect the privacy of project data. All datasets were used in accordance with any legislative provisions and dataset-specific protocols relating to privacy, confidentiality and disclosure.
Linkage of the Australian Capital Territory and New South Wales PDCs and corresponding birth registrations datasets was undertaken by the NSW Centre for Health Record Linkage (CHEREL), while the linkage of the Western Australian PDC and corresponding birth registrations dataset was undertaken by the Western Australian Department of Health Data Linkage Branch. Data linkage for the remaining jurisdictional datasets was undertaken by the AIHW DLU.
The AIHW is an accredited Integration Authority with the personnel, technology, governance structures, processes and experience to undertake data linkage efficiently, securely and with full protection of privacy and data confidentiality. The AIHW DLU has separate domains for data linkage and data merging.

Infant and child mortality rates for Indigenous Australians using linked and unlinked data 9
An important strategy at the AIHW DLU to protect privacy is the data linkage separation principle, which provided data custodians with control over managing privacy and data access. Data custodians separated their respective datasets into a linkage file and a content file. The linkage file contained only personal and identifying data items for data linkage purposes. This file, together with an encrypted record ID for each record, was sent to the data linking domain at the AIHW DLU, while the content file was sent directly to the data merging domain at the AIHW DLU. The linkage file did not contain any content or service data while the content file did not contain any identifying data.
The project-specific linking domain linked identifying variables from the various datasets to generate project-specific linkage keys, while the project-specific merging domain used the project-specific linkage keys generated by the data linking domain to merge the content files. The data merging domain then created a de-identified linked dataset which it sent to the Project Team for analysis. The de-identified linked dataset is not able to be re-identified.
The division of tasks between these 2 AIHW DLU domains protects privacy.
Protection of data confidentiality The AIHW also has in place protocols to protect data confidentiality. As part of its confidentiality protocols, data will not be published if it could lead to the identification of any individual, even if the data to be published are aggregate data or if they are included in tables. AIHW uses tools such as cell aggregation, cell suppression and cell perturbation to protect the confidentiality of data.

10 Infant and child mortality rates for Indigenous Australians using linked and unlinked data
3 Linkage of perinatal and birth records
Overview Linkage of perinatal to birth registration records is a crucial first step in the process of linking perinatal records to death records. This is especially so for jurisdictions without adequate identifiers to enable perinatal records to be linked directly to their corresponding records on the NDI.
While nearly all jurisdictional birth registration records contained personal identifiers for linkage, such as full name and date of birth of baby and mother, some jurisdictional PDCs did not include this information in the perinatal datasets they provided to the AIHW. Direct linkage of jurisdictional PDCs to the NDI would therefore be a challenge without information on full name of baby and mother.
As well, even where babies’ names were available on the perinatal dataset, they were often incomplete or informal, with mothers and babies often discharged before a baby could be given a formal name.
The informal nature of some babies’ names on their perinatal records means that their recorded name was likely to comprise ‘Baby’ as a prefix or given name, and mother’s last name (for example ‘Smith’), resulting in the baby’s name on the perinatal dataset being recorded as ‘Baby Smith’. Difficulties arise when linking perinatal records to another dataset, especially if a mother’s surname, on which the baby’s perinatal name is based, is not the same as her husband’s or partner’s surname, and ‘Baby Smith’ turns out to be ‘Marlene Jones’ on another dataset.
On the other hand, birth registration records contained the full names of babies and their parents, while death registration records contained the full names of the deceased person and their parents. Linkage of the perinatal to birth registration records to obtain the full names of babies and their mothers was therefore important in order to enhance the quality of the linking variables on the perinatal dataset, and consequently the quality of the linkage between perinatal records and the NDI.
Because each jurisdictional PDC and the corresponding birth registrations contained nearly the same records relating to the same babies, the problem of the absence of key linkage variables on jurisdictional PDCs was overcome by first linking jurisdictional PDC records to their corresponding birth registration records, using all available information, such as sex, date of birth, plurality, birth order, birthweight, and an address indicator. This linkage then became an intermediate stage in the linkage between the jurisdictional PDCs and the NDI.
The linkage strategy employed in this study therefore involved the following 2 stages: • linkage of each jurisdictional PDC to its corresponding birth registration records to obtain
additional linkage variables • linkage of each jurisdictional PDC to the NDI; this linkage comprised both perinatal
records that linked or did not link to a corresponding birth registration record. The purpose of this linkage was 3-fold: • to secure additional linkage variables to facilitate linkage of the PDCs to the NDI • to check for and correct for missing or duplicate records on the PDCs • to provide supplementary or corroborative information for records with missing
incomplete or errant information on the PDCs.
Infant and child mortality rates for Indigenous Australians using linked and unlinked data 11
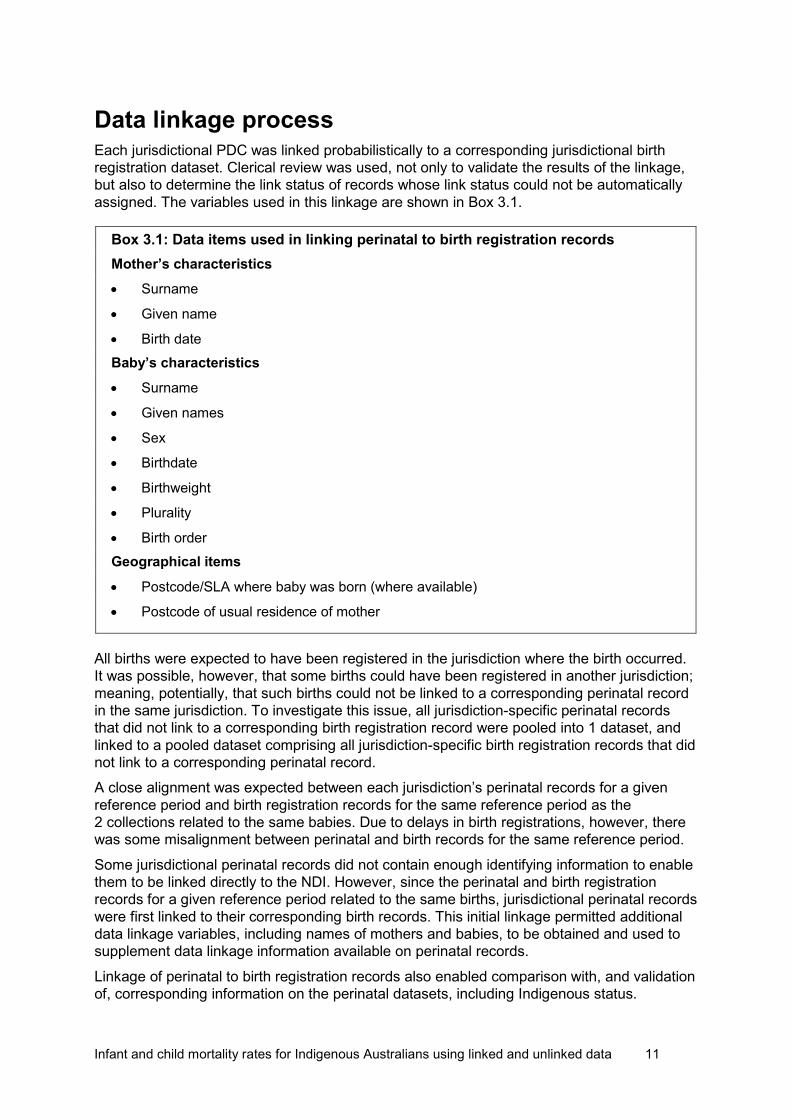
Data linkage process Each jurisdictional PDC was linked probabilistically to a corresponding jurisdictional birth registration dataset. Clerical review was used, not only to validate the results of the linkage, but also to determine the link status of records whose link status could not be automatically assigned. The variables used in this linkage are shown in Box 3.1.
Box 3.1: Data items used in linking perinatal to birth registration records Mother’s characteristics • Surname
• Given name
• Birth date Baby’s characteristics • Surname
• Given names
• Sex
• Birthdate
• Birthweight
• Plurality
• Birth order Geographical items
• Postcode/SLA where baby was born (where available)
• Postcode of usual residence of mother
All births were expected to have been registered in the jurisdiction where the birth occurred. It was possible, however, that some births could have been registered in another jurisdiction; meaning, potentially, that such births could not be linked to a corresponding perinatal record in the same jurisdiction. To investigate this issue, all jurisdiction-specific perinatal records that did not link to a corresponding birth registration record were pooled into 1 dataset, and linked to a pooled dataset comprising all jurisdiction-specific birth registration records that did not link to a corresponding perinatal record.
A close alignment was expected between each jurisdiction’s perinatal records for a given reference period and birth registration records for the same reference period as the 2 collections related to the same babies. Due to delays in birth registrations, however, there was some misalignment between perinatal and birth records for the same reference period.
Some jurisdictional perinatal records did not contain enough identifying information to enable them to be linked directly to the NDI. However, since the perinatal and birth registration records for a given reference period related to the same births, jurisdictional perinatal records were first linked to their corresponding birth records. This initial linkage permitted additional data linkage variables, including names of mothers and babies, to be obtained and used to supplement data linkage information available on perinatal records.
Linkage of perinatal to birth registration records also enabled comparison with, and validation of, corresponding information on the perinatal datasets, including Indigenous status.
12 Infant and child mortality rates for Indigenous Australians using linked and unlinked data
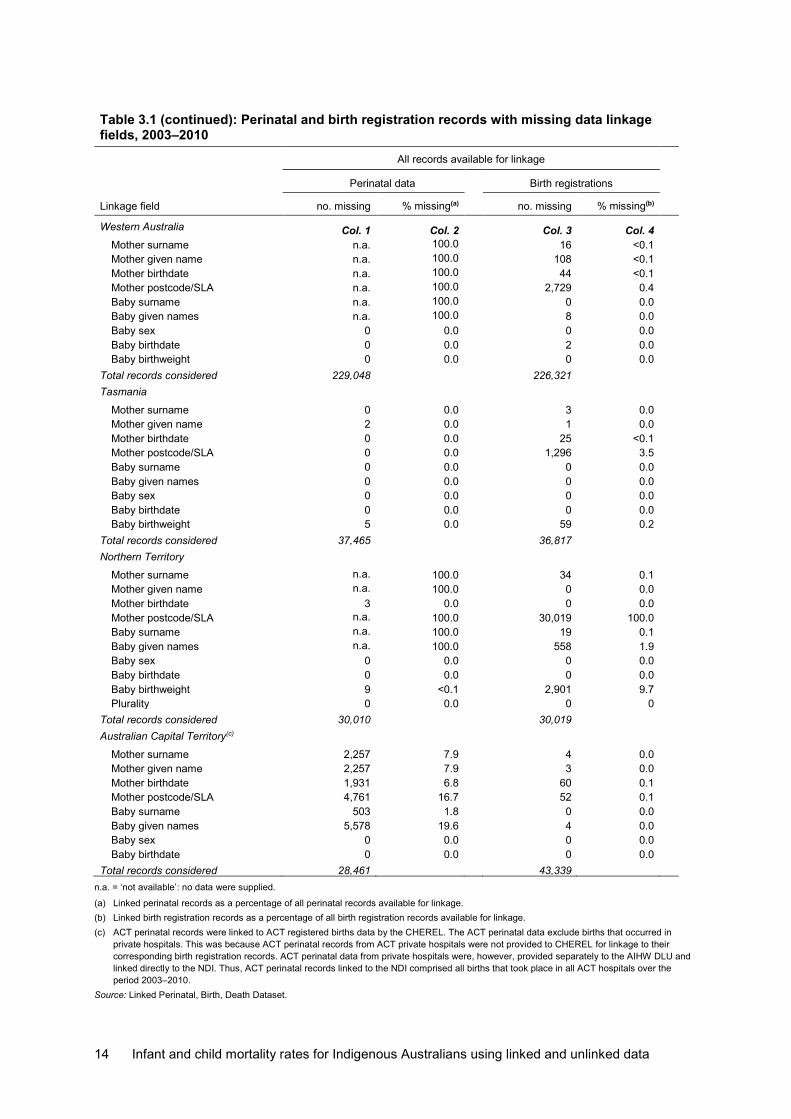
Quality of linkage variables Table 3.1 shows the availability of key linkage variables used to link perinatal records to their corresponding birth registration records. They comprise the full names of baby and mother, and demographic variables, such as sex, date of birth, birthweight, plurality, birth order and an address indicator (such as statistical local area [SLA] or postcode). It covers all perinatal and birth registration records available for linkage.
• Columns 1 and 2 show the number and percentage of perinatal records with missing linkage variables. The percentages were estimated over the total number of perinatal records considered or available for linkage.
• Columns 3 and 4 show the number and percentage of birth registration records with missing linkage variables. The percentages were estimated over the total number of birth registration records available for linkage.
Table 3.1 shows that key linkage variables were available for 90% or more—over 99% in New South Wales—of all perinatal and birth registration records.
In Victoria, Queensland and the Northern Territory, although birth registration records provided to the AIHW contained information on the full names of babies, the corresponding perinatal records did not contain this information.
In Queensland, a full set of linkage variables were not available on the Queensland PDC until the middle of 2007, which may explain why 53% of perinatal records did not contain the mother’s surname or given name and all records did not contain the baby’s surname or given name.
Due to the absence of key linkage variables on the Victorian, Queensland and Northern Territory PDCs, babies’ names were not used in the linkage between the perinatal and birth registration datasets in Victoria and the Northern Territory and, in Queensland, before the middle of 2007.
On the other hand, linkage variables such as mother’s birth date and postcode, and baby’s sex, date of birth, birthweight, plurality and birth order, were available for nearly all records.
The unavailability of mothers’ and babies’ names on the Queensland PDC before the middle of 2007 affected the quality of its linkage to corresponding records on the Queensland birth registration records as well as to the NDI.

Infant and child mortality rates for Indigenous Australians using linked and unlinked data 13
Table 3.1: Perinatal and birth registration records with missing data linkage fields, 2003–2010
Linkage field
All records available for linkage
Perinatal data Birth registrations
no. missing % missing(a) no. missing % missing(b)
New South Wales Col. 1 Col. 2 Col. 3 Col. 4 Mother surname 49 <0.1 829 0.1 Mother given name 49 <0.1 904 0.1 Mother birthdate 155 <0.1 1,627 0.2 Mother postcode/SLA 381 <0.1 9,456 1.2 Baby surname n.a. 100.0 201 <0.1 Baby given names n.a. 100.0 201 <0.1 Baby sex 0 0.0 0 0.0 Baby birthdate 0 0.0 0 0.0
Total records considered 740,634 737,194 Victoria
Mother surname 1,244 0.2 2 0.0 Mother given name 1,281 0.2 9 0.0 Mother birthdate 168 <0.1 137 <0.1 Mother postcode/SLA 32 <0.1 943 0.2 Baby surname n.a. 100.0 2 0.0 Baby given names n.a. 100.0 7 0.0 Baby sex 0 0.0 0 0.0 Baby birthdate 53 <0.1 0 0.0 Baby birthweight 53 <0.1 335,311 61.0 Plurality 53 <0.1 0 0.0 Birth order 53 <0.1 0 0.0
Total records considered 556,628 549,698 Queensland
Mother surname 243,411 53.0 49 <0.1 Mother given name 243,405 53.0 38 <0.1 Mother birthdate 0 0.0 393 0.1 Mother postcode/SLA 0 0.0 n.a. 100.0 Baby surname n.a. 100.0 6 0.0 Baby given names n.a. 100.0 16 <0.1 Baby sex 0 0.0 24 <0.1 Baby birthdate 0 0.0 0 0.0 Baby birthweight 0 0.0 40,238 8.9
Total records considered 458,995 453,462 South Australia
Mother surname 0 0.0 28 <0.1 Mother given name 0 0.0 1 0.0 Mother maiden name n.a. 100.0 61,642 41.2 Mother birthdate 0 0.0 20 <0.1 Mother postcode/SLA 0 0.0 n.a. n.a. Baby surname 0 0.0 25 <0.1 Baby given names 0 0.0 25 <0.1 Baby sex 0 0.0 0 0.0 Baby birthdate 0 0.0 0 0.0 Baby birthweight 0 0.0 7,308 4.9 Plurality 0 0.0 0 0.0 Baby birth order 0 0.0 0 0.0
Total records considered 151,973 149,673
(continued)
14 Infant and child mortality rates for Indigenous Australians using linked and unlinked data
Table 3.1 (continued): Perinatal and birth registration records with missing data linkage fields, 2003–2010
Linkage field
All records available for linkage
Perinatal data Birth registrations
no. missing % missing(a) no. missing % missing(b)
Western Australia Col. 1 Col. 2 Col. 3 Col. 4 Mother surname n.a. 100.0 16 <0.1 Mother given name n.a. 100.0 108 <0.1 Mother birthdate n.a. 100.0 44 <0.1 Mother postcode/SLA n.a. 100.0 2,729 0.4 Baby surname n.a. 100.0 0 0.0 Baby given names n.a. 100.0 8 0.0 Baby sex 0 0.0 0 0.0 Baby birthdate 0 0.0 2 0.0 Baby birthweight 0 0.0 0 0.0
Total records considered 229,048 226,321 Tasmania
Mother surname 0 0.0 3 0.0 Mother given name 2 0.0 1 0.0 Mother birthdate 0 0.0 25 <0.1 Mother postcode/SLA 0 0.0 1,296 3.5 Baby surname 0 0.0 0 0.0 Baby given names 0 0.0 0 0.0 Baby sex 0 0.0 0 0.0 Baby birthdate 0 0.0 0 0.0 Baby birthweight 5 0.0 59 0.2
Total records considered 37,465 36,817 Northern Territory
Mother surname n.a. 100.0 34 0.1 Mother given name n.a. 100.0 0 0.0 Mother birthdate 3 0.0 0 0.0 Mother postcode/SLA n.a. 100.0 30,019 100.0 Baby surname n.a. 100.0 19 0.1 Baby given names n.a. 100.0 558 1.9 Baby sex 0 0.0 0 0.0 Baby birthdate 0 0.0 0 0.0 Baby birthweight 9 <0.1 2,901 9.7 Plurality 0 0.0 0 0
Total records considered 30,010 30,019 Australian Capital Territory(c)
Mother surname 2,257 7.9 4 0.0 Mother given name 2,257 7.9 3 0.0 Mother birthdate 1,931 6.8 60 0.1 Mother postcode/SLA 4,761 16.7 52 0.1 Baby surname 503 1.8 0 0.0 Baby given names 5,578 19.6 4 0.0 Baby sex 0 0.0 0 0.0 Baby birthdate 0 0.0 0 0.0
Total records considered 28,461 43,339 n.a. = ‘not available’: no data were supplied.
(a) Linked perinatal records as a percentage of all perinatal records available for linkage. (b) Linked birth registration records as a percentage of all birth registration records available for linkage. (c) ACT perinatal records were linked to ACT registered births data by the CHEREL. The ACT perinatal data exclude births that occurred in
private hospitals. This was because ACT perinatal records from ACT private hospitals were not provided to CHEREL for linkage to their corresponding birth registration records. ACT perinatal data from private hospitals were, however, provided separately to the AIHW DLU and linked directly to the NDI. Thus, ACT perinatal records linked to the NDI comprised all births that took place in all ACT hospitals over the period 2003–2010.
Source: Linked Perinatal, Birth, Death Dataset.

Infant and child mortality rates for Indigenous Australians using linked and unlinked data 15
Linkage rate: perinatal to birth registration records Perinatal data are event data, compiled as and when a birth occurs. Birth registration data are transactional, and rely on parents registering the birth of their baby within a flexible time frame of up to 60 days of the birth; often this results in registration lags of up to several years. As a result, the number of births recorded on a jurisdictional perinatal dataset as having occurred in a given year could be similar to, but not necessarily equal to, the number of births registered in that jurisdiction for the same period.
This problem is illustrated in Figure 3.1. It shows the number of all perinatal and birth registration records (including stillbirths) that were able or not able to be matched to a corresponding record on the other dataset.
Figure 3.1: Linkage of perinatal to birth registration records, Australia 2003–2010
Perinatal records Registered birth records
Note: Diagram is not drawn according to scale. Source: Linked Perinatal, Births, Deaths Dataset.
A total of 2,233,214 perinatal records covering all births, including stillbirths, that occurred in Australia between 1 January 2003 and 31 December 2010 were linked probabilistically to 2,226,523 birth registration records covering all births, including stillbirths, that occurred throughout Australia over the same period.
About 1.9% of perinatal records (42,419) could not be matched to a corresponding birth registration record for a number of reasons, including:
• absence of a corresponding birth registration record because of late or non-registration of the birth – though it is a legal requirement to register all births, including stillbirths, analysis of
the linked perinatal dataset showed that some stillbirth records on the PDC did not have corresponding birth registration records. This probably suggests that some stillbirths may not have been registered, and could account for some of the PDC records that did not have corresponding birth registration records
• incomplete or poor linkage variables on either or both datasets – there could have been corresponding birth registration records, but incomplete or
poor linkage variables on either or both datasets could have affected the ability to identify and link corresponding records on the 2 datasets.
2,190,795
42,419
206
2,190,795
Matched records: Perinatal records matched to a corresponding record on birth registration dataset
Unmatched birth registration records: Birth registration records not matched to a corresponding record on perinatal dataset
Unmatched perinatal records: Perinatal records not matched to a corresponding record on birth registration dataset
2
,226
,523
2,23
3,21
4
35,728
Total number of birth registration records
Total number of perinatal records

16 Infant and child mortality rates for Indigenous Australians using linked and unlinked data
Similarly, 35,728 birth registration records, representing 1.6% of all birth registration records, were unable to be matched to a perinatal record.
There are other reasons, specific to particular jurisdictions, why some perinatal records could not be matched to a corresponding birth registration record. In the Australian Capital Territory, identifiers on perinatal records from private hospitals were not provided for this linkage. Some of the unmatched ACT birth registration records could therefore have had their corresponding perinatal records among the 14,878 perinatal records from ACT private hospitals that were not provided to the AIHW for linkage to the ACT birth registration records (see next section).
In other jurisdictions, some of these unmatched records would have comprised births that occurred in 1 jurisdiction but were registered in another.
Quality of linkage of perinatal to birth registration records Table 3.2 shows the number of PDC records in each jurisdiction that were able to be linked to a corresponding birth registration record.
In most jurisdictions, over 96% of PDC records were able to be linked to a corresponding birth registration record. Similar percentages of birth registration records were also able to be linked to a corresponding PDC record. This result is to be expected since the 2 datasets refer to the same births that occurred and were registered in the same jurisdiction.
Table 3.2: Linkage rate of perinatal and birth registration records, 2003–2010
Jurisdiction
Records available for linkage Linked records
PDC BR PDC BR
no. no. no. % no. %
New South Wales 740,634 737,194 728,440 98.4 728,440 98.8
Victoria 556,628 549,698 546,774 98.2 546,774 99.4
Queensland 458,995 453,462 446,757 97.3 446,757 98.5
South Australia 151,973 149,673 149,463 98.3 149,463 99.9
Western Australia 229,048 226,321 226,115 98.7 226,115 99.9
Tasmania 37,465 36,817 36,143 96.5 36,143 98.2
Northern Territory 30,010 30,019 29,887 99.6 29,887 99.6
ACT(a) 28,461 43,339 27,216 95.6 27,216 62.8
BR = birth registrations. (a) These refer to ACT perinatal records that were linked to ACT registered births by the CHEREL. ACT perinatal records linked to birth
registration records by the CHEREL, and shown in this table, exclude births that occurred in private hospitals. This was because ACT perinatal records from ACT private hospitals were not provided to CHEREL for linkage to their corresponding birth registration records. ACT perinatal data from private hospitals were, however, provided separately to the AIHW DLU and linked directly to the NDI. Thus, ACT perinatal records linked to the NDI comprised all births that took place in all ACT hospitals over the period 2003–2010.
Source: Linked Perinatal, Birth, Death Dataset.
Linkage of the ACT PDC to its corresponding birth registration records was undertaken by the CHEREL. Table 3.2 shows that, in the ACT, 95.6% of perinatal records were able to be linked to a birth registration record; however, only 62.8% of birth registration records were able to be linked to a corresponding perinatal record. This is because perinatal data from ACT private hospitals were not provided to the CHEREL for linkage to ACT birth registration records. As a result, the CHEREL supplied the AIHW with all ACT birth registration records and their corresponding perinatal records from only ACT public hospitals.

Infant and child mortality rates for Indigenous Australians using linked and unlinked data 17
Perinatal data from ACT private hospitals were, however, provided directly to the AIHW by the ACT Department of Health. These records did not contain identifying variables such as names of baby and mother, but did contain some minimal linkage variables (such as sex, date of birth and an address indicator), which enabled the AIHW DLU to link them directly to the NDI. However, the absence of information on names of baby and mother on the ACT PDC meant that an optimal linkage result could not be guaranteed.
The Western Australia Data Linkage Branch linked and provided the AIHW with linkage keys between the Western Australian perinatal and Western Australian birth registration datasets. The Branch did not, however, provide the AIHW with linkage variables from the Western Australian perinatal dataset. The Western Australian birth registration dataset, however, contained all appropriate linkage variables. Because of this, a different linkage strategy was implemented for Western Australia, as follows:
• first, the Western Australian birth registration dataset was linked to the NDI to identify babies who died within the first 5 years after birth
• second, the perinatal records whose corresponding birth registration records linked to the NDI were identified
• third, using linkage keys between the perinatal and birth registration records provided by the Western Australia Data Linkage Branch, the characteristics of NDI records that linked to a corresponding birth registration record were attached to the appropriate perinatal records.
As most births were registered in the jurisdiction in which the birth occurred, there were not many cases of births that took place in 1 jurisdiction and were registered in another. However, as indicated for Figure 3.1, some perinatal records did not link to a corresponding birth registration record for a number of reasons, including late or non-registration of some births, and poor linkage variables on either or both datasets.

18 Infant and child mortality rates for Indigenous Australians using linked and unlinked data
4 Linkage of perinatal to death records
Overview The main linkage of interest for this study is that between jurisdictional PDCs and the NDI. It is therefore important to also evaluate the quality of linkage variables on the NDI.
Name and date of birth of mother and baby as well as baby’s date of death are key linkage variables in the linkage between jurisdictional PDCs and the NDI.
Table 4.1 shows the number of NDI records in each jurisdiction over the period 2003–2015 with missing key linkage variables. The period 2003–2015 spans the reference period during which under-5 deaths within the cohort of babies born in 2003–2010 would have occurred.
Table 4.1: NDI records with missing key data linkage variables, 2003–2015 Linkage variables NSW Vic Qld SA WA Tas NT ACT
Panel A: Number of records with missing linkage variables
Baby surname 0 0 0 0 0 0 0 0
Baby given name 0 0 0 0 0 0 0 0
Baby sex 0 2 0 0 0 0 0 0
Baby birth date 0 0 0 0 0 0 0 0
Baby death date 0 0 0 0 0 0 3 0
Mother surname 56 3 2,684 744 1,157 2 330 106
Mother given name 83 17 3,278 12 76 139 97 3
Mother maiden name 3,810 46 1,443 16 76 172 98 254
Total number of records 3,810 2,791 3,278 756 1,268 361 362 254
Panel B: Percentage with missing linkage variables
Baby surname 0.0 0.0 0.0 0.0 0.0 0.0 0.0 0.0
Baby given name 0.0 0.0 0.0 0.0 0.0 0.0 0.0 0.0
Baby sex 0.0 0.1 0.0 0.0 0.0 0.0 0.0 0.0
Baby birth date 0.0 0.0 0.0 0.0 0.0 0.0 0.0 0.0
Baby death date 0.0 0.0 0.0 0.0 0.0 0.0 0.8 0.0
Mother surname 1.5 0.1 81.9 98.4 91.2 0.6 91.2 41.7
Mother given name 2.2 0.6 100.0 1.6 6.0 38.5 26.8 1.2
Mother maiden name 100.0 1.6 44.0 2.1 6.0 47.6 27.1 100.0
Source: Linked Perinatal, Birth, Death Dataset.
Nearly all linkage variables, except mother’s surname and given name, were available on the NDI for all jurisdictions. Mother’s surname was missing on the NDI for most records in Queensland (81.9%), South Australia (98.4%), Western Australia (91.2%) and the Northern Territory (91.2%). Mother’s given name was also missing for all death records in Queensland, and for a large percentage of records in Tasmania and the Northern Territory.
Crucially, baby’s surname, given name, sex, date of birth and date of death were available for all death records. This probably reflects the fact that death records are mostly about the deceased person, which, in this case, is the baby. Baby’s characteristics were therefore the key variables used in the linkage between the perinatal and death records.
Infant and child mortality rates for Indigenous Australians using linked and unlinked data 19
Quality of data linkage One of the key objectives of the Linked Perinatal, Birth, Death Dataset project was to test the feasibility of linking perinatal and birth registration records to death registration records to track child deaths to their originating birth cohorts. This linkage aims to determine the number of babies (on the perinatal dataset) who died before their fifth birthday. This chapter reviews the quality of such linkage.
Consistency between cohort-specific and cross-sectional deaths Because of the probabilistic nature of data linkage, it is important to determine what proportions of under-5 deaths that occurred among the cohort of babies-in-scope, in each jurisdiction, were able to be identified through linkage of the jurisdictional PDCs to the NDI.
As previously defined, cohort-specific under-5 deaths within the linked perinatal dataset refer to babies belonging to each year’s birth cohort (that is, 2003 birth cohort, 2004 birth cohort, 2010 birth cohort) who died between 1 January 2003 and 30 December 2015 aged under 1, under 2, under 3, under 4 or under 5.
Under-5 deaths occurring within the 2003 birth cohort (that is, babies born between 1 January and 31 December 2003), for instance, would have occurred between 1 January 2003 and 31 December 2008 for babies aged under 1, under 2, under 3, under 4 or under 5.
Similarly, under-5 deaths occurring within the 2010 birth cohort (that is, babies born between 1 January 2010 and 31 December 2015) would have occurred between 1 January 2010 and 30 December 2015 for babies aged under 1, under 2, under 3, under 4 or under 5.
One could therefore compare the number of cohort-specific under-5 deaths identified on the linked perinatal dataset with an estimate of cross-sectional under-5 deaths derived directly from an external data source such as the NMD.
For the purpose of comparison, ‘cross-sectional’ deaths are defined to approximate as closely as possible the definition of cohort-specific under-5 deaths in the linked perinatal dataset. Cross-sectional deaths for this analysis refer to registered deaths of babies born each year between 1 January 2003 and 31 December 2010, who died during the period 1 January 2003 to 30 December 2015 aged under 1, under 2, under 3, under 4 or under 5.
Since both the cross-sectional and the cohort-specific under-5 deaths are based on the same data source (that is, registered deaths), the comparison will provide an indication of consistency between the number of under-5 deaths identified from the 2 sources.
The number of under-5 deaths identified on the linked perinatal dataset, according to the jurisdiction where the baby was born, can be compared with the number of cross-sectional deaths derived from the NMD according to the following measures:
• age at death • birth cohort (and corresponding year of death).
Age at death All under–5 deaths Table 4.2 compares the number of cohort-specific under–5 deaths identified in the linked perinatal dataset with the number of cross-sectional under–5 deaths derived from the NMD, according to age at death and the jurisdiction where the baby was born.

20 Infant and child mortality rates for Indigenous Australians using linked and unlinked data
• For each jurisdiction, Panel A shows the cumulative number of all babies identified in the linked perinatal dataset as having died before their first, second, third, fourth or fifth birthday. These deaths are termed ‘cohort-specific deaths’.
• Panel B shows the cumulative number of all babies identified on the NMD as having been born between 1 January 2003 and 31 December 2010 and dying before their first, second, third, fourth or fifth birthday. These deaths are termed ‘cross-sectional deaths’.
• Panel C is an estimate of the cohort-specific deaths as a percentage of the cross-sectional deaths. This comparison shows the extent to which, in each jurisdiction, the number of cohort-specific under–5 deaths identified in the linked perinatal dataset is similar to, or different from, the corresponding cross-sectional deaths.
Table 4.3 shows the same information for Indigenous children.
Table 4.2 shows that, nationally, the linked perinatal dataset was able to identify a little over 90% of all under–5 deaths recorded on the NMD.
Table 4.2: Cumulative number of all under–5 deaths occurring at each age among babies born 2003–2010, by jurisdiction where the baby was born
Jurisdiction where baby was born
Age at death NSW Vic Qld SA WA Tas NT ACT Australia
Panel A: Cohort-specific under-5 deaths identified through data linkage (a)
Under 1 2,990 1,939 2,071 540 803 142 227 233 8,945
Under 2 3,193 2,083 2,215 598 884 154 242 243 9,612
Under 3 3,315 2,153 2,317 622 933 162 254 247 10,003
Under 4 3,395 2,213 2,383 635 963 168 263 251 10,271
Under 5 3,446 2,269 2,443 651 979 173 270 256 10,487
Panel B: Cross-sectional under-5 deaths from NMD (b)
Under 1 3,064 2,361 2,380 586 830 189 237 231 9,878
Under 2 3,283 2,519 2,551 655 917 203 256 240 10,624
Under 3 3,426 2,596 2,672 693 966 211 270 245 11,079
Under 4 3,523 2,663 2,747 706 1,002 215 279 249 11,384
Under 5 3,587 2,733 2,818 724 1,021 220 287 253 11,643 Panel C: Comparison rate – Cohort-specific under-5 deaths as a percentage of cross-sectional under-5
d th Under 1 97.6 82.1 87.0 92.2 96.7 75.1 95.8 100.9 90.6
Under 2 97.3 82.7 86.8 91.3 96.4 75.9 94.5 101.3 90.5
Under 3 96.8 82.9 86.7 89.8 96.6 76.8 94.1 100.8 90.3
Under 4 96.4 83.1 86.7 89.9 96.1 78.1 94.3 100.8 90.2
Under 5 96.1 83.0 86.7 89.9 95.9 78.6 94.1 101.2 90.1
(a) Linked Perinatal, Birth, Death Dataset: Indigenous status of under-5 deaths is based on the Indigenous status of the baby’s mother in each jurisdictional PDC.
(b) NMD: Indigenous status of under-5 deaths is based on the Indigenous status of the baby in the NMD. Sources: Linked Perinatal, Birth, Death Dataset; NMD.
The percentage of cross-sectional under-5 deaths identified in the linked perinatal dataset was not dependent on age at death. For example, the percentage of babies identified in the linked perinatal dataset as dying before their first birthday only differed by about 1–3 percentage points from the percentage identified as dying before their fifth birthday.

Infant and child mortality rates for Indigenous Australians using linked and unlinked data 21
The percentage of cross-sectional under-5 deaths identified in the linked perinatal dataset did, however, differ between jurisdictions. It was 90% or more in all jurisdictions except Victoria (82–83%), Queensland (87%) and Tasmania (75–79%).
The lower percentage of cross-sectional under-5 Indigenous deaths identified in the linked perinatal dataset in Victoria, Queensland and Tasmania could be related to differences between the jurisdictions in the quality of data linkage variables and information on Indigenous identification in their respective PDCs and death registrations data.
For example, key linkage variables such as babies’ and mothers’ names were not available on the Queensland PDC until the middle of 2007. This affected the quality of the linkage of the Queensland PDC to the NMD, and, consequently, the number of death records on the NDI that could be linked back to their originating birth cohorts on the Queensland PDC.
A number of factors would also have affected the quality of linkage of the Victoria perinatal data collection (VPDC) to the NDI. Firstly, babies’ names were not included in the VPDC data provided to the AIHW. Secondly, due to changes in the collection of the Victoria perinatal data around 2009, from a paper-based collection system to an electronic system, the VPDC data was not considered fully complete during the transition phase.
With regard to the Northern Territory, the percentage of cross-sectional deaths identified in the linked perinatal dataset (94.1%) could have been higher if babies’ names were included in the Northern Territory perinatal data provided to the AIHW.
Indigenous under-5 deaths Panels A, B and C in Table 4.3 show a fairly close match between cohort-specific and cross-sectional Indigenous under-5 deaths. The Indigenous status of the cohort-specific deaths is based on the Indigenous status of the baby’s mother in the respective jurisdictional PDCs, while the Indigenous status of the cross-sectional deaths is based on the Indigenous status of the baby in the NMD. This difference could account for some of the differences between the number of Indigenous under-5 deaths identified in the linked perinatal data set and the number of cross-sectional Indigenous under-5 deaths identified in the NMD.
Nationally, the linked perinatal data set was able to identify about 84% of cross-sectional under-5 deaths of Indigenous children on the NMD. Except for Victoria, Queensland and the Australian Capital Territory, however, the number of cohort-specific under-5 deaths identified in the linked perinatal dataset amounted to over 90% of cross-sectional deaths in each jurisdiction. The comparison rate is close to 100% at each age at death in New South Wales and Western Australia, and over 90% in both South Australia and the Northern Territory.
The low national comparison rate of 84–86% is due to the low comparison rate in Queensland (65.3–66.2%), which is related to the unavailability of key linkage variables such as babies’ and mothers’ names on the Queensland PDC until the middle of 2007.
As well, differences in the quality of information on Indigenous status across various jurisdictional datasets could also affect the correspondence between the number of under-5 Indigenous deaths in the linked perinatal dataset and the NMD.
For example, the lower comparison rates for Victoria (86%), Queensland (65.3%) and the Northern Territory (90.6%) could be explained by the absence of babies’ names in the Victoria, Queensland and Northern Territory perinatal data provided to the AIHW, in addition to changes in the data collection platform identified in Victoria around 2009.
The issues underlying the very low comparison rate in Queensland become clearer in Table 4.5 when this analysis is repeated according to birth cohort.

22 Infant and child mortality rates for Indigenous Australians using linked and unlinked data
Table 4.3: Cumulative number of under-5 deaths occurring at each age among Indigenous babies born 2003–2010, by jurisdiction where the baby was born
Jurisdiction where baby was born
Age at death NSW Vic Qld SA WA Tas NT ACT Australia
Panel A: Cohort-specific under-5 deaths identified through data linkage (a)
Under 1 185 39 201 41 149 5 163 13 796
Under 2 199 41 220 49 169 5 175 13 871
Under 3 207 42 229 51 180 5 181 13 908
Under 4 208 43 233 53 186 5 188 13 929
Under 5 211 43 239 54 187 5 192 13 944
Panel B: Cross-sectional under-5 deaths from NMD (b)
Under 1 189 45 305 44 151 n.p. 174 16 927
Under 2 204 48 334 53 171 n.p. 188 16 1,018
Under 3 215 49 346 54 184 n.p. 198 16 1,066
Under 4 220 50 353 56 192 n.p. 206 16 1,097
Under 5 226 50 366 57 192 n.p. 212 16 1,123 Panel C: Comparison rate – Cohort-specific under-5 deaths as a percentage of cross-sectional under-5
d th Under 1 97.9 86.7 65.9 93.2 98.7 n.p.
93.7 81.3 85.9
Under 2 97.5 85.4 65.9 92.5 98.8 n.p. 93.1 81.3 85.6 Under 3 96.3 85.7 66.2 94.4 97.8 n.p. 91.4 81.3 85.2 Under 4 94.5 86.0 66.0 94.6 96.9 n.p. 91.3 81.3 84.7 Under 5 93.4 86.0 65.3 94.7 97.4 n.p. 90.6 81.3 84.1
n.p = data not publishable.
(a) Linked Perinatal, Birth, Death Dataset: Indigenous status of under-5 deaths is based on the Indigenous status of the baby’s mother in each jurisdictional PDC.
(b) NMD: Indigenous status of under-5 deaths is based on the Indigenous status of the baby in the NMD. Sources: Linked Perinatal, Birth, Death Dataset; NMD.
Birth cohorts All under-5 deaths Tables 4.2 and 4.3 compared the consistency between cohort-specific and cross-sectional under-5 deaths according to age at death. Tables 4.4 and 4.5 examine the same information in relation to birth cohorts, or year of birth.
For each birth cohort, tables 4.4 and 4.5 also show ‘year of death’ or the year corresponding to when the under-5 deaths in each birth cohort would have occurred.
• For instance, all under-5 deaths that occurred within the 2003 birth cohort occurred during the period 2003–2008 (that is, between 1 January 2003 and 31 December 2008), while under-5 deaths that occurred within the 2010 birth cohort occurred during the period 2010–2015 (that is, between 1 January 2010 and 31 December 2015).
Table 4.4 shows that, nationally, the linked perinatal dataset was able to identify about 90% of cross-sectional under-5 deaths from the NMD. In all jurisdictions except Victoria and Queensland, the percentage of under-5 deaths in the NMD that could be identified in the linked perinatal dataset was 90% or higher for all birth cohorts and across all years of death.
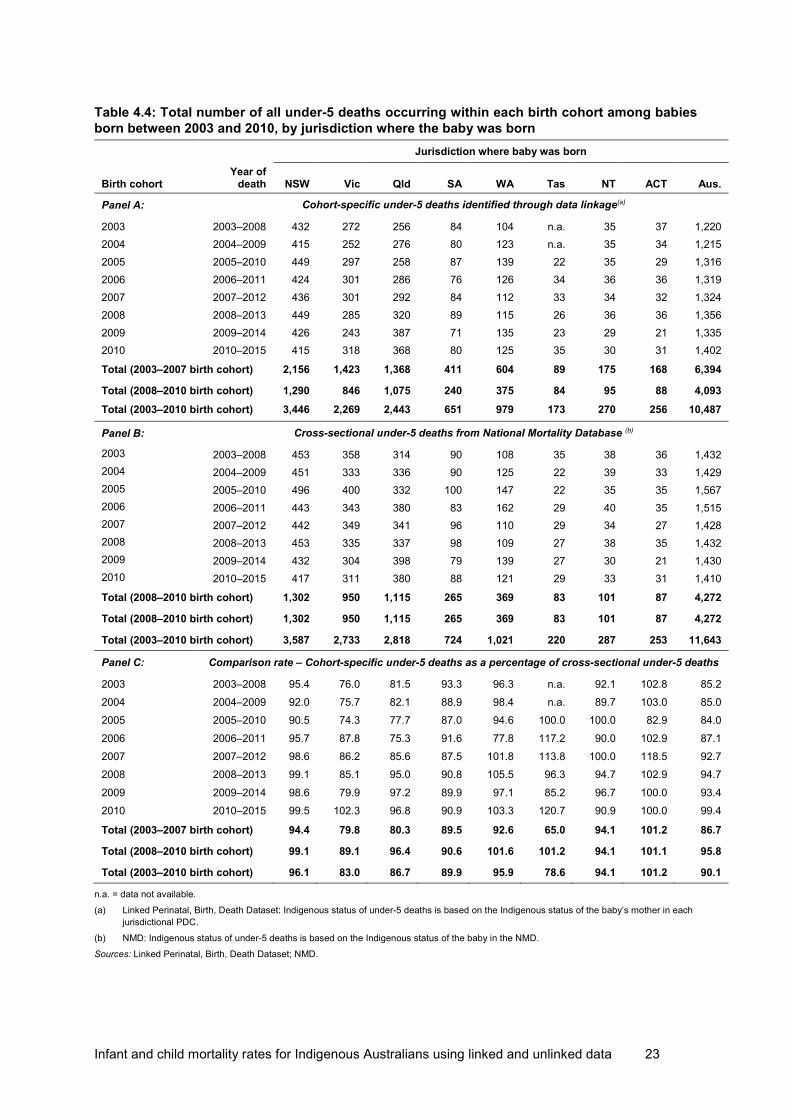
Infant and child mortality rates for Indigenous Australians using linked and unlinked data 23
Table 4.4: Total number of all under-5 deaths occurring within each birth cohort among babies born between 2003 and 2010, by jurisdiction where the baby was born
Jurisdiction where baby was born
Birth cohort
Year of death
NSW
Vic
Qld
SA
WA
Tas
NT
ACT
Aus.
Panel A: Cohort-specific under-5 deaths identified through data linkage(a)
2003 2003–2008 432 272 256 84 104 n.a. 35 37 1,220 2004 2004–2009 415 252 276 80 123 n.a. 35 34 1,215 2005 2005–2010 449 297 258 87 139 22 35 29 1,316 2006 2006–2011 424 301 286 76 126 34 36 36 1,319 2007 2007–2012 436 301 292 84 112 33 34 32 1,324 2008 2008–2013 449 285 320 89 115 26 36 36 1,356 2009 2009–2014 426 243 387 71 135 23 29 21 1,335 2010 2010–2015 415 318 368 80 125 35 30 31 1,402
Total (2003–2007 birth cohort) 2,156 1,423 1,368 411 604 89 175 168 6,394
Total (2008–2010 birth cohort) 1,290 846 1,075 240 375 84 95 88 4,093 Total (2003–2010 birth cohort) 3,446 2,269 2,443 651 979 173 270 256 10,487 Panel B: Cross-sectional under-5 deaths from National Mortality Database (b)
2003 2003–2008 453 358 314 90 108 35 38 36 1,432 2004 2004–2009 451 333 336 90 125 22 39 33 1,429
2005 2005–2010 496 400 332 100 147 22 35 35 1,567 2006 2006–2011 443 343 380 83 162 29 40 35 1,515 2007 2007–2012 442 349 341 96 110 29 34 27 1,428 2008 2008–2013 453 335 337 98 109 27 38 35 1,432 2009 2009–2014 432 304 398 79 139 27 30 21 1,430 2010 2010–2015 417 311 380 88 121 29 33 31 1,410
Total (2008–2010 birth cohort) 1,302 950 1,115 265 369 83 101 87 4,272
Total (2008–2010 birth cohort) 1,302 950 1,115 265 369 83 101 87 4,272
Total (2003–2010 birth cohort) 3,587 2,733 2,818 724 1,021 220 287 253 11,643
Panel C: Comparison rate – Cohort-specific under-5 deaths as a percentage of cross-sectional under-5 deaths
2003 2003–2008 95.4 76.0 81.5 93.3 96.3 n.a. 92.1 102.8 85.2 2004 2004–2009 92.0 75.7 82.1 88.9 98.4 n.a. 89.7 103.0 85.0 2005 2005–2010 90.5 74.3 77.7 87.0 94.6 100.0 100.0 82.9 84.0 2006 2006–2011 95.7 87.8 75.3 91.6 77.8 117.2 90.0 102.9 87.1 2007 2007–2012 98.6 86.2 85.6 87.5 101.8 113.8 100.0 118.5 92.7 2008 2008–2013 99.1 85.1 95.0 90.8 105.5 96.3 94.7 102.9 94.7 2009 2009–2014 98.6 79.9 97.2 89.9 97.1 85.2 96.7 100.0 93.4 2010 2010–2015 99.5 102.3 96.8 90.9 103.3 120.7 90.9 100.0 99.4
Total (2003–2007 birth cohort) 94.4 79.8 80.3 89.5 92.6 65.0 94.1 101.2 86.7
Total (2008–2010 birth cohort) 99.1 89.1 96.4 90.6 101.6 101.2 94.1 101.1 95.8
Total (2003–2010 birth cohort) 96.1 83.0 86.7 89.9 95.9 78.6 94.1 101.2 90.1
n.a. = data not available.
(a) Linked Perinatal, Birth, Death Dataset: Indigenous status of under-5 deaths is based on the Indigenous status of the baby’s mother in each jurisdictional PDC.
(b) NMD: Indigenous status of under-5 deaths is based on the Indigenous status of the baby in the NMD. Sources: Linked Perinatal, Birth, Death Dataset; NMD.
24 Infant and child mortality rates for Indigenous Australians using linked and unlinked data
This indicates that linkage of jurisdictional perinatal and birth registration data to the NDI was able to reliably identify cohort-specific under-5 deaths. The ability to identify cohort-specific under-5 deaths from the linked perinatal dataset also appeared to have improved over time, especially from the 2008 birth cohort.
For example, for nearly all jurisdictions, the percentage of cross-sectional under-5 deaths identified in the linked perinatal dataset was higher for later birth cohorts and later years of death than for earlier birth cohorts and earlier years of death.
Nationally, the percentage of cross-sectional under-5 deaths identified in the linked perinatal dataset was 86.7% among the 2003–2007 birth cohorts; it increased to 95.8% among the 2008–2010 birth cohorts who died between 2008 and 2015.
In the Northern Territory, the percentage of cross-sectional under-5 deaths identified in the linked perinatal dataset was the same (94.1%) among both the 2003–2007 and 2008–2010 birth cohorts.
In the Australian Capital Territory, the percentage of cross-sectional under-5 deaths identified in the linked perinatal dataset was 101.1% and 101.2%, respectively, among the 2003–2007 and 2008–2010 birth cohorts.
Indigenous under-5 deaths The number of cohort-specific deaths (Panel A) and cross-sectional deaths (Panel B) were variable and more inconsistent when classified by birth cohort or year of birth (Table 4.3) than when classified by age at death (Table 4.5). This is probably because, when classified by year of birth, the deaths are distributed over 8 cells (8 years); when classified by age at death, the deaths are distributed over 5 cells (5 years), leading to a much smaller number of deaths in each cell.
Unlike Table 4.3, Table 4.5 also shows the smoothing effect provided by cumulating the under-5 deaths at each age at death, from under 1 year to under 5 years.
The estimates in Table 4.5, as indeed in Table 4.3, could be affected by various data quality issues, including those described here:
• There could be inconsistencies in Indigenous identification between the jurisdictional PDCs and death registrations data.
• Indigenous identification in the jurisdictional perinatal data was based on the Indigenous status of the baby’s mother; in death registrations, Indigenous status was based on the Indigenous status of the deceased baby. The number of under-5 Indigenous deaths identified in the linked perinatal data set excludes Indigenous babies whose mothers are not Indigenous. The linked perinatal data set will thus underestimate the number of Indigenous babies and the number of under-5 deaths of Indigenous children since this information is based on the Indigenous status of the baby’s mother. – It was observed in Box 2.1 that nationally, during 2013–2018, nearly 20% of
Indigenous babies had non-Indigenous mothers. – The percentage of Indigenous babies with non-Indigenous mothers varied between
states and territories, and ranged between about 10% in the Northern Territory and about 41% in Victoria (see Table 4.5).
– This means that even if the linkage of the jurisdictional perinatal data sets to the NMD were perfect, the linked perinatal data set would still underestimate the number of under-5 deaths of Indigenous children by about 10%–41% because it covered only under-5 deaths of Indigenous children whose mothers were Indigenous.

Infant and child mortality rates for Indigenous Australians using linked and unlinked data 25
• The percentage of under-5 deaths of Indigenous children identified by the linked perinatal data set is therefore reasonable, given that the linked perinatal data set only identified under-5 deaths of Indigenous children with Indigenous mothers whereas the NMD identified all Indigenous deaths, including those with non-Indigenous mothers.
• The number of deaths in some jurisdictions, notably Victoria, South Australia, Tasmania and the Australian Capital Territory, was very small and variable between birth cohorts, with small changes in the number of deaths having a disproportionately large effect on the comparison rates.
Table 4.5: Percent distribution of Indigenous babies born between 2013 and 2018 according to Indigenous status of mother, states and territories
Indigenous status of mother (%)
State/territory No. of births Indigenous Not Indigenous Not stated Total
New South Wales 31,064 68.1 31.8 0.1 100.0
Victoria 8,493 58.8 41.0 0.2 100.0
Queensland 28,799 81.1 18.9 0.0 100.0
South Australia 5,865 74.5 25.5 0.0 100.0
Western Australia 13,472 78.8 21.2 0.0 100.0
Tasmania 1,970 78.1 21.5 0.4 100.0
Northern Territory 8,523 89.8 10.2 0.0 100.0
Australian Capital Territory 1,093 70.9 28.5 0.6 100.0
Australia 99,279 75.0 24.9 0.1 100.0
Source: Linked Perinatal, Birth, Death Dataset.
Overall, Table 4.6 confirms that higher percentages of cross-sectional deaths from the NMD were identified in the linked perinatal dataset among more recent birth cohorts than among earlier birth cohorts. Table 4.6 shows that, nationally, the linked perinatal dataset was able to identify about 84% of cross-sectional Indigenous under-5 deaths from the NMD, compared with about 90% of all under-5 deaths that were identified from the NMD (Table 4.4). The percentage of cross-sectional Indigenous under-5 deaths identified in the linked perinatal dataset was higher, on average, for later birth cohorts and later years of death than for earlier birth cohorts and earlier years of death. Nationally, the percentage of cross-sectional Indigenous under-5 deaths identified in the linked perinatal dataset was 76.2% among the 2003–2007 birth cohorts, and 98.5% among the 2008–2010 birth cohorts, with death occurring between 2008 and 2015. For all states and territories except Victoria and the Northern Territory, the percentage of cross-sectional Indigenous under-5 deaths identified in the linked perinatal dataset was higher for the 2008–2010 birth cohorts (with under-5 deaths occurring during the period 2008–2015) than for the 2003–2007 birth cohorts. For jurisdictions other than the Australian Capital Territory and Tasmania, Panel C of Table 4.6 shows more stable and consistent comparison rates closer to 100% for later birth cohorts (2008–2010) than the earliest birth cohorts (2003–2007). In Queensland, comparison rates were less than 60% before 2007, increasing to 79.3% in 2007 and to over 80% thereafter. In Queensland, the period from mid-2007 coincided with the beginning of the availability of full linkage variables on the Queensland PDC.
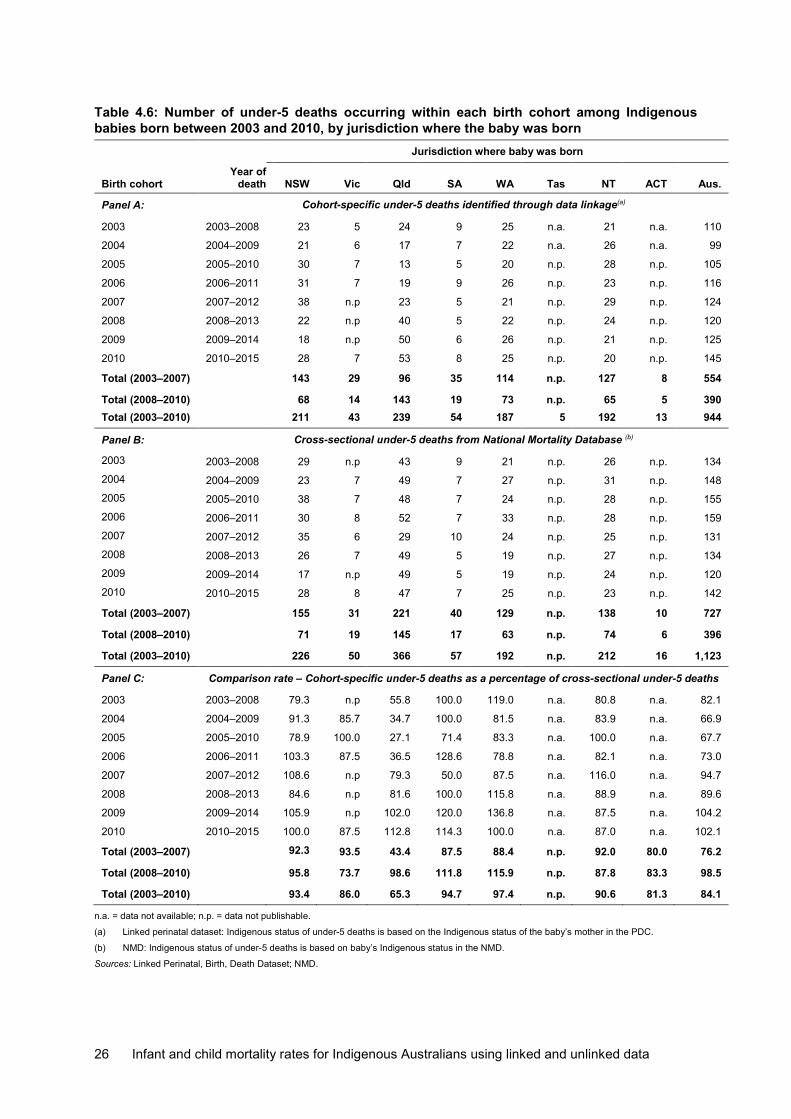
26 Infant and child mortality rates for Indigenous Australians using linked and unlinked data
Table 4.6: Number of under-5 deaths occurring within each birth cohort among Indigenous babies born between 2003 and 2010, by jurisdiction where the baby was born
Jurisdiction where baby was born
Birth cohort
Year of death
NSW
Vic
Qld
SA
WA
Tas
NT
ACT
Aus.
Panel A: Cohort-specific under-5 deaths identified through data linkage(a)
2003 2003–2008 23 5 24 9 25 n.a. 21 n.a. 110
2004 2004–2009 21 6 17 7 22 n.a. 26 n.a. 99
2005 2005–2010 30 7 13 5 20 n.p. 28 n.p. 105
2006 2006–2011 31 7 19 9 26 n.p. 23 n.p. 116
2007 2007–2012 38 n.p 23 5 21 n.p. 29 n.p. 124
2008 2008–2013 22 n.p 40 5 22 n.p. 24 n.p. 120
2009 2009–2014 18 n.p 50 6 26 n.p. 21 n.p. 125
2010 2010–2015 28 7 53 8 25 n.p. 20 n.p. 145
Total (2003–2007) 143 29 96 35 114 n.p. 127 8 554
Total (2008–2010) 68 14 143 19 73 n.p. 65 5 390 Total (2003–2010) 211 43 239 54 187 5 192 13 944 Panel B: Cross-sectional under-5 deaths from National Mortality Database (b)
2003 2003–2008 29 n.p 43 9 21 n.p. 26 n.p. 134 2004 2004–2009 23 7 49 7 27 n.p. 31 n.p. 148 2005 2005–2010 38 7 48 7 24 n.p. 28 n.p. 155 2006 2006–2011 30 8 52 7 33 n.p. 28 n.p. 159 2007 2007–2012 35 6 29 10 24 n.p. 25 n.p. 131 2008 2008–2013 26 7 49 5 19 n.p. 27 n.p. 134 2009 2009–2014 17 n.p 49 5 19 n.p. 24 n.p. 120 2010 2010–2015 28 8 47 7 25 n.p. 23 n.p. 142
Total (2003–2007) 155 31 221 40 129 n.p. 138 10 727
Total (2008–2010) 71 19 145 17 63 n.p. 74 6 396
Total (2003–2010) 226 50 366 57 192 n.p. 212 16 1,123
Panel C: Comparison rate – Cohort-specific under-5 deaths as a percentage of cross-sectional under-5 deaths
2003 2003–2008 79.3 n.p 55.8 100.0 119.0 n.a. 80.8 n.a. 82.1
2004 2004–2009 91.3 85.7 34.7 100.0 81.5 n.a. 83.9 n.a. 66.9
2005 2005–2010 78.9 100.0 27.1 71.4 83.3 n.a. 100.0 n.a. 67.7
2006 2006–2011 103.3 87.5 36.5 128.6 78.8 n.a. 82.1 n.a. 73.0
2007 2007–2012 108.6 n.p 79.3 50.0 87.5 n.a. 116.0 n.a. 94.7
2008 2008–2013 84.6 n.p 81.6 100.0 115.8 n.a. 88.9 n.a. 89.6
2009 2009–2014 105.9 n.p 102.0 120.0 136.8 n.a. 87.5 n.a. 104.2
2010 2010–2015 100.0 87.5 112.8 114.3 100.0 n.a. 87.0 n.a. 102.1
Total (2003–2007) 92.3 93.5 43.4 87.5 88.4 n.p. 92.0 80.0 76.2
Total (2008–2010) 95.8 73.7 98.6 111.8 115.9 n.p. 87.8 83.3 98.5
Total (2003–2010) 93.4 86.0 65.3 94.7 97.4 n.p. 90.6 81.3 84.1
n.a. = data not available; n.p. = data not publishable.
(a) Linked perinatal dataset: Indigenous status of under-5 deaths is based on the Indigenous status of the baby’s mother in the PDC.
(b) NMD: Indigenous status of under-5 deaths is based on baby’s Indigenous status in the NMD.
Sources: Linked Perinatal, Birth, Death Dataset; NMD.

Infant and child mortality rates for Indigenous Australians using linked and unlinked data 27
Consistent and very high comparison rates close to 100% were also observed in New South Wales, South Australia and Western Australia among 2007 and later birth cohorts. In fact, for all jurisdictions other than South Australia, comparison rates for the period 2008–2010 were higher than for the period 2003–2007. This indicates that the underlying datasets for the estimation of cohort-specific mortality rates have improved over time, and that cohort-specific under-5 mortality rates based on the linked perinatal dataset are more accurately estimated for more recent periods (2008–2010) than for earlier periods (2003–2007).
The higher comparison rates between estimates of cross-sectional and cohort-specific under-5 deaths is due to continual improvements in the accuracy and consistency of reporting of key personal information, such as name, date of birth of mother and baby, date of death, and Indigenous status in both the PDC and in death registrations.

28 Infant and child mortality rates for Indigenous Australians using linked and unlinked data
5 Indigenous identification
Sources of information on Indigenous identification In Chapter 4, the number of cohort-specific under-5 deaths identified in the linked perinatal dataset was compared with the number of cross-sectional under-5 deaths derived directly from an unlinked external data source such as the NMD.
Indigenous identification of the cohort-specific deaths in the linked perinatal dataset was based on the Indigenous identification of the baby’s mother as recorded in the jurisdictional PDCs, while the Indigenous identification of the cross-sectional deaths was based on the Indigenous identification of the baby as recorded in the NMD.
Chapter 5 is an extension of Chapter 4. It examines separate estimates of under-5 Indigenous deaths depending on whether Indigenous identification was derived from the PDC, birth registrations dataset or the NDI.
The following classifications were used in deriving Indigenous under-5 deaths from the 3 constituent datasets of the linked perinatal dataset:
• PDC: An under-5 death was considered an Indigenous death if the baby’s mother was classified as Indigenous on the jurisdictional PDC.
• Birth registration dataset: An under-5 death was considered an Indigenous death if the baby’s mother was recorded as Indigenous on the jurisdictional birth registration dataset.
• NDI: An under-5 death was considered an Indigenous death if the baby was classified as Indigenous on the NDI.
The number of Indigenous under-5 deaths obtained from the specified sources within the linked perinatal dataset was then compared with the number of under-5 Indigenous deaths estimated from the following external data sources:
• NMD: baby was recorded as Indigenous in the NMD • Enhanced Mortality Database: baby was recorded as Indigenous in the Enhanced
Mortality Database.
Estimates of Indigenous under-5 deaths according to various definitions of Indigenous status are shown in tables 5.1 and 5.2.
• Column 1 of these tables shows estimates of under-5 Indigenous deaths based on mother being recorded as Indigenous in the applicable jurisdictional PDC.
• Column 2 shows estimates of under-5 Indigenous deaths based on a baby being defined as Indigenous on either the jurisdictional PDCs or the NDI.
• Column 3 shows ‘ever-Indigenous’ estimates of under-5 Indigenous deaths based on combinations of Indigenous status from the birth registration dataset or the NDI.
• Column 4 shows the number of cross-sectional under-5 deaths derived from an external data source, such as the NMD, and defined to approximate the number of cohort-specific under-5 deaths in the linked perinatal dataset. – The NMD was not part of the linked perinatal dataset. – Cross-sectional deaths are based on the Indigenous status of the baby in the NMD,
and are defined to approximate the under-5 deaths derived from the linked perinatal dataset in terms of date of birth, date of death and age at death.

Infant and child mortality rates for Indigenous Australians using linked and unlinked data 29
• Column 5 of tables 5.1 and 5.2 shows the ‘enhanced’ number of under-5 deaths derived from the Enhanced Mortality Database, and defined to approximate the number of cohort-specific under-5 deaths in the linked perinatal dataset. – Indigenous identification of under-5 deaths in the Enhanced Mortality Database was
obtained by linking records of under-5 deaths in the NDI with their corresponding records on the hospital database and jurisdictional PDCs, comparing Indigenous identification across the linked datasets, and using the results of the comparison to enhance Indigenous identification on the NDI (AIHW 2017).
– previous analysis of Enhanced Mortality Database data shows that under-5 deaths of Indigenous children on the NDI have been misclassified by up to 20%.
The estimates from tables 5.1 and 5.2 are used for 2 sets of comparisons, namely comparison between the number of: • deaths derived from the linked perinatal dataset and the number of deaths derived from
the NMD (column 1 and column 4, for all jurisdictions). This shows the extent to which the data linkage has been effective in identifying all under-5 deaths of Indigenous children
• ‘adjusted’ deaths derived from the linked perinatal dataset and the number of deaths derived from the Enhanced Mortality Database (columns 1, 2 and 3 and column 5, for all jurisdictions). This shows the extent of under-identification of under-5 Indigenous deaths in the linked perinatal dataset compared with the Enhanced Mortality Database.
Comparison between under-5 Indigenous deaths in the Linked Perinatal, Birth, Death Dataset and the National Mortality Database Comparison between the number of cohort-specific under-5 Indigenous deaths identified in the linked perinatal dataset (column 1) and the number of cross-sectional Indigenous under-5 deaths derived from the NMD (column 4) shows the extent to which data linkage was effective in identifying all under-5 deaths of Indigenous children occurring within birth cohorts.
For all jurisdictions, estimates of the number of under-5 deaths of Indigenous children based on the Indigenous status of the mother from the PDC (column 1) were lower than the number of Indigenous under-5 deaths cross-sectional from the NMD (column 4).
The number of under-5 Indigenous deaths identified in the linked perinatal dataset among the 2003–2010 birth cohorts, based on the Indigenous status of the mother in the PDC (column 1, row 4 for each jurisdiction), compared with the number cross-sectional from the NMD, ranged between 65% in Queensland and about 100% in Western Australia. For other jurisdictions, the percentage of Indigenous deaths identified was as high as 93% in New South Wales, 95% in South Australia and 91% in the Northern Territory.
As described in Box 2.1 and shown in Table 4.5, even if linkage of the jurisdictional perinatal data sets to the NDI were perfect, the linked perinatal data set would under-estimate the number of under-5 deaths of Indigenous children by about 25% nationally, and between 10% and 41% across states and territories because it was based on the Indigenous status of the mother whereas the NMD was based on the Indigenous status of the baby.
To identify trends in the identification of cohort-specific deaths through data linkage, the 2003–2010 birth cohort was split into 2: the 2003–2007 and 2008–2010 birth cohorts. Tables 5.1 and 5.2 show the percentages of under-5 Indigenous deaths identified within the each of these birth cohorts (column 1, rows 5 and 6 for each jurisdiction).

30 Infant and child mortality rates for Indigenous Australians using linked and unlinked data
For almost all jurisdictions, the percentage of under-5 Indigenous deaths identified in the linked perinatal dataset as a percentage of cross-sectional deaths from the NMD was higher in the 2008–2010 birth cohort than in the 2003–2007 birth cohort.
Table 5.1: Total number of under-5 deaths of Indigenous children occurring in 2003–2015 by source of Indigenous identification: selected states and territories
Number/Birth cohort
Source of Indigenous identification in Linked Perinatal, Births, Deaths Dataset
Cross-sectional deaths (NMD)(d)
Enhanced deaths(e) PDC(a) PDC or NDI(b)
Ever Indigenous(c)
Col. 1 Col. 2 Col. 3 Col.4 Col. 5
New South Wales
Indigenous 2003–2010 211 271 304 226 290
Indigenous 2003–2007 143 170 197 155 198
Indigenous 2008–2010 68 101 107 71 92
% of cross-sectional Indigenous deaths (birth cohorts 2003–2010) 93.4 119.9 134.5
n.a.
n.a.
% of cross-sectional Indigenous deaths (birth cohorts 2003–2007) 92.3 109.7 127.1
n.a.
n.a.
% of cross-sectional Indigenous deaths (birth cohorts 2008–2007) 95.8 142.3 150.7
n.a.
n.a.
% of enhanced Indigenous deaths (birth cohorts 2003–2007) 72.2 85.9 99.5 78.3
n.a.
% of enhanced Indigenous deaths (birth cohorts 2008–2010) 73.9 109.8 116.3 77.2
n.a.
Victoria Indigenous 2003–2010 43 56 66 50 80
Indigenous 2003–2007 29 35 42 31 52 Indigenous 2008–2010 14 21 24 19 28
% of cross-sectional Indigenous deaths (birth cohorts 2003–2010) 86.0 112.0 132.0
n.a.
n.a.
% of cross-sectional Indigenous deaths (birth cohorts 2003–2007) 93.5 112.9 135.5
n.a.
n.a.
% of cross-sectional Indigenous deaths (birth cohorts 2008–2007) 73.7 110.5 126.3
n.a.
n.a.
% of enhanced Indigenous deaths (birth cohorts 2003–2007) 55.8 67.3 80.8 59.6
n.a.
% of enhanced Indigenous deaths (birth cohorts 2008–2010) 50.0 75.0 85.7 67.9
n.a.
Queensland Indigenous 2003–2010 239 319 337 366 416
Indigenous 2003–2007 96 143 153 221 247
Indigenous 2008–2010 143 176 184 145 169
% of cross-sectional Indigenous deaths (birth cohorts 2003–2010) 65.3 87.2 92.1
n.a.
n.a.
% of cross-sectional Indigenous deaths (birth cohorts 2003–2007) 43.4 64.7 69.2
n.a.
n.a.
% of cross-sectional Indigenous deaths (birth cohorts 2008–2007) 98.6 121.4 126.9
n.a.
n.a.
(continued)

Infant and child mortality rates for Indigenous Australians using linked and unlinked data 31
Table 5.1 (continued): Total number of under-5 deaths of Indigenous children occurring in 2003–2015 by source of Indigenous identification: selected states and territories
Number/Birth cohort
Source of Indigenous identification in Linked Perinatal, Births, Deaths Dataset
Cross-sectional deaths (NMD)(d)
Enhanced deaths(e) PDC(a) PDC or NDI(b)
Ever Indigenous(c)
Col. 1 Col. 2 Col. 3 Col.4 Col. 5
Queensland (continued)
% of enhanced Indigenous deaths (birth cohorts 2003–2007) 38.9 57.9 61.9 89.5
n.a.
% of enhanced Indigenous deaths (birth cohorts 2008–2010) 84.6 104.1 108.9 85.8
n.a.
South Australia
Indigenous 2003–2010 54 55 59 57 69
Indigenous 2003–2007 35 35 38 40 49
Indigenous 2008–2010 19 20 21 17 20
% of cross-sectional Indigenous deaths (birth cohorts 2003–2010) 94.7 96.5 103.5
n.a.
n.a.
% of cross-sectional Indigenous deaths (birth cohorts 2003–2007) 87.5 87.5 95.0
n.a.
n.a.
% of cross-sectional Indigenous deaths (birth cohorts 2008–2007) 111.8 117.6 123.5
n.a.
n.a.
% of enhanced Indigenous deaths (birth cohorts 2003–2007) 71.4 71.4 77.6 81.6
n.a.
% of enhanced Indigenous deaths (birth cohorts 2008–2010) 95.0 100.0 105.0 85.0
n.a.
Western Australia
Indigenous 2003–2010 187 207 211 186 213 Indigenous 2003–2007 114 128 132 123 143 Indigenous 2008–2010 73 79 79 63 70 % of cross-sectional Indigenous deaths (birth cohorts 2003–2010) 100.5 111.3 113.4
n.a.
n.a.
% of cross-sectional Indigenous deaths (birth cohorts 2003–2007) 92.7 104.1 107.3
n.a.
n.a.
% of cross-sectional Indigenous deaths (birth cohorts 2008–2007) 115.9 125.4 125.4
n.a.
n.a.
% of enhanced Indigenous deaths (birth cohorts 2003–2007) 79.7 89.5 92.3
86.0
n.a.
% of enhanced Indigenous deaths (birth cohorts 2008–2010) 104.3 112.9 112.9
90.0
n.a.
n.a. = not available.
(a) Based on the mother’s being Indigenous in the respective jurisdictional PDCs.
(b) Based on the mother’s being Indigenous in the respective jurisdictional perinatal and birth registration datasets.
(c) Based on the mother’s being Indigenous in the respective jurisdictional perinatal and birth registration datasets, and the baby being Indigenous in the NDI.
(d) Number of cross-sectional under-5 deaths derived directly from an unlinked data source, the NMD, based on the Indigenous status of the baby in the NMD.
(e) Number of enhanced under-5 deaths derived directly from the Enhanced Mortality Database. Indigenous status is based on the Indigenous status of the baby in the Enhanced Mortality Database
Source: Linked Perinatal, Births, Deaths Dataset.

32 Infant and child mortality rates for Indigenous Australians using linked and unlinked data
This was particularly the case for Queensland, where 43% and 99%, respectively, of under-5 deaths of Indigenous children were identified within the 2003–2007 and 2008–2010 birth cohorts. As noted in Chapter 4, key linkage variables were not available on the Queensland PDC until the middle of 2007. As a result, the quality of linkage between the Queensland PDC and the NDI before the middle of 2007 was not as good as for the period after 2007. This could explain the lower percentage of under-5 deaths of Indigenous children identified for the 2003–2007 birth cohorts compared with that for the 2008–2010 birth cohorts.
The very low estimates of under-5 Indigenous deaths in Victoria for the 2008–2010 birth cohort were due to issues relating to changes to the platform for the recording and collating of perinatal data, particularly during 2008 and 2009. These issues have since been resolved.
Comparing numbers of ‘adjusted’ under-5 Indigenous deaths in the linked perinatal dataset and the NMD Columns 2 and 3 of tables 5.1 and 5.2 contain what could be termed ‘adjusted’ estimates of under-5 deaths of Indigenous children based on combining Indigenous identification from the constituent datasets that were linked to create the linked perinatal dataset.
Thus, instead of basing the estimates of under-5 deaths of Indigenous children solely on the Indigenous identification of the mother in the PDC, estimates in column 2 were based on a baby’s mother being Indigenous in the PDC or in the birth registration dataset. Estimates in column 3 were based on an ‘ever-Indigenous’ algorithm, by combining information on Indigenous identification from the PDC, birth registrations and the NDI.
The ‘adjusted’ estimates in columns 2 and 3 were then compared with estimates from the Enhanced Mortality Database (column 5).
For most jurisdictions, except New South Wales (2008–2010), Queensland (2008–2010), and Western Australia (2008–2010), estimates of under-5 deaths of Indigenous children based on the Enhanced Mortality Database were higher than estimates derived from combining information on Indigenous identification from the constituent datasets in the linked perinatal dataset.
This indicates that, apart from the 2008–2010 estimates for New South Wales, Queensland and Western Australia, the linked perinatal dataset under-estimated under-5 deaths of Indigenous children, even where the estimates were based on ‘adjusted’ deaths derived from combining information on Indigenous identification in the constituent datasets of the linked perinatal data set, as described in the preceding paragraphs and in tables 5.1 and 5.2.
As can be seen in Table 5.2, estimates of under-5 deaths of Indigenous children derived from the Enhanced Mortality Database (column 5) are different from estimates based on combining information on Indigenous identification from the constituent datasets of the linked perinatal dataset (columns 2 and 3). Reasons for these differences included the quality of Indigenous identification in the datasets on which the estimates were based, as well as the cohort on which the linkage was based.
First, the cohort for the Enhanced Mortality Database was all deaths that occurred within a specified reference period, classified by age at death. The Enhanced Mortality Database was therefore based on linking records of all deaths on the NDI to their corresponding records on the National Hospital Morbidity Database and the jurisdictional PDCs. A death record was retained on the database whether or not it had a corresponding record on the National Hospital Morbidity Database and the jurisdictional PDCs.
On the other hand, the cohort for the linked perinatal dataset was all births that occurred within a specified reference period. Under-5 deaths in the linked perinatal dataset were
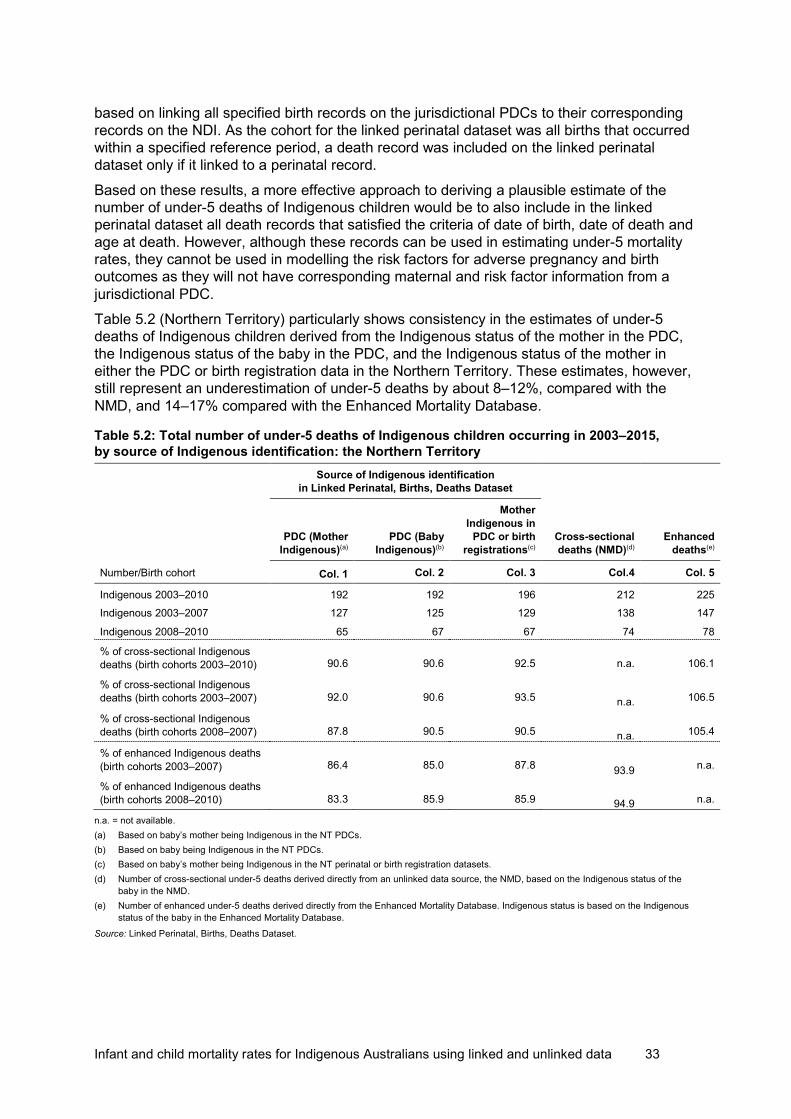
Infant and child mortality rates for Indigenous Australians using linked and unlinked data 33
based on linking all specified birth records on the jurisdictional PDCs to their corresponding records on the NDI. As the cohort for the linked perinatal dataset was all births that occurred within a specified reference period, a death record was included on the linked perinatal dataset only if it linked to a perinatal record.
Based on these results, a more effective approach to deriving a plausible estimate of the number of under-5 deaths of Indigenous children would be to also include in the linked perinatal dataset all death records that satisfied the criteria of date of birth, date of death and age at death. However, although these records can be used in estimating under-5 mortality rates, they cannot be used in modelling the risk factors for adverse pregnancy and birth outcomes as they will not have corresponding maternal and risk factor information from a jurisdictional PDC.
Table 5.2 (Northern Territory) particularly shows consistency in the estimates of under-5 deaths of Indigenous children derived from the Indigenous status of the mother in the PDC, the Indigenous status of the baby in the PDC, and the Indigenous status of the mother in either the PDC or birth registration data in the Northern Territory. These estimates, however, still represent an underestimation of under-5 deaths by about 8–12%, compared with the NMD, and 14–17% compared with the Enhanced Mortality Database.
Table 5.2: Total number of under-5 deaths of Indigenous children occurring in 2003–2015, by source of Indigenous identification: the Northern Territory
Number/Birth cohort
Source of Indigenous identification in Linked Perinatal, Births, Deaths Dataset
Cross-sectional deaths (NMD)(d)
Enhanced deaths(e)
PDC (Mother Indigenous)(a)
PDC (Baby Indigenous)(b)
Mother Indigenous in
PDC or birth registrations(c)
Col. 1 Col. 2 Col. 3 Col.4 Col. 5
Indigenous 2003–2010 192 192 196 212 225 Indigenous 2003–2007 127 125 129 138 147
Indigenous 2008–2010 65 67 67 74 78
% of cross-sectional Indigenous deaths (birth cohorts 2003–2010) 90.6 90.6 92.5 n.a. 106.1
% of cross-sectional Indigenous deaths (birth cohorts 2003–2007) 92.0 90.6 93.5
n.a.
106.5
% of cross-sectional Indigenous deaths (birth cohorts 2008–2007) 87.8 90.5 90.5
n.a.
105.4
% of enhanced Indigenous deaths (birth cohorts 2003–2007) 86.4 85.0 87.8
93.9 n.a.
% of enhanced Indigenous deaths (birth cohorts 2008–2010) 83.3 85.9 85.9
94.9 n.a.
n.a. = not available. (a) Based on baby’s mother being Indigenous in the NT PDCs. (b) Based on baby being Indigenous in the NT PDCs. (c) Based on baby’s mother being Indigenous in the NT perinatal or birth registration datasets. (d) Number of cross-sectional under-5 deaths derived directly from an unlinked data source, the NMD, based on the Indigenous status of the
baby in the NMD. (e) Number of enhanced under-5 deaths derived directly from the Enhanced Mortality Database. Indigenous status is based on the Indigenous
status of the baby in the Enhanced Mortality Database.
Source: Linked Perinatal, Births, Deaths Dataset.

34 Infant and child mortality rates for Indigenous Australians using linked and unlinked data
Tasmania and the Australian Capital Territory Because of the small Indigenous population and associated small number of deaths in Tasmania and the Australian Capital Territory, a detailed analysis of the number of under-5 Indigenous deaths across the 2 jurisdictions was not undertaken. Table 5.3 summarises broad information that is able to be published.
In Tasmania, for instance, fewer than 5 under-5 Indigenous deaths were obtained from the linked perinatal dataset, based on the Indigenous status of the mother in the PDC and birth registrations, while a similar number of under-5 Indigenous cross-sectional deaths were also derived from the NMD.
Table 5.3: Number of under-5 Indigenous deaths identified in Linked, Perinatal, Birth, Death Dataset that occurred in 2003–2015 among 2003–2010 birth cohorts: Tasmania and the ACT
Jurisdiction Data source for Indigenous identification from Linked Perinatal, Birth Dataset
Cross-sectional deaths from
NMD(b, c)
PDC(a)
birth registrations(a)
PDC or birth registrations(a)
Tasmania 5 n.p. 8 n.p.
Australian Capital Territory 13 8 15 16
n.p. = not publishable. (a) Based on Indigenous status of mother in the applicable dataset. (a) Number of cross-sectional under-5 deaths of Indigenous children derived directly from an unlinked independent data source such as the
NMD. (b) Enhanced number of under-5 deaths derived directly from the Enhanced Mortality Database. (c) See tables 4.2 and 4.3.
Source: Linked Perinatal, Birth, Death Dataset.
In the Australian Capital Territory, 13 and 8 under-5 Indigenous deaths, respectively, were obtained from the linked perinatal dataset (based on the Indigenous status of the mother in the PDC) and birth registrations, while 15 under-5 Indigenous cross-sectional deaths were derived from the NMD.
The estimated number of deaths are too few and inconsistent for any clear conclusions to be drawn from them.
Overall, the analysis in tables 5.1 and 5.2 suggests that, to derive more plausible estimates of Indigenous under-5 deaths, additional datasets should be linked to create the linked perinatal dataset. Including additional datasets will improve the algorithms that can be used to enhance the quality of Indigenous identification on the death records. Indigenous identification on the PDC and NDI alone will be insufficient to identify all under-5 deaths of Indigenous children.
To improve the quality of information on Indigenous identification on under-5 death records, the datasets to be linked to create the linked perinatal dataset should also include hospital data, such as Admitted Patient Care and Emergency Department data. These datasets were used to create the Enhanced Mortality Database and were found to be effective for developing algorithms to identify Indigenous deaths.

Infant and child mortality rates for Indigenous Australians using linked and unlinked data 35
6 Cause of death One objective of creating the linked perinatal dataset is to determine the causes of under-5 mortality and the maternal risk factors associated with particular causes of death at particular ages at death.
This undertaking requires complete and accurate classification of all under-5 deaths according to cause of death. While the birth cohorts for this analysis are from jurisdictional PDCs, the fact of death and cause of death information, including age at death, is from the NDI. The availability of age at death and Indigenous status information on the linked perinatal dataset has allowed all under-5 deaths to be examined by Indigenous status and specific cause of death at specific ages at death.
Records with missing cause of death information Any record with a corresponding record on the NDI is deemed to represent an under-5 death. Almost all records on the linked perinatal data set that had a corresponding record on the NDI also had information on cause of death.
Nationally, among all under-5 deaths that occurred between 2003 and 2015, just under 10% and about 7% of Indigenous and non-Indigenous under-5 death records, respectively, did not have information on cause of death. For several individual jurisdictions, however, more than 95% of identified under-5 death records had information on cause of death.
The percentages of under-5 death records with missing cause of death information were slightly higher for Indigenous than for non-Indigenous deaths across all jurisdictions, except for Queensland, where the percentage of under-5 death records with missing cause of death information was higher for non-Indigenous Australians by about 0.1%.
Records with missing cause of death information also had other fact of death information missing, such as date of death, age at death, and Indigenous status. This could mean that those records were not able to be linked to the NDI. This possible explanation is explored further in this section.
As described in Chapter 2 ‘Data and Methods’, the NDI is a fact of death file used for data linkage purposes. It contains mostly personal identifiers and demographic information on sex, date of birth, date of death, age at death, and an address indicator. Information on cause of death is not originally contained on the NDI.
Cause of death information is available on the NMD, and is added to the NDI by linking the NDI to the NMD. Although the source of both datasets is the Australian Coordinating Registry, the quality of data on the 2 collections is different.
The data used in creating the NMD is provided by the Australian Bureau of Statistics to the AIHW on a yearly basis. This dataset may contain record updates that may have occurred during the year, including corrections to, and additions to, demographic information such as sex, date of birth, date of death, age at death, place of death or address of usual residence of the deceased at the time of death, and so on.
On the other hand, the fact of death information used in creating the NDI is provided to the AIHW by the Australian Coordinating Registry each month. Compared with the NMD, the fact of death file has a much narrower window of opportunity for updates to be effected before it is sent to the AIHW. It may thus contain more provisional data than the NMD. Jurisdictional registries may choose to include updated information in a later month’s data supply to the

36 Infant and child mortality rates for Indigenous Australians using linked and unlinked data
AIHW, bringing this update to the AIHW’s attention. Where this does not happen, the NDI may contain information that is not completely up to date.
As well, the NMD has been carefully processed and corrected, and is regarded as containing more correct information, such as on Indigenous status, than the NDI. Linkage of the NDI to the NMD enables fact of death information on the NDI to be validated against that on the NMD, and to include further information, such as cause of death, not available on the NDI.
Since the NMD does not contain names of the deceased, it is linked deterministically to the NDI via a common identifier called ‘Mort_ID’. Though the NDI and the NMD are from the same source, they do not link perfectly. Between 2003 and 2010, up to a few thousand NDI records each year could not be linked to the NMD. The number of unlinked NDI records has reduced since 2003 to about 1,000 records a year, out of 130,000 to 160,000 records a year. NDI records that do not link to the NMD would therefore not carry information on cause of death or updated fact of death information, such as sex, date of birth, date of death, age at death, Indigenous status, and address indicator.
This analysis revealed that, in New South Wales, nearly 29% of Indigenous under-5 death records and 15.3% of non-Indigenous under-5 death records had missing cause of death information, while in the Northern Territory, 10.7% of Indigenous and 2.7% of non-Indigenous under-5 death records had missing cause of death information. In the other jurisdictions, 1.7% to 6.6% of Indigenous under-5 death records and 1.1% to 4.7% of non-Indigenous under-5 death records had missing cause of death information.
All records with missing cause of death information were confirmed to belong to babies who were born alive but died before their fifth birthday. It was also observed that all records on the NMD during the reference period had cause of death information. Cause of death information could therefore have been obtained for all perinatal under-5 death records if they had been linked to the NMD. There are therefore 2 possible reasons for the missing cause of death information on some under-5 perinatal death records:
• Some NDI records could not link to a corresponding record on the NMD: if an NDI record could not be linked to a corresponding record on the NMD, cause of death information could not be obtained for that particular record and could not be added to the linked perinatal dataset.
• Some perinatal under-5 death records could not link to a corresponding record on the NDI: this could happen because of a combination of factors, including missing, incomplete, inconsistent or inaccurate demographic information on either or both datasets. Cause of death information cannot be obtained if a perinatal record could not be linked to the NDI.
The second scenario would likely explain the higher percentages of Indigenous records with missing cause of death information, as Indigenous records are more likely than non-Indigenous records to have missing, incomplete, inconsistent or inaccurate linkage variables.
A similar scenario was observed in the Census Data Enhancement study, where about 29% of Aboriginal and Torres Strait Islander deaths as recorded on the death registration form could not be linked to a Census record (ABS 2018).
The accurate analysis of cause of death information is adversely affected in jurisdictions where cause of death information is missing for a large number of records. Records with missing cause of death information may also have other key items of information missing. Where this occurs, it will also not be known whether missing cause of death information is selective of certain characteristics, and to what cause of death categories the records with missing cause of death information would belong if that information were available.

Infant and child mortality rates for Indigenous Australians using linked and unlinked data 37
Age at death Table 6.1 presents attempts to answer some of these questions by examining the age at death of the under-5 deaths that had missing cause of death information.
Age at death information was available for all under-5 death records. This information was estimated using date of birth and date at death information available on the NDI and further information available on the PDC.
Across all jurisdictions, higher proportions of babies who died within 48 hours of birth also had missing cause of death information compared with babies who did not die within 48 hours after birth. This scenario was observed for both Indigenous and non-Indigenous deaths. In all cases, however, higher proportions of Indigenous than non-Indigenous under-5 deaths had missing cause of death information.
The jurisdiction with the highest proportions of under-5 deaths with missing cause of death information was New South Wales, where 29% and 15%, respectively, of all Indigenous and non-Indigenous under-5 deaths had missing cause of death information. Specifically, however, 50% and 27%, respectively, of under-5 Indigenous and non-Indigenous deaths that occurred within 48 hours after birth did not have cause of death information.
There were, however, jurisdictions where very low proportions of under-5 deaths that happened within 48 hours after birth also had missing cause of death information. These jurisdictions include Victoria, Queensland and South Australia, where less than 10% of both under-5 Indigenous and non-Indigenous deaths that happened within 48 hours after birth had missing cause of death information.
One could also compare the number of under-5 deaths occurring within 48 hours with missing cause of death information as a percentage of all under-5 deaths with missing cause of death information. In Queensland, for instance, of all the Indigenous and non-Indigenous under-5 deaths that had missing cause of death information, 100% and 97%, respectively, occurred within 48 hours after birth.
In Western Australia, of all the Indigenous and non-Indigenous under-5 deaths that had missing cause of death information, 85% and 89%, respectively, occurred within 48 hours after birth. Corresponding figures for New South Wales are 80% and 87%, respectively.
The above analysis shows that babies who die soon after birth, especially in the first 48 hours after birth, are likely to have missing cause of death information, although the exact mechanism through which this occurs is not immediately obvious.

38 Infant and child mortality rates for Indigenous Australians using linked and unlinked data
Table 6.1: Percentage of under-5 deaths that occurred within 48 hours of birth according to cause of death status, 2003–2015
All under-5 deaths Under-5 deaths occurring within 48 hours of birth
Indigenous Non-Indigenous/Other
Indigenous Non-Indigenous/Other
New South Wales under-5 deaths 211 3,235 99 1,584
under-5 deaths with missing COD 61 493 49 429
% under-5 deaths with missing COD 28.9 15.2 49.5 27.1
under-5 deaths occurring within 48 hours with missing COD as a % of all under-5 deaths with missing COD
80.3 87.0
Victoria under-5 deaths 43 2,226 18 908
under-5 deaths with missing COD n.p. 38 n.p. 25 % under-5 deaths with missing COD n.p. 1.7 n.p. 2.8 under-5 deaths occurring within 48 hours with missing COD as a % of all under-5 deaths with missing COD
50.0 65.8 Queensland
under-5 deaths 237 2,204 99 950
under-5 deaths with missing COD 8 60 8 58 % under-5 deaths with missing COD 3.4 2.7 8.1 6.1 under-5 deaths occurring within 48 hours with missing COD as a % of all under-5 deaths with missing COD
100.0 96.7
South Australia under-5 deaths 53 597 12 229
under-5 deaths with missing COD n.p. 7 n.p. n.p.
% under-5 deaths with missing COD n.p. 1.2 n.p. n.p.
under-5 deaths occurring within 48 hours with missing COD as a % of all under-5 deaths with missing COD
n.p. n.p.
Western Australia
under-5 deaths 187 792 50 251
under-5 deaths with missing COD 13 37 11 33
% under-5 deaths with missing COD 7.0 4.7 22.0 13.1
under-5 deaths occurring within 48 hours with missing COD as a % of all under-5 deaths with missing COD
84.6 89.2
Northern Territory under-5 deaths 192 78 75 31
under-5 deaths with missing COD 20 n.p. 12 n.p.
% under-5 deaths with COD missing 10.4 n.p. 16.0 n.p.
under-5 deaths occurring within 48 hours with missing COD as a % of all under-5 deaths with missing COD
60.0 n.p.
n.p. = not publishable.
Source: Linked Perinatal, Birth, Death Dataset.
Infant and child mortality rates for Indigenous Australians using linked and unlinked data 39
In summary, cause of death information was available for up to 95% of both Indigenous and non-Indigenous under-5 death records in Victoria, Queensland, South Australia and Western Australia. In the Northern Territory, cause of death information was available for up to 90% of under-5 Indigenous death records and just over 95% of non-Indigenous under-5 death records.
The higher percentages of New South Wales perinatal records with missing cause of death information could be due to data linkage problems involving both the NDI and NMD. The quality of linkage variables is more likely to have a bigger impact in bigger datasets than in smaller datasets, due to the complexity of linkage, the many more possible matches, and the added difficulty of using clerical or manual review to resolve inconsistencies and borderline matches.
Further analysis revealed that the quality of linkage variables on the PDC and the NDI has improved considerably since 2010 and is continuing to improve. Linkage between the NDI and NMD is also improving, with fewer NDI records not being able to be linked to the NDI compared with the period before 2010.
The linked perinatal dataset, if based on the PDC, birth registrations and the NDI from 2010, can be used to estimate cohort-specific under-5 mortality rates. It can also be used to examine the cause of death of all under-5 deaths, as well as the risk factors associated with under-5 deaths and the cause of under-5 deaths. The linked perinatal dataset is therefore a very powerful resource that can be used to examine the factors associated with the gap in under-5 deaths between Indigenous and non-Indigenous babies.

40 Infant and child mortality rates for Indigenous Australians using linked and unlinked data
7 Pregnancy and birth outcomes The key purpose of creating the Linked Perinatal Birth, Death Dataset project was to test the feasibility of using the linked dataset to estimate cohort-specific infant and child mortality rates. A second objective of the project was to create a national Linked Perinatal, Birth, Death Dataset containing information that would enable AIHW to answer some key questions on differences in pregnancy and birth outcomes—particularly infant and child mortality—between babies born to Indigenous and non-Indigenous women.
Factors associated with the disparities in pregnancy and birth outcomes between Indigenous and non-Indigenous women are complex. They include maternal age, socioeconomic status, pre-pregnancy health status (for example, obesity, and chronic illnesses such as hypertension and diabetes), access to culturally appropriate maternal and child health services, number of previous pregnancies, timely access to antenatal care, and other factors such as nutrition and smoking during pregnancy (Lewis et al. 2009; Middleton 2009; NSW Health 2003).
These factors do not operate in isolation. They interact at different stages of the pregnancy—before its onset, at its onset, during pregnancy and at delivery—to affect pregnancy and birth outcomes (Utz 2014).
There is currently no one data source that contains relevant information on health risk factors as well as relevant information across the various demographic, health, social, environmental and contextual domains associated with pregnancy and birth outcomes. There are also no national sources that can describe the broader measures of child health and wellbeing other than by linking perinatal, births and deaths data.
Only a multi-sectoral national dataset with linked information across multiple domains can provide the required comprehensive data to analyse the complex factors associated with infant and child health outcomes nationally, and between and within jurisdictions.
Because of the complexity and interactions between the factors associated with pregnancy and birth outcomes, understanding how these factors affect disparities in pregnancy and birth outcomes between Indigenous and non-Indigenous mothers and babies requires the use of appropriate regression modelling to control for the effects of other risk factors as well as interactions and confounding factors.
Five pregnancy and birth outcomes were identified: • perinatal death, consisting of:
– stillbirth, and – neonatal death
• pre-term birth • small for gestation age.
A number of contextual factors—as well as demographic and health characteristics of women, their antenatal behaviour, pregnancy and birth history, complications of pregnancy and factors associated with labour—have been identified as potential risk factors or explanatory variables for the specified pregnancy and birth outcomes.
These explanatory variables will be included in the model to determine if they could explain the differences in the levels of pregnancy and birth outcomes among Indigenous women.
Infant and child mortality rates for Indigenous Australians using linked and unlinked data 41
For this report, these risk factors are classified as follows:
• contextual factors such as: – remoteness (of location), that is, whether a woman was usually resident in a major
city, regional area or remote area during her pregnancy – housing – proximity to services – availability of transport
• demographic factors such as: – age of the mother at the end of the pregnancy – marital status – previous pregnancy and birth outcomes, such as:
• previous stillbirths • number of previous pregnancies resulting in a live birth
• modifiable health risk factors such as: – timely access to antenatal care – pre-pregnancy BMI – smoking and alcohol consumption during pregnancy – pre-existing diabetes – pre-existing or chronic hypertension (high blood pressure)
• pregnancy-related complications such as: – gestational diabetes (diabetes that occurs during pregnancy) – pregnancy-induced hypertension or blood pressure disorders that occur during
pregnancy (e.g. gestational hypertension, pre-eclampsia and eclampsia) – antepartum haemorrhage (defined to include placenta praevia, placental abruption,
threatened abortion) • pregnancy outcomes such as:
– duration of gestation (preterm or not-preterm birth) – birthweight.
Data availability Success in modelling pregnancy and birth outcomes and their associated risk factors would depend, among other things, not only on model selection and its implementation, but also on the availability, completeness, accuracy and consistency of the measurement of the identified risk factors and the pregnancy and birth outcomes. The adverse pregnancy and birth outcomes of interest are stillbirth, neonatal death, preterm birth and low birthweight.
Table 7.1 shows selected key explanatory variables or risk factors for adverse pregnancy and birth outcomes that were available on each jurisdictional PDC. The entry for each risk factor shows the dates when data for each risk factor became available in each jurisdictional PDC.
While many of the risk factors were available for all jurisdictions across all birth cohorts during the period in scope (2003–2010), a few risk factors were available for all jurisdictions but not for all birth cohorts, while others were available for some jurisdictions and not for others.

42 Infant and child mortality rates for Indigenous Australians using linked and unlinked data
Most of these risk factors have however become available since 2009, and would make the modelling of risk factors possible for each state and territory, as well as nationally.
The column for Australia is colour-coded to show for how many jurisdictions data were available. The table shows that during the period in scope, key explanatory variables were not available for all birth cohorts, or for all jurisdictions, to enable similar models to be run for all jurisdictions or for Australia as a whole. This means that separate models would have to be run for each jurisdiction, depending on the risk factors for which data were available. The importance of major risk factors in the models would therefore vary for each jurisdiction, and would depend on the types of risk factors available in the respective jurisdictional PDCs.
Contextual factors Information on location was available for all jurisdictions across all birth cohorts, and would enable analysis to be carried out according to remoteness area, that is, whether a woman’s location was a major city, inner regional area, outer regional area, remote area or very remote area.
Since 2010, further geographical information, such as Statistical Area (e.g. SA2), has become available on most jurisdictional PDCs. SA2 data would enable additional analysis to be undertaken according to Indigenous regions (IREGs) and socioeconomic disadvantage (e.g. Index of Relative Socio-economic Disadvantage or IRSD).
Demographic factors Data on demographic factors were available for all jurisdictions during the period in scope. These include maternal age at delivery, parity, number of previous pregnancies, number of previous live births and number of previous stillbirths.
Information on marital status was available for all jurisdictions except Western Australia, which continues to be the only jurisdiction that does not provide information on marital status on its PDC.
Modifiable health risk factors Data on most modifiable health risk factors, such as antenatal care, pre-pregnancy body mass index, pre-existing diabetes mellitus, chronic hypertension, and smoking during pregnancy, were available across all birth cohorts for nearly all jurisdictions, with the exception of Victoria. Data on pre-existing diabetes mellitus and chronic hypertension were not available for Victoria during the period in scope, and continue to be unavailable.
Data on pre-existing diabetes and chronic hypertension were not available on the New South Wales PDC during the period in scope, but had become available from 2014. Data on pre-existing diabetes and chronic hypertension are however still unavailable on the Victoria PDC. This means that Victoria may have to be excluded from any modelling at the national level, since diabetes and hypertension are major risk factors associated with adverse pregnancy and birth outcomes such as stillbirths, neonatal death, preterm birth and low birthweight.
While data on smoking during pregnancy were available for all jurisdictions, data on alcohol consumption during pregnancy were only available for Tasmania, the Northern Territory and the ACT.

Infant and child mortality rates for Indigenous Australians using linked and unlinked data 43
Pregnancy-related complications Data on key pregnancy complications such as gestational diabetes, gestational hypertension, preeclampsia and eclampsia were available for all jurisdictions except New South Wales and Victoria. These data became available for New South Wales from 2014, but are still not available for Victoria.
Data on other pregnancy complications such as placental abruption, placenta praevia, threatened abortion and antepartum haemorrhage are also available for nearly all jurisdictions but not for New South Wales.
The absence of data on antepartum haemorrhage, and its components, on the New South Wales PDC means that New South Wales may have to be excluded from any modelling of adverse pregnancy and birth outcomes at the national level. This is because antepartum haemorrhage and its components are major risk factors associated with adverse pregnancy and birth outcomes such as stillbirths, neonatal death, preterm birth and low birthweight.
Pregnancy outcomes Data on pregnancy outcomes such as birth status, birthweight, duration of gestation, fetal distress, number of antenatal visits, ‘Apgar I minute’ and ‘Apgar 5 minutes’ were available for all jurisdictions during the period in scope, and continue to be available for all jurisdictions.
Although data on number of antenatal visits are available for all jurisdictions, they were not available for all jurisdictions during the period in scope. Data on number of antenatal visits became available for most jurisdictions from 2012 (New South Wales, South Australia, Western Australia, and Tasmania), for the Australian Capital Territory from 2011, and for the Northern Territory from 2010.
A positive scenario is that more of the key risk factors for modelling adverse pregnancy outcomes are becoming available across all jurisdictions, and are being collected in a uniform manner. This will be beneficial when the linked perinatal dataset project is converted into an ongoing collection.

44 Infant and child mortality rates for Indigenous Australians using linked and unlinked data
Table 7.1: Explanatory variables in jurisdictional PDCs, 2003–2010
Risk factors NSW Vic Qld SA WA Tas NT ACT Australia
Contextual factors
Location (Remoteness) 2003–2010 2003–2010 2003–2010 2003–2010 2003–2010 2003–2010 2003–2010 2003–2010 N,V,Q,S,W,T,NT,A
Demographic factors
Maternal age 2003–2010 2003–2010 2003–2010 2003–2010 2003–2010 2003–2010 2003–2010 2003–2010 N,V,Q,S,W,T,NT,A
Marital status 2003–2010 2003–2010 2003–2010 2003–2010 n.a. 2003–2010 2003–2010 2003–2010 N,V,Q,S,NT,A
No. of previous pregnancies 2003–2010 2003–2010 2003–2010 2003–2010 2003–2010 2003–2010 2003–2010 2003–2010 N,V,Q,S,W,T,NT,A
No. of previous livebirths n.a. 2003–2010 2003–2010 2003–2010 2003–2010 n.a. n.a. n.a. V,Q,S,W.
No. of previous stillbirths n.a. 2003–2010 2003–2010 2003–2010 2003–2010 2003–2010 n.a. n.a. V,Q,S,W,T
Modifiable health risk factors Gest. age at first antenatal care 2003–2010 2009–2010 2009–2010 2008–2010 2003–2010 2003–2010 2003–2010 2003–2010 N,V,Q,S,W,T,NT,A
Pre-pregnancy BMI 2003–2010 2009–2010 2008–2010 2007–2010 2003–2010 2003–2010 2003–2010 2003–2010 N,V,Q,S,W,T,NT,A
Smoking during pregnancy 2003–2010 2003–2010 2003–2010 2003–2010 2003–2010 2003–2010 2003–2010 2003–2010 N,V,Q,S,W,T,NT,A
Smoking (>20 weeks) 2003–2010 2003–2010 2009–2010 2003–2010 2003–2010 2003–2010 2010 2003–2010 N,V,Q,S,W,T,NT,A
Alcohol during pregnancy n.a. n.a. n.a. n.a. n.a. From 2009 From 2014 From 2009 T,NT,A
Pre-existing diabetes From 2014 n.a. 2003–2010 2003–2010 2003–2010 2003–2010 2003–2010 2003–2010 N,Q,S,W,T,NT,A
Pre-existing hypertension From 2014 n.a. 2003–2010 2003–2010 2003–2010 2003–2010 2003–2010 2003–2010 N,Q,S,W,T,NT,A
Pregnancy-related complications Gestational diabetes From 2014 n.a. 2003–2010 2003–2010 2003–2010 2003–2010 2003–2010 2003–2010 N,Q,S,W,T,NT,A
Gestational hypertension From 2014 n.a. 2003–2010 2003–2010 2003–2010 2003–2010 n.a. 2003–2010 N,Q,S,W,T,NT,A
Pre-eclampsia From 2014 n.a. n.a. 2003–2010 2003–2010 2003–2010 2003–2010 2003–2010 N,V,S,W,T,NT,A.
Eclampsia From 2014 n.a. n.a. 2003–2010 2003–2010 2003–2010 2003–2010 2003–2010 N,V,S,W,T,NT,A.
Placental abruption n.a. 2003–2008 2003–2010 2003–2010 2003–2010 2003–2010 2003–2010 2003–2010 V,Q,S,W,T,NT,A
Placenta praevia n.a. 2003–2008 2003–2010 2003–2010 2003–2010 2003–2010 n.a. 2003–2010 V,Q,S,W,T,A
Threatened abortion n.a. 2003–2008 n.a. 2003–2010 2003–2010 n.a. n.a. n.a. V,S,W,
Antepartum haemorrhage n.a. 2003–2008 2003–2010 2003–2010 2003–2010 2003–2010 2003–2010 2003–2010 V,Q,S,W,T,NT,A
(continued)

Infant and child mortality rates for Indigenous Australians using linked and unlinked data 45
Table 7.1 (continued): Explanatory variables in jurisdictional PDCs, 2003–2010
Risk Factors NSW Vic Qld SA WA Tas NT ACT Australia
Pregnancy outcomes
Birth status 2003–2010 2003–2010 2003–2010 2003–2010 2003–2010 2003–2010 2003–2010 2003–2010 N,V,Q,S,W,T,NT,A
Birth weight 2003–2010 2003–2010 2003–2010 2003–2010 2003–2010 2003–2010 2003–2010 2003–2010 N,V,Q,S,W,T,NT,A
Duration of gestation 2003–2010 2003–2010 2003–2010 2003–2010 2003–2010 2003–2010 2003–2010 2003–2010 N,V,Q,S,W,T,NT,A
Fetal distress n.a. n.a. 2003–2010 2003–2010 n.a. n.a. 2003–2010 n.a. Q,S,NT.
Number of antenatal visits From 2012 From 2016 From 2007 From 2012 From 2012 From 2012 From 2010 From 2011 N,V,Q,S,W,T,NT,A
Apgar1 2003–2010 2003–2010 2003–2010 2003–2010 2003–2010 2003–2010 2003–2010 2003–2010 N,V,Q,S,W,T,NT,A
Apgar5 2003–2010 2003–2010 2003–2010 2003–2010 2003–2010 2003–2010 2003–2010 2003–2010 N,V,Q,S,W,T,NT,A
n.a. = data not available. Available for all jurisdictions
* Incomplete data for this period. Available for 6–7 jurisdictions
N,V,Q,S,W,T,NT A are the first letter/s of the various jurisdictions. Available for 4–5 jurisdictions
Source: Linked Perinatal, Birth, Death Dataset.
Available for 0–3 jurisdictions

46 Infant and child mortality rates for Indigenous Australians using linked and unlinked data
8 Cohort-specific under-5 mortality One key objective of the linked perinatal dataset is to use the linked dataset to estimate cohort-specific under-5 death rates by identifying under-5 deaths that occurred to specific perinatal records within each birth cohort.
Appendix A discusses issues associated with estimating cohort-specific under-5 mortality with and without the use of linked data, while Appendix B compares methods of estimating cohort-specific under-5 mortality rates and cross-sectional or period under-5 mortality rates.
The robustness of cohort-specific under-5 mortality rates based on linked data depends on the quality of the linkage of perinatal and birth registration records to their corresponding death registration records, and the extent to which registered death records can be tracked back to the birth cohorts from which the deaths occurred.
Trends in cohort-specific under-5 mortality rates Table 8.1 shows cumulative cohort-specific under-5 mortality rates per 100,000 live births by year of death among Indigenous babies born between 2003 and 2010. These estimates are plotted in Figure 8.1, along with cohort-specific under-5 mortality rates among non-Indigenous babies, which were estimated separately.
The estimates in figures 8.1 and 8.2 are for illustrative purposes only. They are intended as a tool to investigate the usefulness of estimating cohort-specific under-5 mortality rates through the use of linked data. These estimates should not be taken as indicative of the actual under-5 mortality rates in Australia and the jurisdictions for which the estimates are presented.
For each birth cohort, figures 8.1 and 8.2 show 5 data points representing the number of babies, out of 100,000 babies in each birth cohort, who died before their first, second, third, fourth or fifth birthday. Each data point also shows the year of death, or the years when the death occurred.
For the 2003 birth cohort, for instance, the 5 data points represent death rates during the periods 2003–2004, 2004–2005, 2005–2006, 2006–2007 and 2007–2008. For the 2010 birth cohort, the 5 data points represent deaths that occurred during the period 2010–2011, 2011–2012, 2012–2013, 2013–2014 and 2014–2015.
The trends in cohort-specific under-5 mortality rates are now described separately for each jurisdiction. There are no separate estimates for Tasmania and the Australian Capital Territory because of the small Indigenous population and the small number of Indigenous deaths in these 2 jurisdictions. Estimates for Tasmania and the Australian Capital Territory are, however, incorporated into the estimates for Australia as a whole.
With very few exceptions, up to 85% of all under-5 deaths that occurred in each birth cohort and in each jurisdiction occurred before the baby’s first birthday. The first year of life is therefore a crucial determinant of the chances of a baby’s surviving till age 5.
The estimation of cohort-specific under-5 mortality rates provides a more meaningful estimate of infant and child death than period rates based on cross-sectional data, because cohort-specific mortality rates show actual death rates within actual birth cohorts.
Because cohort-specific under-5 mortality rates are based on the mortality experience of actual birth cohorts, they are more informative when used to describe mortality trends. They demonstrate the mortality experience of different birth cohorts and how mortality experience varies between birth cohorts.

Infant and child mortality rates for Indigenous Australians using linked and unlinked data 47
Trends for Australia • For all birth cohorts, Indigenous cohort-specific under-5 mortality rates were about
3 times as high as the rates for non-Indigenous babies. – Cohort-specific under-5 mortality rates for babies born in 2003 were nearly 3 times
as high among Indigenous babies (1,317 per 100,000 live births) as among non-Indigenous babies (451 per 100,000 live births: see Appendix Table A1).
• Cohort-specific under-5 mortality rates declined with nearly every successive birth cohort. Cohort-specific Indigenous under-5 mortality rates were higher for the 2003 birth cohort than for any other, and lower for the 2010 birth cohort than for any other.
• Between 2003 and 2015, cohort-specific under-5 mortality rates declined faster among Indigenous than among non-Indigenous babies. – In the 2003 birth cohort, for example, the number of Indigenous babies who died
before their fifth birthday was 1,317 per 100,000 live births, compared with 1,102 per 100,000 live births among the 2010 Indigenous birth cohort, a decline of 16.3%.
– The corresponding decline among non-Indigenous babies was only 3.2%. • Because of the bigger decline in mortality rates among Indigenous babies, the gap
between Indigenous and non-Indigenous cohort-specific under-5 mortality rates for the latest birth cohorts (2008–2010) was narrower than for the earliest birth cohorts.
Figure 8.1: Cumulative cohort-specific under-5 mortality rates, 2003–2015, per 100,000 live births born to Indigenous and non-Indigenous mothers, by birth cohort and year of death, Australia
BC = birth cohort.
Source: Linked Perinatal, Birth, Dataset.
0200400600800
1,0001,2001,4001,6001,8002,000Rate
Year of death
2003 BC 2004 BC 2005 BC2006 BC 2007 BC 2008 BC2009 BC 2010 BC
Indigenous
0200400600800
1,0001,2001,4001,6001,8002,000Rate
Year of death
2003 BC 2004 BC 2005 BC2006 BC 2007 BC 2008 BC2009 BC 2010 BC
Non-Indigenous

48 Infant and child mortality rates for Indigenous Australians using linked and unlinked data
Trends for each jurisdiction Cohort-specific under-5 mortality rates for New South Wales, Victoria, Queensland, South Australia, Western Australia and the Northern Territory are shown in Figure 8.2.
New South Wales • Cumulative cohort-specific under-5 mortality rates for babies born during 2003–2010
were about 3 times as high for Indigenous babies as for non-Indigenous babies. – Cohort-specific under-5 mortality rates for babies born in 2003 were about 1,300 per
100,000 Indigenous babies compared with 470 per 100,000 non-Indigenous babies. • Although variable, cumulative cohort-specific under-5 mortality rates for both Indigenous
and non-Indigenous babies declined across nearly all successive birth cohorts. – Indigenous babies born between 2003 and 2007 experienced the highest under-5
mortality rates while those born from 2008 experienced the lowest rates. • Indigenous babies experienced much bigger declines in cohort-specific under-5 mortality
rates than did non-Indigenous babies. – By 2010, Indigenous under-5 mortality rates had declined to about 600 per 100,000
live births (from about 1,300 in 2003). – By 2010, non-Indigenous under-5 mortality rates had also declined to about 430 per
100,000 live births (from a level of about 470 in 2003). – Because of the much bigger declines in Indigenous than non-Indigenous under-5
mortality rates, the gap in cohort-specific under-5 mortality rates between Indigenous and non-Indigenous women appear to have narrowed during the reference period.
Victoria • Indigenous cohort-specific under-5 mortality rates for Victoria are based on very few
deaths (see Table 4.5) because of the small size of the Indigenous population in Victoria. In each birth cohort, the cumulative number of deaths at each age was fewer than 10 in nearly all cases, with several cells containing fewer than 5 deaths. – A low base for estimating under-5 mortality rates could lead to uncertainty about the
true level and trends in under-5 death rates as small changes in the number of deaths could have substantial impacts on the rates.
• The estimates for Victoria exclude the 2008 and 2009 birth cohorts because of data issues associated with changes to the platform for compiling perinatal records during 2008 and 2009.
• Mortality rates for babies born between 2003 and 2007 were nearly 3 times as high among Indigenous as among non-Indigenous babies. – Cohort-specific under-5 mortality rates were 1,200 per 100,000 live births among
Indigenous babies compared with 420 among non-Indigenous babies. • Cohort-specific under-5 mortality rates declined for both Indigenous and non-Indigenous
babies. The declines were much bigger for Indigenous than for non-Indigenous babies, leading to a narrowing of the gap between Indigenous and non-Indigenous under-5 mortality rates. For instance: – Cohort-specific under-5 mortality rates among the 2003–2005 birth cohorts were
nearly 3 times as high among Indigenous babies as among non-Indigenous babies. – Among the 2010 birth cohort, cohort-specific under-5 mortality rates were less than
twice as high among Indigenous babies as among non-Indigenous babies.

Infant and child mortality rates for Indigenous Australians using linked and unlinked data 49
Figure 8.2: Cumulative cohort-specific under-5 mortality rates, 2003–2015, per 100,000 live births born to Indigenous and non-Indigenous mothers, by birth cohort, year of death and state of usual residence
(continued)
0200400600800
1,0001,2001,4001,6001,8002,000Rate
Year of death
2003 BC 2004 BC 2005 BC2006 BC 2007 BC 2008 BC2009 BC 2010 BC
New South Wales, Indigenous
0200400600800
1,0001,2001,4001,6001,8002,000Rate
Year of death
2003 BC 2004 BC 2005 BC2006 BC 2007 BC 2008 BC2009 BC 2010BC
New South Wales, non-Indigenous
0200400600800
1,0001,2001,4001,6001,8002,000Rate
Year of death
2003 BC 2004 BC 2005 BC2006 BC 2007 BC 2010 BC
Victoria, Indigenous
0200400600800
1,0001,2001,4001,6001,8002,000Rate
Year of death
2003 BC 2004 BC 2005 BC2006 BC 2007 BC 2008 BC
Victoria, non-Indigenous
0200400600800
1,0001,2001,4001,6001,8002,000Rate
Year of death
2008 BC 2009 BC 2010 BC
Queensland, Indigenous
0200400600800
1,0001,2001,4001,6001,8002,000Rate
Year of death
2008 BC 2009 BC 2010 BC
Queensland, non-Indigenous

50 Infant and child mortality rates for Indigenous Australians using linked and unlinked data
Figure 8.2 (continued): Cumulative cohort-specific under-5 mortality rates, 2003–2015, per 100,000 live births born to Indigenous and non-Indigenous mothers, by birth cohort, year of death and state of usual residence
0200400600800
1,0001,2001,4001,6001,8002,000Rate
Year of death
2003 BC 2004 BC 2005 BC2006 BC 2007 BC 2008 BC2009 BC 2010 BC
South Australia, Indigenous
0200400600800
1,0001,2001,4001,6001,8002,000
Rate
Year of death
2003 BC 2004 BC 2005 BC2006 BC 2007 BC 2008 BC2009 BC 2010 BC
South Australia, non-Indigenous
0200400600800
1,0001,2001,4001,6001,8002,000Rate
Year of death
2003 BC 2004 BC 2005 BC2006 BC 2007 BC 2008 BC2009 BC 2010 BC
Western Australia, Indigenous
0200400600800
1,0001,2001,4001,6001,8002,000Rate
Year of death
2003 BC 2004 BC 2005 BC2006 BC 2007 BC 2008 BC2009 BC 2010 BC
Western Australia, non-Indigenous
0200400600800
1,0001,2001,4001,6001,8002,000Rate
Year of death
2004 BC 2005 BC 2006 BC2007 BC 2008 BC 2009 BC2010 BC
Northern Territory, Indigenous
0200400600800
1,0001,2001,4001,6001,8002,000Rate
Year of death
2003 BC 2004 BC 2005 BC2006 BC 2007 BC 2008 BC2009 BC 2010 BC
Northern Territory, non-Indigenous
BC = Birth cohort
Source: Linked Perinatal, Birth, Death Data set

Infant and child mortality rates for Indigenous Australians using linked and unlinked data 51
Table 8.1: Cumulative cohort-specific under-5 mortality rates per 100,000 live births, by birth cohort and year of death
Birth cohort
Year of death 2003 BC 2004 BC 2005 BC 2006 BC 2007 BC 2008 BC 2009 BC 2010 BC
New South Wales 2003–2004 1,186 2004–2005 1,230 880 2005–2006 1,230 922 963 2006–2007 1,230 922 1,001 913 2007–2008 1,230 922 1,117 1,131 1,313 2008–2009 964 1,117 1,170 1,413 841 2009–2010 1,194 1,206 1,413 841 498 2010–2011 1,206 1,413 841 564 797 2011–2012 1,413 841 597 827 2012–2013 841 597 919 2013–2014 597 919 2014–2015 919 Victoria
2003–2004 993 2004–2005 993 642 2005–2006 1,159 803 731 2006–2007 1,159 803 877 1,197 2007–2008 1,159 963 877 1,197 580 2008–2009 963 877 1,197 580 … 2009–2010 877 1,197 580 … … 2010–2011 1,197 580 … … 701 2011–2012 580 … … 701 2012–2013 … … 779 2013–2014 … 779 2014–2015 779 Queensland
2003–2004 … 2004–2005 … … 2005–2006 … … … 2006–2007 … … … … 2007–2008 … … … … … 2008–2009 … … … … 983 2009–2010 … … … 1,086 1,141 2010–2011 … … 1,112 1,245 1,039 2011–2012 … 1,138 1,271 1,187 2012–2013 1,215 1,297 1,212 2013–2014 1,323 1,237 2014–2015 1,261 South Australia ,
2003–2004 898 2004–2005 1,257 1,213 2005–2006 1,436 1,213 893 2006–2007 1,436 1,213 1,250 622 2007–2008 1,436 1,213 1,250 933 1,194 2008–2009 1,213 1,250 1,089 1,343 727 2009–2010 1,250 1,089 1,343 727 587 2010–2011 1,089 1,343 727 733 1,337 2011–2012 1,343 727 733 1,337 2012–2013 727 1,026 1,337 2013–2014 1,026 1,337 2014–2015 1,486 (continued)

52 Infant and child mortality rates for Indigenous Australians using linked and unlinked data
Table 8.1 (continued): Cumulative cohort-specific under-5 mortality rates per 100,000 live births, by birth cohort and year of death Birth cohort
Year of death 2003 BC 2004 BC 2005 BC 2006 BC 2007 BC 2008 BC 2009 BC 2010 BC
Western Australia
2003–2004 1,333 2004–2005 1,449 787 2005–2006 1,507 1,180 922 2006–2007 1,507 1,236 973 1,357 2007–2008 1,507 1,236 1,024 1,357 892 2008–2009 1,236 1,075 1,406 1,033 976 2009–2010 1,075 1,406 1,174 1,024 921 2010–2011 1,454 1,174 1,073 1,115 950 2011–2012 1,174 1,073 1,212 1,101 2012–2013 1,073 1,358 1,201 2013–2014 1,358 1,201 2014–2015 1,201 Northern Territory 2003–2004 … 2004–2005 … 1,529 2005–2006 … 1,668 1,678 2006–2007 … 1,668 1,678 1,218 2007–2008 … 1,668 1,745 1,346 1,621 2008–2009 1,668 1,745 1,410 1,816 1,320 2009–2010 1,812 1,474 1,881 1,452 1,009 2010–2011 1,474 1,946 1,452 1,009 851 2011–2012 1,946 1,518 1,073 916 2012–2013 1,584 1,136 982 2013–2014 1,199 982 2014–2015 1,047 Australia
2003–2004 1,165 2004–2005 1,261 989 2005–2006 1,318 1,149 1,036 2006–2007 1,318 1,164 1,100 1,060 2007–2008 1,318 1,178 1,165 1,182 1,169 2008–2009 1,193 1,178 1,244 1,284 937 2009–2010 1,217 1,268 1,330 996 856 2010–2011 1,280 1,342 1,013 951 837 2011–2012 1,342 1,030 993 987 2012–2013 1,064 1,053 1,047 2013–2014 1,070 1,055 2014–2015 1,077
Notes
1. Estimates for the states and territories are based on births and child deaths for all birth cohorts. These figures are the base data on which all the analyses and estimates in this report are based. Due to data processing issues with the source data as well as data quality and data linkage issues with some of the jurisdictional perinatal data, estimates for some birth cohorts were found to under-represent the number of child deaths that occurred in particular birth cohorts in some jurisdictions. These birth cohorts were therefore not included in any further analyses carried out. The following birth cohorts were excluded from further analysis: Victoria: 2008 and 2009 birth cohorts; Queensland: 2003–2007 birth cohorts; Northern Territory: 2003 birth cohort.
2. Separate analyses have not been carried out for Tasmania and the Australian Capital Territory because of the small size of the Indigenous population and the small number of Indigenous inder-5 deaths in these 2 jurisdictions. Several birth cohort and ‘year of death’ data cells contained either no deaths or too few deaths for any meaningful analysis and interpretation to be carried out. Data for Tasmania and the Australian Capital Territory have, however, been included in all the estimates for Australia.
3. Estimates for Australia are based on the aggregation of all jurisdictional births and child deaths. With respect to further analysis, data for birth cohorts excluded from particular jurisdictions have also been excluded from the estimates for Australia.

Infant and child mortality rates for Indigenous Australians using linked and unlinked data 53
Trends for each jurisdiction Cohort-specific under-5 mortality rates for New South Wales, Victoria, Queensland, South Australia, Western Australia and the Northern Territory are shown in Figure 8.2.
New South Wales • Cumulative cohort-specific under-5 mortality rates for babies born during 2003–2010
were about 3 times as high for Indigenous babies as for non-Indigenous babies. – Cohort-specific under-5 mortality rates for babies born in 2003 were about 1,300 per
100,000 Indigenous babies compared with 470 per 100,000 non-Indigenous babies. • Although variable, cumulative cohort-specific under-5 mortality rates for both Indigenous
and non-Indigenous babies declined across nearly all successive birth cohorts. – Indigenous babies born between 2003 and 2007 experienced the highest under-5
mortality rates while those born from 2008 experienced the lowest rates. • Indigenous babies experienced much bigger declines in cohort-specific under-5 mortality
rates than did non-Indigenous babies. – By 2010, Indigenous under-5 mortality rates had declined to about 600 per 100,000
live births (from about 1,300 in 2003). – By 2010, non-Indigenous under-5 mortality rates had also declined to about 430 per
100,000 live births (from a level of about 470 in 2003). – Because of the much bigger declines in Indigenous than non-Indigenous under-5
mortality rates, the gap in cohort-specific under-5 mortality rates between Indigenous and non-Indigenous women appear to have narrowed during the reference period.
Victoria • Indigenous cohort-specific under-5 mortality rates for Victoria are based on very few
deaths (see Table 4.5) because of the small size of the Indigenous population in Victoria. In each birth cohort, the cumulative number of deaths at each age was fewer than 10 in nearly all cases, with several cells containing fewer than 5 deaths. – A low base for estimating under-5 mortality rates could lead to uncertainty about the
true level and trends in under-5 death rates as small changes in the number of deaths could have substantial impacts on the rates.
• The estimates for Victoria exclude the 2008 and 2009 birth cohorts because of data issues associated with changes to the platform for compiling perinatal records during 2008 and 2009.
• Mortality rates for babies born between 2003 and 2007 were nearly 3 times as high among Indigenous as among non-Indigenous babies. – Cohort-specific under-5 mortality rates were 1,200 per 100,000 live births among
Indigenous babies compared with 420 among non-Indigenous babies. • Cohort-specific under-5 mortality rates declined for both Indigenous and non-Indigenous
babies. The declines were much bigger for Indigenous than for non-Indigenous babies, leading to a narrowing of the gap between Indigenous and non-Indigenous under-5 mortality rates. For instance: – Cohort-specific under-5 mortality rates among the 2003–2005 birth cohorts were
nearly 3 times as high among Indigenous babies as among non-Indigenous babies. – Among the 2010 birth cohort, cohort-specific under-5 mortality rates were less than
twice as high among Indigenous babies as among non-Indigenous babies.
54 Infant and child mortality rates for Indigenous Australians using linked and unlinked data
Queensland • A complete set of linkage variables were not available on the Queensland perinatal data
set until mid–2007. • Linkage of the Queensland perinatal data set to either the birth registration data set or
the NDI was therefore not robust until after 2007. As a result, some under-5 deaths identified on the NDI could not be tracked back to their corresponding records on the perinatal data set until after 2007. – Tables 4.4 and 4.5 show that only about 87% of all under-5 deaths and 65% of
Indigenous under-5 deaths attributable to the 2003 to 2010 birth cohorts could be identified by linking the Queensland perinatal records to the NDI.
– While 98.6% or more of Indigenous under-5 deaths among the 2008–2010 birth cohorts were identifiable on the perinatal data set, only 56%, 35%, 27%, 36% and 79%, respectively, of under-5 deaths occurring among the 2003, 2004, 2005, 2006 and 2007 birth cohorts were identifiable on the perinatal data set.
– It was therefore decided that cohort-specific under-5 mortality rates would be estimated and analysed for only the 2008, 2009 and 2010 birth cohorts for which full linkage variables were available.
– While a clear trend is not discernible because of the short period available for investigation, the lowest under-5 mortality rates occurred within the 2010 birth cohort.
Western Australia • Western Australia had some of the highest Indigenous cohort-specific under-5 mortality
rates in Australia. • For almost all birth cohorts, Indigenous under-5 mortality rates were more than 3 times
as high as those among non-Indigenous babies. • The estimates, however, point to consistent declines in under-5 mortality rates. The
highest under-5 mortality rates were observed among the 2003 birth cohort, while the lowest rates were observed among the 2010 birth cohort.
South Australia • Because of the small size of the Indigenous population and the small number of
Indigenous deaths (tables 4.3 and 4.5), the cohort-specific under-5 mortality estimates were variable.
• The cumulative cohort-specific under-5 mortality rates for babies dying before their first, second, third, fourth and fifth birthdays declined during the reference period, and were lower for the 2008, 2009 and 2010 birth cohorts than for the 2003–2007 birth cohorts.
• Figure 8.1 shows that Indigenous babies experienced much bigger declines in cohort-specific child mortality rates than did non-Indigenous babies. – As a result of the much bigger declines in cohort-specific under-5 mortality rates
among Indigenous babies, the gap between Indigenous and non-Indigenous cohort-specific child mortality rates declined during the reference period.

Infant and child mortality rates for Indigenous Australians using linked and unlinked data 55
Northern Territory • Cohort-specific under-5 mortality rates among both Indigenous and non-Indigenous
babies in the Northern Territory were the highest of all states and territories. • Among Indigenous babies born between 2004 and 2007, the number of babies dying
before their fifth birthday ranged between 1,700 and 1,900 under-5 deaths per 100,000 live births.
• Among non-Indigenous babies born between 2004 and 2007, the number dying before their fifth birthday was about 560 under-5 deaths per 100,000 live births.
• Indigenous under-5 mortality rates of 1,700–1,900 per 100,000 live births in the Northern Territory contrast with estimates of between 1,100 and 1,200 deaths per 100,000 Indigenous live births for most jurisdictions except Western Australia, where Indigenous under-5 death rates were higher than in other jurisdictions (apart from the Northern Territory).
• For non-Indigenous under-5 deaths, the estimates for the Northern Territory (560 per 100,000 live births) contrast with estimates of about 400–470 for almost all other jurisdictions.
• As was observed in other jurisdictions, both Indigenous and non-Indigenous under-5 mortality rates also declined in the Northern Territory during the reference period.
• Figure 8.1 shows that, during the reference period, Indigenous under-5 mortality rates in the Northern Territory declined by about 30–40%, from 1,700–1,900 deaths per 100,000 live births among the 2004–2007 birth cohorts to 1,199–1,047 deaths per 100,000 live births among the 2009–2010 birth cohorts.
• The highest under-5 mortality rates were observed among the 2004–2007 birth cohorts. • The lowest under-5 mortality rates were observed among the 2008, 2009 and 2010 birth
cohorts.
Conclusion Table 8.1 and figures 8.1 and 8.2 show plausible estimates of cohort-specific under-5 mortality rates among Indigenous and non-Indigenous babies born between 2003 and 2010, where death occurred between 2003 and 2015.
The estimates are illustrative only, but they show that perinatal records can be reliably linked to death records to enable plausible and conceptually more robust estimates of under-5 mortality rates to be prepared.
The estimation of cohort-specific under-5 mortality rates provides a more meaningful estimate of infant and child death than period rates that are based on cross-sectional data, because cohort-specific mortality rates show actual death rates within actual birth cohorts.
Because cohort-specific under-5 mortality rates are based on the mortality experience of actual birth cohorts, they are more informative when used to describe mortality trends. They demonstrate the mortality experience of different birth cohorts and how mortality experience varies between birth cohorts.

56 Infant and child mortality rates for Indigenous Australians using linked and unlinked data
Appendix A: Estimating cohort-specific deaths with or without data linkage Cohort-specific infant and child mortality rates can be estimated with or without the use of linked data. There are advantages and disadvantages of the 2 approaches.
Estimating cohort-specific child mortality using data linkage Records of birth cohorts, or babies born each year from 1 January 2003 to 31 December 2010, were linked to the NDI in order to identify under-5 deaths that occurred to cohort members. This allows analysts to determine the number of babies who have died from each birth cohort, when they died, and the age at which they died.
In this approach, the birth cohort, which is the starting point for the analysis, is directly observable and estimable, and allows for a definable alignment between birth cohorts (population at risk) and deaths.
Advantages The advantages of the cohort-specific approach using linked data are summarised here:
• Birth cohorts can be linked directly to the deaths occurring among cohort members, thereby allowing complete alignment between deaths (numerator) and the population at risk (denominator).
• Infant and child death rates can be estimated for specific birth cohorts. • Infant and child death registrations can be linked directly to their corresponding perinatal
records to enable analysts to identify the cause of death associated with cohort-specific infant and child death rates, and the risk factors associated with infant and child death.
• Consistency of Indigenous status in both the deaths (numerator) and births (denominator or population at risk) can be obtained by basing Indigenous status on a single or the same data source, such as the perinatal dataset.
• Indigenous identification can be enhanced by comparing the Indigenous status of individual records across the linked datasets.
As well, perinatal and death records contain information that enhances the value of linking perinatal to death records. Perinatal records contain information on the date of birth of all babies, together with information on the health, demographic and socioeconomic characteristics of their mothers, including their geographical location, their antenatal behaviour and the circumstances in which they lived. Perinatal records also contain information on any health complications experienced by mothers during their pregnancy.
By linking individual death registration records to their corresponding perinatal records, analysts will be able to understand the relationship between infant and child death and cause of death on the one hand, and, on the other hand, the socioeconomic and contextual circumstances in which the babies were born, and in which they lived and died, as well as the demographic, socioeconomic, lifestyle, antenatal behaviour and health characteristics of their mothers.

Infant and child mortality rates for Indigenous Australians using linked and unlinked data 57
Statistical agencies often do not adopt this approach because of the difficulty of linking and aligning infant and child deaths with their originating birth cohorts.
Disadvantages Estimating cohort-specific infant and child mortality using data linkage has the following drawbacks. These include those summarised here: • The quality of the resulting estimates depends on the quality of the linkage variables and
the quality of the data linkage; child death rates could be underestimated, overestimated or distorted, depending on the quality of the data linkage.
• Lags in death registration could lead to the underestimation of recent cohort-specific deaths unless sufficient time has elapsed between death and the period of the estimate.
Estimating cohort-specific child mortality without data linkage Cohort-specific infant and child mortality rates can also be estimated without data linkage if the following items of information are available:
• birth registration or perinatal records containing the date of birth of all babies born within a reference period of interest; in this approach, the population at risk is the birth cohort or the babies born during the reference period of interest
• complete and accurate date of death of all babies who died before their fifth birthday, among all babies born during the reference period in the defined birth cohort of interest.
Advantages • If information on date of birth and date of death are accurate and complete, one could
identify almost all the in-scope births (population at risk) and all the in-scope deaths that have occurred during the reference period of interest.
• It is a reasonable approach if one is mostly interested in mortality rates and not much else (for example, relationship between infant and child deaths and maternal characteristics).
• Indigenous status can be enhanced but only at the aggregate level.
Disadvantages • The observed child deaths and population at risk are from different datasets; the
observed child deaths may therefore not necessarily represent all the child deaths in the population at risk.
• There is no direct information on risk factors or on the characteristics of the babies who have died except what is available on their death records.
• One cannot link child death and cause of death to maternal risk factors or the circumstances of the birth of the baby.
• The quality of Indigenous status may vary between the numerator and denominator as the 2 data items are from 2 different datasets.
The approach used in this report is, however, based on linking perinatal and birth registration data to their corresponding death registration records or the NDI.

58 Infant and child mortality rates for Indigenous Australians using linked and unlinked data
Appendix B: Cross-sectional and cohort-specific under-5 mortality rates
Current approach to estimating the under-5 mortality rate The under-5 mortality rate comprises 2 components: the infant mortality rate and the child mortality rate. The infant and child mortality rate can be estimated using different points in time, such as the calendar year or the birth year, as the reference point. The reference point used in estimating the infant and child mortality rate affects the interpretation of the rates.
The most common method used to estimate the infant and child mortality rate uses the calendar year as the reference point. In this method, the infant mortality rate is estimated as the number of infant deaths in the calendar year t, divided by the number of live births in the calendar year t. This approach is used to produce official estimates of infant mortality, where the infant mortality rate (IMR) is defined as the number of deaths of children aged under 1 in a specified period per 1,000 live births in the same period (ABS 2019). This approach may be represented by equation 1 as follows:
𝐼𝐼𝑀𝑀𝑀𝑀(𝑡𝑡) = 𝑑𝑑𝑡𝑡0
𝑏𝑏𝑡𝑡∗ 1,000 ..…………………………..……………………………………….. (1)
The child mortality rate (CMR) may also be defined as the number of child deaths (d) in a specified period (P) per 100,000 children aged 1–4 in the same period (ABS 2011; ABS & AIHW 2008). This approach may be represented by equation 2 as follows:
𝐶𝐶𝑀𝑀𝑀𝑀(𝑡𝑡) = 𝑑𝑑𝑡𝑡1–4
𝑃𝑃𝑡𝑡1–4 ∗ 100,000 ..………………….……………..…………………..…………….. (2)
where:
t = the reference year for which the infant or child mortality rate is being estimated d = the total number of deaths of children aged 0 or 1–4 that occurred in year t b = the number of live births that occurred in year t P = the mid-year population of a specified age group (for example, 1–4 years) in year t
Issues with cross-sectional estimates of the infant mortality rate Infant and child mortality rates estimated this way are not true probabilities as they do not represent the probability of infant or child death among a specific cohort of babies (Shryock & Siegel 1976). These rates may also be different in value, as well as different conceptually and in interpretation, from the corresponding infant (1q0) and child (1q4) values in a life table.
Infant deaths occurring in any reference year, t, come from 2 different birth cohorts; namely, the cohort of babies born in year t and the cohort of babies born in the preceding year, t–1. This is illustrated in Figure B1, where infant deaths in year t, represented by the 2 triangles DABE and DABC (the blue dotted square) can be observed to have come from the 2 birth cohorts: a–1, that is, babies born in year t–1; and birth cohort a, or babies born in year t.
Using 2015 as the reference year, for example, the infant mortality rate for 2015 (year t) can be seen as an approximate rate based on the number of infant deaths (DABE) among babies born in 2014 (birth cohort a–1) and the number of infant deaths (DABC) among babies born in

Infant and child mortality rates for Indigenous Australians using linked and unlinked data 59
2015 (birth cohort a) who died in 2015 (year t), divided by the number of babies born in 2015 (AC). It does not represent the infant mortality rate among babies born in 2014 or 2015, as the deaths (numerator) and population at risk (denominator) are from different birth cohorts. Figure B1: Lexis Diagram showing birth cohorts, live births and infant deaths
t–1 t t+1 t+2
Source: (Muhlichen & Scholz 2015)
Issues with cross-sectional estimates of the child mortality rate A corresponding problem exists with conventional estimates of child mortality, based on cross-sectional data, where the numerator and denominator are from different birth cohorts.
The child mortality rate for 2015, for instance, as defined in equation 2, may be estimated by dividing the number of children aged 1–4 who died in 2015 by the mid-year population aged 1–4 in 2015. Both the children aged 1–4 who died in 2015, and the mid-year population aged 1–4 years in 2015 would have been born between 2010 and 2014. The mid-year population aged 1–4 in 2015 is, however, not the complete cohort of babies born in 2010–2014, but the survivors of babies born in 2010–2014. The denominator, or population at risk, thus excludes babies born in 2010–2014 who died and actually contributed to the deaths in the numerator.
Both the conventional infant and child mortality rates are not true probabilities, and are not based on the actual birth cohorts from which the deaths occurred; their accuracy depends on the annual fluctuations in the number of births (Shryock & Siegel 1976).
The most precise variant for estimating the infant and child mortality rate is the birth year method (Muhlichen & Scholz 2015). According to this variant, the infant mortality rate is the proportion of infant deaths in a specified birth cohort. More specifically, it is the number of infant deaths of a specified birth cohort a, divided by the number of live births from the same birth cohort, a. This variant follows a cohort approach, and approximates the infant mortality rate, or 1q0, in a standard life table.
Data for the cohort-specific approach is preferably generated though data linkage, although, as shown in Appendix A, data can also be generated without data linkage. In the cohort-specific approach, birth cohorts, or babies born each year from 1 January to 31 December of each reference year, are established from perinatal or midwives data
A C F
E B D
DABE
DABC
DBCD
DCDF
Year t
Age x
2
1
0

60 Infant and child mortality rates for Indigenous Australians using linked and unlinked data
collections. Records of all babies in the specified birth cohorts are then linked to the NDI to identify child deaths occurring to cohort members. This approach allows analysts to be able to determine the number of babies who have died from each birth cohort.
Statistical agencies often do not adopt this approach because of the difficulty of linking and aligning infant and child deaths with their originating birth cohorts.
Based on the illustration in Figure B1, one can identify the birth cohort a, and infant deaths within this birth cohort as DABC and DBCD (the red parallelogram). The deaths DABC occurred in year t, while the deaths DBCD occurred in year t+1. The infant mortality can then be written as:
1𝑞𝑞0,𝑡𝑡 = 1𝐷𝐷0,𝑎𝑎,𝑡𝑡 + 1𝐷𝐷0,𝑎𝑎,𝑡𝑡+1
𝐵𝐵𝑎𝑎,𝑡𝑡 ..…………………………………………….……….. (3)
This variant of the infant mortality rate is a probability. It is closest in approximation to the infant mortality rate, or 1q0, in a standard life table, and follows a cohort approach. Following on from Figure B1, the formula for this approach can then be written as:
1𝑞𝑞0,𝑡𝑡 = 𝐷𝐷𝐴𝐴𝐴𝐴𝐷𝐷𝐵𝐵 𝐵𝐵𝐴𝐴𝐴𝐴⁄ ..………………………..………………………………….……….. (4) where:
D = deaths,
B = births
and the subscripts 0, a, t and t+1 stand for age 0, birth cohort a, and time t and time t+1, respectively.
Although not shown in the Lexis Diagram in Figure B1, the child mortality rate may be similarly estimated using a cohort-specific approach as now described.
Cohort-specific child deaths relate to the number of babies belonging to a particular birth cohort that died between their first and fifth birthdays. The numerator comprises the number of child deaths occurring within a specific birth cohort, between their first and fifth birthdays. The denominator is the actual birth cohort from which the deaths in the numerator occurred.
The cohort-specific child mortality rate may be defined as the number of deaths of children aged 1–4 within a specific birth cohort, multiplied by 100,000.
𝐶𝐶𝐶𝐶_𝐶𝐶𝑀𝑀𝑀𝑀(𝑐𝑐) = 𝑑𝑑𝑐𝑐𝑖𝑖
𝑏𝑏𝑐𝑐∗ 100,000 ..…………………………..…………………………………….. (5)
where:
𝐶𝐶𝐶𝐶_𝐶𝐶𝑀𝑀𝑀𝑀(𝑐𝑐) = the cohort-specific child mortality rate for the birth cohort born in year c
𝑑𝑑𝑐𝑐𝑖𝑖 = deaths at age i (that is, age <2, <3, <4 and <5 years) that occurred within birth cohort c 𝑏𝑏𝑐𝑐 = the size of birth cohort c or the number of live births (b) making up birth cohort c
This approach leads to an alignment between child deaths and the population at risk.

Infant and child mortality rates for Indigenous Australians using linked and unlinked data 61
References ABS 2011 (Australian Bureau of Statistics). The health and welfare of Australia’s Aboriginal and Torres Strait Islander Peoples, October 2010. ABS cat. no. 4704.0. Canberra: ABS.
ABS 2015. Births, Australia, 2014. ABS Cat no. 3301.0. Canberra: ABS.
ABS 2018. Life tables for Aboriginal and Torres Strait Islander Australians, 2015–2017. ABS cat. no. 3302.0.55.003. Canberra: ABS.
ABS 2019. Deaths, Australia, 2018. ABS cat. no. 3302.0. Canberra: ABS.
ABS & AIHW 2008 (Australian Institute of Health and Welfare). The health and welfare of Australia’s Aboriginal and Torres Strait Islander peoples 2008. Cat. no. IHW 21 Canberra: ABS & AIHW.
AIHW 2012. An enhanced mortality database for estimating Indigenous life expectancy: a feasibility study. Cat. no. IHW 75 Canberra: AIHW.
AIHW 2017. Trends in Indigenous mortality and life expectancy, 2001–2015: evidence from the Enhanced Mortality Database. Cat. no. IHW 74 Canberra: AIHW.
Lanyon AJ & John D 2015. Australia’s civil registration and vital statistics system. In: Castan M & Gerber P (eds). Proof of life. Sydney: Future Leaders.
Lewis LN, Hickey M, Doherty DA & Skinner SR 2009. How do pregnancy outcomes differ in teenage mothers? A Western Australian study. Medical Journal of Australia. 190:537–41.
Middleton PF 2009. Preventing infant deaths among Aboriginal and teenage women in South Australia. Adelaide: University of Adelaide.
Muhlichen M & Scholz RD 2015. Demographic analysis of church records: the case of infant mortality in the Hanseatic city of Rostock in the 19th Century. MPIDR Technical Report 2015-002. Rostock: Max Planck Institute for Demographic Research.
National Health and Medical Research Council 2007 (Updated May 2015). National Statement on Ethical Conduct in Human Research. National Health and Medical Research Council, Australian Research Council and Australian Vice-Chancellors' Committee, Commonwealth of Australia, Canberra.
NSW Health 2003. The NSW Aboriginal Perinatal Health Report. Sydney: NSW Department of Health.
Shryock HS & Siegel JS 1976. The methods and materials of demography. Orlando: Academic Press.
Utz M 2014. A multivariate approach to the disparity in perinatal outcomes between Indigenous and non-Indigenous women, Queensland. Brisbane: Queensland Department of Health.

62 Infant and child mortality rates for Indigenous Australians using linked and unlinked data
Acknowledgments This report was prepared by Tetteh Dugbaza. The author would like to thank Isabella Stephens for her contributions to the data analysis and writing of the cause of death chapter.
The author is also grateful to Fadwa Al-Yaman for her guidance in preparing this report, and to Len Smith (Australian National University) and Ching Choi (University of New South Wales) for their helpful comments and suggestions on earlier drafts of the report.
Abbreviations AIHW Australian Institute of Health and Welfare
CHEREL NSW Centre for Health Record Linkage
DLU Data Linkage Unit
HRECS Human Research Ethics Committee
NDI National Death Index
NMD National Mortality Database
SLA statistical local area
Symbols — nil or rounded to zero
. . not applicable
< less than
n.a. not available
n.p. not publishable because of small numbers, confidentiality or other concerns about the quality of the data

Infant and child mortality rates for Indigenous Australians using linked and unlinked data 63
List of tables Table 2.1: Jurisdictional PDCs: list of data items available for data linkage and for
estimating under-5 mortality ...................................................................................... 5
Table 3.1: Perinatal and birth registration records with missing data linkage fields, 2003–2010 .............................................................................................................. 13
Table 3.2: Linkage rate of perinatal and birth registration records, 2003–2010 ...................... 16
Table 4.1: NDI records with missing key data linkage variables, 2003–2015 ......................... 18
Table 4.2: Cumulative number of all under–5 deaths occurring at each age among babies born 2003–2010, by jurisdiction where the baby was born ......................... 20
Table 4.3: Cumulative number of under-5 deaths occurring at each age among Indigenous babies born 2003–2010, by jurisdiction where the baby was born ......................... 22
Table 4.4: Total number of all under-5 deaths occurring within each birth cohort among babies born between 2003 and 2010, by jurisdiction where the baby was born .... 23
Table 4.5: Number of under-5 deaths occurring within each birth cohort among Indigenous babies born between 2003 and 2010, by jurisdiction where the baby was born .... 26
Table 5.1: Total number of under-5 deaths of Indigenous children occurring in 2003–2015 by source of Indigenous identification: selected states and territories ................... 30
Table 5.2: Total number of under-5 deaths of Indigenous children occurring in 2003–2015, by source of Indigenous identification: the Northern Territory ................................ 33
Table 5.3: Number of under-5 Indigenous deaths identified in Linked, Perinatal, Birth, Death Dataset that occurred in 2003–2015 among 2003–2010 birth cohorts: Tasmania and the ACT ........................................................................................... 34
Table 6.1: Percentage of under-5 deaths that occurred within 48 hours of birth according to cause of death status, 2003–2015 ...................................................................... 38
Table 7.1: Explanatory variables in jurisdictional PDCs, 2003–2010 ...................................... 44
Table 8.1: Cumulative cohort-specific under-5 mortality rates per 100,000 live births, by birth cohort and year of death ............................................................................ 51

64 Infant and child mortality rates for Indigenous Australians using linked and unlinked data
List of figures Figure 3.1: Linkage of perinatal to birth registration records, Australia 2003–2010 ................. 15
Figure 8.1: Cumulative cohort-specific under-5 mortality rates, 2003–2015, per 100,000 live births born to Indigenous and non-Indigenous mothers, by birth cohort and year of death, Australia ........................................................................................... 47
Figure 8.2: Cumulative cohort-specific under-5 mortality rates, 2003–2015, per 100,000 live births born to Indigenous and non-Indigenous mothers, by birth cohort, year of death and state of usual residence ............................................................. 49
Figure B1: Lexis Diagram showing birth cohorts, live births and infant deaths ........................... 59


A Linked Perinatal, Birth, Death Data set was created by linking jurisdictional perinatal and birth registration records to the National Death Index to identify Indigenous under-5 deaths occurring in specified birth cohorts within jurisdictional Perinatal Data Collections. This report examines the feasibility of using this linked data collection for analysis and explores the associated methodology, data quality issues and analysis of risk factors associated with adverse pregnancy and birth outcomes.
Infant and child mortality rates for Indigenous Australians using linked and unlinked data
Linked Perinatal, Birth, Death Data set
aihw.gov.au
Stronger evidence, better decisions, improved health and welfare
Stronger evidence,better decisions,improved health and welfare