inferring gene function and network organization in drosophila
TRANSCRIPT

1
Inferring Gene Function and Network Organization in Drosophila Signaling by Combined
Analysis of Pleiotropy and Epistasis
Gregory W. Carter
The Jackson Laboratory, Bar Harbor, ME, 04609
G3: Genes|Genomes|Genetics Early Online, published on March 18, 2013 as doi:10.1534/g3.113.005710
© The Author(s) 2013. Published by the Genetics Society of America.

2
Running Title: Pleiotropy and Epistasis in Signaling
Keywords: genetic interaction, pleiotropy, epistasis, genetic network, signaling network
Corresponding Author:
Gregory W. Carter
The Jackson Laboratory
600 Main Street
Bar Harbor, ME 04609
Telephone: 207-288-6025
Email: [email protected]

3
ABSTRACT
High-throughput genetic interaction screens have enabled functional genomics on a network
scale. Groups of cofunctional genes commonly exhibit similar interaction patterns across a large
network, leading to novel functional inferences for a minority of previously uncharacterized
genes within a group. However, such analyses are often unsuited to cases with a handful of
relevant gene variants or sparse annotation. Here we describe an alternative analysis of cell
growth signaling using a computational strategy that integrates patterns of pleiotropy and
epistasis to infer how gene knockdowns enhance or suppress the effects of other knockdowns.
We analyzed the interaction network for RNAi knockdowns of a set of 93 incompletely-
annotated genes in a Drosophila melanogaster model of cellular signaling. We inferred novel
functional relationships between genes by modeling genetic interactions in terms of knockdown-
to-knockdown influences. The method simultaneously analyzes the effects of partially
pleiotropic genes on multiple quantitative phenotypes to infer a consistent model of each genetic
interaction. From these models we proposed novel candidate Ras inhibitors and their Ras
signaling interaction partners, and each of these hypotheses can be inferred independent of
network-wide patterns. At the same time, the network-scale interaction patterns consistently
mapped pathway organization. The analysis therefore assigns functional relevance to individual
genetic interactions while also revealing global genetic architecture.
INTRODUCTION
The systematic study of genetic interactions has proven a powerful means to map genetic
networks (BOONE et al. 2007). Genome-scale interaction analysis has provided a global view of
gene function in yeast (COSTANZO et al. 2010) and studies focused on specific processes have

4
mapped large-scale networks in yeast (COLLINS et al. 2007; DREES et al. 2005; SEGRE et al.
2005; ST ONGE et al. 2007), worm (BYRNE et al. 2007; LEHNER et al. 2006), and fly (HORN et al.
2011; YAMAMOTO et al. 2009). Analyses of statistical epistasis, the population-level
manifestation of genetic interaction, have identified important effects in mouse (LI and
CHURCHILL 2010; REIFSNYDER et al. 2000; SHAO et al. 2008) and human (MCKINNEY and
PAJEWSKI 2011; RITCHIE 2011) genetics. These studies indicate that genetic interactions reveal
underlying structure in biological networks and map complex genetic architecture. Advances in
study design and the characterization of genetic populations have been accompanied by parallel
progress in quantitative phenotyping. Multidimensional phenotypic characterization is becoming
increasingly common, often including multiple physiological traits coupled with thousands of
molecular measures such as protein and transcript abundances (ANDREUX et al. 2012; CHEN et
al. 2012). Such research ultimately aims to provide a genetically precise and phenotypically
predictive approach to medicine. Success of this approach is contingent on the development of
analytical methods to extract quantitative models from genetic interactions across multiple
phenotypes. These methods will increase the power to formulate precise biological hypotheses to
potentially address the complex genetics that underlie human health and disease.
To date, studies have primarily used statistical concordance of interaction patterns across
multiple genes to infer the role of previously uncharacterized genes. This strategy is often
referred to as guilt-by-association (GBA). Advanced GBA approaches, such as clustering genes
based on correlated interaction spectra across multiple interaction partners (CARTER et al. 2009;
COLLINS et al. 2007; COSTANZO et al. 2010; DREES et al. 2005; SEGRE et al. 2005), have
successfully mapped genetic architecture on a large scale. In these networks genes often form
highly-connected communities, or gene modules, that are enriched in one or more functional
5
annotations. The principle of GBA dictates that a minority of uncharacterized genes within a
module can be assigned the dominant function of the module.
While successful on a large scale, GBA-based methods have multiple limitations. First,
they require large data sets to generate adequate statistical power to resolve modules, and can
therefore be limited in populations with a small number of relevant mutations such as studies of
specific developmental or signaling processes, drivers of cancer evolution, or interacting
candidates in genome-wide associations. Second, GBA relies on the availability of functional
annotations for the vast majority of interacting genes. Third, GBA approaches often generate
implicit predictions of gene function without providing explicit predictions of the effects of a
mutation or combination of mutations, thereby limiting the power to generate directly testable
hypotheses. Fourth, large-scale GBA approaches rarely take advantage of the complementary
information in multiple phenotypes. In cases when multiple phenotypes are considered, the
analysis is usually based on coincidence of interactions derived independently for each
phenotype (HORN et al. 2011; MICHAUT and BADER 2012). Finally, it has been proposed that
GBA results may be driven by a small number of critical interactions and therefore network
associations are not generally reliable (GILLIS and PAVLIDIS 2012).
Here we use an approach based on the combined analysis of pleiotropy and epistasis to
infer the genetic architecture of growth-related signaling in Drosophila melanogaster. This
strategy infers and interprets genetic interaction data in terms of quantitative variant-to-variant
and variant-to-phenotype influences, rather than non-directional epistasis. This results in a
network model that maps how each specific variant affects each other and, in turn, multiple
related phenotypes. This method is applicable to a range of genetic diversity from a few genes to
genome-scale screens. It integrates information from multiple phenotype measures to generate

6
specific hypotheses for genetic interactions. We recently demonstrated the utility of this method
in a population of yeast strains by mapping relationships of the yeast mating pathway (CARTER et
al. 2012). Here, we extend the method to a large set of double knockdowns of genes involved in
signal transduction on a common genetic background (HORN et al. 2011). This represents a much
larger network of potential interacting genes and involves multiple signaling pathways. The
analysis exploits the subtle differences between the regulation of cell proliferation and nuclear
size across 93 mutations. We obtain an interaction network of knockdown-to-knockdown
influences that identifies novel suppressors and enhancers of Ras signaling, demonstrating the
method’s applicability to complex networks and large-scale genetic screens of multiple
phenotypes. At a local level, the network provides specific hypotheses of how each gene
knockdown modifies the activity of other gene knockdowns in the same pathway and across
antagonistic pathways, narrowing the possible molecular mechanisms that underlie the observed
genetic interactions.
METHODS
Data source: Data were obtained from a study of double-stranded RNA (dsRNA) gene
knockdowns (HORN et al. 2011) that is briefly summarized as follows. Schneider S2 cells were
exposed to two independent dsRNA molecules to knock down 93 genes in all 4278 pair-wise
combinations. Genes were chosen based on prior annotation for mitogen-activated protein kinase
(MAPK) signaling or prior annotation as a protein or lipid phosphatase expressed in S2 cells.
High-throughput fluorescent imaging and automated image analysis were used to quantify three
non-redundant features: total cell number, mean nuclear area per cell, and nuclear fluorescence
intensity. Data for each knockdown pair were averaged and log-transformed, and each phenotype
distribution was mean-centered and normalized to a standard deviation of one. At a population

7
level, each phenotype resembled the combination of a normal distribution and a long tail below
the mean that was populated by lines with knockdowns of a few especially strong perturbations
such as Pvr, pnt, and drk (Table 1 and Figure S1).
Interaction model: Our data analysis technique is described at length in a previous
publication (CARTER et al. 2012) and is summarized here. We first perform singular value
decomposition (SVD) on the phenotype matrix to maximize orthogonality. In this case, we
analyzed the first two left singular vectors, or eigentraits, since the third singular value
represented less than 2% of the global variance and was therefore unlikely to encode significant
biology (Results). With these eigentraits denoted 𝑈𝑖1 and 𝑈𝑖2 for sample 𝑖, we perform linear
regression for each of the 93 perturbed genes in isolation to identify strong-effect knockdowns to
be treated as additive covariates in subsequent pair-wise regressions. For each locus we consider
the model:
𝑈𝑖𝑗 = 𝛽0
𝑗 + 𝑥𝑖𝛽𝑗 + 𝜀𝑖𝑗 (1)
The index 𝑖 is from 1 to 𝑁𝑆, and j is 1 or 2. The variable 𝑥𝑖 is the probability of the gene variant
at the locus in the strain 𝑖, 𝛽𝑗 is the effect on the eigentrait 𝑗, and 𝜀𝑖𝑗 is the residual error. For our
data all 𝑥𝑖 were binary, corresponding to the presence (1) or absence (0) of dsRNA that target the
locus. We define strong-effect knockdowns as those with a significant effect (see below) and
condition each subsequent knockdown-pair scan by including strong-effect knockdowns as
covariates for the associated phenotype. We next model every possible knockdown pair with
main effects and an interaction term. For two knockdowns labeled 1 and 2 we have:
𝑈𝑖𝑗 = 𝛽0
𝑗 + ∑ 𝑥𝑐,𝑖𝛽𝑐𝑗
𝑐�������Covariates
+ 𝑥1𝑖𝛽1𝑗 + 𝑥2𝑖𝛽2
𝑗���������
Main Effects
+ 𝑥1𝑖𝑥2𝑖𝛽12𝑗
�������Interaction
+ 𝜀𝑖𝑗 (2)

8
The variables are defined as in Eq. 1 with the additional interaction coefficient 𝛽12𝑗 and sum over
strong-effect knockdowns as covariates (excluding knockdowns 1 and 2). This step is
conceptually similar to the original analysis of the data (HORN et al. 2011), which identified pair-
wise interactions for each phenotype independently.
To derive a model in terms of knockdown-to-knockdown influences we consider how
each knockdown affects the activity of each other knockdown, first in terms of modified
knockdown activity and then in terms of the knockdown-to-knockdown influences that account
for the modified activity level. We first recast the 𝑁𝑃 interaction coefficients 𝛽12𝑗 in terms of
modified knockdown activity parameters 𝛿1 and 𝛿2 that are independent of the eigentrait 𝑗. The
activity variables are computed by matrix inversion:
�𝛿1𝛿2� = �𝛽1
1 𝛽21
𝛽12 𝛽22�−1
∙ �𝛽121
𝛽122� (3)
The variables 𝛿1 and 𝛿2 are an exact reparametrization of the interaction coefficients. We next
compute the directional influence coefficients that generate the modified activities. These
knockdown-to-knockdown influences, 𝑚12 and 𝑚21, are:
𝑚12 = 𝛿11+𝛿2
, 𝑚21 = 𝛿21+𝛿1
(4)
By substituting the solution of Eq. 3 into Eq. 4 we obtain the influence coefficients 𝑚𝑖𝑗 as a
function of the regression parameters. This defines a model in terms of knockdown-to-
knockdown influence coefficients (𝑚𝑖𝑗) and main-effect, knockdown-to-eigentrait coefficients
(𝛽𝑖𝑗). Without loss of information, we multiply the eigentrait coefficient matrix by the other

9
center and left singular value matrices to recompose knockdown-to-phenotype coefficients for
the original phenotypes.
Calculation of significance: We assess the significance of the influence coefficients,
𝑚𝑖𝑗, and knockdown-to-phenotype coefficients using standard error analysis methods on the
regression parameters (BEVINGTON 1969). For example, the variance of 𝑚12 is estimated by
differentiating with respect to all model parameters:
𝜎𝑚122 ≅ ∑ 𝜎
𝛽𝑖𝑗2 �𝜕𝑚12
𝜕𝛽𝑖𝑗 �
2
𝑖,𝑗 + 2∑ 𝜎𝛽𝑖𝑗𝛽𝑘
𝑙2 �𝜕𝑚12
𝜕𝛽𝑖𝑗 � �
𝜕𝑚12𝜕𝛽𝑘
𝑙 � 𝑖<𝑘,𝑗<𝑙 (5)
The indices i and k run over main effect and interaction coefficients, and j and l run from 1 to
𝑁𝑃. The first sum is over individual parameters and the second double sum is the cross terms.
Variances and covariances are estimated from the least-squares regression using standard
methods (BEVINGTON 1969).
After computing models for all knockdown pairs, we obtained two knockdown-to-
knockdown influence coefficients between each knockdown pair (one in each direction) and
knockdown-to-phenotype coefficients. To determine significance we used effect size divided by
estimated standard error as our test statistic because it could be computed for both regression
coefficients and variables computed from them (e.g., 𝑚𝑖𝑗). We selected the coefficient of median
standard effect size to represent overall knockdown-to-phenotype coefficients. We first
determined significance for single-locus scans. We performed 2000 permutations of the genotype
data and fit an extreme value distribution (EVD) for the maximum test statistic from each
permutation. This accounted for multiple tests and empirically estimated the likelihood of chance
association. We determined that a test statistic of 5.18 or greater corresponds to p < 0.001. We

10
repeated the procedure for pair-wise scans, permuting the genotypes of the two knockdowns
being tested in tandem. This procedure retained the structure between all other knockdowns
(including covariates) and all three phenotypes, and thereby randomized only the marginal
effects after conditioning on covariates. We collected test statistics for 700 permutations to
obtain null distributions for knockdown-to-phenotype and knockdown-to-knockdown influence
coefficients. We computed an empirical p-value for each coefficient. The family-wise error rate
was controlled by adjusting p-values using a step-down procedure (HOLM 1979). Step-down
EVDs were not used because the empirical distributions had slightly greater support at higher
values than fitted EVDs and thus the EVDs would artificially inflate significance. A significance
cutoff of adjusted p < 0.01 was used in our network (Figure 3) and all estimated p-values are
reported in Table S1.
RESULTS
The assayed phenotypes shared many genetic components and therefore exhibited
substantial pleiotropy. All three phenotypes were significantly correlated, with Pearson
coefficients as follows: cell number and nuclear area, 0.65; cell number and nuclear intensity,
0.90; and nuclear area and nuclear intensity, 0.85. However, there was variation across the tested
knockdowns. For example, the Rho1 defect in cytokinesis caused decreased cell numbers and
increased nuclear area, whereas Ras signaling knockdowns such as drk decreased both numbers
and area (HORN et al. 2011). To maximize complementarity and dimensionally reduce the
phenotype data, we performed singular value decomposition (SVD) to define two composite
eigentraits, each an orthogonal combination of the phenotypes (Methods). The eigentraits were
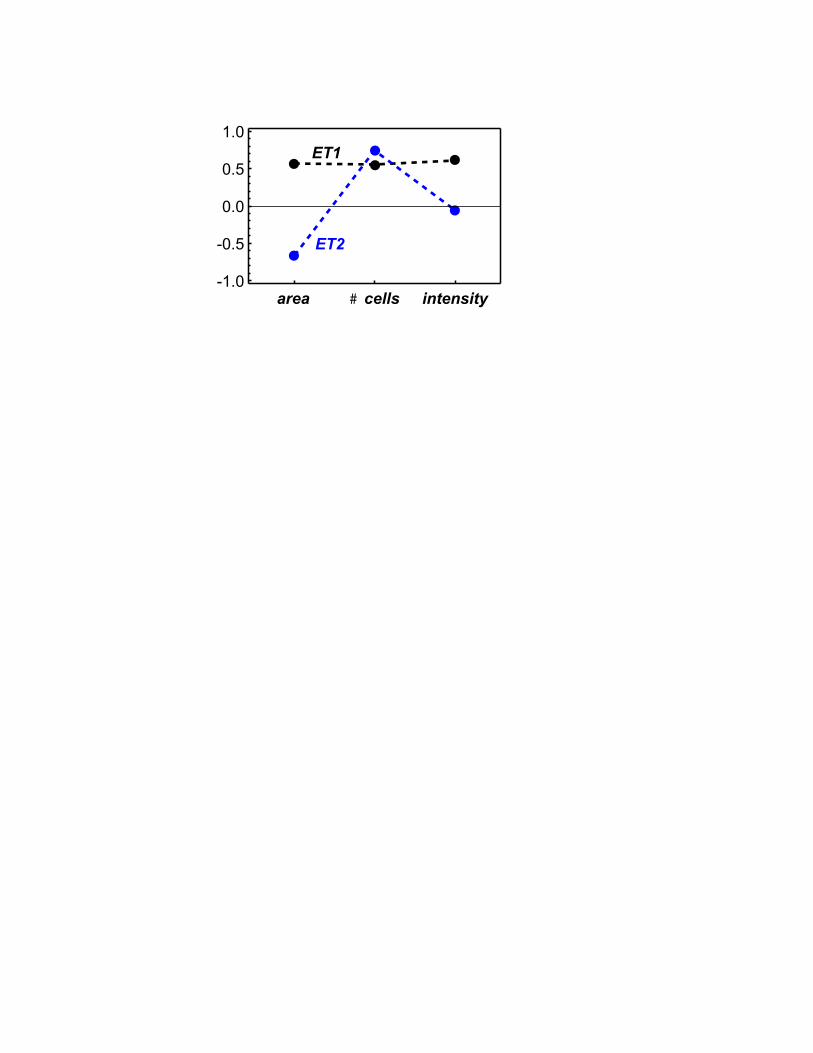
orthogonal, normalized combinations of the phenotypes (Figure 1) and represented 87%, 11.5%,
and 1.5% of the variance in the data. Since the bulk of the variance was present in the first two
11
eigentraits we discarded the third. We refer to these composite phenotypes as eigentrait 1 (ET1)
and eigentrait 2 (ET2). ET1 is a common signal to all three phenotypes, whereas ET2 primarily
differentiates nuclear area from cell number and nuclear intensity. Thus the inferences made for
genetic interactions will be mostly based on combining an overall common signal with a signal
that separates nuclear area from the other two, highly-correlated phenotypes.
For each eigentrait we performed linear regression for each knockdown individually,
similar to the method in the original study (HORN et al. 2011). This identified significant
knockdowns to be used as covariates in pair-wise scans (Methods). We identified 21
knockdowns as covariates for ET1 and 17 knockdowns for ET2 (Table 1, Figures S1 and S2).
We next computed a pair-wise model for each of the 4278 knockdown pairs to obtain
quantitative interactions between knockdowns (Table S1). We reparametrized the two interaction
coefficients from pair-wise linear regression on the eigentraits (Methods, Eq. 2) in terms of two
knockdown-to-knockdown influences between perturbations (Methods, Eq. 4) (CARTER et al.
2012). To determine the allelic effects on the original cellular phenotypes, we recomposed the
phenotype SVD for each pair-wise model and averaged all models to obtain knockdown-to-
phenotype influence coefficients (Methods). Errors were estimated for all coefficients using
standard least-squares regression and error propagation formulas for quantities computed from
regression coefficients (Methods, Eq. 5).
A representative interaction is illustrated in Figure 2. The drk and Rho1 knockdowns
have opposite effects on the first eigentrait (Figure 2A) and a negative regression interaction
coefficient (Figure 2B). For the second eigentrait, both knockdowns have positive effects and the
regression interaction coefficient is negative and larger than that for ET1. Reparametrizing these
results in terms of our genetic influence coefficients inferred a significant negative influence

12
from drk to Rho1 (Figure 2C); that is, the drk knockdown suppressed the effects of the Rho1
knockdown. The complementary information in the two eigentraits ruled out alternative
hypotheses such as a Rho1 enhancement of the drk effect that would have been consistent with
ET1 but not ET2. Finally, we recomposed the eigentraits into the original phenotypes (Figure
2D), an operation that does not modify the inferred genetic interaction. This analysis
recapitulates the interpretation in Horn, et al. (HORN et al. 2011) with the advantage of a
mathematically defined procedure that has been systematically applied to all pairs of
knockdowns in the data set. In total, we obtained a network of 290 significant knockdown-to-
knockdown edges and 146 significant knockdown-to-phenotype edges. Interactions for 61 genes
with existing or novel (see below) functional annotations are shown in Figure 3.
Sixty-three knockdowns had a significant main effect (p < 0.01; Methods) on at least one
of the three phenotypes, and 29 had significant influences on all three phenotypes (Figure 3).
Knockdowns of the 18 genes previously annotated for Ras signaling had 48 negative effects,
compared to only one positive effect (CG3573 (Ocrl) knockdown on nuclear area). By contrast,
knockdowns of the 29 genes previously annotated for JNK cascade and Ras inhibition had 48
positive main effects, compared to 13 negative effects. These findings are consistent with Ras
signaling activation of cell proliferation and growth and the generally antagonistic relationship
between Ras and JNK signaling. For each knockdown, main effects were generally consistent
across all partners in each pair-wise scan; no specific combination of knockdowns revealed a
uniquely significant effect for one of the genes.
Our total of 290 significant knockdown-to-knockdown interactions out of 8556 possible
(two for each pair) was numerically comparable to the 531 significant interactions out of 12,834
possible (three phenotypes for each pair) obtained with the same threshold in the previous study

13
(HORN et al. 2011). Gene pairs with at least one significant interaction in both analyses strongly
overlapped, as 55% (126/229 pairs) of our significant pairs were also significant in at least one
phenotype in Horn, et al. (8 x 10-88, Fisher’s exact test). Pairs that did not overlap nevertheless
tended to have low q-values in Horn, et al. For each of our pairs we identified the lowest q-value
across all three phenotypes, and found a median of 0.006 as compared to a global median lowest
q-value of 0.38. This demonstrates that our analysis generally agreed with more standard
measures of epistasis and, in some cases, improved significance by reformulation in terms of
directional model parameters.
Global genetic interaction patterns revealed large-scale gene function and
module/pathway organization (Figures 3 and S3). Knockdown-to-knockdown influences
between knockdowns of documented Ras signaling genes were fairly common (63% of possible
interactions were significant) and always negative. We interpret this as genes with redundant
signaling functions. Although it is suggestive that downstream knockdowns should suppress
upstream knockdowns (AVERY and WASSERMAN 1992; CARTER et al. 2012), the majority of
pair-wise knockdowns of known Ras genes exhibited significant negative interactions in both
directions. In cases of uni-directional suppression, some known downstream knockdowns (e.g.,
pnt) tended to suppress upstream proteins (e.g., Ras85D and Sos) but others (e.g., rl) were
suppression targets more often than not. Overall, there is a clear pattern of negative interactions
between within-pathway genes. In contrast, Ras inhibitor knockdowns tended to enhance the
effect of knockdowns of Ras signaling genes. This is consistent with standard interpretations of
genetic interactions in signaling. For example, PTP-ER is named for its mutant alleles that
enhance Ras signaling in eye development (KARIM and RUBIN 1999). Furthermore, knockdowns
14
of genes documented or predicted to be involved in JNK signaling generally enhanced Ras
mutations, consistent with the antagonistic relationship between JNK and Ras signaling.
Specific edges in the interaction network allowed us to infer the function of many
uncharacterized genes, based on the rule that knockdowns functioning in the same signaling
process will exhibit suppressive interactions whereas knockdowns functioning in antagonistic
processes will exhibit enhancing interactions (AVERY and WASSERMAN 1992). We assessed the
interactions for 45 genes not previously associated with Ras or JNK signaling and one gene
(Rho1) which had been annotated for both (FLYBASE 2004; NOSELLI and AGNES 1999). Novel
pathway assignments were made when an unannotated knockdown exhibited interactions with
Ras knockdowns annotated in Horn, et al (HORN et al. 2011) or curated data (FLYBASE 2004).
Negative interaction partners were candidate Ras signaling genes while positive interaction
partners were designated as Ras inhibitors. We assigned Ras signaling function to three
knockdowns that suppressed the effect of one or more Ras signaling knockdowns and/or had its
effect enhanced by one or more Ras inhibitor knockdowns (Table 2). These novel Ras signaling
knockdowns had generally negative influences on cell number and nuclear area (Figure 3),
consistent with other Ras signaling knockdowns. The multi-annotated gene Rho1 was in this
group, suggesting that for the measured phenotypes it operates as a Ras signaling component.
We assigned Ras inhibitor function to 13 knockdowns that enhanced the effect of one or more
Ras signaling knockdowns and/or had its effect enhanced by one or more Ras signaling
knockdowns (Table 2 and Figure 3). In most cases these novel Ras inhibitor knockdowns
suppressed the knockdown of a fellow Ras inhibitor knockdown and the vast majority had a
positive influence on cell number and nuclear area (Figure 3), consistent with other Ras
inhibitors. Ten of these genes are annotated as phosphatases and, in many cases, we identified

15
specific Ras signaling kinases for which knockdown effects are uni-directionally enriched by one
or more phosphatase knockdowns (Figure 4). These provide specific hypotheses for the
prioritization of phosphatase-kinase targeting experiments. The inferred Ras-inhibitor
phosphatase PpD3 exhibited mutual enhancing interactions with Ras knockdowns Sos, Ras85D,
and rl (Figure 3), which suggests a more complex role in Ras inhibition. Taken in sum, these 16
new functional hypotheses can be added to the set of approximately 20 novel pathway
assignments inferred in the original, classifier-based analysis of the interaction data (HORN et al.
2011).
DISCUSSION
We have used a strategy that combines patterns of epistasis and pleiotropy to derive a
large-scale network mapping how mutations in signaling genes interact to affect distinct
phenotypes. The approach integrates information in multiple phenotypes to resolve ambiguities
in model interpretation that arise when individual phenotypes are analyzed in isolation. We have
demonstrated the applicability of this strategy to large-scale data, in this case involving 4278 cell
lines that mix 93 genetic perturbations. Significant knockdown-to-knockdown interactions were
obtained among 68 knockdowns even though each was fairly rare in the population (present in
2.2% of lines). While the original analysis of this data (HORN et al. 2011) revealed patterns of
genetic interactions separately for each phenotype, this analysis combines the multi-phenotype
patterns of epistasis to derive directional models of genetic interactions that are consistent across
all three phenotypes. This additional mathematical analysis recovered previous findings and was
used to propose additional functional relationships between gene pairs.
16
Many of the interactions in the network (Figure 3) recapitulated known relationships.
Genes that function in the same pathways show consistent, suppressive genetic interactions
across a spectrum of interaction partners. This is consistent with the idea that mutations with
redundant effects suppress each other, particularly in signaling pathways. The spectral
consistency for interactions, which has been previously referred to as “genetic
monochromaticity” (SEGRE et al. 2005), is maintained after their reparametrization in terms of
directional influences. A similar spectral consistency is demonstrated for enhancing interactions
from pairs spanning multiple pathways. We interpret this enhancement as a signature of an
antagonistic relationship. For instance, a knockdown of a Ras inhibitor will increase Ras
signaling activity, and therefore a subsequent Ras knockdown will have an enhanced effect since
the signaling baseline is increased (cf. PTP-ER, Results). Following this interpretation, in
addition to spectral consistency, these interactions can map activation and suppression across the
Ras and JNK pathways. The specificity represents de novo derivation of key functional
relationships that are more difficult to detect when analyzing each phenotype independently.
We note that classical synthetic effects, in which two perturbations with insignificant
main effects generate a strong effect in combination, would also produce enhancing interactions.
We did not observe any such cases in our data. When we broaden the definition to include
knockdowns with main effects and greater than additive combinatorial effects, all with the same
sign (positive or negative), we find only two candidate interactions. Gap1 knockdown enhances
Rho1 knockdown activity and both positively affect nuclear area and nuclear intensity; however
they show opposite effects on cell number and therefore the effect is not consistently synthetic
(Figure 3). A less ambiguous candidate is the strong enhancement of kay knockdown effects by
Src42A knockdown. Both perturbations significantly decrease nuclear intensity, and this effect

17
becomes significantly greater when the knockdowns are combined. These genes, both annotated
as JNK pathway elements, provide the only unambiguous instance of synthesis in the data.
Our analysis provides new and refined information on gene-gene relationships and places
this information in a network context. At a single-interaction level, we identified novel candidate
Ras inhibitors and co-activators (Table 2 and Figure 4). At a network-wide level, these genes
were spectrally consistent with other genes of similar known function (Figures 3 and S3). Thus,
although prior information is usually helpful in placing new candidate mutations in a functional
context, the interactions we inferred represent a de novo model of enhancement or suppression
with functional implications. Furthermore, some of the network inferences propose refinements
of current knowledge, such as the hypothesis that Rho1 is primarily a Ras signaling gene in the
context of the measured phenotypes. Likewise, the interaction patterns and phenotype influences
of the kayak (kay) knockdown suggest that its functional role in cell proliferation is more similar
to Ras signaling genes than JNK cascade genes, in contrast to its similarity to JNK in dorsal
closure (HARDEN 2002). Specifically, the kay knockdown resembled Ras signaling genes by
suppressing the knockdown effect of multiple Ras signaling genes, being enhanced by the
knockdown of multiple JNK cascade genes, and having a negative main effect on cell number
(Figure 3).
In particular, our analysis suggested novel Ras inhibitors not detected the previous study
using the same data (HORN et al. 2011). In most cases, inhibitor knockdowns redundantly
enhanced multiple kinases (Figure 4). This could be due to non-specific phosphatase activity, but
is potentially a result of functional redundancy among the kinases that leads to similar genetic
interactions between a phosphatase and both its direct target and genes that co-function with that
target in a signaling cascade. One possible avenue to resolve this ambiguous redundancy would

18
be to extend the interaction analysis beyond independent pair-wise analysis to models that find
the most parsimonious model for three or more genes (CARTER et al. 2007). We note that the
majority of these phosphatase knockdowns significantly suppressed the Gap1 knockdown,
providing evidence of redundant function with a known Ras85D inhibitor. We also note that a
number of additional enhancing interactions from phosphatases to kinases that did not meet our
significance threshold were also detected, providing additional evidence of functional coherence
but target non-specificity. However, there does seem to be limited specificity in that CG3632 and
Ptp99A enhance drk and Sos, genes that fall relatively upstream in the KEGG-annotated Ras
pathway, while CG7115 and Pdp knockdowns most strongly enhance the relatively downstream
pathway knockdown Ras85D. In contrast, phosphatase knockdowns l(1)G0232 and CG3530
enhance the Pvr knockdown, which is not placed in the KEGG-annotated Ras cascade. The
additional information that the Pvr knockdown tends to uni-directionally suppress the KEGG
pathway genes suggests that Pvr potentially acts downstream of the KEGG-annotated pathway
and is deactivated by the phosphatases l(1)G0232 and CG3530. Thus, even with the ambiguities
arising from pair-wise models, we obtained a degree of specificity in hypotheses for Ras
inhibitor activity.
The network of directional influences suggests hypotheses that are often amenable to
experimental testing (CARTER et al. 2007). In contrast with non-directional associations such as
coexpression, statistical epistasis, or synthetic lethality, a directional influence identifies a driver
mutation that affects the activity of its target, a second gene that, in turn, affects the phenotype.
With this in mind, we can predict that removing the influence with an experimental perturbation,
such as an exogenous inhibitor molecule, would nullify the effect of mutations in the target gene.
Furthermore, the effect type (enhancement or suppression) specifies the nature of the effect on

19
the target gene. We can therefore predict that overexpression of a novel Ras inhibitor will not
only affect, but specifically reduce the relevant activity of its enhanced targets, whereas
perturbations of the targets are not expected to affect the Ras inhibitor. For example,
overexpression of Ptp99A will specifically inhibit the activity of Ras signaling proteins Cka, drk,
mts, and Sos. In this way, a network of directional genetic interactions could prove useful in the
selection of candidate genes for validation and, in disease-related networks, the prioritization of
therapeutic targets.
Our analysis was limited by the genotypes and specific phenotypes selected in the
original study. Although the three phenotypes used exhibit differential interaction patterns
(HORN et al. 2011), their high correlation limited the complementary information that could
better resolve directional interactions. By probing additional phenotypes, new interactions might
be detected and existing interactions refined. For instance, we speculate that mutual
cosuppression among Ras signal knockdowns is potentially due to measuring insufficiently
distinct outputs. Combining detailed assays of eye development and terminal patterns might have
revealed more specific roles and pathway order for canonical Ras signaling proteins.
Furthermore, although the genetic perturbations are limited to MAPK signaling genes, the
methods could be applied to a wider screen or population-based analysis to identify additional
pathway relationships. As data collection in experimental systems and clinical studies becomes
more diverse and quantitative, our analytical method has the potential to derive more refined and
precise network models.
The approach we have applied derives quantitative, directional models of how each gene
knockdown modifies the effects of each other knockdown. It represents an alternative to guilt-
by-association methods that infer function by scoring correlations across large-scale data. Taken

20
together as a network, the interactions form consistent patterns between and within gene
modules. Large-scale data and prior information is helpful but not necessary because guilt
precedes association in our analysis. This allowed us, for instance, to propose new candidate Ras
inhibitors that are consistent with known Ras inhibitors, but do not necessarily depend on this
prior knowledge for functional inference.
ACKNOWLEDGEMENTS
I thank Chad Meyers and Gary Churchill for fruitful discussions and Tonnya Norwood
for a critical reading of the manuscript. This work was supported by grants K25 GM079404 and
P50 GM076468 from NIGMS. The content is solely the responsibility of the author and does not
necessarily represent the official views of the NIMGS or the NIH.

21
FIGURE CAPTIONS
Figure 1. Eigentrait compositions in terms of measured phenotypes. Eigentrait 1 (ET1) is the
signal common to all three phenotypes, whereas eigentrait 2 (ET2) encodes the differences.
Figure 2. Genetic interactions between drk and Rho1 knockdowns. (A) Inferred main and
interaction effects of drk and Rho1 mutations on eigentraits ET1 and ET2. (B) Significant main
and interaction effects, in terms of positive (green) and negative (red) influences. Edge width
represents interaction strength. (C) Interaction model consistent with both ET1 and ET2, in
which drk knockdown suppresses Rho1 knockdown. (D) The same model expressed in terms of
the original phenotypes of total cell number and nuclear area (total fluorescent intensity is similar
to cell number and not shown).
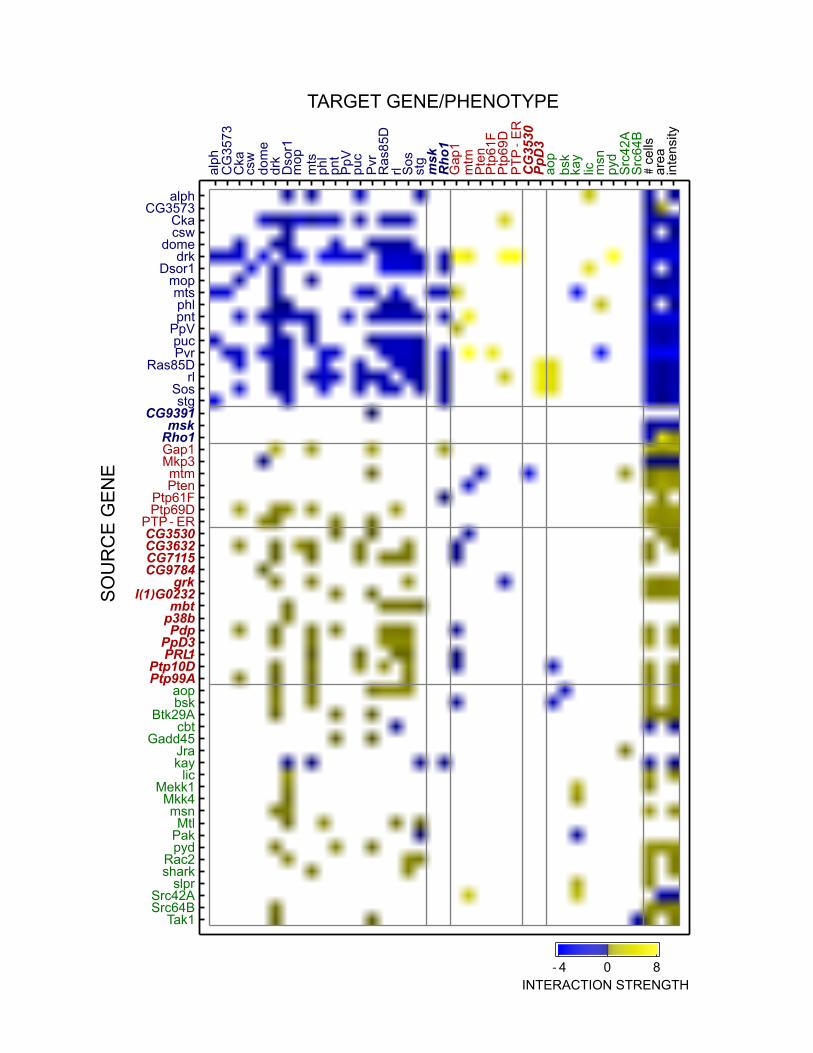
Figure 3. Adjacency matrix of significant interactions for knockdowns of Ras (blue labels), Ras
inhibitors (red labels), and JNK (green labels) genes. Previously uncharacterized genes names
are in italics. Color denotes interaction sign and intensity of directional interactions. Overall,
within-pathway interactions are overwhelmingly suppressive (blue squares) whereas interactions
across antagonistic pathways are enhancing (yellow squares). Ras knockdowns generally reduce
cellular phenotypes while Ras inhibitors and JNK knockdowns increase phenotypes. Empty
squares did not meet the significance threshold of p < 0.01 (see text).
Figure 4. Network of novel candidate Ras inhibitor phosphatases and Ras kinases inferred from
interaction patterns. Knockdowns of phosphatase genes (orange nodes) enhance the effects of
Ras kinase knockdowns (blue nodes), similar to known Ras inhibitors and JNK signaling genes
(Figure 3). Edge width denotes relative strength of enhancement.

22
TABLES
Knockdown βET1 βET2 Pathway alph 0.0093 Ras
CG3573 0.0141 Ras Cka -0.0126 Ras
dome -0.0205 Ras drk -0.0373 0.0092 Ras
Dsor1 -0.0084 0.0209 Ras Gap1 0.0152 -0.0099 Ras inhibitor
lic -0.0105 JNK mop -0.0089 Ras msk -0.0095 mtm 0.0086 Ras inhibitor mts -0.0255 0.0215 Ras pnt -0.0382 -0.0108 Ras PpV -0.0101 Ras Pten 0.0110
Ptp69D 0.0109 Ras inhibitor PTP-ER 0.0087 Ras inhibitor
puc -0.0153 0.0133 Ras Pvr -0.0600 -0.0189 Ras pyd 0.0091 JNK
Ras85D -0.0101 0.0108 Ras Rho1 0.0139 0.0741
rl -0.0106 0.0106 Ras Sos -0.0104 0.0108 Ras
Src42A -0.0163 JNK stg -0.0123 0.0220 Ras
Table 1. Genes with significant main effects used as covariates for all pair-wise scans, with prior
pathway annotation (FLYBASE 2004).
23
Pathway Knockdown Interaction
Partners Annotated Function
Ras signaling
CG9391 Pvr inositol monophosphate 1-phosphatase msk mts Ran GTPase binding, protein transport
Rho1 drk, Dsor1, mts, pnt, Pvr, Ras85D,
rl, Sos, stg
kinase binding (JNK cascade and GTPase signal transduction both predicted)
Ras inhibitor
CG3530 pnt, Pvr protein tyrosine/serine/threonine phosphatase CG3632 Cka, drk, mop,
mts, puc, Sos protein tyrosine/serine/threonine phosphatase
CG7115 drk, mts, puc, Ras85D, rl, Sos
protein serine/threonine phosphatase, cell adhesion
CG9784 dome inositol trisphosphate phosphatase grk drk, mts, Sos epidermal growth factor receptor binding
l(1)G0232 pnt, Pvr non-membrane spanning protein tyrosine phosphatase
mbt Dsor1, Ras85D, rl, Sos, stg
protein serine/threonine kinase, negative regulation of cell size
p38b Dsor1 protein serine/threonine MAP kinase, stress response, positive regulation of cell size
Pdp Cka, drk, mts, pnt, Ras85D, rl, Sos
protein serine/threonine phosphatase
PpD3 drk, mts, Ras85D, rl, Sos
protein serine/threonine phosphatase, mitotic cell cycle
PRL-1 mts, puc, rl, Sos prenylated protein tyrosine phosphatase Ptp10D drk, mts, puc,
Ras85D, Sos protein tyrosine phosphatase, central nervous system development
Ptp99A Cka, drk, mts, Sos transmembrane receptor protein tyrosine phosphatase, motor axon guidance
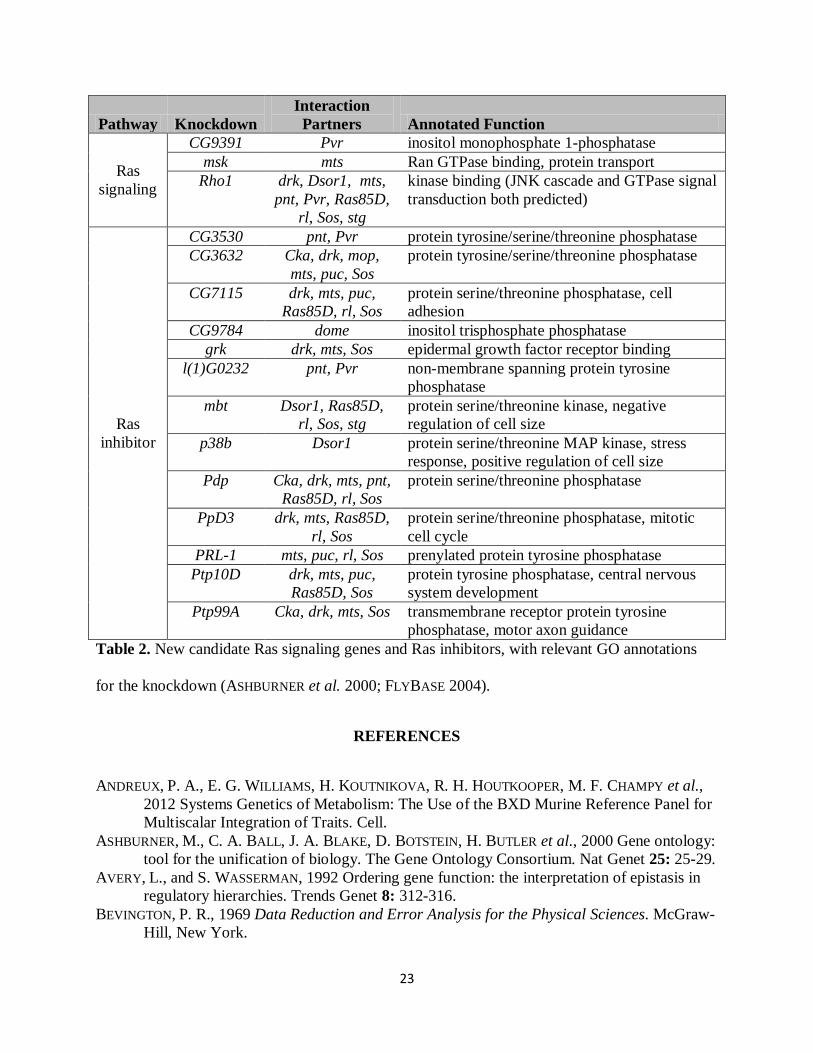
Table 2. New candidate Ras signaling genes and Ras inhibitors, with relevant GO annotations
for the knockdown (ASHBURNER et al. 2000; FLYBASE 2004).
REFERENCES
ANDREUX, P. A., E. G. WILLIAMS, H. KOUTNIKOVA, R. H. HOUTKOOPER, M. F. CHAMPY et al., 2012 Systems Genetics of Metabolism: The Use of the BXD Murine Reference Panel for Multiscalar Integration of Traits. Cell.
ASHBURNER, M., C. A. BALL, J. A. BLAKE, D. BOTSTEIN, H. BUTLER et al., 2000 Gene ontology: tool for the unification of biology. The Gene Ontology Consortium. Nat Genet 25: 25-29.
AVERY, L., and S. WASSERMAN, 1992 Ordering gene function: the interpretation of epistasis in regulatory hierarchies. Trends Genet 8: 312-316.
BEVINGTON, P. R., 1969 Data Reduction and Error Analysis for the Physical Sciences. McGraw-Hill, New York.

24
BOONE, C., H. BUSSEY and B. J. ANDREWS, 2007 Exploring genetic interactions and networks with yeast. Nat Rev Genet 8: 437-449.
BYRNE, A. B., M. T. WEIRAUCH, V. WONG, M. KOEVA, S. J. DIXON et al., 2007 A global analysis of genetic interactions in Caenorhabditis elegans. Journal of biology 6: 8.
CARTER, G. W., D. J. GALAS and T. GALITSKI, 2009 Maximal extraction of biological information from genetic interaction data. PLoS Comput Biol 5: e1000347.
CARTER, G. W., M. HAYS, A. SHERMAN and T. GALITSKI, 2012 Use of Pleiotropy to Model Genetic Interactions in a Population. PLoS Genetics 8: e1003010.
CARTER, G. W., S. PRINZ, C. NEOU, J. P. SHELBY, B. MARZOLF et al., 2007 Prediction of phenotype and gene expression for combinations of mutations. Molecular systems biology 3: 96.
CHEN, R., G. I. MIAS, J. LI-POOK-THAN, L. JIANG, H. Y. LAM et al., 2012 Personal omics profiling reveals dynamic molecular and medical phenotypes. Cell 148: 1293-1307.
COLLINS, S. R., K. M. MILLER, N. L. MAAS, A. ROGUEV, J. FILLINGHAM et al., 2007 Functional dissection of protein complexes involved in yeast chromosome biology using a genetic interaction map. Nature 446: 806-810.
COSTANZO, M., A. BARYSHNIKOVA, J. BELLAY, Y. KIM, E. D. SPEAR et al., 2010 The genetic landscape of a cell. Science 327: 425-431.
DREES, B. L., V. THORSSON, G. W. CARTER, A. W. RIVES, M. Z. RAYMOND et al., 2005 Derivation of genetic interaction networks from quantitative phenotype data. Genome Biol 6: R38.
FLYBASE, 2004 Gene Ontology annotation in FlyBase through association of InterPro records with GO terms, pp.
GILLIS, J., and P. PAVLIDIS, 2012 “Guilt by Association” Is the Exception Rather Than the Rule in Gene Networks. PLoS Comput Biol 8: e1002444.
HARDEN, N., 2002 Signaling pathways directing the movement and fusion of epithelial sheets: lessons from dorsal closure in Drosophila. Differentiation; research in biological diversity 70: 181-203.
HOLM, S., 1979 A simple sequentially rejective multiple test procedure. Scand. J. Statist. 6: 65-70.
HORN, T., T. SANDMANN, B. FISCHER, E. AXELSSON, W. HUBER et al., 2011 Mapping of signaling networks through synthetic genetic interaction analysis by RNAi. Nature methods 8: 341-346.
KARIM, F. D., and G. M. RUBIN, 1999 PTP-ER, a novel tyrosine phosphatase, functions downstream of Ras1 to downregulate MAP kinase during Drosophila eye development. Molecular cell 3: 741-750.
LEHNER, B., C. CROMBIE, J. TISCHLER, A. FORTUNATO and A. G. FRASER, 2006 Systematic mapping of genetic interactions in Caenorhabditis elegans identifies common modifiers of diverse signaling pathways. Nature genetics 38: 896-903.
LI, R. H., and G. A. CHURCHILL, 2010 Epistasis contributes to the genetic buffering of plasma HDL cholesterol in mice. Physiological genomics 42A: 228-234.
MCKINNEY, B. A., and N. M. PAJEWSKI, 2011 Six Degrees of Epistasis: Statistical Network Models for GWAS. Frontiers in genetics 2: 109.
MICHAUT, M., and G. D. BADER, 2012 Multiple genetic interaction experiments provide complementary information useful for gene function prediction. PLoS computational biology 8: e1002559.

25
NOSELLI, S., and F. AGNES, 1999 Roles of the JNK signaling pathway in Drosophila morphogenesis. Current opinion in genetics & development 9: 466-472.
REIFSNYDER, P. C., G. CHURCHILL and E. H. LEITER, 2000 Maternal environment and genotype interact to establish diabesity in mice. Genome research 10: 1568-1578.
RITCHIE, M. D., 2011 Using biological knowledge to uncover the mystery in the search for epistasis in genome-wide association studies. Annals of human genetics 75: 172-182.
SEGRE, D., A. DELUNA, G. M. CHURCH and R. KISHONY, 2005 Modular epistasis in yeast metabolism. Nat Genet 37: 77-83.
SHAO, H., L. C. BURRAGE, D. S. SINASAC, A. E. HILL, S. R. ERNEST et al., 2008 Genetic architecture of complex traits: large phenotypic effects and pervasive epistasis. Proceedings of the National Academy of Sciences of the United States of America 105: 19910-19914.
ST ONGE, R. P., R. MANI, J. OH, M. PROCTOR, E. FUNG et al., 2007 Systematic pathway analysis using high-resolution fitness profiling of combinatorial gene deletions. Nat Genet 39: 199-206.
YAMAMOTO, A., R. R. ANHOLT and T. F. MACKAY, 2009 Epistatic interactions attenuate mutations affecting startle behaviour in Drosophila melanogaster. Genetics research 91: 373-382.
ET1
ET2
area # cells intensity-1.0
-0.5
0.0
0.5
1.0

A DCB
drk Rho1
ET2
ET1
drk Rho1
area
# cells
ET1
ET2
drk Rho1 drkRho1
-0.10
-0.05
0.00
0.05
0.10
drk Rho1
ET2
drk Rho1
ET1
alphCG3573
Ckacsw
domedrk
Dsor1mopmtsphlpnt
PpVpucPvr
Ras85Drl
Sosstg
CG9391msk
Rho1Gap1Mkp3mtmPten
Ptp61FPtp69D
PTP - ERCG3530CG3632CG7115CG9784
grkl(1)G0232
mbtp38bPdp
PpD3PRL-1
Ptp10DPtp99A
aopbsk
Btk29Acbt
Gadd45Jrakay
licMekk1
Mkk4msn
MtlPakpyd
Rac2shark
slprSrc42ASrc64B
Tak1
alph
CG
3573
Cka
csw
dom
edr
kD
sor1
mop
mts
phl
pnt
PpV
puc
Pvr
Ras
85D
rl Sos
stg
msk
Rho
1G
ap1
mtm
Pte
nP
tp61
FP
tp69
DP
TP-E
RC
G35
30Pp
D3
aop
bsk
kay
lic msn
pyd
Src
42A
Src
64B
#ce
llsar
eain
tens
ity
- 4 0 8
SO
UR
CE
GE
NE
TARGET GENE/PHENOTYPE
INTERACTION STRENGTH

Pdp
drk
Ptp99A Ptp10D l(1)G0232
PvrSos
CG7115
Ras85D
PRL-1
rl
CG3632 CG3530