inff bb1.1 financing needs assessment final 02 dec
TRANSCRIPT
This version: December 2020 Comments and feedback: [email protected]
1
BB1.1 Assessment and diagnostics – Financing needs
Contents BB1.1 Assessment and diagnostics – Financing needs ................................................ 1
1. Brief overview ............................................................................................................... 1
2. The value of financing needs assessments .................................................................. 4
3. Scope and limitations ................................................................................................... 5
4. ‘How to’ - Financing needs assessments in practice .................................................... 6
4.1 Suggested approach .................................................................................................. 6
4.2 Data sources ............................................................................................................ 22
4.3 Existing tools ............................................................................................................ 23
5. Financing needs diagnostics in different country contexts ......................................... 29
6. Lessons learned ......................................................................................................... 29
1. Brief overview Financing needs1 assessments estimate the cost of implementing national development priorities. Together with findings from the financing landscape assessment (the ‘supply side’), they can be used to develop resource mobilization targets, as a first step toward linking planning and financing processes and developing a financing strategy. Financing needs assessments can also deepen the understanding of the interventions needed to achieve development priorities and serve as a reality check on national development strategies.
In practice, financing needs can be assessed in different ways. Quantitative costing methodologies range from macro, top-down costing exercises (to establish an estimate of overall financing requirements for a national development plan, or to determine the cost of achieving global goals) to activity-based, detailed bottom-up calculations (to prepare annual budgets, determine relatively short-term or intervention-specific sectoral needs, or for project finance). Such quantitative costing exercises can inform budgeting and planning at the sub-national and national, sectoral or economy-wide level, as well as around cross-cutting priorities such as gender equality. They also inform regional and global policy processes (see Table 1).
Many countries already regularly assess financing needs in the context of public budgets, for example, when developing annual and multi-year government revenue and expenditure plans. Some countries have taken additional steps in recent years to develop broader assessments of medium- and long-term financing needs for achieving the SDGs. Such broader assessments also consider the role that non-public finance can play in fulfilling development financing needs but may now be out-of-date due to the impacts of Covid-19.
Not all countries may deem a full, detailed financing needs assessment necessary. In these instances, more informal approaches could be considered, such as qualitative
1 ‘Financing needs’ refers to the amount (and type) of finance needed to implement identified projects and/or national development priorities; this can be public, private, concessional, non-concessional, domestic or external finance, in line with the Addis Ababa Action Agenda. It is thus much broader than ‘gross financing needs’ (fiscal deficit plus maturing debt) as used in public finance.

This version: December 2020 Comments and feedback: [email protected]
2
considerations of the financing context that would have to be in place for specific outcomes to materialize (see practical experience with less formal approaches in Section 5).
This guidance note introduces the main costing methodologies and collates tools and experiences from domestic and international actors who have undertaken financing needs assessments. It guides practitioners in applying them in the context of integrated national financing frameworks, and thus puts special emphasis on integration across sectors, policy priorities and financing options, medium-to long-term perspectives, on addressing risk, and on addressing sustainability in all its dimensions.

This version: December 2020 Comments and feedback: [email protected]
3
Table 1. Examples and utility of costings at different levels
National or sub-national level costings specific to a sector/ SDG or an intervention/ activity
National level costings covering entire national development plans or multiple/ all SDGs
Global or regional level costings specific to a sector/ SDG or to an intervention/ activity
Global or regional level costings covering all or multiple SDGs
Examples of findings
• Yearly cost of delivering direct nutrition interventions in different Indian states (Maternal and Child Nutrition, 2016)
• Funding requirements for university education in 2020/2021 in Kenya: KES 154 billion (Kenya Education Sector MTEF 2021-2023)
• Total cost and resource gaps for identified interventions related to improving maternal health in Guyana (Guyana, 2014)
• Total cost of Sierra Leone’s 2019-2023 national development plan: US$8.15 billion, and related funding gap: US$1.55 billion (Sierra Leone 2019)
• Annual investment needs for achieving the SDGs in Nepal: Rs 2 trillion / 48% of GDP (Nepal 2018)
• Funding needs for achieving child-centred SDGs in Ethiopia: US$8-30 billion, depending on the chosen scenario (UNICEF 2019)
• Annual funding needs for infrastructure in LICs and MICs: 2-9% of GDP (World Bank ‘Beyond the Gap’ 2019)
• US$675 million for critical COVID-19 pandemic response efforts in countries most in need (WHO 2020)
• Additional annual funding needs to achieve the SDGs in Asia-Pacific: US$1.5 trillion (UNESCAP 2019)
• Additional annual spending in 2030 to achieve SDGs in five areas in 155 countries: US$2.6 trillion (IMF 2019)
• Annual SDG investment needs in 59 LIDCs: US$1 trillion (SDSN 2019)
• Annual SDG investment needs globally: US$5-7 trillion; and for developing countries: US$3.3-4.5 trillion (UNCTAD WIR 2014)
Useful for • National and sub-national planning and budgeting
• Priority setting and resource allocation within sectors and/or geographically within country
• Target setting for resource mobilization in specific sectors or cross-cutting priority areas, such as gender equality
• Identifying key areas where international support may be needed/ priority setting for development cooperation
• National planning and budgeting
• Target setting for resource mobilization at the country level
• Quantifying financing gaps between national plan priorities and existing budget resources
• Evidence-driven advocacy to support strategic financing decisions
• Establishing scale of resource requirements to meet particular SDGs across the globe or in specific groups of countries
• Target setting for aggregate global resource mobilization
• 2030 Agenda reality checks
This version: December 2020 Comments and feedback: [email protected]
4
2. The value of financing needs assessments Financing needs assessments carried out in the context of INFFs can support countries to2:
- Inform resource mobilisation strategies, by providing targets for financing policies; - Strengthen planning, by providing an approximation of future spending needs, which
could serve as a reality check on national development strategies; - Prioritise allocation of public finance; - Identify priority areas for private sector investment; - Enhance engagement with development partners and other non-state actors on
financing priorities and elicit their expertise and insight on challenges and constraints;
- Provide insight on bottlenecks to progress and/or misalignment between spending allocations/ investments and national development priorities (see also BB.1.2 on financing landscape assessment and BB.1.4 on binding constraints analysis);
- Strengthen accountability and enhance transparency in resource allocation.
Clear policy objectives are a prerequisite for useful needs assessments. ‘For what?’ should always accompany the question ‘how much is needed?’ The types of objectives to be costed, e.g. as formulated in a national strategy or plan, and their country-specific contexts must guide the selection of the most suitable methodology and the scope of the exercise.
The value of financing needs assessments also depends on the quality and realism of assumptions that underpin them. Macro-economic projections and policy choices – which are at the basis of production functions and models used to estimate costs – influence financing needs. As the COVID-19 pandemic and recent large-scale climate-related disasters have shown, growth trajectories and development pathways can be interrupted or inverted in a matter of weeks due to external, unexpected shocks or unassessed disaster risk. In a global context of increasingly frequent crises, costing approaches that are unable to consider flexible policy or growth scenarios and risk will be of limited value.
For this reason, financing needs assessments can be most valuable when considered as part of regular and ongoing national policy processes, rather than one-off, resource-intensive exercises. Investment needs should be revisited regularly as part of ongoing financing and risk landscape scanning, with guiding assumptions and projections updated. This should not require setting up new processes and systems; countries likely have relevant policy and planning processes in place, and development partners can provide targeted support.
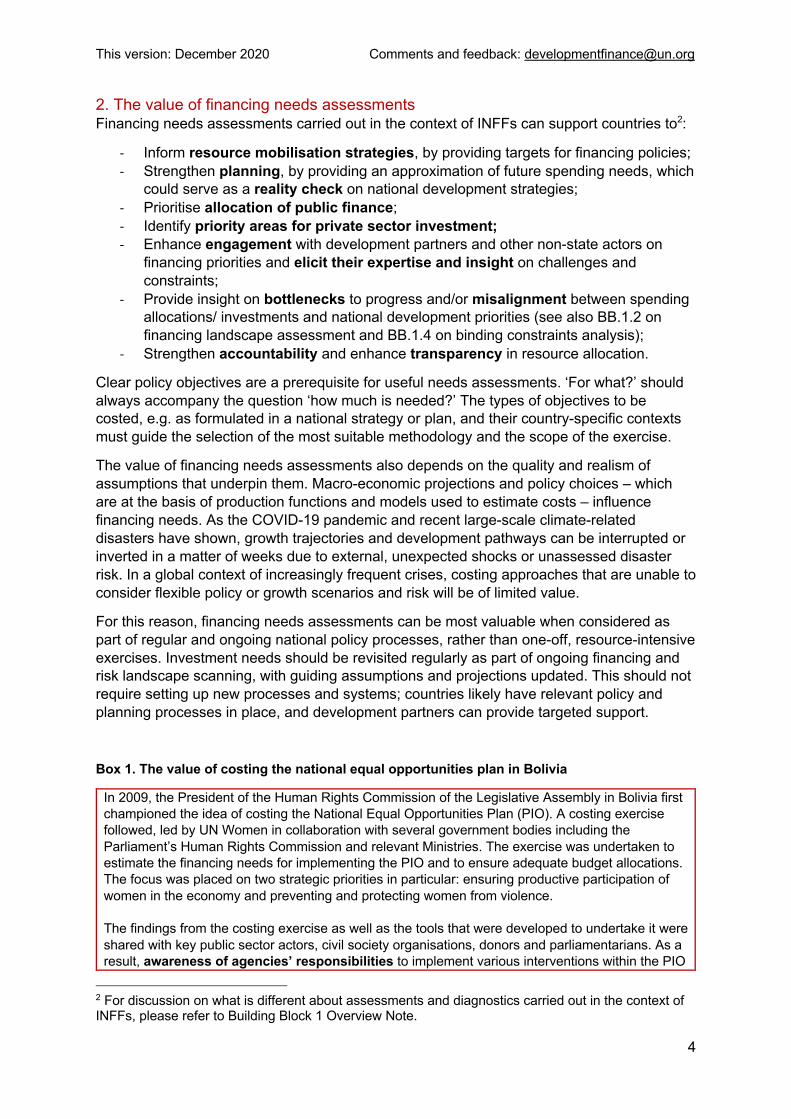
Box 1. The value of costing the national equal opportunities plan in Bolivia
In 2009, the President of the Human Rights Commission of the Legislative Assembly in Bolivia first championed the idea of costing the National Equal Opportunities Plan (PIO). A costing exercise followed, led by UN Women in collaboration with several government bodies including the Parliament’s Human Rights Commission and relevant Ministries. The exercise was undertaken to estimate the financing needs for implementing the PIO and to ensure adequate budget allocations. The focus was placed on two strategic priorities in particular: ensuring productive participation of women in the economy and preventing and protecting women from violence. The findings from the costing exercise as well as the tools that were developed to undertake it were shared with key public sector actors, civil society organisations, donors and parliamentarians. As a result, awareness of agencies’ responsibilities to implement various interventions within the PIO
2 For discussion on what is different about assessments and diagnostics carried out in the context of INFFs, please refer to Building Block 1 Overview Note.

This version: December 2020 Comments and feedback: [email protected]
5
was increased and the Ministry of the Presidency issued an instruction to public institutions to allocate budgets to implement various PIO actions. The costing exercise was also undertaken at the regional and municipal levels and provided the basis for a supreme decree through which municipalities were obliged to allocate resources toward the elimination of violence against women. Source: European Commission, ILO, UN Women (2015) ‘Handbook on Costing Gender Equality’
3. Scope and limitations The type and scope of costing exercises will depend on where a country is in its planning cycle, its respective needs, and available capacity (more on the latter in Section 5). Countries drafting their national development plans, or updating them to respond to the Covid-19 pandemic, may find it useful to map financing needs across all priority areas. If the national development plan is already costed, a mere check of whether costings could be improved (e.g. whether it remains valid in the context of Covid-19, and whether it fully incorporates sustainability considerations, gender equality, leave-no-one behind or other SDG-relevant considerations, see suggested approach in Section 4) or adjusted (if conditions change) may suffice.
The scope will also depend on policy objectives. When considering the financing requirements of an entire development plan, financing needs assessments cover a wide range of activities that are funded by public and private sources, and should thus consider all types of finance, beyond public resources, as well as synergies and overlaps between sectors, risks and potential shocks. They will also involve a wide range of stakeholders, across different sectors and expertise areas. At the opposite end of the spectrum, when considering the cost of a particular project, activity or intervention, financing needs assessments will be narrower in scope, involving a smaller range of actors, depending on the sector.
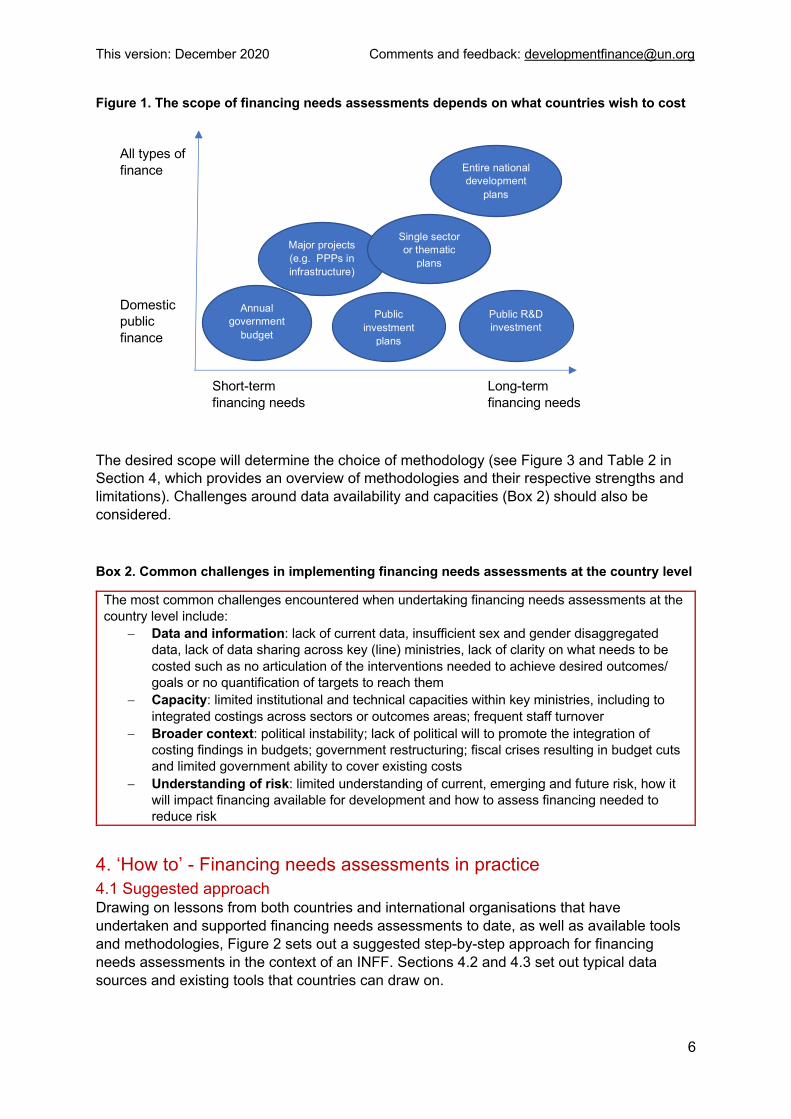
In the context of INFFs, financing needs assessments can be undertaken at various levels with different timeframes. Figure 1 illustrates major categories, such as costings for annual public budgets (detailed, with short timeframes), costings for major projects, such as investments in resilient infrastructure (which may go beyond public finance, e.g. PPPs), costings for medium-term public investment plans and long-term public investments, and costings for sectoral or national development plans (which may involve a role for both public and private financing).
This version: December 2020 Comments and feedback: [email protected]
6
Figure 1. The scope of financing needs assessments depends on what countries wish to cost
The desired scope will determine the choice of methodology (see Figure 3 and Table 2 in Section 4, which provides an overview of methodologies and their respective strengths and limitations). Challenges around data availability and capacities (Box 2) should also be considered.
Box 2. Common challenges in implementing financing needs assessments at the country level
The most common challenges encountered when undertaking financing needs assessments at the country level include:
- Data and information: lack of current data, insufficient sex and gender disaggregated data, lack of data sharing across key (line) ministries, lack of clarity on what needs to be costed such as no articulation of the interventions needed to achieve desired outcomes/ goals or no quantification of targets to reach them
- Capacity: limited institutional and technical capacities within key ministries, including to integrated costings across sectors or outcomes areas; frequent staff turnover
- Broader context: political instability; lack of political will to promote the integration of costing findings in budgets; government restructuring; fiscal crises resulting in budget cuts and limited government ability to cover existing costs
- Understanding of risk: limited understanding of current, emerging and future risk, how it will impact financing available for development and how to assess financing needed to reduce risk
4. ‘How to’ - Financing needs assessments in practice 4.1 Suggested approach Drawing on lessons from both countries and international organisations that have undertaken and supported financing needs assessments to date, as well as available tools and methodologies, Figure 2 sets out a suggested step-by-step approach for financing needs assessments in the context of an INFF. Sections 4.2 and 4.3 set out typical data sources and existing tools that countries can draw on.
Short-term financing needs
All types of finance
Domestic public finance
Long-term financing needs
Annual government
budget
Major projects (e.g. PPPs in infrastructure)
Single sector or thematic
plans
Public investment
plans
Entire national development
plans
Public R&D investment
This version: December 2020 Comments and feedback: [email protected]
7
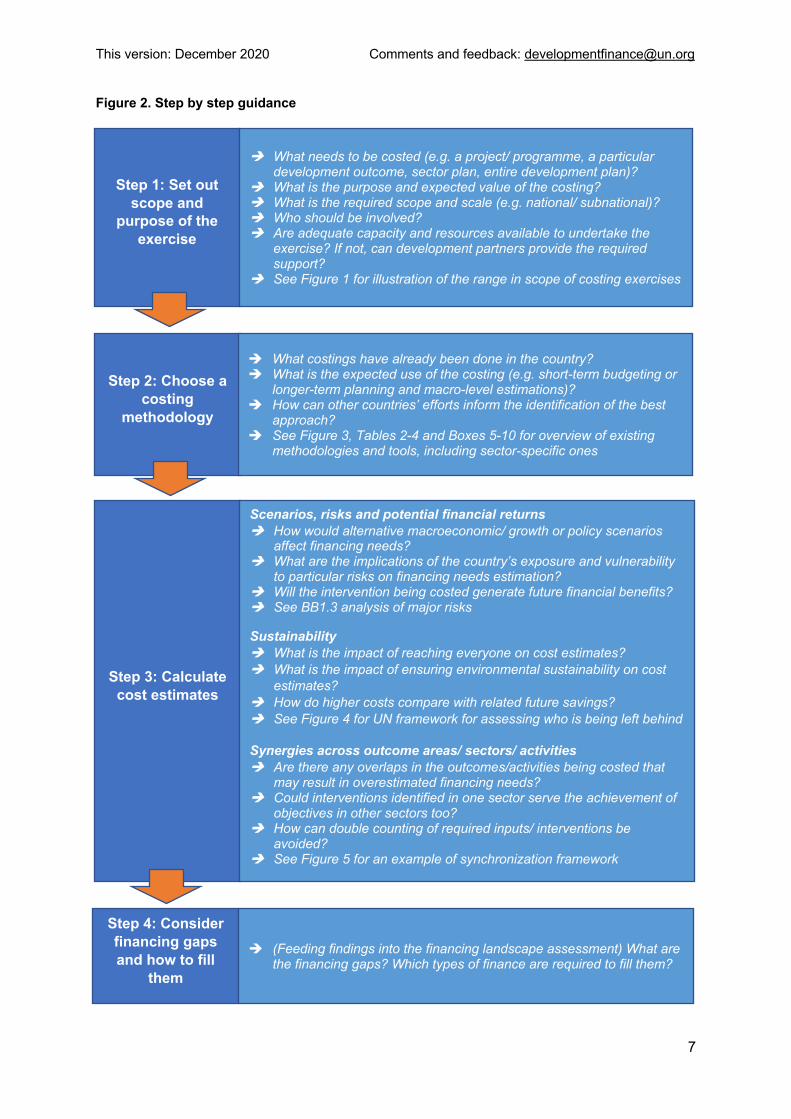
Figure 2. Step by step guidance
Step 1: Set out scope and
purpose of the exercise
è What needs to be costed (e.g. a project/ programme, a particular development outcome, sector plan, entire development plan)?
è What is the purpose and expected value of the costing? è What is the required scope and scale (e.g. national/ subnational)? è Who should be involved? è Are adequate capacity and resources available to undertake the
exercise? If not, can development partners provide the required support?
è See Figure 1 for illustration of the range in scope of costing exercises
Step 2: Choose a costing
methodology
è What costings have already been done in the country? è What is the expected use of the costing (e.g. short-term budgeting or
longer-term planning and macro-level estimations)? è How can other countries’ efforts inform the identification of the best
approach? è See Figure 3, Tables 2-4 and Boxes 5-10 for overview of existing
methodologies and tools, including sector-specific ones
Step 3: Calculate cost estimates
Scenarios, risks and potential financial returns è How would alternative macroeconomic/ growth or policy scenarios
affect financing needs? è What are the implications of the country’s exposure and vulnerability
to particular risks on financing needs estimation? è Will the intervention being costed generate future financial benefits? è See BB1.3 analysis of major risks
Sustainability è What is the impact of reaching everyone on cost estimates? è What is the impact of ensuring environmental sustainability on cost
estimates? è How do higher costs compare with related future savings? è See Figure 4 for UN framework for assessing who is being left behind Synergies across outcome areas/ sectors/ activities è Are there any overlaps in the outcomes/activities being costed that
may result in overestimated financing needs? è Could interventions identified in one sector serve the achievement of
objectives in other sectors too? è How can double counting of required inputs/ interventions be
avoided? è See Figure 5 for an example of synchronization framework
Step 4: Consider financing gaps and how to fill
them
è (Feeding findings into the financing landscape assessment) What are the financing gaps? Which types of finance are required to fill them?

This version: December 2020 Comments and feedback: [email protected]
8
This approach will be most effective if it is an iterative and highly inclusive process. Costings may need to be revisited and updated when underlying assumptions are no longer valid (e.g. when the global context changes, assessed risk considerably changes, and in case of external shocks and disasters such as Covid-19), or when priorities or policies change.
Step 1: Setting out the scope The first step is to clarify the purpose of a potential costing exercise, to ensure that the choice of methodology is grounded in what’s needed – both in terms of scope and investment of resources.
If the purpose is to assess financing needs for a national strategy or plan, then methodologies should enable a medium- to long-term perspective, and account for synergies among development outcomes. Such approaches provide high-level estimates. Sector-specific costings, or costings that involve a limited number of priority targets, provide a more detailed picture of needs, as do needs assessments for particular projects or programmes (Figure 1 in Section 3 illustrates the range in scope of costing exercises).
If a comprehensive costing is not feasible or desirable, tools can help to prioritize high-impact or highly interlinked targets and outcomes. These include network analysis tools, such as the Institute for Global Environmental Strategies (IGES)’ SDG Interlinkages Analysis and Visualisation Tool3, through which the ripple effects of achieving certain targets can be determined and synergies and trade-offs considered; or dynamic models, such as the Millennium Institute’s iSDG model4, which allow users to explore interlinkages between targets or outcomes and to also simulate the impact of particular policies into the future – across different outcome areas and at a system-wide level. The UN Mainstreaming Acceleration and Policy Support (MAPS)5 may have already identified priority areas critical for progress toward sustainable development outcomes and for which costing may be most needed.
Consultations with key stakeholders can help ensure that both past costing exercises (successes, challenges and findings) as well as current needs are reflected in the choice of methodology and in the resulting estimates. Perspectives and experiences of those who are often invisible in national accounts, such as women and those doing unpaid work, would be particularly valuable in this context. Table 1 in BB1 Overview Note provides a list of relevant stakeholders that should be considered.
Step 2: Choosing a costing methodology Costing tools are typically based on one of four main methodologies: bottom-up unit cost approaches; historical trends approaches; top-down unit cost approaches; and modelling approaches. The first two are most suited for operational level budgeting, while the latter two for broader planning purposes, as they yield more macro-level estimates that can inform longer-term plans. Figure 3 visualizes this choice, while Table 2 further summarises the methodologies’ respective characteristics and limitations.
3 https://sdginterlinkages.iges.jp/index.html 4 https://www.millennium-institute.org/isdg 5 https://unsdg.un.org/resources/maps-mainstreaming-acceleration-and-policy-support-2030-agenda

This version: December 2020 Comments and feedback: [email protected]
9
Figure 3. How to choose the most appropriate costing methodology
Is a financing needs assessment required?
Yes No
BB1.2 What is the function of the required financing needs assessment?
Operational planning and budgeting (short/ medium-term)
Strategic planning and target setting (long-term)
Bottom-up unit cost approaches
Historical trends approaches
Top-down unit cost approaches
Model-based approaches
Best for:
In-depth, detailed costing exercises where unit costs of individual inputs or interventions are known
Example in practice: Box 3
Best for:
Estimating financing needs for continuing existing programmes and interventions, based on past cost
Example in practice: Box 4
Best for:
Benchmarking financing needs based on cost in good performing peer countries or estimating financing needs based on proxy unit costs for given inputs of interventions
Example in practice: Box 5
Best for:
High-level estimates of cost under different policy scenarios or based on growth projections or general/partial equilibrium models
Example in practice: Boxes 6, 7, 8

This version: December 2020 Comments and feedback: [email protected]
10
• Unit cost-based methodologies – both bottom-up and top-down – break down what needs to be costed into units or ‘cost drivers’. These can be as detailed as specific inputs needed to undertake a particular activity (for example, the cost of specific fertilisers); or they can refer to entire interventions (for example, the cost of providing fertiliser to farmers across the country). Unit cost-based methodologies define selected outcomes as a function of cost drivers (using proxies in the case of top-down approaches and actual inputs in the case of bottom-up approaches) and estimate financing needs based on that. Bottom-up unit cost methodologies – such as the ingredient-based approach used in the OneHealth tool illustrated in Box 3 – can be useful to assess more specific financing needs in particular sectors down to the programme and activity-level and over short- to medium-term time horizons. Top-down unit cost methodologies – such as the IMF’s input-outcome approach illustrated in Box 5 – can be useful to set long-term targets for resource mobilisation.
• Historical trends-based methodologies – such as that illustrated in Box 4 – use past spending figures to estimate future costs. They are mainly used to estimate expansions or continuation of already ongoing activities and programmes, as they cannot incorporate new cost drivers.
• Modelling-based methodologies tend to be the most complex and data intensive. Similar to top-down unit cost methodologies, they are not used for operational level costing purposes as they provide high-level estimates of financing needs. They are used to estimate back-of-the-envelope aggregate costs for particular outcomes – see for example Box 7; or to assess financing needs under different policy scenarios and consider synergies and trade-offs across sectors and policy options – as illustrated in Boxes 6 and 8. Different models can also be combined to provide a more integrated and comprehensive picture of the linkages between sectors and interventions. Such integrated assessment models are widely used in energy, environment and climate research. For example, UNESCAP applies a framework which combines two models (a general equilibrium model and a sector-specific model) to estimate the investment needs for resource efficiency interventions (SDG targets 8.4 and 12.2), simulating policy impact across the whole system.6 Modelling-based estimates are sensitive to underlying assumptions. Scenario analysis and regular revisions of underlying economic and other projections are important components of such costing exercises.
6 Other examples of integrated assessment models can be found here https://www.sciencedirect.com/science/article/abs/pii/S0306261915004080 (applied to climate change, carbon mitigation and energy transformation) and here https://www.sciencedirect.com/science/article/pii/S0959378016303399 (applied to land use).

This version: December 2020 Comments and feedback: [email protected]
11
Table 2. Mapping of existing costing methodologies by application/ use
Application/ Use Methodologies Description Typical users Key requirements Limitations
Operational budgeting, including at the sectoral and/or sub-national level
Bottom-up unit cost methodology
Unit cost-based methodologies estimate financing needs from of a mix of inputs or cost drivers, which can be defined at different levels – from very detailed (ingredients-based costing) to less detailed (interventions-based costing). Bottom-up unit cost estimates involve articulating the unit costs of all individual inputs required (see the programmatic costing approach illustrated in box 3). Reference values for the unit costs of inputs can be set to desired benchmarks (e.g. using high performing peer countries as reference) or to minimum acceptable standards. Unit costs are then combined with economic growth and relevant demographics projections to estimate future financing needs.
National governments and other domestic stakeholders
• Reference values for unit costs (e.g. benchmarks/ ministries’ price lists/activity level costs from past budget allocations)
• A production function, including input-outcome elasticities
Sensitive to unit costs and to growth projections; can ignore synergies or trade-offs across sectors (though some tools are designed to minimize this – e.g. see Box 5)
Historical trends methodology
Historical trends-based approaches estimate costs based on past spending figures (see box 4). These methodologies are used to cost continuation or expansions of existing activities and programmes. A set percentage increase is applied to past spending figures to estimate future spending needs. The percentages can be based on desired spending targets, required expansions in service delivery or access, or changes in price.
National stakeholders, including budget officers within line ministries and ministries of finance
• Historical spending figures for activities (or outcome areas) similar to those that need to be costed
• Desired spending targets or required expansions in service delivery/ access to establish required annual increase to
Sensitive to historical spending figures (e.g. if these are low, the resulting cost projections may be artificially low); cannot be used to cost qualitatively new targets and interventions

This version: December 2020 Comments and feedback: [email protected]
12
Application/ Use Methodologies Description Typical users Key requirements Limitations
apply to historical figures
Macro-level estimates of cost for long-term planning, including target setting
Top-down unit cost methodology
Similarly to bottom-up approaches, top-down unit cost approaches estimate financing needs from a mix of inputs or cost drivers, which can be defined at different levels – from very detailed (ingredients-based costing) to less detailed (interventions-based costing). Unlike bottom-up approaches, top down approaches use proxy cost drivers to estimate financing needs for priority areas or sectors (e.g. see input-output costing approach illustrated in box 5). Reference values for the unit costs of inputs are usually set to benchmarks based on peer countries, or to minimum acceptable standards (estimated on a regional or global basis). Unit costs are then combined with economic growth and relevant demographic projections to estimate future financing needs.
International organisations, regional bodies
• Reference values for unit costs (e.g. benchmarks)
• Data from peer countries that could be used for benchmarking
• A production function, including input-outcome elasticities
Sensitive to unit costs and to growth projections
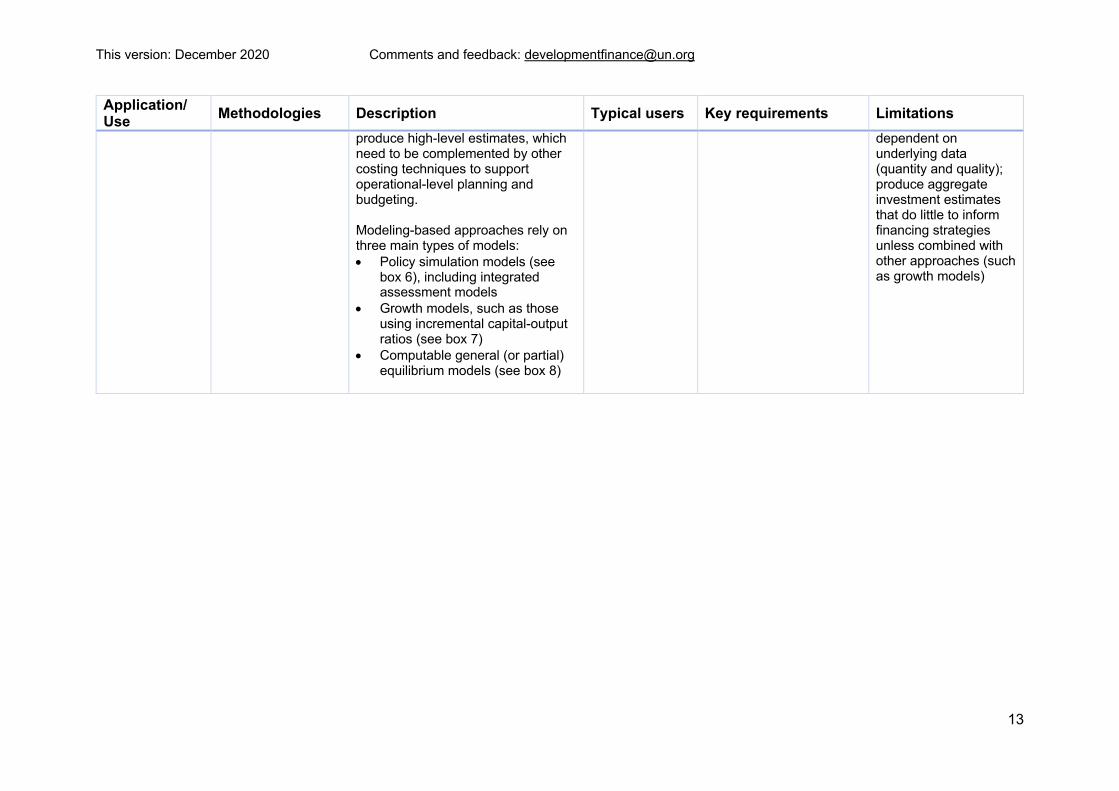
Modeling methodologies
Modeling-based approaches are future-looking, based on set parameters and assumptions around how economic growth and/or progress with regard to specific outcomes will unfold. They provide cost estimates based on simulating different policy scenarios (including ones for which there is no historical experience). Similar to top-down unit cost approaches, they tend to
International organisations; planners and strategists at MOFs and central banks
• Possible policy scenarios
• Large quantity of empirical data
• Production and utility functions
• Growth elasticities (of poverty or other variables of interest)
Sensitive to underlying assumptions and projections; rely on stylized functions and extrapolations; struggle to take into account the type of structural changes required to fulfil objectives such as the SDGs; accuracy of results is highly
This version: December 2020 Comments and feedback: [email protected]
13
Application/ Use Methodologies Description Typical users Key requirements Limitations
produce high-level estimates, which need to be complemented by other costing techniques to support operational-level planning and budgeting. Modeling-based approaches rely on three main types of models: • Policy simulation models (see
box 6), including integrated assessment models
• Growth models, such as those using incremental capital-output ratios (see box 7)
• Computable general (or partial) equilibrium models (see box 8)
dependent on underlying data (quantity and quality); produce aggregate investment estimates that do little to inform financing strategies unless combined with other approaches (such as growth models)

This version: December 2020 Comments and feedback: [email protected]
14
Box 3. Bottom-up unit cost methodology in practice
The OneHealth tool provides planners with a single framework for scenario analysis, costing, health impact analysis, budgeting and financing of strategies for all major diseases and health system components. With regard to costing specifically, the OneHealth tool is used to estimate the cost of health service delivery, including for specific diseases and programmes, and to link strategic objectives and targets around disease control and prevention to required investments in health systems. A bottom-up unit cost-based approach is used to cost required investments ranging from medicine and health products to health workforce, infrastructure and governance. Unit costs are input individually by users based on relevant quantities and prices and differ depending on the level of health care delivery. To minimize double counting, resources that are shared across different health programmes (or interventions) and cross-cutting activities (such as training) are estimated within the health system modules and not in the programmatic specific ones. This way, health sector-wide synergies are taken into account. In Kenya, the OneHealth tool was used to cost the Kenya Health Sector Strategic and Investment Plan, July 2014 – June 2018 (KHSSP III). The process was led by government officials with support from USAID and PEPFAR. As a first step, interventions included in the KHSSP III were grouped into health programmes, based on the ministry department responsible for their implementation. For each health programme (such as maternal, newborn and reproductive health; malaria; neglected tropical diseases) and health system component (such as human resources; health infrastructure; logistics), unit cost data was collected using an ingredient-based approach for items such as laboratory equipment, specific vaccines or types of surgeries, water treatment at point of use, and communication activities. Sources for the data included treatments standards, the Kenya Medical Supply Agency and donor procurement prices. In all instances, the total costs were presented on an annual basis and broken down by source of finance (private for-profit sector, and public or private not-for-profit sector). Source: Resource Needs for the Kenya Health Sector Strategic and Investment Plan (2015)
Box 4. Historical trends methodology in practice
In Nepal’s 2018 Needs Assessments, Costing and Financing Strategy for achieving the SDGs, a historical trends-based approach was adopted to cost the achievement of SDG 3 (health). SDG3 targets were compared to those included in the National Health Sector Strategy Implementation Plan 2016-2021 (NHSS) and found to be aligned. The total cost to implement the NHSS had been estimated at Rs 266 billion, or on average Rs 44 billion per year. Given the similarity between NHSS targets and SDG3 targets, NHSS costings were used as basis to estimate the scale of investments required to achieve SDG 3. A 10% annual increase was assumed for each year beyond those covered by the NHSS and up to 2030. Source: Government of Nepal, National Planning Commission, 2018, Nepal Needs Assessment, Costing and Financing Strategy for Sustainable Development Goals
Box 5. Top-down unit cost methodology in practice
The IMF’s approach to costing achievement of high performance in five SDG areas illustrates how a top-down unit cost-based methodology can be implemented in practice at the country level. It is an input-outcome approach, using high performance peer benchmarks to set unit costs. This means that outcomes in each of the five areas are assumed to be a function of a mix of inputs and that reference values used to set unit costs for such inputs are established using values observed in high performing countries with similar GDP per capita. These, combined with GDP and population growth projections, are used to calculate 2030 spending requirements. The formulas below illustrate the calculations used:

This version: December 2020 Comments and feedback: [email protected]
15
Spending in one SDG sector in country i in the current period (2016 in this example) is s(bi, xi2016), a function of cost drivers bi (e.g. teacher-student ratio, teacher salaries) and other factors xi (e.g. school-age population, GDP per capita, population density). The required levels of cost drivers to achieve high performance in identified sectors (b*) are selected using observed values in countries with similar GDP per capita and with high scores in relevant SDG index indicators (using SDSN’s SDG index data). 2030 spending in country i, given b* is calculated by projecting the values of other factors (xi) for 2030, s(b*, xi2030). For example, for education, spending is defined as a the function of teacher-to-student ratio (TSR), enrolment rates (ER), school-age population (SAP), teacher salaries (AWAGE), share of non-compensatory current expenses (y) and share of capital expenses (z):
Values for TSR, AWAGE, y and z are set at the median values observed today in countries with high education outcomes and comparable GDP per capita (see illustrative chart below for countries with GDP per capita below US$3,000). Values for ER and SAP are projected 2030 values specific to each country, based on economic growth and school-age demographics projections.
By benchmarking the underlying input costs to high achievers, the methodology ensures that synergies are taken into account, as good performers in one sector are found to be good performers in others. The benchmarking approach also takes efficiency considerations into account, as it is assumed that countries that do well do so not just by spending more but also by spending well. Possible limitations include that high achievement may be the result of accumulated spending over the years as well as effective governance structures, so benchmarking spending from the most recent year alone to set unit costs may be misleading. Nevertheless, estimates provide government officials with a ball-park picture of expenditures needed in 2030 to achieve the desired outcomes. These can be used at the country level to assess how annual budgets, medium-term expenditure frameworks and sectoral plans may need to be adjusted to get to the required spending levels. The estimates represent an aggregate figure for required spending; possible breakdowns among different sources of finance will differ in different

This version: December 2020 Comments and feedback: [email protected]
16
countries and can be further discussed at the end of the exercise with the IMF team and with insight from the experience of countries in similar situations. Source: IMF, 2019, Fiscal Policy and Development: Human, Social, and Physical Investment for the SDGs (Annex 1)
Box 6. Modeling methodology in practice: policy simulation model
The World Energy Model (WEM) is an Excel-based, dynamic policy simulation model, which can be used to estimate investment needs for power generation under current and alternative scenarios (including sustainable development scenarios). It is based on country level inputs related to energy prices (including taxes and subsidies), policies, and assumptions around economic growth, population growth and technological development. These elements are combined and used to derive projected energy demand for each energy source, which is then transferred to an output spreadsheet where users can choose to see a number of outputs, including import-export requirements, energy demand by region, CO2 emissions and total cost of investments. Depending on the chosen scenario, the model also incorporates: an economic analysis of the net changes in investment by energy suppliers and energy consumers; the net change in energy import bills and export revenues; and how the cost to consumers of investing in more energy-efficient equipment compared with the savings made through lower energy bills. The WEM was applied by UN ESCAP in their 2019 costing of SDGs in the Asia Pacific region, to estimate the capital costs of achieving three major targets under SDG 7: universal access to electricity and clean cooking; substantially increase the share of renewable energy in the energy mix; and double the rate of improvement in energy efficiency (in the transport, industry and building sectors). Three scenarios were considered: a current policies scenario (CPS), which only considers energy policies and measures enacted or adopted by mid-2018; a new policies scenario (NPS), which also incorporates policies that have been announced as of 2018, including nationally determined contributions related to the Paris Agreement; and a sustainable development scenario (SDS), which aims to achieve SDG 7, substantially reduce air pollution (SDG 3.9), and to take effective action to combat climate change (part of SDG 13). The SDS was found to be the only scenario consistent with SDG 7 targets and so cost estimates were derived using that scenario. Source: International Energy Agency, World Energy Model Documentation, 2019 version; UN ESCAP, Economic and Social Survey of Asia and the Pacific 2019: Ambitions beyond growth, including Technical Appendix
Box 7. Modeling methodology in practice: growth model
In Nepal’s 2018 Needs Assessments, Costing and Financing Strategy for achieving the SDGs, a growth model was used to estimate the cost of achieving the industrial output target, namely increasing the share of manufacturing in GDP to 13% by 2030, which was considered under SDG 9 (industry, innovation and infrastructure). The incremental capital output ratio (ICOR) was used to model the relationship between aggregate investment and economic growth. The ICOR represents the additional unit of capital or investment needed to produce an additional unit of output. With GDP set to grow by 8.7% on average during the SDG period and an estimated ICOR of 6.2, the investment required for industry was estimated using the formula:
Total investment required (ΔK) = Targeted economic growth (ΔY) * ICOR (dK/ dY), where
K is capital and Y is GDP.
Source: Government of Nepal, National Planning Commission, 2018, Nepal Needs Assessment, Costing and Financing Strategy for Sustainable Development Goals

This version: December 2020 Comments and feedback: [email protected]
17
Box 8. Modeling methodology in practice: partial equilibrium model
The International Institute for Applied System Analysis’ Global Biosphere Management Model (GLOBIOM) can help policymakers assess resource requirements for land use and biosphere management, based on national goals and the desired market equilibrium. GLOBIOM is a partial equilibrium model that helps policymakers understand and minimise land use and resource competition by exploring trade-offs and synergies around land use and ecosystem services. It captures multiple inter-relationships between the different systems involved in the provision of agriculture and forestry products (e.g. population dynamics, ecosystems, technology, climate) and solves for the market equilibrium at which the sum of producer and consumer surplus is maximised subject to resource, technological and political constraints. The World Bank has applied this model to estimate the investment needs for irrigation, in the context of a wider costing exercise covering several infrastructure sub-sectors. Specifically, the model was used to assess the conditions and investments required to transform rainfed cropland into productive and efficient irrigated cropland. In many regions this transformation requires public subsidies. Two strategies were modelled to estimate total investment needs: ‘moderate’ public support, in which governments cover capital costs of building or expanding (to a degree) dams and water delivery systems, and farmers are responsible for parts and materials for farm irrigation equipment and for covering water prices; and ‘high’ public support, in which government cover all capital costs, parts and materials for farm irrigation equipment and water is subsidised. These were modelled under various scenarios reflecting uncertainty around future socioeconomic changes, climate change impacts, dietary preferences, trade agreements, and water use efficiency. The model was also used to explore synergies and trade-offs with related development goals, namely: ending hunger (SDG2); mitigating climate change (SDG13) and protecting biodiversity (SDG15). Under both moderate and high public support strategies, investing in irrigation helps in addressing hunger but has mixed impacts on climate change and biodiversity. This provides additional insight to policy makers to be able to identify policies to ensure that investments in irrigation maximise the desired outcomes, while minimising negative impacts. Source: International Institute for Applied Systems Analysis GLOBIOM webpage; World Bank, 2019, Beyond the gap: how countries can afford the infrastructure they need while protecting the planet.
The international community also offers a multitude of sector-specific costing methodologies and tools. They are grounded in the basic methodologies set out in Figure 3 and Table 2 but incorporate sector-specific considerations. Boxes 3, 6 and 8 illustrate examples of some of these, related to health, energy and land use respectively. A more comprehensive list is included in Table 4 (see Section 4.3).
Some sectors and thematic priorities are more easily quantifiable than others. For outcomes where interventions are not standardized or cross-cutting in nature (such as reduced poverty and inequalities or strengthened governance and institutions), detailed bottom-up costing approaches may be less suitable. Top-down or modelling-based costing approaches can provide ball-park estimation of needs. For example, growth models can be used to estimate economy-wide investment needs to achieve desired poverty reduction outcomes. Alternatively, as done in Bangladesh’s SDG financing strategy, costs can be estimated by determining the financing needed to adequately resource relevant institutions. For example, to estimate the cost of achieving SDG 10 (reduced inequalities), Bangladesh identified key ministries whose overall budgets would need to be scaled up to achieve relevant targets. Similarly, in relation to SDG 16 (peace, justice and strong institutions), it allocated a lump
This version: December 2020 Comments and feedback: [email protected]
18
sum to institutional reform along with recurrent budget allocations to relevant government agencies and departments such as the police force, prisons and courts.7
The choice of methodology and interpretation of results should also be mindful of other limitations and challenges8:
- Sensitivity to underlying assumptions: changes to production technologies and the policy and economic environment, both nationally and globally, cannot be fully known but may significantly impact costs; similarly, economic and non-economic shocks may derail growth prospects and thus significantly affect spending needs. Scenario-based approaches could provide a more robust analysis and facilitate better planning as well as more efficient and effective financing strategies.
- Synergies and trade-offs: possible synergies/ co-benefits and trade-offs between different policy objectives or sectors are not always captured, particularly in bottom-up and sector-specific exercises, meaning that aggregate estimates of cost can be inflated.
- Policies and institutions: costing methodologies are able to account for factors such as absorptive capacity and spending efficiency only to a limited extent.
- Leaving no one behind: financing needs assessments may struggle to consider distributional implications and additional costs to reaching the poorest and most marginalized people.
Step 3: Calculating ‘sustainable development-proof’ cost estimates While there are inherent limitations to costing exercises (see above), practitioners have found ways to address them. They include: considering different scenarios, risks and potential financial returns to ensure cost estimates are forward-looking; accounting for all dimensions of sustainability, including environmental aspects and the leaving no one behind principle; and accounting for synergies across outcome areas, sectors and activities.
a) Accounting for different scenarios, risks and potential financial returns Growth shocks, natural and man-made hazards, and other events outside a country’s control, such as Covid-19, as well as changes in policy direction or development priorities can impact cost estimates. Financing needs assessments, especially those used for long-term planning and target setting, should thus incorporate scenarios and flexible forward-looking assumptions,9 e.g. through policy simulation models. Exploring multiple scenarios also allows for the identification of possible trade-offs between objectives and inform policy decisions (e.g. see Box 6).
The risk assessments module (see BB1.3) provides an overview of the main types of risk that can affect the country’s financing for development efforts, including their potential financial consequences. This analysis can inform a balanced perspective on prevention/ preparedness and response costs. By taking such a risk-informed perspective, INFF costing exercises strengthen resilience and help minimise the economic (and human) impacts of
7 Detailed methodology notes available in Annex 10 and 16 of Bangladesh SDG financing strategy doc 8 In addition to these, and with specific reference to SDG costing exercises, UN ESCAP’s SDG Costing Guidebook (2020) also highlights the lack of clear numerical targets as a practical challenge, since it leaves room for subjective judgement (e.g. ’nationally appropriate‘ social protection systems in SDG target 1.3); for more detail see p. 7 here: https://www.unescap.org/sites/default/files/SDG%20Costing%20Guidebook_June2020_Final.pdf 9 See Box 5 in Chapter II of the 2019 Financing for Sustainable Development Report.

This version: December 2020 Comments and feedback: [email protected]
19
potential shocks, disasters and crises. Box 9 illustrates how Nepal’s SDG costing took the country’s proneness to earthquakes into account.
Some interventions and investments (e.g. infrastructure investments or investments to protect ecosystems) generate future financial benefits, be they new/ expanded fiscal revenue streams or future savings/ avoided costs. Taking these second-round benefits into account avoids inflating their ‘real’ and long-term cost to the government. Intertemporal balance sheet analysis can help policy makers build a more holistic picture of the actual cost of identified interventions.10
b) Accounting for sustainability The principle of leaving no one behind underpins the SDGs. It should guide the articulation of interventions and policies and be taken into account in costing exercises. For example, the poorest and most vulnerable people are also most likely to be hardest hit by economic shocks and disasters, impacting recovery costs. Further, it is essential to ensure costing efforts account for the gender differentiated impacts of particular interventions. Box 9 illustrates how leaving no one behind was considered in Nepal’s SDG costing exercise.
The UN framework for assessing who is being left behind (illustrated in Figure 4) may be useful to guide the identification of most-at-risk populations and to inform revisions to cost estimates accordingly.11 For example, if populations living in remote areas are at risk of being left behind, then infrastructure planning and costing should be adjusted to benefit them.
Figure 4. UN framework for assessing who is being left behind
Source: LNOB Operational Guide Interim Draft 2019
10 See Box 2 in BB1.2 Financing landscape assessment guidance. 11 https://unsdg.un.org/sites/default/files/Interim-Draft-Operational-Guide-on-LNOB-for-UNCTs.pdf (p. 13)

This version: December 2020 Comments and feedback: [email protected]
20
Other elements of sustainability, especially the potential impact on the environment and climate change, should also be considered. As mentioned in section a) above, looking at different scenarios can help policy makers to ensure that alternative, greener interventions are considered when costing actions needed to implement identified national development priorities. Higher set up costs, for example in relation to renewable energy generation solutions, may be offset by lower maintenance and operating costs resulting in long-term savings as well as positive environmental impact.
c) Considering synergies across outcome areas, sectors and activities Harnessing synergies both within and across sectors can reduce total financing needs and maximise the impact of investments. There are several costing approaches that account for such synergies.
The synchronisation method adopted by Bangladesh in its 2017 SDG Financing Strategy provides an example of how overlaps across outcome and action areas can be avoided. By considering the SDGs as a network of interrelated targets, the costing approach allows interventions that apply to more than one goal to only be costed once. Figure 5 below illustrates the result of this process. ‘Own’ cells represent the cost of individual SDGs while ‘Syn’ cells show where costs for individual SDGs have been adjusted to take into account overlaps with other goals. Looking at overall SDG costs in this way allows policymakers to more easily spot where savings can be made by ensuring synergies are taken into account.
Figure 5. Bangladesh’s synchronisation framework
Source: SDG Financing Strategy: Bangladesh Perspective (2017)
Similarly, the OneHealth Tool introduced above (see Box 3) enables users to identify activities or inputs that apply to more than one health sub-sector and to only cost them once. For example, the cost of facilities, logistics and human resources is only counted once in the health systems modules, and not repeated in the programme-specific modules. In addition,

This version: December 2020 Comments and feedback: [email protected]
21
mechanisms are built within the tool to ensure integration of cross-cutting activities, such as training programmes that cover multiple conditions.12
At a more systemic level, and as mentioned in step 1 above, dynamic modelling and network analysis tools such as the Millennium Institute’s iSDG model and IGES’ SDG interlinkages analysis and visualisation tool, can help policy makers identify which policies or interventions could have the largest spill-over effects beyond their specific area. Costing efforts could then be focused on estimating the investments required to implement these. This would be of particular use in instances where the objective of the costing exercise is to establish high level financing needs estimates or targets for achieving highly interlinked goals and targets, and where quantifying the cost of any of them in isolation is unnecessary.
Step 4: Considering financing gaps and how to fill them Combined with the analysis of a country’s current financing landscape, which sheds light on the potential of different types of finance to contribute (based on current and forward-looking trends), cost estimates can help establish financing gaps to be filled (see BB1.2). They are a first and key input to guide articulation of a financing strategy (see BB2).
Box 9. Nepal’s SDG costing exercise
In 2018, Nepal published a comprehensive SDG needs assessment, costing and financing strategy. The document sets out the methodologies used as well as reflections on how identified gaps would be filled. It is a good reference point for several issues related to financing needs assessments discussed in this module, such as:
- Using a combination of different methodologies to estimate costs: financing needs and gaps were calculated using existing sectoral costings, which were not all based on the same methodology. For example, costings related to agriculture, WASH and road infrastructure were based on unit costs; costings for health and data systems strengthening (part of governance) were based on historical budget allocations; and urban development and education were based on modelling techniques. Sector-specific costings were then combined with macroeconomic projections and policy simulation models to establish future required investments.
- Addressing costing of non-easily quantifiable outcomes: two examples of how this was done in Nepal’s 2018 SDG costing exercise are gender and governance. For gender (SDG 5), interventions were identified along seven areas related to already existing government programmes and annual investment needs were calculated by considering the additional cost of reorienting these programmes toward core SDG areas. The seven areas of intervention included: encouraging political participation; helping girls to transition to work; women empowerment; welfare programmes; ending violence against women; systemic issues; general administrative costs. For governance (SDG 16), proxy interventions were identified to estimate costs related to selected indicators. For example, spending for peace and security (which includes the police) was used to proxy the cost of interventions needed to reduce the number of deaths from violent conflicts and displacements.
- Taking into account risks: Nepal is prone to shocks and disasters such as earthquakes; these were considered from the outset given their potential to derail or obstruct sustainable development progress. For example, the costing model to estimate investment needs for road infrastructure assigned more weight to maintenance and upgrades compared to the addition of new roads – in line with recommendations from the 2017 Priority Investment Plan and other national and international studies.
- Taking into account LNOB: consideration of the implications of leaving no one behind on costing estimates is incorporated within the overall framing of Nepal’s SDG financing needs assessment, which explicitly addresses trade-offs related to the achievement of national inclusive development ambitions. For example, demographic transition and
12 https://www.who.int/choice/publications/OneHealth_Tool_Detailed_FAQs_2012.pdf?ua=1

This version: December 2020 Comments and feedback: [email protected]
22
urbanisation are considered opportunities but also challenges especially as it relates to decent housing and job creation – looking at them from both angles means that costing efforts can reflect all necessary policy shifts to address inequality and maximise pro-poor growth.
- Considering the role of different types of finance in filling identified gaps based on priority policy objectives: the costing exercise concludes with allocating different shares of required SDG investment to different actors. Based on past budget allocations, the public sector is assumed to fill the majority of the financing gap (55%). The private sector, including FDI, is allocated over a third of the total gap (36%) with particular emphasis on its role as both direct contributor of liquidity and facilitator of efficiencies and transfers of expertise and technology, as well as its role in inclusive growth and development eg through affordable housing ventures. Households’ out of pocket expenditures and remittances are also allocated a share of the financing gap (4.4%) though the role of aid (ODA) to fill government shortfalls is highlighted given the need to ensure coherence with policies related to poverty and inequality. The cooperative and NGO sector is allocated 4.3% share of the investment gap, and additional considerations are made around the national resource mobilisation strategies that may be required to increase government revenue and create the right incentives for non-state actors.
Source: Government of Nepal National Planning Commission (2018), ‘Needs Assessment, Costing and Financing Strategy for Sustainable Development Goals’.
4.2 Data sources Data availability and quality will be an important determinant of the quality of cost estimates. Table 3 provides a list of typical sources of data and information which countries can draw on. It includes international databases, which countries can make use of should there be gaps in nationally collected data.
Table 3. Typical sources of data and information for financing needs assessments
Costing elements Typical sources of data What to cost – e.g. national development objectives/ identified priority outcomes and required interventions/ programmes/ activities and risk to achieve them
National development plans; nationally determined contributions (NDCs); sectoral plans; ministries strategic plans; cross-cutting thematic plans such as gender equality plans
Unit costs Ministries’ price lists or price lists provided by international organisations such as the WHO; reference values used in existing studies (where this data is made available)
Historical spending figures
Government budget documents
Growth and other macroeconomic projections
Statistics by Ministries of Finance, central banks, national statistical offices, or international databases such as the World Bank’s World Development Indicators (WDI) and the IMF’s International Financial Statistics (IFS) and related datasets
Population and urbanization projections
Statistics by UN DESA; WB PovcalNet poverty data
Cost of historical direct and indirect disaster losses; economic and financial impact of potential future disasters
Disaster loss databases, Sendai Framework Monitor, Ministries of Finance, national disaster risk management authorities, national statistical offices

This version: December 2020 Comments and feedback: [email protected]
23
4.3 Existing tools Table 4 provides an overview of existing costing tools from the international community. For ease of reference, it categorises them by SDG areas/ sectors and highlights their main application and use (e.g. whether they are most useful for operational budgeting or for longer-term, strategic planning and decision-making).

This version: December 2020 Comments and feedback: [email protected]
24
Table 4. Costing tools for estimating financing needs for particular sectors and SDGs
Costing tools Main application/ use
Brief description Related sustainable development outcome areas/ SDGs
ILO Social Protection Floor Calculator13
Operational budgeting
Enables estimation of the costs of child and orphan allowances; maternity benefits; public works programmes for those without jobs; disability and old-age pensions.
SDG 1/ poverty
FAO Global Agriculture Perspectives System (GAPS) Model14
Long-term planning/ target setting
GAPS is a partial equilibrium model that provides country-level long-term projections of food demand and supply. It can be used to compute the required targeted GDP per capita and the associated price of agricultural goods in the equilibrium.
SDG 2/ hunger and agriculture
International Food Policy Research Institute (IFPRI) IMPACT Model15
Long-term planning/ target setting
A partial equilibrium, multi-market model which simulates national and international agricultural markets. It facilitates examination of how alternative investment scenarios affect agricultural production, productivity and food security over the period 2010-2050, compared to a reference scenario.
SDG 2/ hunger and agriculture
OneHealth Tool Operational budgeting
Unit cost-based approach used to estimate required investments for both specific programmes and diseases and broader health systems strengthening and service delivery. (More detail in box 3).
SDG 3/ health
WHO-UNICEF Comprehensive Multi-Year Plans (cMYP) Costing and Financing Tool16
Strategic planning/ target setting
Excel-based tool for costing immunization programmes and supporting the articulation of related multi-year strategies. It is based on unit costs (such as vaccines and injection supplies) and other recurrent and capital costs, and enables users to, among other things, project future costs and resource requirements to achieve programme objectives.
SDG 3/ health
UNICEF Community Health Planning and Costing Tool17
Operational budgeting
Excel-based open source tool to support planning and costing of community health services packages, including new additions or changes to or geographical expansion of existing packages. It combines bottom-up and top-down unit cost-based methodologies. At the service level, unit costs are based on the type of resources (e.g.
SDG 3/ health
13 https://www.social-protection.org/gimi/gess/SPFCalculReport.action 14 http://www.fao.org/global-perspectives-studies/resources/detail/en/c/433548/ and http://www.fao.org/3/a-i4951e.pdf 15 https://www.ifpri.org/project/ifpri-impact-model 16 https://www.who.int/immunization/programmes_systems/financing/tools/cmyp/en/ 17 https://www.msh.org/resources/community-health-planning-and-costing-tool

This version: December 2020 Comments and feedback: [email protected]
25
Costing tools Main application/ use
Brief description Related sustainable development outcome areas/ SDGs
medicines) multiplied by the total estimated volume required to implement specific activities. Other costs, such training, are allocated using a top-down methodology.
Cost Effectiveness Analysis (CEA)
Strategic planning/ choosing between interventions
Used to compare one intervention to another (or the status quo) by estimating how much it would cost to gain a unit of health outcome (such as one year of life gained or one death prevented).
SDG 3/ health (but can be applied to other areas such as education and environmental services)
Brookings Standardized Early Childhood Development (ECD) Costing Tool (SECT)18
Operational budgeting/ cost effectiveness analysis
Unit cost-based tool which users can customize according to their needs to compute the costs of the full range of ECD interventions including exclusive breastfeeding, parental education and preprimary education. Costs included in the tool are divided into three categories: overhead costs; direct costs; and imputed costs.
SDG 3/ health (early childhood development) SDG 4/ education
UNESCO Simulation for Education (SimuED) Model19
Operational budgeting
Downloadable excel-based simulation model that covers every sub-sector in education; it can be configured to reflect country contexts. In addition to supporting the estimation of resource requirements, it can be used to project selected SDG4 indicators to facilitate policy and planning processes.
SDG 4/ education
UN Women costing approach for gender equality (presented in the 2015 Handbook on costing gender equality)20
Operational budgeting
Unit cost-based approach based on the experience of countries that have made efforts to estimate costs related to gender equality plans and strategies. Unit costs are considered at the activity level and include salaries, transportation, supplies, professional fees, per diem and administrative and overhead costs.
SDG 5/ gender equality
Levy Economics Institute of Bard College Methodology for costing gender equality and
Strategic planning/ target setting
Used for estimating the investment needs to implement interventions that are either directly aimed at reducing gender inequality and empowering women, or ones that are designed with other primary aims but can nonetheless promote such objectives. It builds on a unit cost-based methodology developed by the UN Millennium Project and focuses particularly on low income countries.
SDG 5/ gender equality
18 https://www.brookings.edu/wp-content/uploads/2017/09/standardized-ecd-costing-tool.pdf 19 https://en.unesco.org/news/unesco-launches-new-simulation-model-education 20 https://www.unwomen.org/en/digital-library/publications/2015/7/handbook-on-costing-gender-equality

This version: December 2020 Comments and feedback: [email protected]
26
Costing tools Main application/ use
Brief description Related sustainable development outcome areas/ SDGs
women’s empowerment 21 World Bank and UNICEF Sanitation and Water for All WASH SDG Costing Tool22
Operational budgeting
Downloadable excel-based tool that can be used at national or sub-national level to estimate costs of meeting WASH targets. Users can input desired coverage targets and technology solutions with related unit costs and establish required investments and financing gaps.
SDG 6/ Water and sanitation
International Water and Sanitation Centre WASH Cost calculator app23
Strategic planning/ choosing between interventions (at the district level)
Follows the life-cycle cost approach (LCCA), which comprehensively identifies and analyses the full costs of delivering WASH services at the desired level and standard, including infrastructure and both direct and indirect support.
SDG 6/ Water and sanitation
World Bank costing approach for WASH (as set out in 2016 report ‘The costs of meeting the 2030 sustainable development goal on drinking water, sanitation and hygiene’)24
Strategic planning/ target setting
Unit cost-based approach applied to 140 countries, mostly LICs and MICs, to estimate the cost of meeting basic/ safely managed WASH services. It assumes that additional population, based on population growth projections, will not have basic WASH coverage; it also assumes that wealth quintiles with lower coverage will be reached at a faster rate to achieve universal coverage. Lower and upper cost scenarios are provided. Due to paucity of cost data the results may underestimate the true costs especially those for delivering services to the hardest to reach ('last mile' population). Results can be disaggregated by urban/ rural and different income quintiles.
SDG 6/ Water and sanitation
World Bank costing approach for infrastructure
Strategic planning/ target setting
Combination of unit cost-based, partial equilibrium models and other sector-specific methodologies. It provides a framework for decision makers at the country level in the area of infrastructure. The framework includes identification of policy objectives and
SDG 6/ Water and sanitation SDG 7/ Energy
21 http://www.levyinstitute.org/pubs/wp_467.pdf 22 https://www.sanitationandwaterforall.org/tools-portal/tool/sdg-costing-tool 23 https://www.ircwash.org/projects/life-cycle-costing-tools 24 https://openknowledge.worldbank.org/bitstream/handle/10986/23681/K8543.pdf?sequence=1&isAllowed=y

This version: December 2020 Comments and feedback: [email protected]
27
Costing tools Main application/ use
Brief description Related sustainable development outcome areas/ SDGs
(presented in the 2019 book ‘Beyond the Gap: How Countries Can Afford the Infrastructure They Need while Protecting the Planet')25
metrics to monitor progress. Policy or investment options are stress-tested to identify conditions under which the infrastructure system will fail to meet objectives, and to encourage open discussion around potential strategies and trade-offs (e.g. growth vs equality, growth vs environmental sustainability). The methodology is applied to four infrastructure sub-sectors (WASH, power, transport, flood protection), with estimates presented as ranges depending on different policy and technology choices and scenarios.
SDG 9/ Infrastructure
The International Energy Agency’s World Energy Model (WEM)26
Operational budgeting
Excel-based, dynamic policy simulation model that can be used to estimate investment needs for power generation under current and alternative scenarios. The difference in cost between business-as-usual scenario and a sustainable development scenario can also be used to estimate costs related to climate action. (See box 6).
SDG 7/ Affordable and clean energy SDG 13/ climate action (climate mitigation)
UNDP biodiversity costing approach (BIOFIN)27
Strategic planning/ target setting
Unit cost-based approach used to assess financing needs related to achieving the Aichi biodiversity targets28 and to implement national biodiversity strategies and action plans. Unit costs are based on government norms and on economics and biodiversity literature – with the latter being particularly useful to cost action areas such as reforestation, coral reef reforestation and seagrass reforestation. Investment need estimates are refined via expert consultations and workshops to validate underlying models and assumptions before the detailed unmet finance needs are finalized.
SDG 14/ Marine and coastal ecosystems SDG 15/ Biodiversity
The International Institute for Applied System Analysis’ Global Biosphere Management Model (GLOBIOM)29
Strategic planning/ target setting
Partial equilibrium model used to explore trade-offs and synergies around land use and ecosystem services. It helps policymakers understand and minimise land use and resource competition through more holistic thinking. It captures the multiple inter-relationships between the different systems involved in provision of agriculture and forestry products (e.g. population dynamics, ecosystems, technology, climate) and solves for the market equilibrium at which the sum of producer and consumer surplus is maximised subject to resource, technological and political constraints. (More detail in box 8).
SDG 15/ Land use, biodiversity
25 https://openknowledge.worldbank.org/handle/10986/31291 26 https://www.iea.org/reports/world-energy-model 27 https://www.biodiversityfinance.net/sites/default/files/content/publications/BIOFIN%20Workbook%202018_0.pdf 28 https://www.cbd.int/sp/targets/ 29 https://www.globiom.org/
This version: December 2020 Comments and feedback: [email protected]
28
Costing tools Main application/ use
Brief description Related sustainable development outcome areas/ SDGs
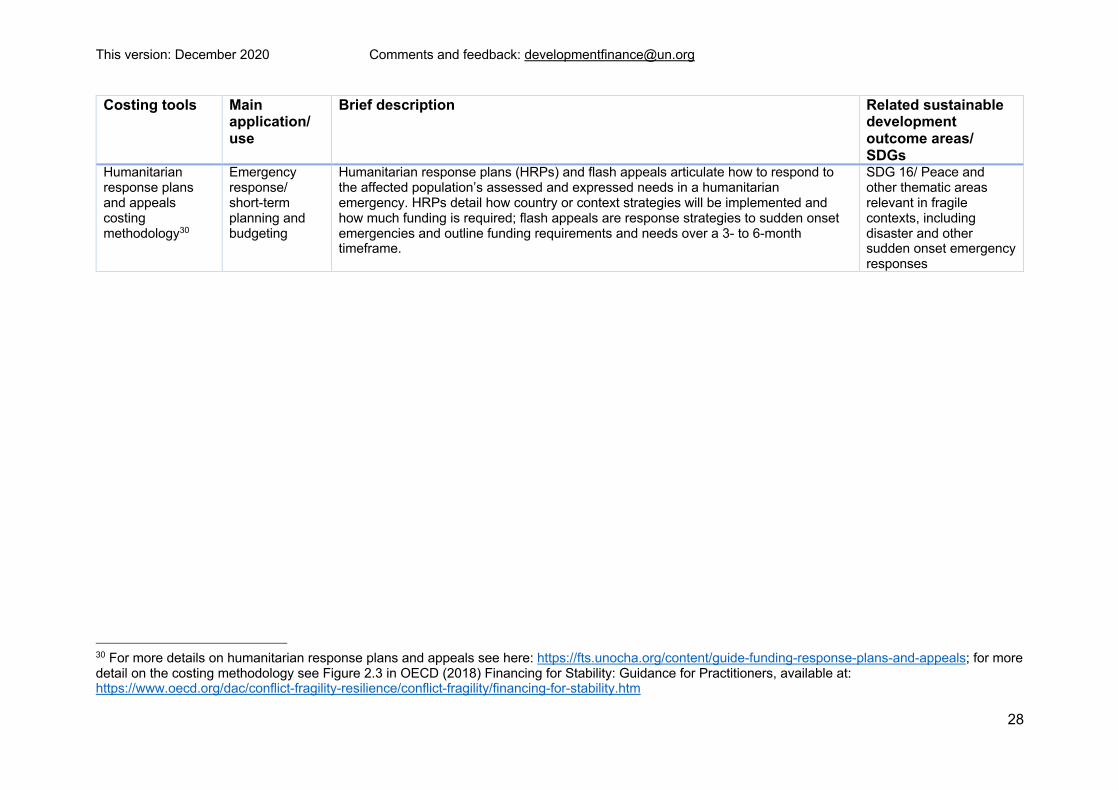
Humanitarian response plans and appeals costing methodology30
Emergency response/ short-term planning and budgeting
Humanitarian response plans (HRPs) and flash appeals articulate how to respond to the affected population’s assessed and expressed needs in a humanitarian emergency. HRPs detail how country or context strategies will be implemented and how much funding is required; flash appeals are response strategies to sudden onset emergencies and outline funding requirements and needs over a 3- to 6-month timeframe.
SDG 16/ Peace and other thematic areas relevant in fragile contexts, including disaster and other sudden onset emergency responses
30 For more details on humanitarian response plans and appeals see here: https://fts.unocha.org/content/guide-funding-response-plans-and-appeals; for more detail on the costing methodology see Figure 2.3 in OECD (2018) Financing for Stability: Guidance for Practitioners, available at: https://www.oecd.org/dac/conflict-fragility-resilience/conflict-fragility/financing-for-stability.htm

This version: December 2020 Comments and feedback: [email protected]
29
5. Financing needs diagnostics in different country contexts Financing needs assessments have to be adapted to widely different country contexts to adequately serve their needs. Key elements to consider include:
Articulation of desired outcomes or goals to be costed, data availability and quality. Not all countries will have established numerical targets or have identified the specific interventions. Similarly, quantity and quality of available data may limit the use of standard costing methodologies. International datasets may offer an alternative. Countries can also choose to adopt qualitative approaches. For example, when developing its INFF, the Solomon Islands decided against undertaking a full quantitative costing exercise on the basis of limitations in underlying data, and instead developed descriptive summaries of the financing context and trends that would be needed to ensure that identified objectives could be met. These were then used to help articulate the financing strategy alongside the quantitative analysis of current financing trends.
Capacity and resource availability. In addition to data, other key resources to undertake robust financing needs assessments include technical expertise, tools, time and financial resources. This is not only for the initial exercise when setting up an INFF, but for ongoing needs assessments to ensure estimates of need can reflect changes in both current and expected financing trends and policy. To take into account limitations in capacity and resource availability, governments may wish to adjust the scope of their costing exercises, focusing on a particular sector/ thematic area of particular priority or on a particular type of finance. Additionally, international development partners support may be sought to undertake the exercise.
6. Lessons learned Key lessons from implementing financing needs assessments at the country level highlight the need to ensure a risk-informed methodology beyond financial risk, ownership and multi-stakeholder involvement. Involving relevant ministries closely in the costing exercise can broaden buy-in and facilitate effective use of findings. Involving independent experts can support in avoiding a siloed approach to multi-sectoral costing exercises.