infinityqs_7 habits of quality obsessed manufacturers_print final
TRANSCRIPT
by STEVE WISE
of Quality Obsessed Manufacturers
How do you brag about qualityachievements?
What do successful manufacturers havein common with Einstein?
© Copyright 2012 InfinityQS
Who plays the starring role in your company?
Are you going out of your way tomake easy hard?
Is the cloud your answer to supplychain visibility?
How to choose between ‘dosomething’ and ‘do nothing’
Giving your data an afterlife
www.infinityqs.com | Phone: 703-961-0200
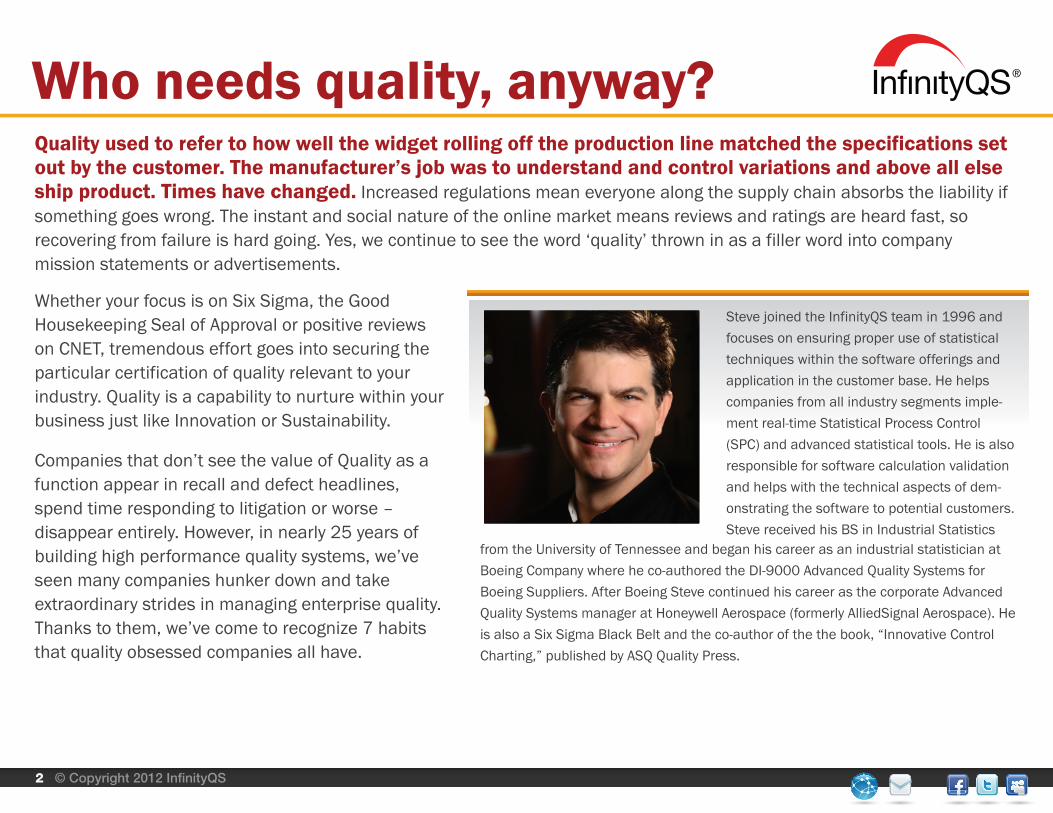
from the University of Tennessee and began his career as an industrial statistician at Boeing Company where he co-authored the DI-9000 Advanced Quality Systems for Boeing Suppliers. After Boeing Steve continued his career as the corporate Advanced Quality Systems manager at Honeywell Aerospace (formerly AlliedSignal Aerospace). He is also a Six Sigma Black Belt and the co-author of the the book, “Innovative Control Charting,” published by ASQ Quality Press.
Who needs quality, anyway?
2 © Copyright 2012 InfinityQS
Steve joined the InfinityQS team in 1996 and focuses on ensuring proper use of statistical techniques within the software offerings and application in the customer base. He helps companies from all industry segments imple-ment real-time Statistical Process Control (SPC) and advanced statistical tools. He is also responsible for software calculation validation and helps with the technical aspects of dem-onstrating the software to potential customers.Steve received his BS in Industrial Statistics
Quality used to refer to how well the widget rolling off the production line matched the specifications set out by the customer. The manufacturer’s job was to understand and control variations and above all else ship product. Times have changed. Increased regulations mean everyone along the supply chain absorbs the liability if something goes wrong. The instant and social nature of the online market means reviews and ratings are heard fast, so recovering from failure is hard going. Yes, we continue to see the word ‘quality’ thrown in as a filler word into company mission statements or advertisements.
Whether your focus is on Six Sigma, the Good Housekeeping Seal of Approval or positive reviews on CNET, tremendous effort goes into securing the particular certification of quality relevant to your industry. Quality is a capability to nurture within your business just like Innovation or Sustainability.
Companies that don’t see the value of Quality as a function appear in recall and defect headlines, spend time responding to litigation or worse – disappear entirely. However, in nearly 25 years of building high performance quality systems, we’ve seen many companies hunker down and take extraordinary strides in managing enterprise quality. Thanks to them, we’ve come to recognize 7 habits that quality obsessed companies all have.
data and promote the results in an easily digestible manner. On the next inspection tour, show off your data collection capabilities and send your buyers home with a rigorous report that highlights your attention to quality and differentiates you from your competitors. Provide secure portals so your buyers can see your quality even when they’re not on inspection tours. If your quality is genuinely top notch, there’s no reason to be tightfisted with your data.
Being coy with your metrics, or worse, hiding them out of paranoia, won’t improve your relationship with your buyer. If you do capture the right data and make quality products, then take an easy extra step and extend the value of your investment. Bragging about your approach to producing quality products will place you on a completely different playing field than your competitors and will absolutely win you more business.
Action Item: Put together a list of metrics that will impress your customers. Split the metrics into two groups; areas to brag about now and areas to improve so you can brag about them next year.
Brag about your quality
3 © Copyright 2012 InfinityQS
11111Since the money flows from buyer to manufacturer, the burden falls on you, the manufacturer, to respond. Your reputation gets you in the door, but hard facts secure the deal. These metrics typically take the shape of customer feedback ratings, product reliability scores, warranty claims and other KPIs. The problem with these types of warning indicators is that every party in the transaction -- manufacturer, buyer and consumer -- is all in before you get your metrics. You and the buyer have to wait for the end result. If it’s negative, your bottom line is at risk.
A manufacturer can shout quality from the mountain tops, but what’s needed is an objective measure of tomorrow’s shipment, today, and for manufacturers to adopt a practice of transparency in sharing those measures with their buyers.
Some manufacturers advertise their quality by providing the compulsory Cp and Cpk statistics imposed by some buyers. Because many games can be played with the reported Cp and Cpk values, buyers cannot completely rely on those numbers to differentiate supplier quality. So, a better approach is to unashamedly market your quality using quantifiable measures and verified improvements based on real data that’s meaningful to your customers.
Advances in metrology, testing methods and the internet provide ample opportunities for a manufacturer to capture relevant quality
The future of your manufacturing company depends on the satisfaction of your customers. Those demanding, price-conscious, just-in-time focused customers want quality products, and while you constantly strive to meet and exceed those expectations of quality, the dynamics in this relationship create two problems.
1. How can a buyer truly know they’re getting quality?
2. How can you effectively demonstrate your quality?
A better approach is to unashamedly market your quality using quantifiable measures and
verified improvements basedon real data.
any infrastructure in place to manage the necessary tasks?
When signals from important data are screaming, DO SOMETHING, but no process is in place to take care of the problem, then the only results are jaded employees that are trained to ignore the red charts.
Line, hook and bait can catch a fish, but a rod and reel are needed to land the dinner. Before embarking on any new plans to monitor a process, those plans need to include both an effective sampling strategy (line, hook and bait) and systems in place to respond to alarms (a rod and reel).
Action Item: Figure out which members of your organization have the ability to take action based on real-time intelligence and get them the reports they need to be successful.
Do what counts
4 © Copyright 2012 InfinityQS
When no one ever reacts to the data, you may consider stopping its collection. But how can you know who needs the data? In the case where data are already being collected and reported, be bold and chal-lenge the status quo. At one large airframe manufacturer, a new manager wanted to find out who needed, or was even reading the numerous scheduled reports his depart-ment generated. He decided to stop all publications and wait for the phone to ring. He got all his answers in just a couple of weeks. Using the feedback from the few that contacted him, he completely revamped the reporting content and sched-ules. Just like Shakespeare’s, “brevity is the soul of wit;” concise data is the soul of knowledge. If the data indicates that corrective actions are warranted, is there
More data is not always more better. Successful manufacturers recognize that acquiring and managing data are expensive, and therefore should have value. If not, they invest their time, resources and money elsewhere. Two simple questions can assess if your existing or proposed data collection strategies would meet with Einstein’s approval:
1. If the values from a monitored data stream shift down, trend up or spike, would these changes drive anyone to take corrective action?
2. If the data indicates that corrective actions are warranted, is there any infrastructure in place to manage the necessary tasks?
22222
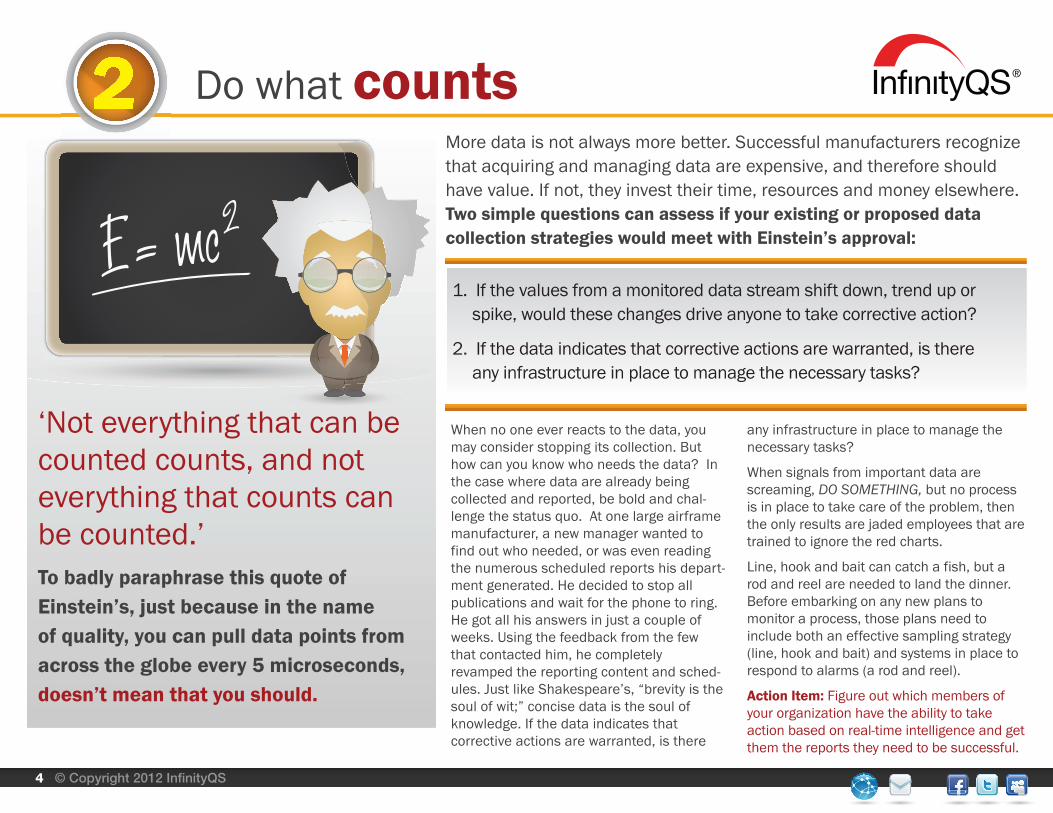
‘Not everything that can becounted counts, and noteverything that counts canbe counted.’ To badly paraphrase this quote ofEinstein’s, just because in the nameof quality, you can pull data points fromacross the globe every 5 microseconds,doesn’t mean that you should.
test characteristics; there are no parts. So, in the order of importance: process gets first billing, then test characteristic, and finally, parts.
If process is your bonafide star, why in the name of Lawrence Olivier do most data collection strategies completely ignore the process? Reports that describe production activity will rarely refer to the machines or processes used to create the products. This means your holistic view of your manufacturing capabilities is a flop – more Gigli than Lock, Stock and Two Smoking Barrels. You are now making business decisions based on incomplete data.
For example, capturing and monitoring fill volumes is important, but think of how much more you’ll get from the data if you knew the exact nozzle that filled
Give the process a leading role
5 © Copyright 2012 InfinityQS
33333
A moving storyline develops when you put these three characters on a stage and add a time element. The data collection frequency becomes the FPS (frames per second) rate and is set to capture the flow of the action. An action-thriller process may require more FPS than a glacier documentary – so sample your process streams accordingly.
Of the three characters, the process plays the leading role. All facets of manufacturing are influ-enced by the process role. There is much activity involving the process – process flow maps, process set points, process technologies, process engineers, process controls, process inputs and outputs, process maintenance – you get the picture. Without process, there are no test characteristics, without
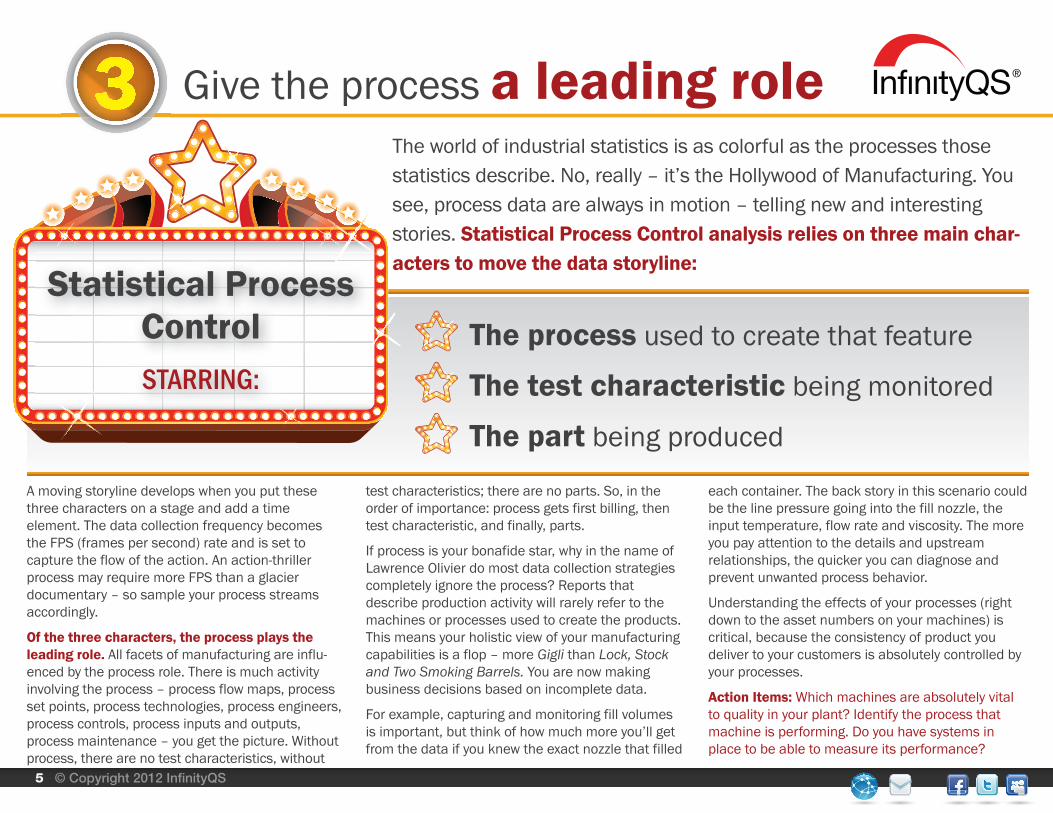
The world of industrial statistics is as colorful as the processes those statistics describe. No, really – it’s the Hollywood of Manufacturing. You see, process data are always in motion – telling new and interesting stories. Statistical Process Control analysis relies on three main char-acters to move the data storyline:
each container. The back story in this scenario could be the line pressure going into the fill nozzle, the input temperature, flow rate and viscosity. The more you pay attention to the details and upstream relationships, the quicker you can diagnose and prevent unwanted process behavior.
Understanding the effects of your processes (right down to the asset numbers on your machines) is critical, because the consistency of product you deliver to your customers is absolutely controlled by your processes.
Action Items: Which machines are absolutely vital to quality in your plant? Identify the process that machine is performing. Do you have systems in place to be able to measure its performance?
The process used to create that feature
The test characteristic being monitored
The part being produced
Statistical ProcessControlSTARRING:
1. Only display on the computer screen what helps the user. For example, if the user has not yet been taught about control charts, why display an Xbar and Range chart on the screen when a run chart with spec limits is what’s meaningful? If the user doesn’t know about run charts, maybe start with just a spreadsheet of the historical results. More valuable visualiza-tions of the data should be incorporated over time. The rule is to not consume computer screen real estate with unusable information.2. Set up the software so that all calculations perform automatically; not just the heavy stats, but also the little calculations that can speed up data collection, like calculating the net weight from the entered container and gross weights. 3. If available, go through the trouble to set up barcode reading solutions. This not only speeds up collection, but significantly improves accuracy.4. Use software that automatically prompts when certain checks are due. Some checks are based on time intervals since the last check was performed, while other checks can be based on events – like a line changeover, a new raw material lot or failed metal detector challenge. When the line is running, the line is running – anything you can do to remove distractions will be appreciated.5. If your company has made the investment to digitize its command media, extend the value of that investment by making those electronic documents, the ones that are meaningful, readily available in the SPC software.Action Item: Are you making easy hard? Make sure your shop floor systems are optimized for an actual shop floor environment.
Keep it simple
6 © Copyright 2012 InfinityQS
Back in 1984, a little-known company called Apple Computer visited college campuses to intro-duce a new computer called the Macintosh. If a student came up to Apple Computer’s display and used something called a mouse, they’d receive a t-shirt. I got one of those t-shirts, and to this day, I’ll never forget the phrase silk screened on the front, “Easy Is Hard.” In the world of industrial statistics, one can go off the deep end into the details of the formulas and theories. However, the people you rely on to collect all of that raw process data are the ones paid to keep production going. Any data collection tasks performed during production runs had better be easy to capture. If it’s difficult, the amount and quality of data captured may be inad-equate. Plus, if the data they are asked to collect are not meaningful to them, then the data may not be reliable. Any data collection and analysis software introduced on the manufacturing floor must be easy to use and meaningful to the ones being asked to collect the data. So, here are some ideas to help improve data veracity and lessen the burden of acquisition.
The goal is to create a data collection environment where those who participate are eagerly engaged because the effort to collect the data is easier than what they were doing before and the results of their efforts help them visualize and manage their processes better. “Easy is hard”, but well worth the upfront planning.
44444
As you start down the path of implementing real-time quality systems with your suppliers, just think how much better your assembly lines would run if non-conforming product never made it into the shipping container of components that fed the lines. Consider how much more secure your brand would be if you could monitor and correct, in real-time, output from your co-packers. How much better could you and your suppliers’
Expect a value chain reaction
7 © Copyright 2012 InfinityQS
So, your ownership of quality needs to extend all the way through your value chain. Readily available web-based software applications (SaaS - software as a service), make feedback just as real-time as if the product were being produced on the machines just outside your door. I once attended an all-hands supplier symposium where there were 100’s of suppliers in attendance. During the kickoff session, the customer’s director of supplier quality displayed, on the big screen, the following message, “We’ve Upped Our Quality, So Up Yours.” This initiated all sorts of emotions, but in the end, the suppliers really didn’t know what to do with that statement. What is, as Dr. Edwards Deming would say, the “operational defini-tion” of Up Yours?
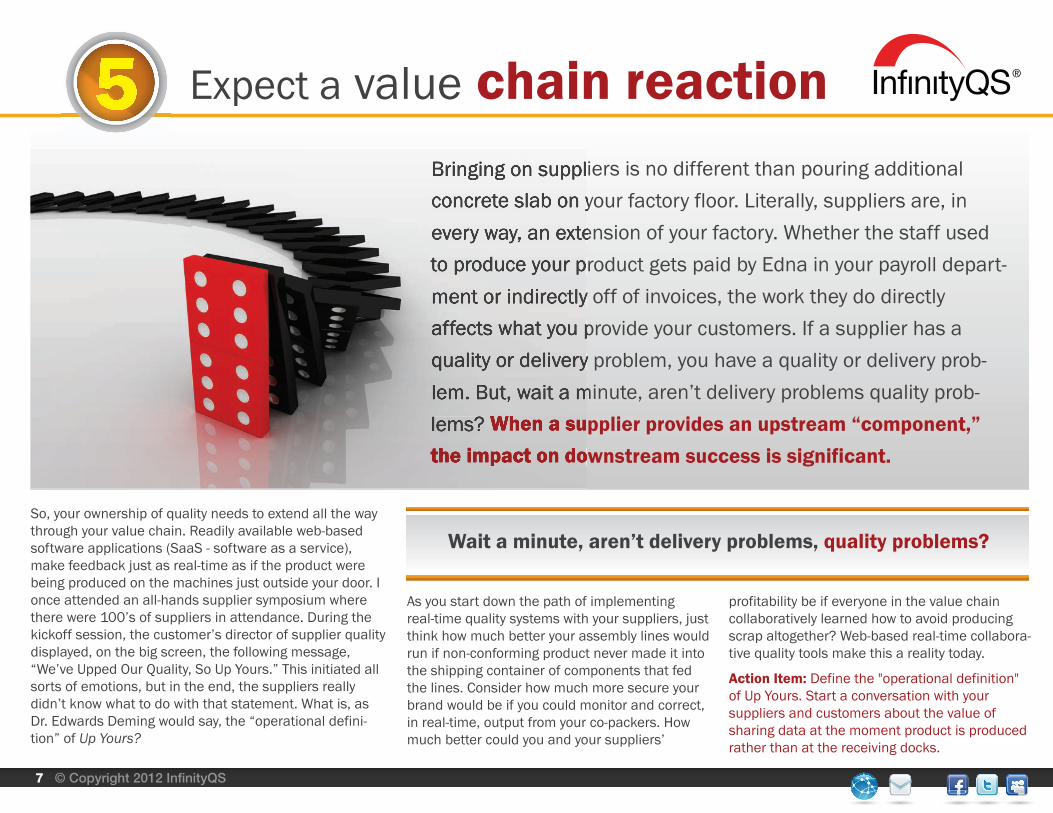
Bringing on suppliers is no different than pouring additional concrete slab on your factory floor. Literally, suppliers are, in every way, an extension of your factory. Whether the staff used to produce your product gets paid by Edna in your payroll depart-ment or indirectly off of invoices, the work they do directly affects what you provide your customers. If a supplier has a quality or delivery problem, you have a quality or delivery prob-lem. But, wait a minute, aren’t delivery problems quality prob-lems? When a supplier provides an upstream “component,” the impact on downstream success is significant.
Wait a minute, aren’t delivery problems, quality problems?
55555
profitability be if everyone in the value chain collaboratively learned how to avoid producing scrap altogether? Web-based real-time collabora-tive quality tools make this a reality today.
Action Item: Define the "operational definition" of Up Yours. Start a conversation with your suppliers and customers about the value of sharing data at the moment product is produced rather than at the receiving docks.
Bringing on suppliers is no different than pouring additional concrete slab on your factory floor. Literally, suppliers are, in every way, an extension of your factory. Whether the staff used to produce your product gets paid by Edna in your payroll department or indirectly off of invoices, the work they do directly affects what you provide your customers. If a supplier has a quality or delivery problem, you have a quality or delivery problem. But, wait a minute, aren’t delivery problems quality problems? When a supplier provides an upstream “component,” the impact on downstream success is significant.
Waiting until the end of a run (or shift) to review the control charts squanders tremendous early warning detection opportunities to mitigate expensive problems. The control chart is always talking, but it’s up to you to listen.
Always be vigilant
8 © Copyright 2012 InfinityQS
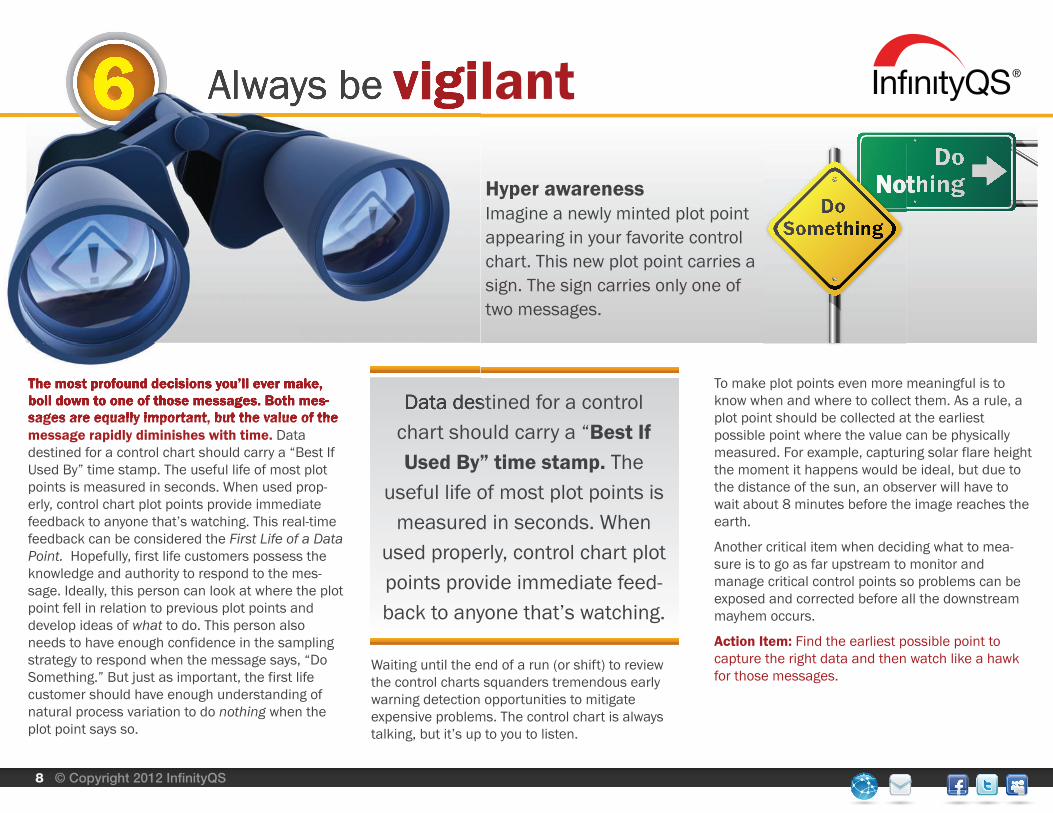
The most profound decisions you’ll ever make, boil down to one of those messages. Both mes-sages are equally important, but the value of the message rapidly diminishes with time. Data destined for a control chart should carry a “Best If Used By” time stamp. The useful life of most plot points is measured in seconds. When used prop-erly, control chart plot points provide immediate feedback to anyone that’s watching. This real-time feedback can be considered the First Life of a Data Point. Hopefully, first life customers possess the knowledge and authority to respond to the mes-sage. Ideally, this person can look at where the plot point fell in relation to previous plot points and develop ideas of what to do. This person also needs to have enough confidence in the sampling strategy to respond when the message says, “Do Something.” But just as important, the first life customer should have enough understanding of natural process variation to do nothing when the plot point says so.
Hyper awarenessImagine a newly minted plot point appearing in your favorite control chart. This new plot point carries a sign. The sign carries only one of two messages.
Data destined for a control chart should carry a “Best If Used By” time stamp. The
useful life of most plot points is measured in seconds. When
used properly, control chart plot points provide immediate feed-back to anyone that’s watching.
To make plot points even more meaningful is to know when and where to collect them. As a rule, a plot point should be collected at the earliest possible point where the value can be physically measured. For example, capturing solar flare height the moment it happens would be ideal, but due to the distance of the sun, an observer will have to wait about 8 minutes before the image reaches the earth.
Another critical item when deciding what to mea-sure is to go as far upstream to monitor and manage critical control points so problems can be exposed and corrected before all the downstream mayhem occurs.
Action Item: Find the earliest possible point to capture the right data and then watch like a hawk for those messages.
Always be vigilant66666
The most profound decisions you’ll ever make, boil down to one of those messages. Both mes-sages are equally important, but the value of the
Data destined for a control
can know, prior to running a job, what percent of the output will be scrapped and what percent will need rework. With this knowledge, companies will be more accurate with their make/buy decisions, raw material usage, schedules, overtime, machine match-ing and many more areas of benefit.To achieve this level of benefit, the raw data needs to be sufficiently tagged and the
Always dig deeper
9 © Copyright 2012 InfinityQS
77777Over a period of time, a database housing all the once real-time measurements from your processes soon evolves into a valuable Process Capability Database. The customers of this data are not making real-time process adjustment decisions, but rather interrogating the data to find ways to make the processes run better tomorrow. If, during the initial data collection, the measurement values were tagged with additional information that describes the physical environment from which the data were gathered, the accumu-lated data will turn into a gold mine.
Simple information, like shift, lot, raw material supplier, machine ID, fill nozzle, cavity number, ambient temperature, flow rate, belt speed, pressure and any other item that one believes might influence a process’ output adds tremendous value to your data. Captur-ing and understanding the effects of these items is the key to defining true process capability. One who asks, “What’s the capa-bility of that process?” and expects the response to be one number, has a meager understanding of process capability. When armed with all the sources of variation and their effects, one soon learns that a process’ capability is a matrix of numbers. Expected capability is 100% dependent on what one is asking a process to do. For example, a balance is much more consistent when asked to provide the weight of a block of steel than to weigh an attached human finger, or even a shaking Chihuahua dog.
Predictable expectations can be calculated using a well-defined capability database. One
Thank goodness data has more thanone life. Exploiting all the lives is best,but if you missed out on the first life –don’t worry – because there’s still morevalue, a lot more, to squeeze out ofyour data.
...raw data needs to be sufficiently tagged and the database analytical tools need to be strong enough to
mine, combine and cross-analyze...
database analytical tools need to be strong enough to mine, combine and cross-analyze the data in every way imaginable. If, at the corporate level, one needs to compare how one site produces product vs. another site, make sure the entered raw data is tagged with site location. What gets tagged to the raw data will evolve as companies learn how to exploit the multiple lives of their data. Owning this information about your processes will literally allow you to predict the future. Just think how wealthy we’d become if we could just have a 30 second peek into the future. That’s exactly what intelligent use of statistics brings to corporate decision-making.
Action Item: Improve predictive analysis and learn how to see into the future by identifying and collecting attributes that may be unique to your environment.
Next steps
10 © Copyright 2012 InfinityQS
I hope you’ve enjoyed this ebook, and that it helps create some conversations about your owncompany’s habits. If you want to learn more, check out:
Quality is a strategic capability that, frankly, some companies don’t get.
Don’t worry, because those companies disappear before too long. It’s not surprising that happens – not only do you have to collect the right data to fuel all the activity, but you have to enable your own employees while considering more players than just yourselves. You not only have to prepare to take action in the moment, but also set up an approach to review and effect change on an ongoing basis. The manufacturers that do get it, that routinely demonstrate the 7 habits described above, repeatedly show up as customer favorites, win industry awards, or deliver returns to their shareholders.
Read InfinityQS’ blog
Watch a webinar
View customer testimonials
Read published articles by InfinityQS