inflation hedging it & trading it - company – deutsche...
TRANSCRIPT
Deutsche Bank Corporate Banking & Securities
Inflation Hedging it & Trading it
Inflation—Hedgingit&Tradingit Deutsche Bank
Introduction Whyinflation,whynow?
1.0 Deutsche Bank’s capabilities and credentials in this market 1.1HowDeutscheBank’sinflationofferingdiffersfrom competitors 2.0 MarketOverview–theriseandriseofinflationvolatility 2.1 ComponentsofInflationindices
3.0 InflationLinkedBonds 3.1 InflationLinkedBonds 3.2RealYieldandBreakevenInflationandInflationProtection 3.3IndexationandBreakevenInflation 3.4RiskMeasures,EMSovereignLinkers,Seasonality, andUSTIPS 3.5UKIndexLinkedGilts,EURSovereignLinkers,andother Important Markets 3.6ILBcouponfrequencyandsettlementcharacteristics
4.0 InflationSwaps 4.1 ILSSwapsandMarkets 4.2UKSwaps,CorporateLinkers,andUSSwaps 4.3ILSIndexation 4.4ILSPensionFunddemand
5.0 Assessing Relative Value 5.1 LinkerAssetSwapsandtheLeverageEffect 5.25sourcesofAssetSwapDifference 5.3Whatisthe‘Fair’PriceforInflationProtection? 5.4FairCreditSpreadofInflationLinkedBonds 5.5HedgewithBondsorSwaps 5.6 Summary
6.0 InflationOptions 6.1 InflationOptions 6.2Whoarethemajorplayersintheoptionsmarket? 6.3OptionProducts 6.4Whatarethetradingopportunities? 6.5 Option Strategies 6.6 Creating Optimal Hedges
7.0 Deflationtailrisk 7.1 DeflationTailRisk:DB5YearNote 8.0 CaseStudy–Zero-CouponOptionTrade
9.0 FurtherReading 9.1InflationHedgingforInstitutionalInvestors
10.0 Contacts 10.1DeutscheBankGlobalInflationTeam
Contents
Inflation—Hedgingit&Tradingit Deutsche Bank 4
There has never been a better timetotalkaboutinflation:
–Inflationhasbeenrunning above central bank targets again –Atthesametimemonetary policy seems to be constrained byhighunemployment, elevateddebtlevelsandfragile financialmarkets –Higheruncertaintyaboutthe inflationoutlookraisesthe incentivetohedgeinflationrisks –Anyinvestorwithabond portfolioisexposed.
Deutsche Bank is very strongly positioned to advise clients on whattodo:
–WewererecentlyvotedInterest RateDerivativesHouseofthe Year by Risk Magazine –Wehavealargeglobalinflation derivatives trading and structuring team –Wehaveextensiveexperience ofhelpingclientsfindinflation solutions.
TheDeutscheBankinflationteamhasdevelopedthisbriefingdocumentto:
–Setoutthechallenges andopportunitiesfacedby clients –Explaintheproductsand strategieswehavedeveloped.
TheDeutscheBankGlobalInflationteamcanhelp.
Introduction Whyinflation,whynow?
1Deutsche Bank’s credentials and capabilitiesintheInflationmarketHowDeutscheBank’sinflationofferingsdifferfromcompetitors
Inflation—Hedgingit&Tradingit Deutsche Bank 6
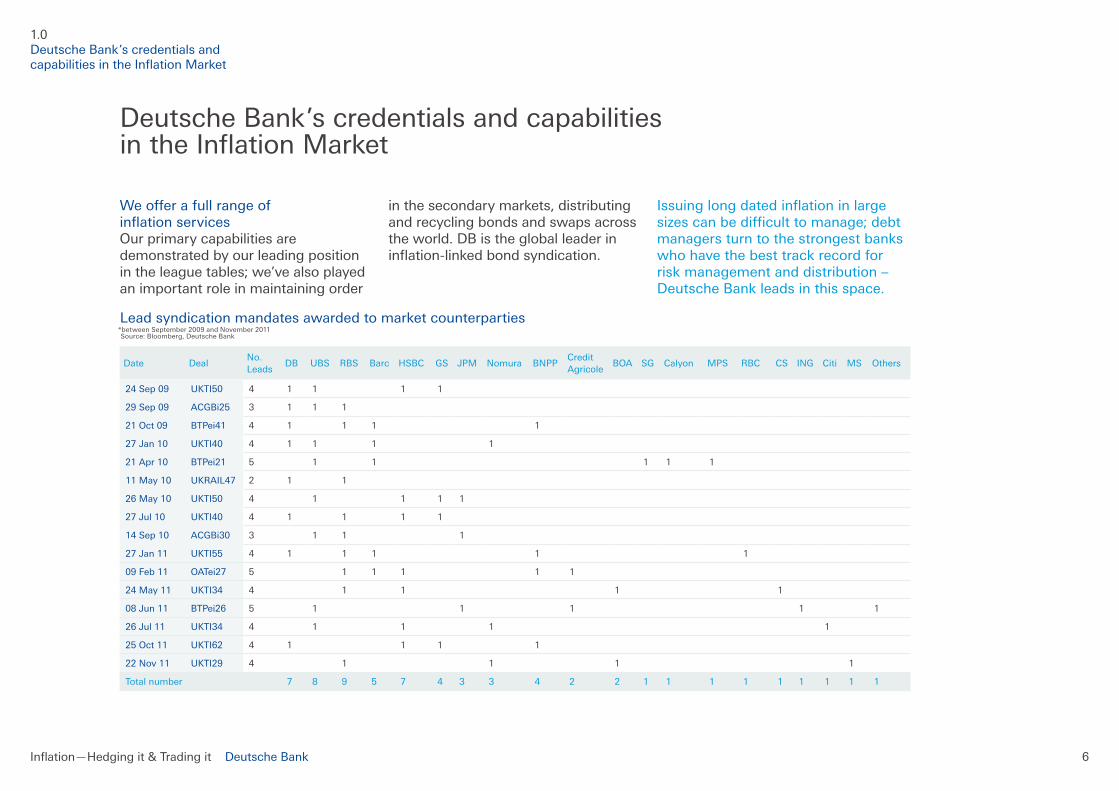
Weofferafullrangeof inflationservices Our primary capabilities are demonstrated by our leading position intheleaguetables;we’vealsoplayedan important role in maintaining order
Date DealNo.Leads
DB UBS RBS Barc HSBC GS JPM Nomura BNPPCredit Agricole
BOA SG Calyon MPS RBC CS ING Citi MS Others
24 Sep 09 UKTI50 4 1 1 1 1
29 Sep 09 ACGBi25 3 1 1 1
21 Oct 09 BTPei41 4 1 1 1 1
27 Jan 10 UKTI40 4 1 1 1 1
21 Apr 10 BTPei21 5 1 1 1 1 1
11 May 10 UKRAIL47 2 1 1
26 May 10 UKTI50 4 1 1 1 1
27 Jul 10 UKTI40 4 1 1 1 1
14 Sep 10 ACGBi30 3 1 1 1
27 Jan 11 UKTI55 4 1 1 1 1 1
09Feb11 OATei27 5 1 1 1 1 1
24 May 11 UKTI34 4 1 1 1 1
08 Jun 11 BTPei26 5 1 1 1 1 1
26 Jul 11 UKTI34 4 1 1 1 1
25 Oct 11 UKTI62 4 1 1 1 1
22Nov11 UKTI29 4 1 1 1 1
Total number 7 8 9 5 7 4 3 3 4 2 2 1 1 1 1 1 1 1 1 1
inthesecondarymarkets,distributingandrecyclingbondsandswapsacrosstheworld.DBisthegloballeaderininflation-linkedbondsyndication.
Issuinglongdatedinflationinlargesizescanbedifficulttomanage;debtmanagers turn to the strongest banks whohavethebesttrackrecordforriskmanagementanddistribution–Deutsche Bank leads in this space. Leadsyndicationmandatesawardedtomarketcounterparties
*betweenSeptember2009andNovember2011 Source:Bloomberg,DeutscheBank
Deutsche Bank’s credentials and capabilities intheInflationMarket
1.0 Deutsche Bank’s credentials and capabilitiesintheInflationMarket
Inflation—Hedgingit&Tradingit Deutsche Bank 7
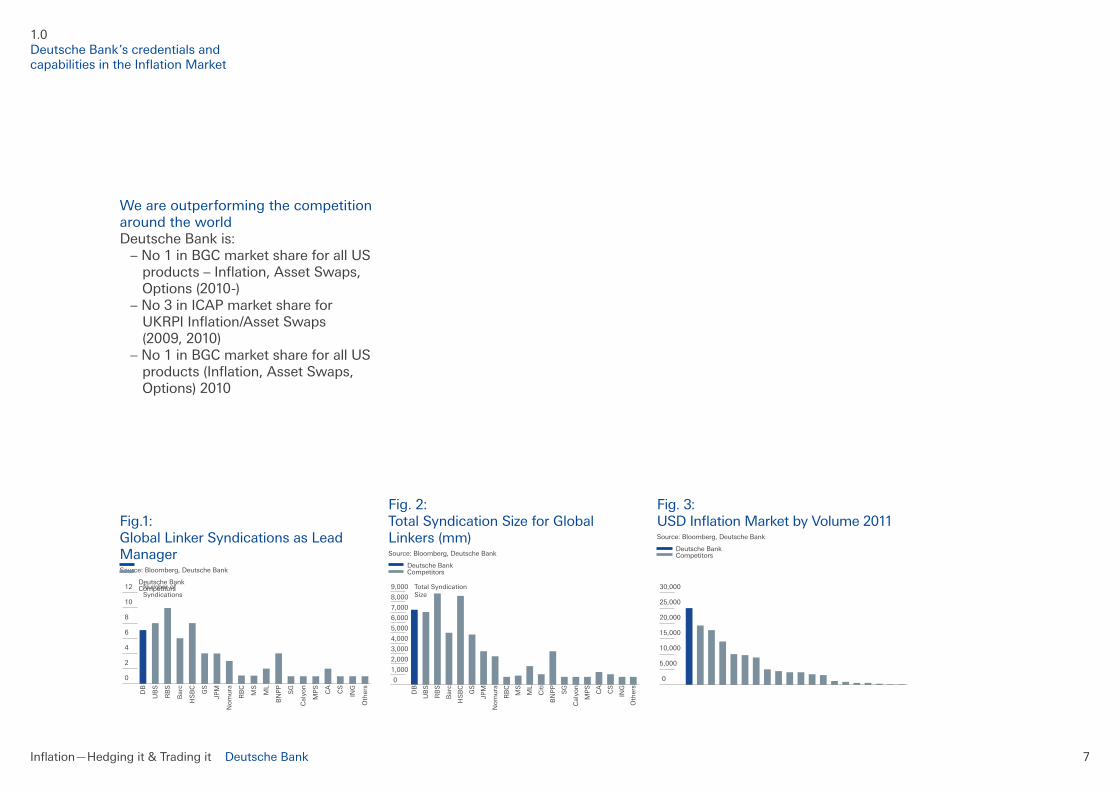
Weareoutperformingthecompetitionaroundtheworld DeutscheBankis: –No1inBGCmarketshareforallUS products–Inflation,AssetSwaps, Options(2010-) –No3inICAPmarketsharefor UKRPIInflation/AssetSwaps (2009,2010) –No1inBGCmarketshareforallUS products(Inflation,AssetSwaps, Options)2010 Fig.1: GlobalLinkerSyndicationsasLeadManager Source:Bloomberg,DeutscheBank
Deutsche Bank Competitors
Fig.2: TotalSyndicationSizeforGlobalLinkers(mm) Source:Bloomberg,DeutscheBank
Deutsche Bank Competitors
Fig.3: USDInflationMarketbyVolume2011 Source:Bloomberg,DeutscheBank
Deutsche Bank Competitors
DB
UB
S
RB
S
Bar
c
HS
BC
GS
JPM
No
mu
ra SG
BN
PP
RB
C
Cal
yon
MP
S
Oth
ers
ING
CS
CA
4
2
0
6
8
10
12 Number ofSyndications
MS
ML
9,000
8,000
7,000
6,000
5,000
4,000
3,000
2,000
1,000
DB
UB
S
RB
S
Bar
c
HS
BC
GS
JPM
No
mu
ra
BN
PP
Cit
i
SG
ML
MS
RB
C
Cal
yon
Oth
ers
ING
CS
CA
MP
STotal SyndicationSize
0 0
30,000
25,000
20,000
15,000
10,000
5,000
1.0 Deutsche Bank’s credentials and capabilitiesintheInflationMarket
Inflation—Hedgingit&Tradingit Deutsche Bank 8
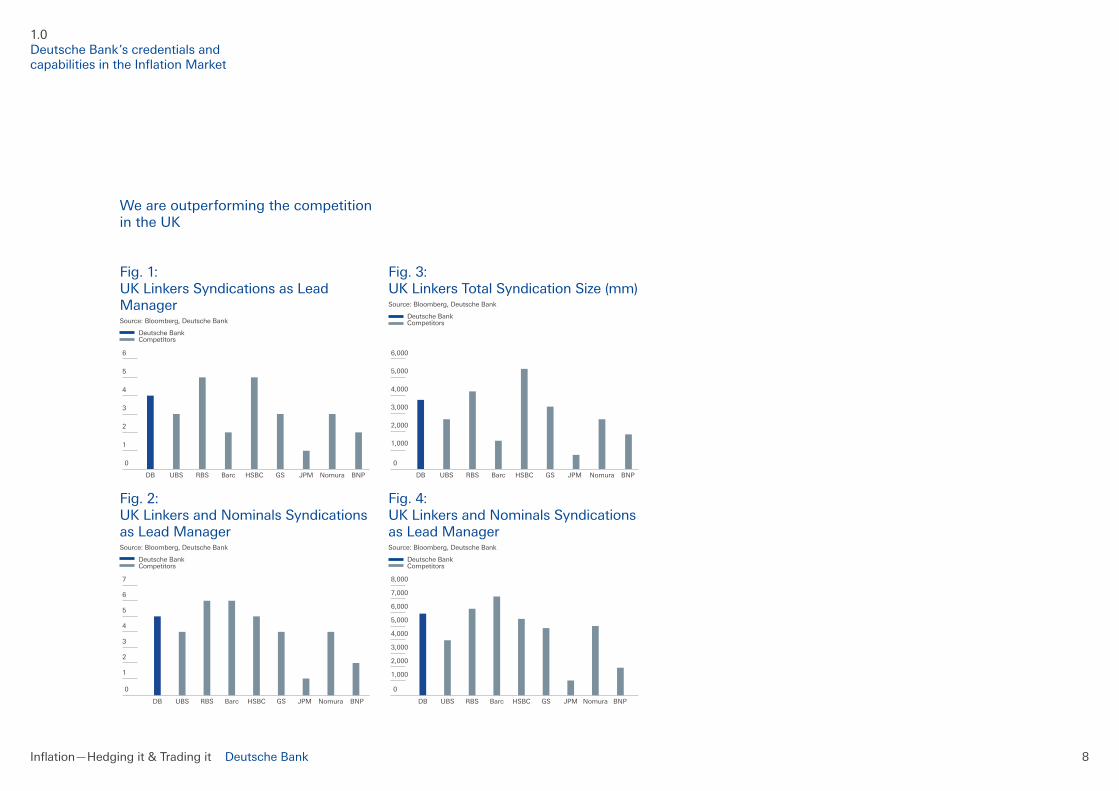
Weareoutperformingthecompetitionin the UK Fig.1: UKLinkersSyndicationsasLeadManager Source:Bloomberg,DeutscheBank
Deutsche Bank Competitors
Fig.2: UKLinkersandNominalsSyndicationsasLeadManager Source:Bloomberg,DeutscheBank
Deutsche Bank Competitors
Fig.3: UKLinkersTotalSyndicationSize(mm) Source:Bloomberg,DeutscheBank
Deutsche Bank Competitors
Fig.4: UKLinkersandNominalsSyndicationsasLeadManager Source:Bloomberg,DeutscheBank
Deutsche Bank Competitors
DB UBS RBS Barc HSBC GS JPM BNPNomura
7
6
5
4
3
2
1
0
DB UBS RBS Barc HSBC GS JPM BNPNomura
8,000
7,000
6,000
5,000
4,000
3,000
2,000
1,000
0
DB UBS RBS Barc HSBC GS JPM BNPNomura
6,000
5,000
4,000
3,000
2,000
1,000
0
6
5
4
3
2
1
DB UBS RBS Barc HSBC GS JPM BNPNomura
0
1.0 Deutsche Bank’s credentials and capabilitiesintheInflationMarket
Inflation—Hedgingit&Tradingit Deutsche Bank 9
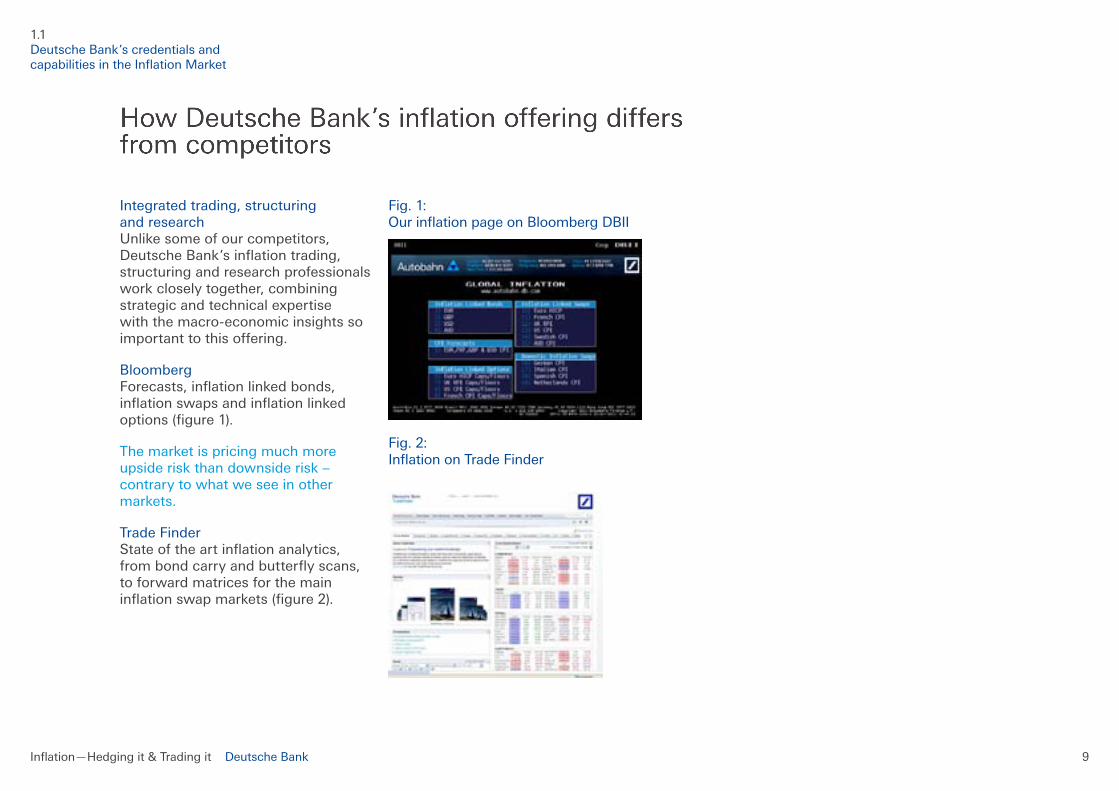
Integratedtrading,structuring and research Unlikesomeofourcompetitors,DeutscheBank’sinflationtrading,structuringandresearchprofessionalsworkcloselytogether,combiningstrategic and technical expertise withthemacro-economicinsightssoimportanttothisoffering.
Bloomberg Forecasts,inflationlinkedbonds,inflationswapsandinflationlinkedoptions(figure1).
The market is pricing much more upsideriskthandownsiderisk–contrarytowhatweseeinothermarkets.
TradeFinder Stateoftheartinflationanalytics,frombondcarryandbutterflyscans,toforwardmatricesforthemaininflationswapmarkets(figure2).
Fig.1: OurinflationpageonBloombergDBII
Fig.2: InflationonTradeFinder
1.1 Deutsche Bank’s credentials and capabilitiesintheInflationMarket

2MarketOverview
ComponentsofInflationindices
Inflation—Hedgingit&Tradingit Deutsche Bank 11
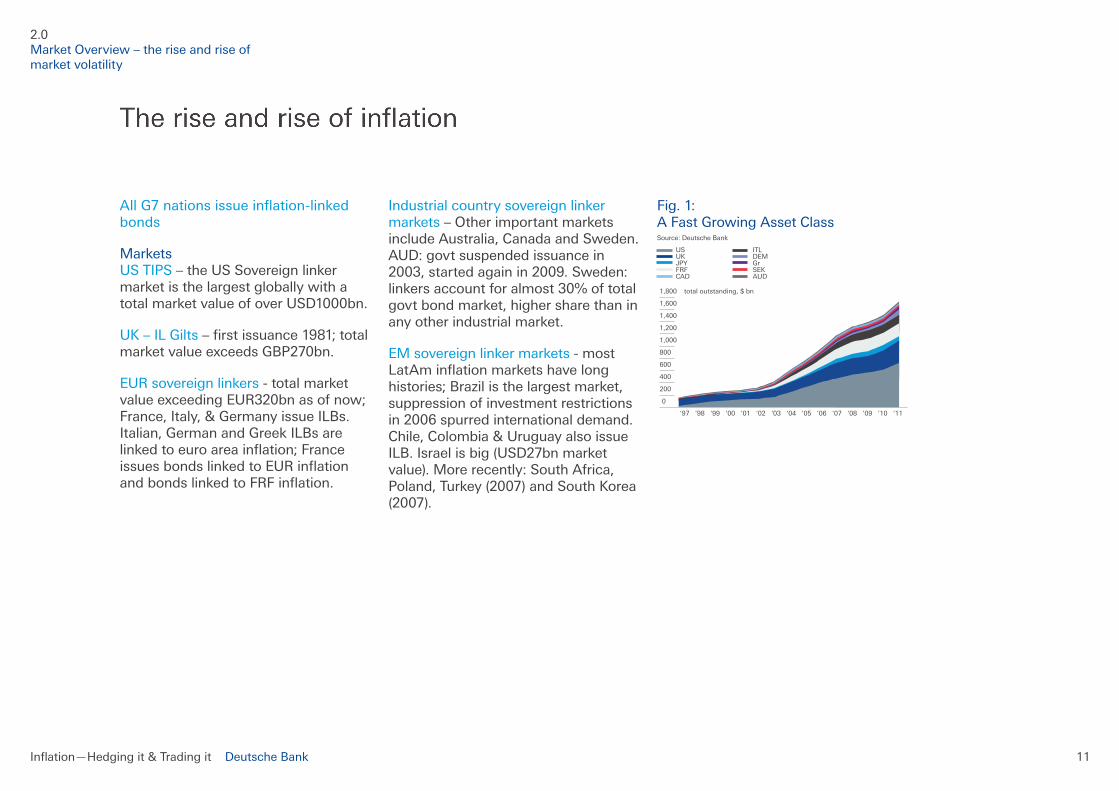
AllG7nationsissueinflation-linkedbonds
Markets USTIPS–theUSSovereignlinkermarketisthelargestgloballywithatotalmarketvalueofoverUSD1000bn.
UK–ILGilts–firstissuance1981;totalmarketvalueexceedsGBP270bn.
EURsovereignlinkers-totalmarketvalueexceedingEUR320bnasofnow;France,Italy,&GermanyissueILBs.Italian,GermanandGreekILBsarelinkedtoeuroareainflation;FranceissuesbondslinkedtoEURinflationandbondslinkedtoFRFinflation.
Industrial country sovereign linker markets–OtherimportantmarketsincludeAustralia,CanadaandSweden.AUD:govtsuspendedissuancein2003,startedagainin2009.Sweden:linkersaccountforalmost30%oftotalgovtbondmarket,highersharethaninany other industrial market.
EMsovereignlinkermarkets-mostLatAminflationmarketshavelonghistories;Brazilisthelargestmarket,suppressionofinvestmentrestrictionsin 2006 spurred international demand. Chile,Colombia&UruguayalsoissueILB.Israelisbig(USD27bnmarketvalue).Morerecently:SouthAfrica,Poland,Turkey(2007)andSouthKorea(2007).
Fig.1: AFastGrowingAssetClass Source:DeutscheBank
US ITL UK DEM JPY Gr FRF SEK CAD AUD
2.0 MarketOverview–theriseandriseofmarket volatility
‘97 ‘98 ‘99 ‘00 ‘09 ‘11‘10‘01 ‘02 ‘03 ‘04 ‘05 ‘06 ‘07 ‘08
0
1,800 total outstanding, $ bn
1,200
1,400
1,600
1,000
800
600
400
200
Inflation—Hedgingit&Tradingit Deutsche Bank 12
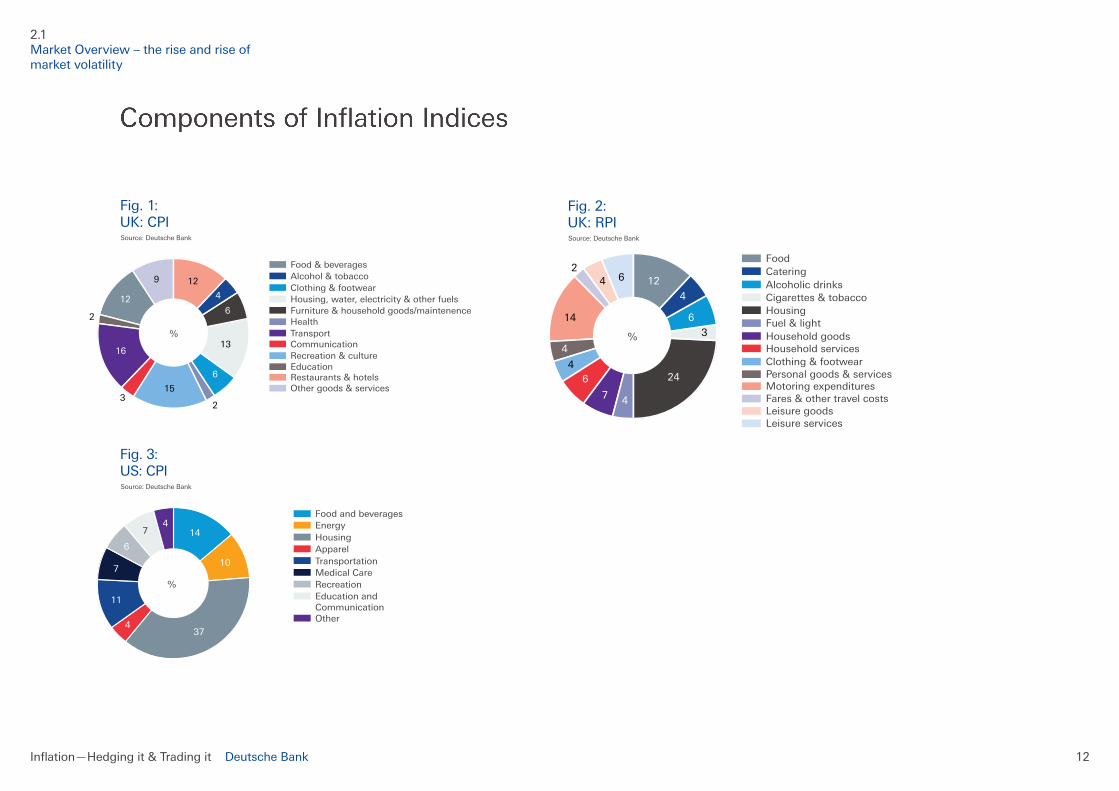
Food and beverages
HousingApparelTransportationMedical CareRecreation
Other
Education andCommunication
Energy14
10
374
11
7
6
74
%
‘97 ‘98 ‘99 ‘00 ‘09 ‘10‘01 ‘02 ‘03 ‘04 ‘05 ‘06 ‘07 ‘08
Food
Alcoholic drinks
HousingFuel & light
Catering
Cigarettes & tobacco
Clothing & footwearPersonal goods & servicesMotoring expendituresFares & other travel costsLeisure goodsLeisure services
Household goodsHousehold services
14
4
4
4
6
6
7
24
26
3
4
4
%
12
Food & beverages
Clothing & footwear
Furniture & household goods/maintenenceHealth
Alcohol & tobacco
Housing, water, electricity & other fuels
Recreation & cultureEducationRestaurants & hotelsOther goods & services
TransportCommunication
%13
4
6
6
12
16
15
23
2
129
2.1 MarketOverview–theriseandriseofmarket volatility
Fig.3: US:CPI Source:DeutscheBank
Fig.1: UK:CPI Source:DeutscheBank
Fig.2: UK:RPI Source:DeutscheBank
3InflationLinkedBonds
InflationLinkedBonds RealYieldandBreakevenInflationandInflationProtection IndexationandBreakevenInflation RiskMeasures,EMSovereignLinkers,SeasonalityandUSTIPS UKIndexLinkedGilts,EURSovereignandotherImportantMarkets ILBcouponfrequencyandsettlementcharacteristics
Inflation—Hedgingit&Tradingit Deutsche Bank 14
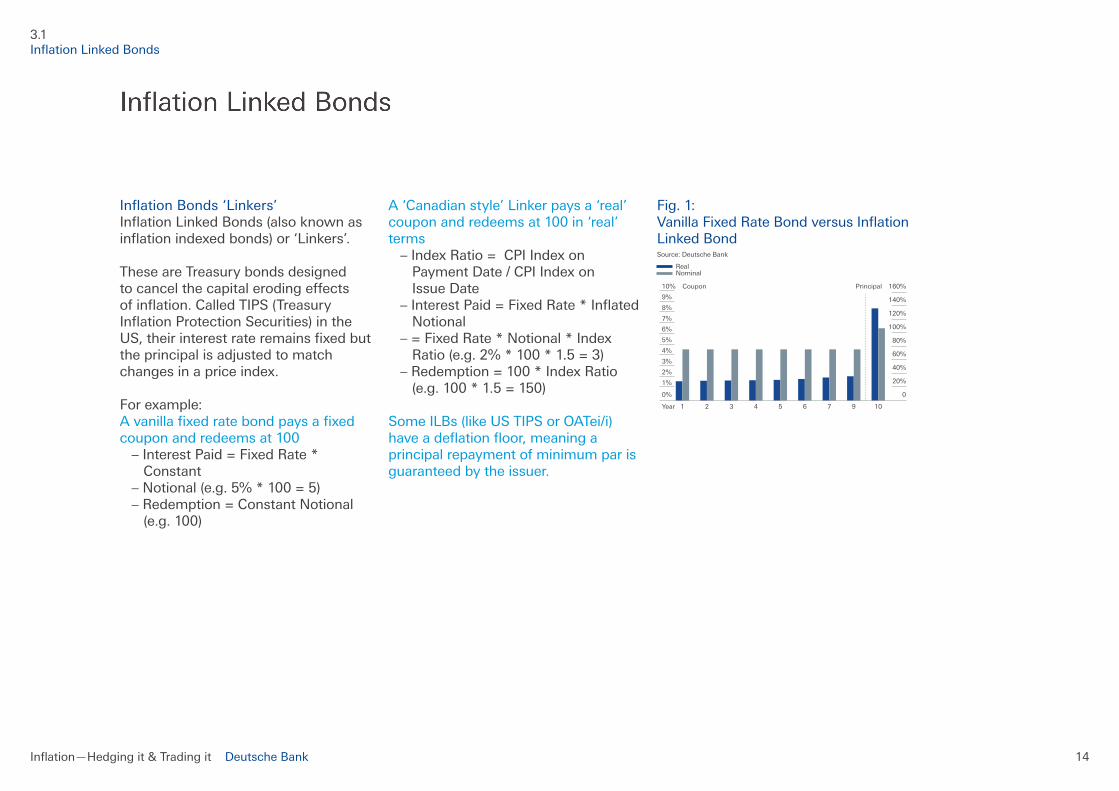
InflationBonds‘Linkers’ InflationLinkedBonds(alsoknownasinflationindexedbonds)or‘Linkers’.
These are Treasury bonds designed tocancelthecapitalerodingeffects ofinflation.CalledTIPS(Treasury InflationProtectionSecurities)inthe US,theirinterestrateremainsfixedbut the principal is adjusted to match changes in a price index.
Forexample: Avanillafixedratebondpaysafixedcoupon and redeems at 100 –InterestPaid=FixedRate* Constant –Notional(e.g.5%*100=5) –Redemption=ConstantNotional (e.g.100)
A‘Canadianstyle’Linkerpaysa‘real’coupon and redeems at 100 in ‘real’ terms –IndexRatio=CPIIndexon PaymentDate/CPIIndexon Issue Date –InterestPaid=FixedRate*Inflated Notional –=FixedRate*Notional*Index Ratio(e.g.2%*100*1.5=3) –Redemption=100*IndexRatio (e.g.100*1.5=150)
SomeILBs(likeUSTIPSorOATei/i)haveadeflationfloor,meaningaprincipalrepaymentofminimumparisguaranteed by the issuer.
Fig.1: VanillaFixedRateBondversusInflationLinkedBond Source:DeutscheBank
Real Nominal
3.1 InflationLinkedBonds
1 2 3 4 5 6 7 9 10
6%
5%
4%
3%
2%
1%
0%
Year
7%
8%
9%
10% Coupon Principal
80%
60%
40%
20%
0
100%
120%
140%
160%

Inflation—Hedgingit&Tradingit Deutsche Bank 15
RealYieldandBreakevenInflation Componentsofnominalinterestrate: –Realyield –ExpectedInflation –RiskPremium –LiquidityPremium
Issuing nominals means investors need compensationforinflationuncertainty.
Linkerssaveissuerstheriskpremiumby providing certainty about real cash flowsinthefuturei.e.theirincrease inpurchasingpoweris‘lockedin’.(figure1) Fig.1: ComponentsofNominalYield Source:DeutscheBank
InflationProtection Withpositiveinflation,theILB’scashflowswillincreaseovertimetosecuretheinvestor’spurchasingpower.
Compared to a nominal bond early couponpaymentswilltendtobelower,andthefinalrepaymentwilltendtobehigher.
Theexamplesbelowassumeanannualcouponandinflationat2%.(figures2and3). Fig.2: Nominalcashflows Source:DeutscheBank
CouponLinker(2%) NotionalConventional(rhs) CouponConventionalBond(4%) NotionalLinker(rhs)
Fig.3: Realcashflows(purchasingpower oftheCFs) Source:DeutscheBank
CouponLinker(2%) NotionalConventional(rhs) CouponConventionalBond(4%) NotionalLinker(rhs)
1 2 3 4 5 6 7 9 10
6%
5%
4%
3%
2%
1%
0%
7%
8%
9%
Nominal Yield
Breakeven RateIndex Linked Bond
RealYield
Inflation Expectations
RiskPremium Liquidity
Premium
1 2 3 4 5 6 7 8 9 not’l10
60
40
20
0
80
100
120
140
6
4
2
0
8
10
12
14
1 2 3 4 5 6 7 8 9 not’l10
60
40
20
0
80
100
120
6
4
2
0
8
10
12
3.2 InflationLinkedBonds
Inflation—Hedgingit&Tradingit Deutsche Bank 16
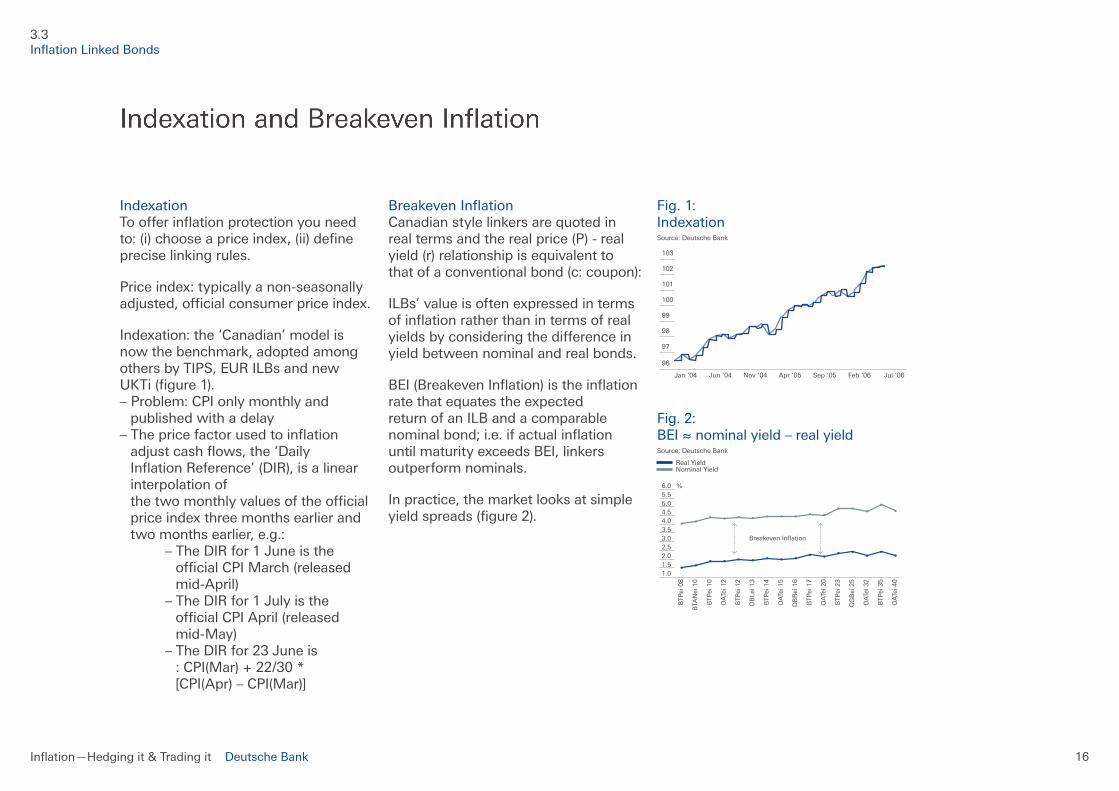
Indexation Toofferinflationprotectionyouneedto:(i)chooseapriceindex,(ii)defineprecise linking rules.
Priceindex:typicallyanon-seasonallyadjusted,officialconsumerpriceindex.
Indexation:the‘Canadian’modelisnowthebenchmark,adoptedamongothersbyTIPS,EURILBsandnewUKTi(figure1). –Problem:CPIonlymonthlyand publishedwithadelay –Thepricefactorusedtoinflation adjustcashflows,the‘Daily InflationReference’(DIR),isalinear interpolationof thetwomonthlyvaluesoftheofficial price index three months earlier and twomonthsearlier,e.g.: –TheDIRfor1Juneisthe officialCPIMarch(released mid-April) –TheDIRfor1Julyisthe officialCPIApril(released mid-May) –TheDIRfor23Juneis :CPI(Mar)+22/30* [CPI(Apr)–CPI(Mar)]
BreakevenInflation Canadianstylelinkersarequotedinrealtermsandtherealprice(P)-realyield(r)relationshipisequivalenttothatofaconventionalbond(c:coupon):
ILBs’valueisoftenexpressedintermsofinflationratherthanintermsofrealyieldsbyconsideringthedifferenceinyieldbetweennominalandrealbonds.
BEI(BreakevenInflation)istheinflationratethatequatestheexpectedreturnofanILBandacomparablenominalbond;i.e.ifactualinflationuntilmaturityexceedsBEI,linkersoutperformnominals.
Inpractice,themarketlooksatsimpleyieldspreads(figure2).
Fig.1: Indexation Source:DeutscheBank
Fig.2: BEI≈nominalyield–realyield Source:DeutscheBank
Real Yield NominalYield
Jan ‘04 Jun ‘04 Nov ‘04 Apr ‘05 Sep ‘05 Feb ‘06 Jul ‘06
100
99
98
97
96
101
102
103
BTP
ei 0
8
BTA
Nei
10
BTP
ei 1
0
OA
Tei 1
2
BTP
ei 1
2
OB
Lei 1
3
BTP
ei 1
4
OA
Tei 1
5
DB
Rei
16
BTP
ei 1
7
OA
Tei 2
0
BTP
ei 2
3
GG
Bei
25
OA
Tei 3
2
BTP
ei 3
5
OA
Tei 4
0
Breakeven Inflation
%
4.54.03.53.02.5
1.52.0
1.0
5.05.56.0
3.3 InflationLinkedBonds
Inflation—Hedgingit&Tradingit Deutsche Bank 17
Risk Measures –Theconceptsofdurationand convexity can be applied to linkers inthesamewayasforconventional bonds –Butinthecaseoflinkers,duration describesthesensitivityoftheprice to a change in the real rate –Linkershaveahigherdurationthan same maturity conventionals –Convexityrisesexponentiallywith duration,forthesamematurityILBs have a higher convexity than nominals
EMSovereignLinkerMarkets –MostLatinAmericaninflation markets have long histories; Brazil is byfarthelargestmarket,suppression ofinvestmentrestrictionsin2006 spurred international demand –Chile,Colombia&Uruguayalso issueILB –Israelhasalargelinkermarket (USD27bnmarketvalue) –MorerecentlySouthAfrica,Poland, Turkey(2007)andSouthKorea(2007)
Seasonality –Seasonalmovementsinpriceindices meanthatinflationaccrualisnot linear –QuotedrealyieldsofILBadjusttothe changinginflationuplift –realyields&BEIexhibit seasonal patterns –detectingtheseasonal pattern in prices is important forvaluingILBs –Estimationofseasonalfactorsisnot withoutdifficulties,especiallyinthe euroareawherethereisinstability –Thereisnoconsensusontheir precise value
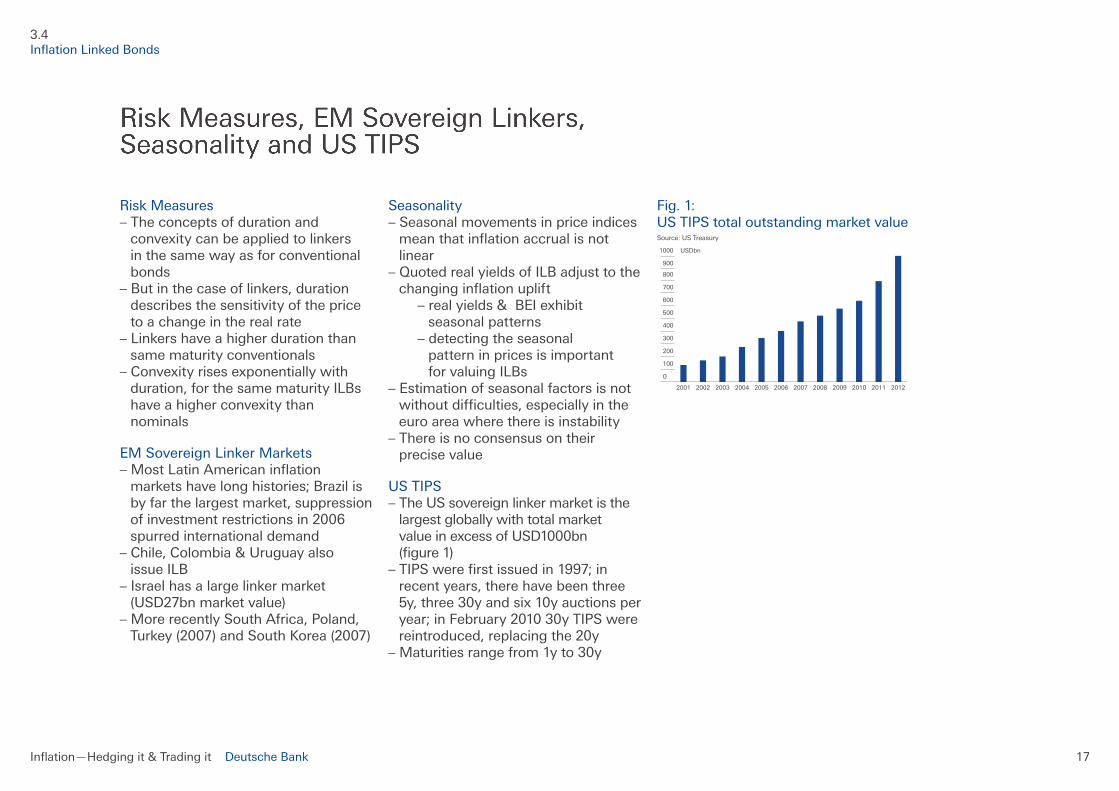
USTIPS –TheUSsovereignlinkermarketisthe largestgloballywithtotalmarket valueinexcessofUSD1000bn (figure1) –TIPSwerefirstissuedin1997;in recentyears,therehavebeenthree 5y,three30yandsix10yauctionsper year;inFebruary201030yTIPSwere reintroduced,replacingthe20y –Maturitiesrangefrom1yto30y
Fig.1: USTIPStotaloutstandingmarketvalue Source:USTreasury
3.4 InflationLinkedBonds
2001 2002 2003 2004 2005 2006 2007 2008 2009 2011 20122010
300
200
100
0
400
500
600
700
800
900
1000 USDbn
Inflation—Hedgingit&Tradingit Deutsche Bank 18
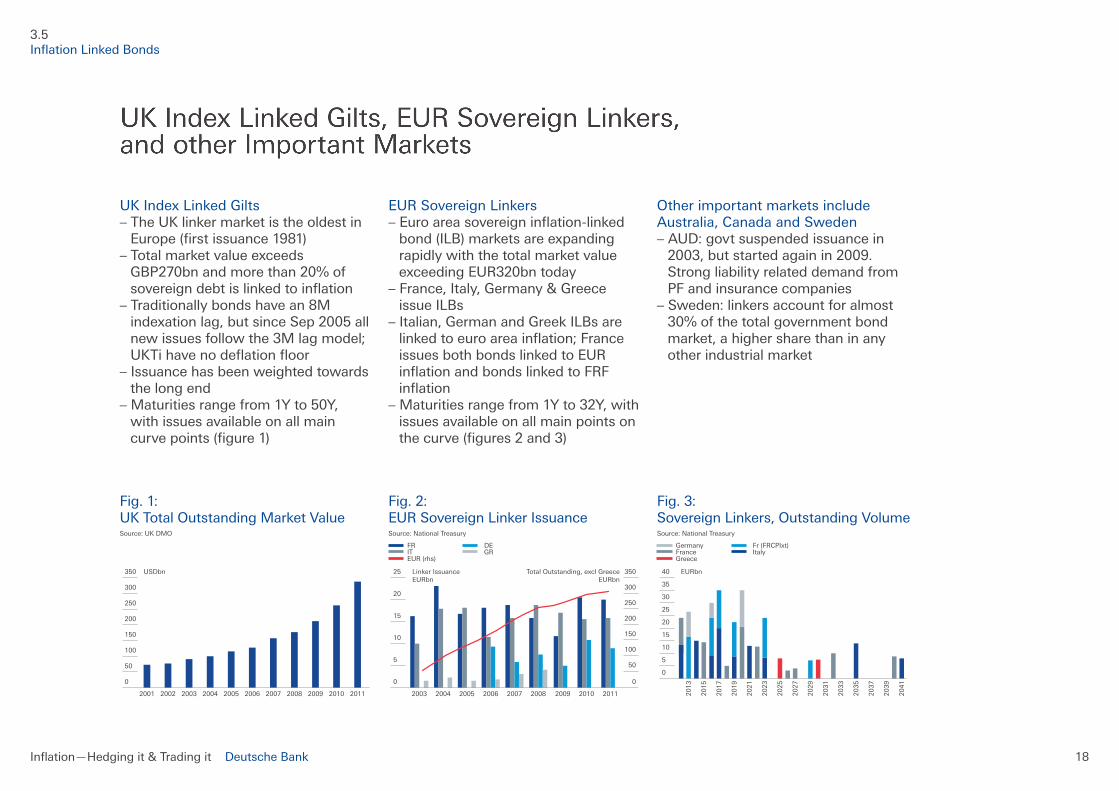
UKIndexLinkedGilts –TheUKlinkermarketistheoldestin Europe(firstissuance1981) –Totalmarketvalueexceeds GBP270bnandmorethan20%of sovereigndebtislinkedtoinflation –Traditionallybondshavean8M indexationlag,butsinceSep2005all newissuesfollowthe3Mlagmodel; UKTihavenodeflationfloor –Issuancehasbeenweightedtowards the long end –Maturitiesrangefrom1Yto50Y, withissuesavailableonallmain curvepoints(figure1)
Fig.1: UK Total Outstanding Market Value Source:UKDMO
EURSovereignLinkers –Euroareasovereigninflation-linked bond(ILB)marketsareexpanding rapidlywiththetotalmarketvalue exceedingEUR320bntoday –France,Italy,Germany&Greece issueILBs –Italian,GermanandGreekILBsare linkedtoeuroareainflation;France issuesbothbondslinkedtoEUR inflationandbondslinkedtoFRF inflation –Maturitiesrangefrom1Yto32Y,with issues available on all main points on thecurve(figures2and3)
Fig.2: EURSovereignLinkerIssuance Source:NationalTreasury
FR DE IT GR EUR(rhs)
Other important markets include Australia,CanadaandSweden –AUD:govtsuspendedissuancein 2003,butstartedagainin2009. Strongliabilityrelateddemandfrom PFandinsurancecompanies –Sweden:linkersaccountforalmost 30%ofthetotalgovernmentbond market,ahighersharethaninany other industrial market
Fig.3: SovereignLinkers,OutstandingVolume Source:NationalTreasury
Germany Fr(FRCPIxt) France Italy Greece
2001 2002 2003 2004 2005 2006 2007 2008 2009 20112010
50
0
100
150
300
200
250
350 USDbn
201120102009200820072006200520042003
5
10
15
0
20
25
50
100
150
0
200
250
300
350Linker IssuanceEURbn
Total Outstanding, excl GreeceEURbn
2031
2033
2015
2017
2019
2021
2023
2025
2027
2029
2035
2039
2037
2041
5
10
15
0
20
25
30
35
40 EURbn
2013
3.5 InflationLinkedBonds
Inflation—Hedgingit&Tradingit Deutsche Bank 19
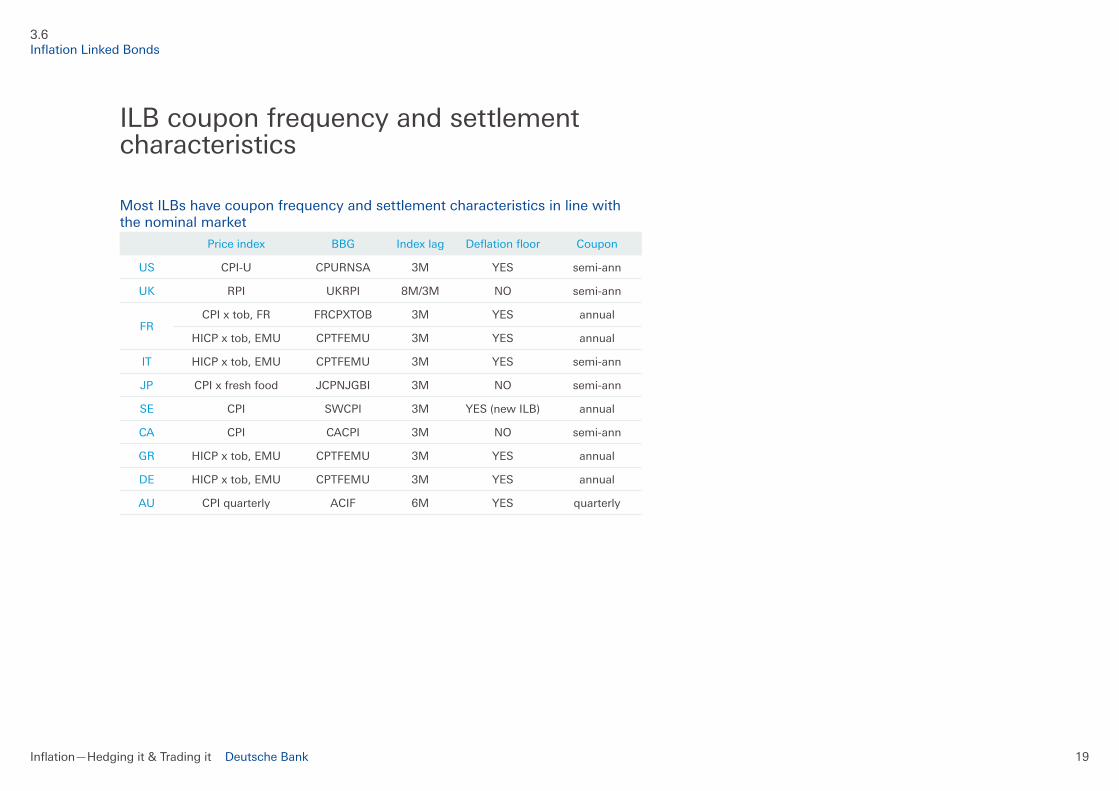
Priceindex BBG Index lag Deflationfloor Coupon
US CPI-U CPURNSA 3M YES semi-ann
UK RPI UKRPI 8M/3M NO semi-ann
FRCPIxtob,FR FRCPXTOB 3M YES annual
HICPxtob,EMU CPTFEMU 3M YES annual
IT HICPxtob,EMU CPTFEMU 3M YES semi-ann
JP CPIxfreshfood JCPNJGBI 3M NO semi-ann
SE CPI SWCPI 3M YES(newILB) annual
CA CPI CACPI 3M NO semi-ann
GR HICPxtob,EMU CPTFEMU 3M YES annual
DE HICPxtob,EMU CPTFEMU 3M YES annual
AU CPIquarterly ACIF 6M YES quarterly
3.6 InflationLinkedBonds
MostILBshavecouponfrequencyandsettlementcharacteristicsinlinewith the nominal market
ILBcouponfrequencyandsettlementcharacteristics

4InflationSwaps
ILSSwapsandMarkets UKSwaps,CorporateLinkersandUSSwaps ILSIndexation ILSPensionFundDemand
Inflation—Hedgingit&Tradingit Deutsche Bank 21
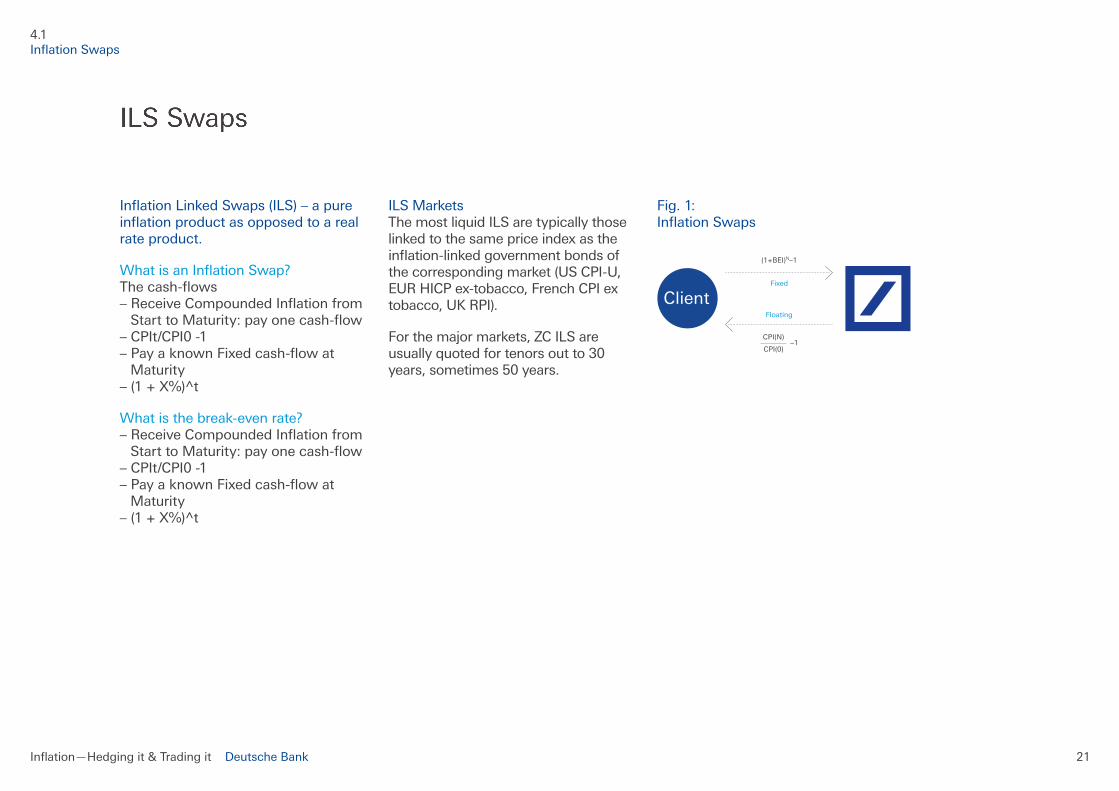
InflationLinkedSwaps(ILS)–apureinflationproductasopposedtoarealrate product.
WhatisanInflationSwap? Thecash-flows –ReceiveCompoundedInflationfrom StarttoMaturity:payonecash-flow –CPIt/CPI0-1 –PayaknownFixedcash-flowat Maturity –(1+X%)^t
Whatisthebreak-evenrate? –ReceiveCompoundedInflationfrom StarttoMaturity:payonecash-flow –CPIt/CPI0-1 –PayaknownFixedcash-flowat Maturity –(1+X%)^t
ILSMarkets ThemostliquidILSaretypicallythoselinked to the same price index as the inflation-linkedgovernmentbondsofthecorrespondingmarket(USCPI-U,EURHICPex-tobacco,FrenchCPIextobacco,UKRPI).
Forthemajormarkets,ZCILSareusuallyquotedfortenorsoutto30years,sometimes50years.
Fig.1: InflationSwaps
(1+BEI)N–1
Fixed
Floating
Client
CPI(N)
CPI(0)–1
4.1 InflationSwaps
Inflation—Hedgingit&Tradingit Deutsche Bank 22
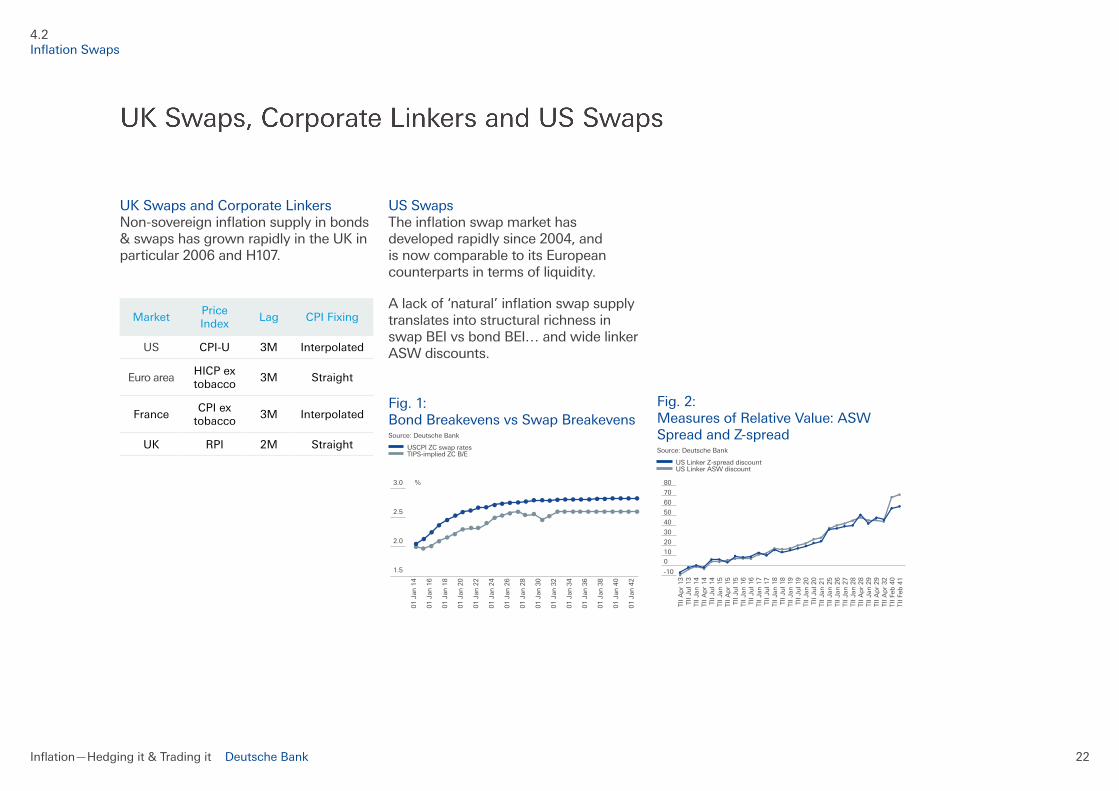
UKSwapsandCorporateLinkers Non-sovereigninflationsupplyinbonds&swapshasgrownrapidlyintheUKinparticular 2006 and H107.
MarketPriceIndex
Lag CPIFixing
US CPI-U 3M Interpolated
EuroareaHICPextobacco
3M Straight
FranceCPIex
tobacco3M Interpolated
UK RPI 2M Straight
USSwaps Theinflationswapmarkethasdevelopedrapidlysince2004,andisnowcomparabletoitsEuropeancounterpartsintermsofliquidity.
Alackof‘natural’inflationswapsupplytranslates into structural richness in swapBEIvsbondBEI…andwidelinkerASW discounts. Fig.1: BondBreakevensvsSwapBreakevens Source:DeutscheBank
USCPIZCswaprates TIPS-impliedZCB/E
Fig.2: MeasuresofRelativeValue:ASWSpreadandZ-spread Source:DeutscheBank
USLinkerZ-spreaddiscount USLinkerASWdiscount
4.2 InflationSwaps
01 J
an 1
4
01 J
an 1
6
01 J
an 1
8
01 J
an 2
0
01 J
an 2
2
01 J
an 2
4
01 J
an 2
6
01 J
an 2
8
01 J
an 3
0
01 J
an 3
2
01 J
an 3
4
01 J
an 3
6
01 J
an 3
8
01 J
an 4
0
01 J
an 4
2
1.5
2.0
2.5
3.0 %
TII A
pr
13
TII Ju
l 13
TII Ja
n 1
4TI
I A
pr
14
TII Ju
l 14
TII Ja
n 1
5TI
I A
pr
15
TII Ju
l 15
TII Ja
n 1
6TI
I Ju
l 16
TII Ja
n 1
7TI
I Ju
l 17
70
60
50
40
30
20
-10
10
0
80
TII Ja
n 1
8TI
I Ju
l 18
TII Ja
n 1
9TI
I Ju
l 19
TII Ja
n 2
0TI
I Ju
l 20
TII Ja
n 2
1TI
I Ja
n 2
5TI
I Ja
n 2
6TI
I Ja
n 2
7TI
I Ja
n 2
8TI
I A
pr
28
TII Ja
n 2
9TI
I A
pr
29
TII A
pr
32
TII Fe
b 4
0TI
I Fe
b 4
1
Inflation—Hedgingit&Tradingit Deutsche Bank 23
ILSIndexation ForFRCPIxt&USCPI,theindexationlagconventionisthesameasforthecorrespondinginflation-linkedbondmarkets –Strongdemandhasledtoalow levelofrealinterestrates,lockin lowfinancingcosts –PFIprojectswithinflationcomponent (usuallybonds,buttypically transformedintoASW) –Creditwrappingallowedcorporates toissuehighlyrateddebtwhich is more appealing to institutional investors
Buthasfallensignificantlyduringthecredit crisis.
Mainsources:regulatedutilities,PFIs,propertyleases,railwaycompanies,retailers,supranationals.
Alternativesupplyhasledtotwo-wayswapmarketandnarrowswap-bondB/Espread,butswaprichnesshasincreased again during the crisis.
4.3 InflationSwaps
ILSIndexation
Inflation—Hedgingit&Tradingit Deutsche Bank 24
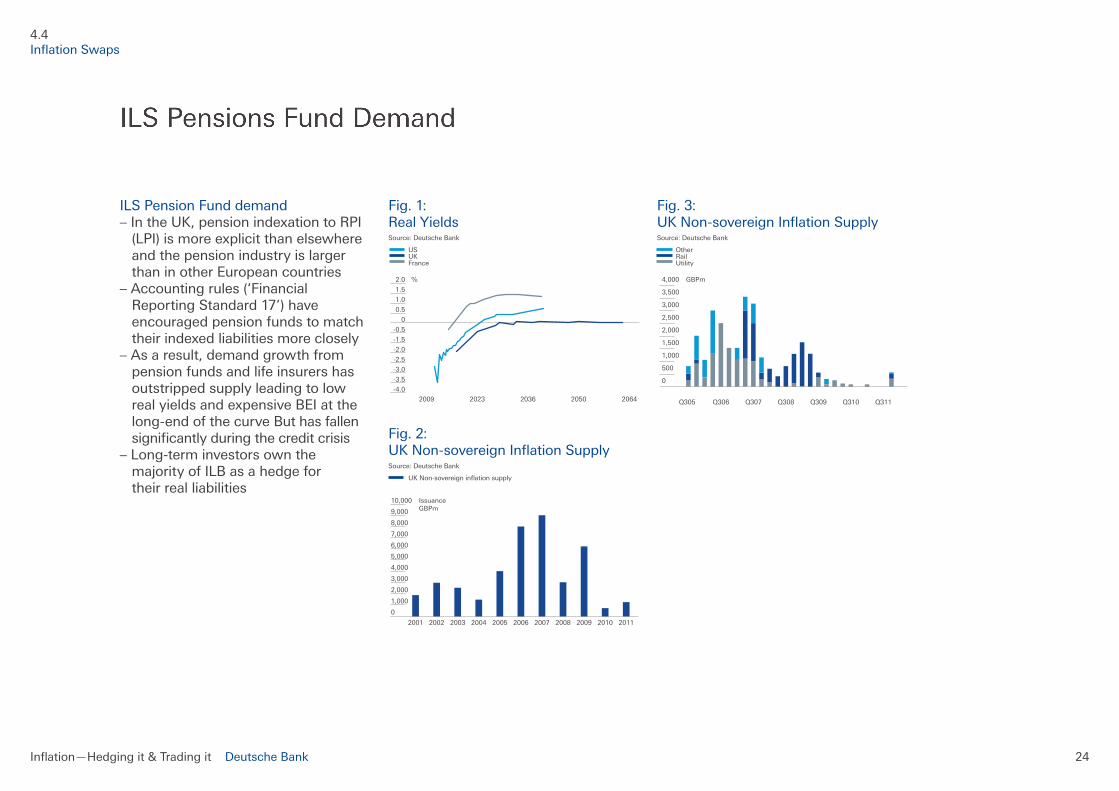
ILSPensionFunddemand –IntheUK,pensionindexationtoRPI (LPI)ismoreexplicitthanelsewhere and the pension industry is larger thaninotherEuropeancountries –Accountingrules(‘Financial ReportingStandard17’)have encouragedpensionfundstomatch their indexed liabilities more closely –Asaresult,demandgrowthfrom pensionfundsandlifeinsurershas outstrippedsupplyleadingtolow realyieldsandexpensiveBEIatthe long-endofthecurveButhasfallen significantlyduringthecreditcrisis –Long-terminvestorsownthe majorityofILBasahedgefor their real liabilities
Fig.1: Real Yields Source:DeutscheBank
US UK France
Fig.2: UKNon-sovereignInflationSupply Source:DeutscheBank
UKNon-sovereigninflationsupply
Fig.3: UKNon-sovereignInflationSupply Source:DeutscheBank
Other Rail Utility
4.4 InflationSwaps
-4.0
-3.5
-3.0
-2.5
-2.0
-1.5
0
-0.5
2.0
1.5
1.0
0.5
%
2009 2023 2036 2050 2064 Q311Q305 Q306 Q307 Q308 Q309 Q310
500
1,000
1,500
0
2,000
2,500
3,000
3,500
4,000 GBPm
2001 2002 2003 2004 2005 2006 2007 2008 2009 20112010
6,000
5,000
4,000
3,000
2,000
1,000
0
7,000
8,000
9,000
10,000 IssuanceGBPm

5Assessing Relative Value
LinkerAssetSwapandtheLeverageEffect 5SourcesofAssetSwapDifference Whatisthe‘Fair’PriceforInflationProtection? FairCreditSpreadofInflationLinkedBonds HedgewithBondsorSwaps Summary
Inflation—Hedgingit&Tradingit Deutsche Bank 26
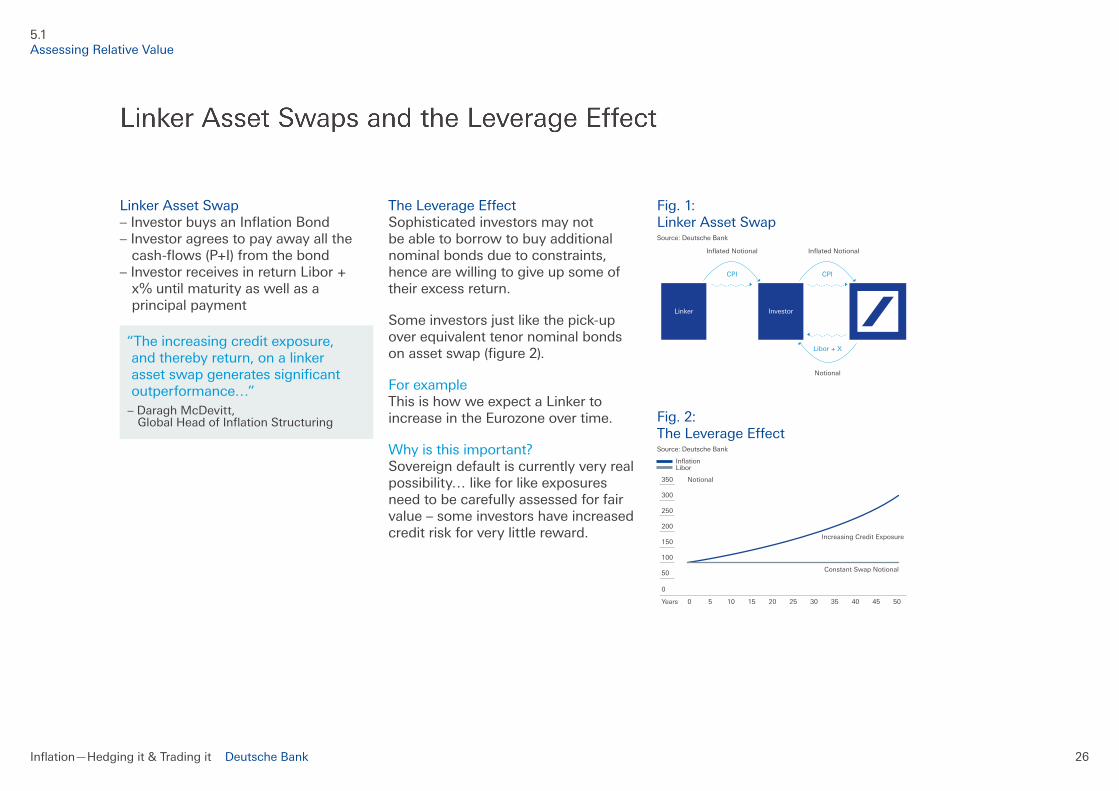
LinkerAssetSwap –InvestorbuysanInflationBond –Investoragreestopayawayallthe cash-flows(P+I)fromthebond –InvestorreceivesinreturnLibor+ x%untilmaturityaswellasa principal payment
TheLeverageEffect Sophisticated investors may not beabletoborrowtobuyadditionalnominalbondsduetoconstraints,hencearewillingtogiveupsomeoftheir excess return.
Someinvestorsjustlikethepick-upoverequivalenttenornominalbondsonassetswap(figure2).
Forexample ThisishowweexpectaLinkertoincreaseintheEurozoneovertime.
Whyisthisimportant? Sovereigndefaultiscurrentlyveryrealpossibility…likeforlikeexposuresneedtobecarefullyassessedforfairvalue–someinvestorshaveincreasedcreditriskforverylittlereward.
Fig.1: LinkerAssetSwap Source:DeutscheBank
Fig.2: TheLeverageEffect Source:DeutscheBank
Inflation Libor
5.1 Assessing Relative Value
Libor + X
Inflated Notional Inflated Notional
Notional
InvestorLinker
CPICPI
0 5 10 15 20 25
Constant Swap Notional
Increasing Credit Exposure
30 35 40Years 45 50
150
100
50
0
200
250
300
350 Notional
“Theincreasingcreditexposure,andtherebyreturn,onalinkerassetswapgeneratessignificantoutperformance…” –DaraghMcDevitt, GlobalHeadofInflationStructuring
Inflation—Hedgingit&Tradingit Deutsche Bank 27
5SourcesofAssetSwapDifference
PV01difference –Linkershaveahigherduration
Swaprichness –Thespreadbetweeninflation-linked swapsandimpliedbondbreak-evens givesrisetodifferentassetswap levelsforlinkersandnominals –Italsousuallytellsthestoryofswap supplyanddemand…
Seasonality –Seethesectiononpage3.4
Credit/Liquidity –Mis-pricedcreditcostleadingto ‘value’forissuers
Tax –Favourabledeferralsforissuers encourage supply
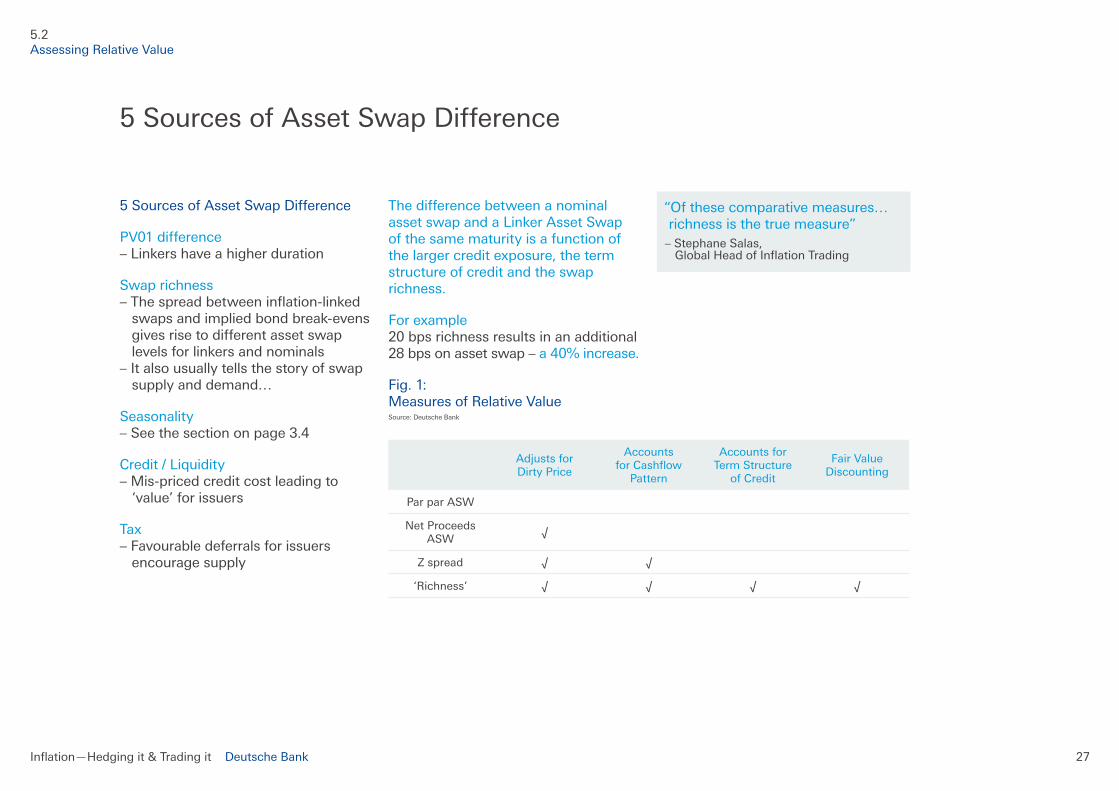
ThedifferencebetweenanominalassetswapandaLinkerAssetSwapofthesamematurityisafunctionofthelargercreditexposure,thetermstructureofcreditandtheswaprichness.
Forexample 20 bps richness results in an additional 28bpsonassetswap–a40%increase.
Fig.1: MeasuresofRelativeValue Source:DeutscheBank
Adjustsfor DirtyPrice
Accounts forCashflowPattern
AccountsforTerm Structure
ofCredit
FairValueDiscounting
ParparASW
NetProceedsASW
√
Zspread √ √
‘Richness’ √ √ √ √
5.2 Assessing Relative Value
“Ofthesecomparativemeasures…richnessisthetruemeasure” –StephaneSalas, GlobalHeadofInflationTrading
5SourcesofAssetSwapDifference
Inflation—Hedgingit&Tradingit Deutsche Bank 28
Whatisthe‘Fair’PriceforInflationProtection?
Inflation‘Breakeven’isnotequaltomarketinflationexpectationsbutisafactorof –Inflationexpectations –‘RiskPremium’ –‘LiquidityPremium’
Inflationexpectationsovertheverylong run are hard to judge but tend to be based on current economic policy –ECBtargetrateis‘under,butclose to2%’
RiskPremiumincludes –Potentialchangeinmonetarypolicy target(e.g.4%plusorminus1% insteadofunder2%) –Abandonmentofmonetarypolicy infavourofemploymentor currency board –EURbreakup,expansionor succession –Asymmetricelasticityofinflation: wagesareeasiertoraisethantocut
Liquiditypremiumincludes –Relativedemandandsupplyfor inflationbondsvnominalbonds –Balancesheetcostsofholding inflationbondstorecycleinflation –Opportunitycostofcapitalforcash usedtohedgeinflation
5.3 Assessing Relative Value
“The biggest mistake people make withinflation-linkedbondsisthinkingthatthebreakeveninflationisthemarket’sexpectedinflationrate. It is not and should not be. Thebreakevenincludeswhatthemarketexpectsinflationtobeandthemajorportionoftheriskpremiumthatyoushouldfindin thenominalmarket,andtheliquiditypremium” –MarkusHeider, GlobalHeadofInflationResearch
Whatisthe‘Fair’PriceforInflationProtection?
Inflation—Hedgingit&Tradingit Deutsche Bank 29
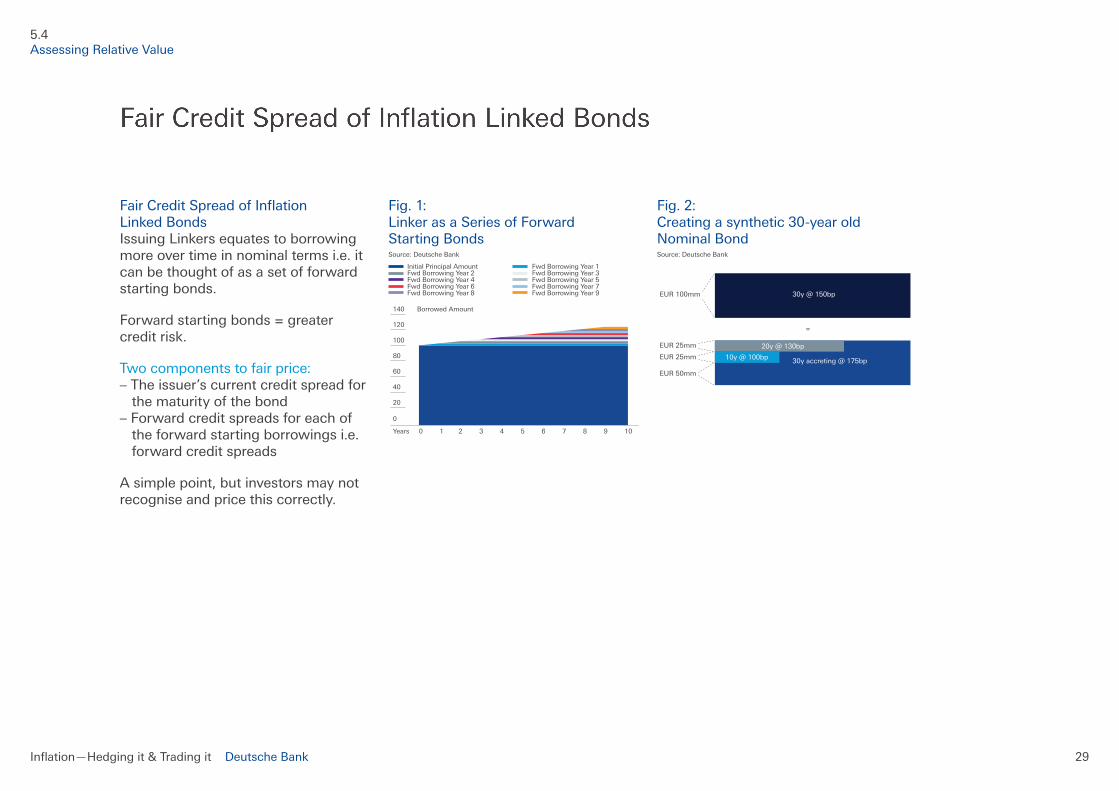
FairCreditSpreadofInflation LinkedBonds IssuingLinkersequatestoborrowingmore over time in nominal terms i.e. it canbethoughtofasasetofforwardstarting bonds.
Forwardstartingbonds=greatercredit risk.
Twocomponentstofairprice: –Theissuer’scurrentcreditspreadfor thematurityofthebond –Forwardcreditspreadsforeachof theforwardstartingborrowingsi.e. forwardcreditspreads
Asimplepoint,butinvestorsmaynotrecognise and price this correctly.
Fig.1: LinkerasaSeriesofForward Starting Bonds Source:DeutscheBank
InitialPrincipalAmount FwdBorrowingYear1 FwdBorrowingYear2 FwdBorrowingYear3 FwdBorrowingYear4 FwdBorrowingYear5 FwdBorrowingYear6 FwdBorrowingYear7 FwdBorrowingYear8 FwdBorrowingYear9
Fig.2: Creatingasynthetic30-yearoldNominalBond Source:DeutscheBank
5.4 Assessing Relative Value
0 1 2 3 4 5 6 7 8Years 9 10
60
40
20
0
80
100
120
140 Borrowed Amount
=
EUR 100mm
EUR 25mm
EUR 25mm
EUR 50mm
20y @ 130bp
10y @ 100bp 30y accreting @ 175bp
30y @ 150bp
Inflation—Hedgingit&Tradingit Deutsche Bank 30
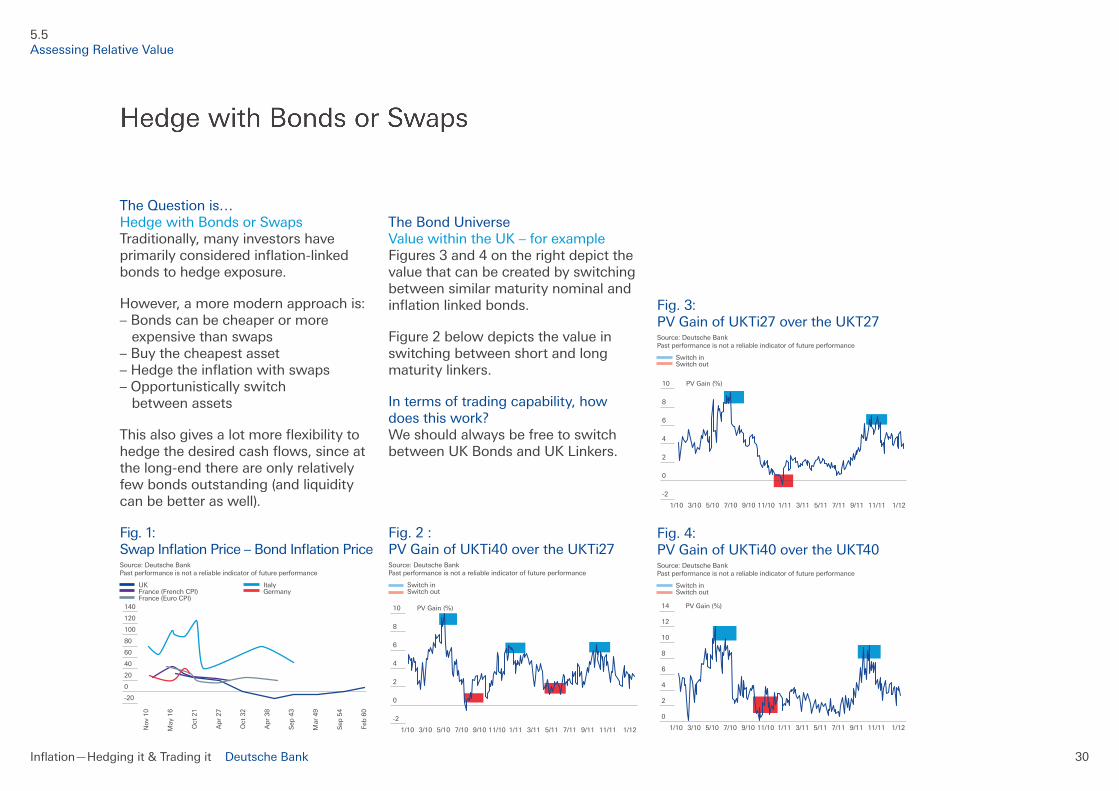
TheQuestionis… HedgewithBondsorSwaps Traditionally,manyinvestorshaveprimarilyconsideredinflation-linkedbonds to hedge exposure.
However,amoremodernapproachis: –Bondscanbecheaperormore expensivethanswaps –Buythecheapestasset –Hedgetheinflationwithswaps –Opportunisticallyswitch betweenassets
Thisalsogivesalotmoreflexibilitytohedgethedesiredcashflows,sinceatthelong-endthereareonlyrelativelyfewbondsoutstanding(andliquiditycanbebetteraswell).
Fig.1: SwapInflationPrice–BondInflationPrice Source:DeutscheBank Pastperformanceisnotareliableindicatoroffutureperformance
UK Italy France(FrenchCPI) Germany France(EuroCPI)
The Bond Universe ValuewithintheUK–forexample Figures3and4ontherightdepictthevaluethatcanbecreatedbyswitchingbetweensimilarmaturitynominalandinflationlinkedbonds.
Figure2belowdepictsthevalueinswitchingbetweenshortandlongmaturity linkers.
Intermsoftradingcapability,howdoesthiswork? WeshouldalwaysbefreetoswitchbetweenUKBondsandUKLinkers.
Fig.2: PVGainofUKTi40overtheUKTi27 Source:DeutscheBank Pastperformanceisnotareliableindicatoroffutureperformance
Switchin Switchout
Fig.3: PVGainofUKTi27overtheUKT27 Source:DeutscheBank Pastperformanceisnotareliableindicatoroffutureperformance
Switchin Switchout
Fig.4: PVGainofUKTi40overtheUKT40 Source:DeutscheBank Pastperformanceisnotareliableindicatoroffutureperformance
Switchin Switchout
5.5 Assessing Relative Value
Nov
10
May
16
Oct
21
Ap
r 27
Oct
32
Ap
r 38
Sep
43
Mar
49
Sep
54
Feb
60
40
20
0
60
80
120
100
140
-20
1/10 3/10 5/10 7/10 9/10 11/10 1/11 1/1211/119/115/11 7/113/11
2
-2
0
4
6
8
10 PV Gain (%)
1/10 3/10 5/10 7/10 9/10 11/10 1/11 1/1211/119/115/11 7/113/11
2
0
4
6
8
10
12
14 PV Gain (%)
1/10 3/10 5/10 7/10 9/10 11/10 1/11 1/1211/119/115/11 7/113/11
2
-2
0
4
6
8
10 PV Gain (%)
Inflation—Hedgingit&Tradingit Deutsche Bank 31
Tosumup… –Giventhedisplacementbetween inflationandnominalmarkets,there areopportunitiesforarbitrage –Assetswapspreadsonlinkers representapremiumforcreditthat ishardtoprice,andwhencoupled withdemand/supplyimbalancesand higherduration,theyofferapickup tonominalsforthesameunderlying issuer –Switchingbetweenequivalentrisk sovereigns/suprasovereignscan often,drivenbydynamicsofthe crosscurrencyswapsmarket, provideadditionalyieldpick-ups
–Thesedisplacementscanbe assessedbyavarietyofmetrics –Thevalueofswitchingisevident fromtheincrementalexcesspickup that is generated by selling the costlier asset to buy the cheapest assetfromtimetotime –Usedasasystematicstrategy this can yield substantial returns over medium term horizons –Theserepresentincredible opportunitiesfor‘asset-heavy’ investors,andthemarketswill likelynormalizewithtime,hence itisimportanttoactquickly
5.6 Assessing Relative Value
“Thereisn’toneriskfreecurve,thereare100,150,200…thekeyiswhendoyoupick‘thefruit’,whenisthebondcheapenough?” –DaraghMcDevitt, GlobalHeadofInflationStructuring
“…thereareincredibleopportunitiesforasset-heavyinvestors…itisimportanttoactquickly” –HaroonSana, GlobalHeadofRatesSales
Summary

6InflationOptions
InflationOptions Whoarethemajorplayersintheoptionsmarket? OptionProducts Whatarethetradingopportunities? Option Strategies Creating Optimal Hedges

Inflation—Hedgingit&Tradingit Deutsche Bank 33
Arelativelynewmarket,inflationoptionstradedbetweenEuropeandthe US have doubled every year since tradingstartedininflationswapsin2002/2003.2010sawaparticulargrowthspurt.
Longtermgrowthlookssettocontinueatthisexplosiverate,whichisclearlyindicativeofitsimportanceto clients and represents a substantial opportunity to DB as intermediary betweenbuyersandsellersofinflation.
Interbank volumes reached 50bn in 2010,upfrom13bnin2009,andjust1bn in 2005.
Fig.1: LondonOptionsVolumes Source:TullettPrebon
Fig.2: NYOptionsVolumes Source:TullettPrebon
6.1 InflationOptions
01
/09
03
/09
05
/09
07
/09
09
/09
11
/09
01
/10
03
/10
05
/10
07
/10
09
/10
11
/10
01
/11
03
/11
400
200
600
0
800
1,200
1,400
1,600
1,800 Volumes(millions)
01
/09
03
/09
05
/09
07
/09
09
/09
11
/09
01
/10
03
/10
05
/10
07
/10
09
/10
11
/10
01
/11
03
/11
1,000
2,000
0
3,000
4,000
5,000
6,000
7,000 Volumes(millions)
Inflation—Hedgingit&Tradingit Deutsche Bank 34
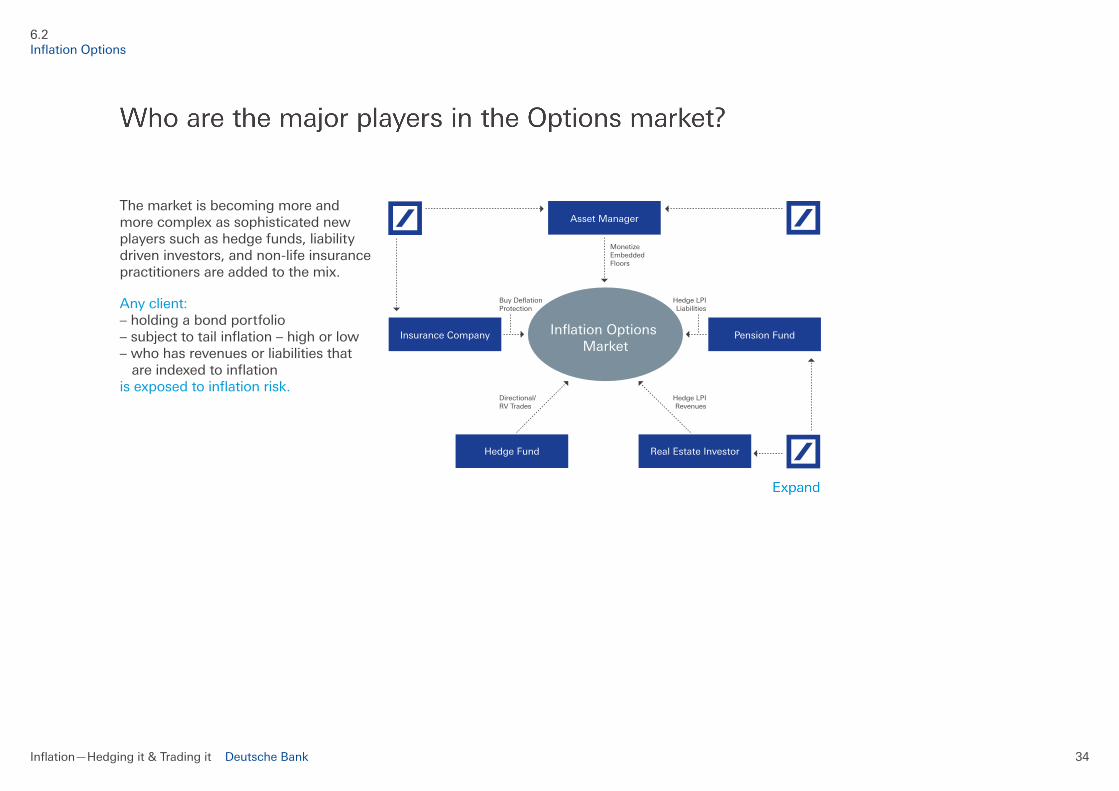
The market is becoming more and morecomplexassophisticatednewplayerssuchashedgefunds,liabilitydriveninvestors,andnon-lifeinsurancepractitioners are added to the mix.
Anyclient: –holdingabondportfolio –subjecttotailinflation–highorlow –whohasrevenuesorliabilitiesthat areindexedtoinflation isexposedtoinflationrisk.
6.2 InflationOptions
Hedge Fund Real Estate Investor
Asset Manager
Inflation Options Market
Insurance Company Pension Fund
Directional/RV Trades
Hedge LPIRevenues
Hedge LPILiabilities
Buy DeflationProtection
Monetize EmbeddedFloors
Inflation—Hedgingit&Tradingit Deutsche Bank 35
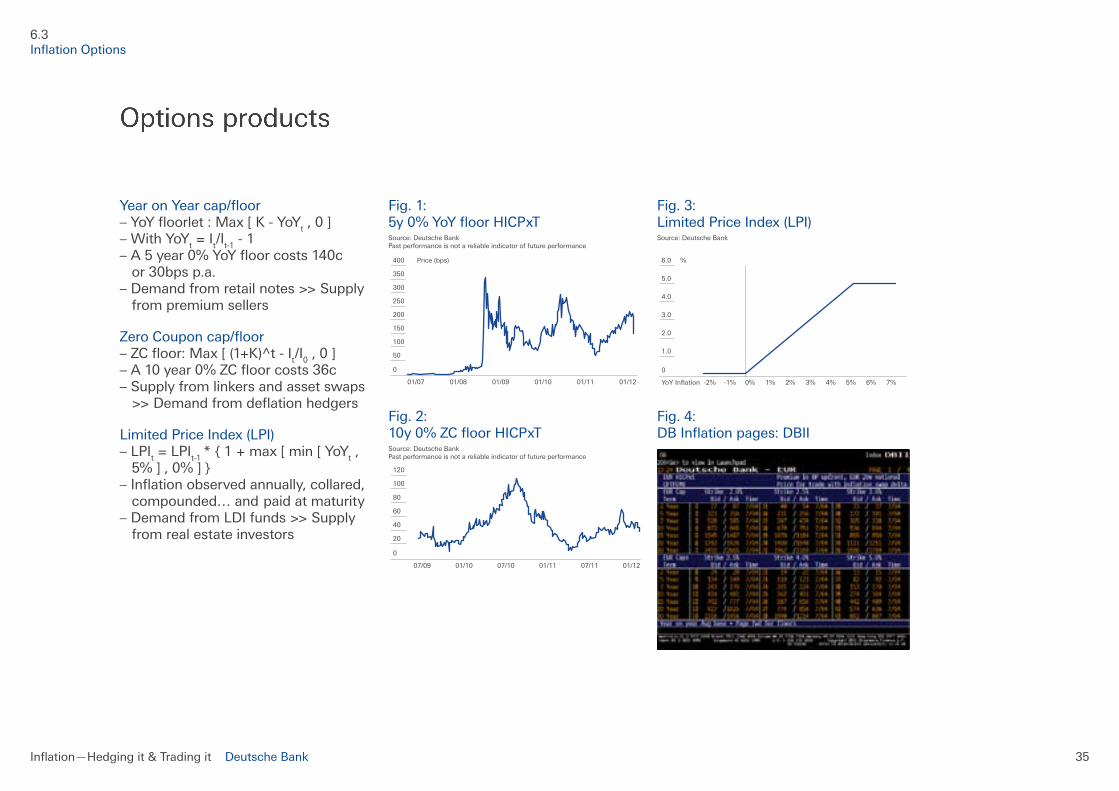
YearonYearcap/floor –YoYfloorlet:Max[K-YoYt,0] –WithYoYt=It/It-1-1 –A5year0%YoYfloorcosts140c or 30bps p.a. –Demandfromretailnotes>>Supply frompremiumsellers
ZeroCouponcap/floor –ZCfloor:Max[(1+K)^t-It/I0,0] –A10year0%ZCfloorcosts36c –Supplyfromlinkersandassetswaps >>Demandfromdeflationhedgers
LimitedPriceIndex(LPI) –LPIt=LPIt-1*{1+max[min[YoYt, 5%],0%]} –Inflationobservedannually,collared, compounded…andpaidatmaturity –DemandfromLDIfunds>>Supply fromrealestateinvestors
Fig.1: 5y0%YoYfloorHICPxT Source:DeutscheBank Pastperformanceisnotareliableindicatoroffutureperformance
Fig.2: 10y0%ZCfloorHICPxT Source:DeutscheBank Pastperformanceisnotareliableindicatoroffutureperformance
Fig.3: LimitedPriceIndex(LPI) Source:DeutscheBank
Fig.4: DBInflationpages:DBII
6.3 InflationOptions
07/09 01/10 07/10 01/11 07/11 01/12
40
20
60
80
0
100
120
-2%YoY Inflation -1% 0% 1% 2% 3% 4% 5% 6% 7%
1.0
2.0
0
3.0
4.0
5.0
6.0 %
01/07 01/08 01/09 01/10 01/11 01/12
100
50
150
200
0
250
300
350
400 Price (bps)

Inflation—Hedgingit&Tradingit Deutsche Bank 36
LPICollarsrepresentsagreatinflation-hedging alternative InflationriskforPensionfundsandotherliability-driveninvestorsisbig, 20–30%ofschemerisk.
Breakevensaredeemedexpensive:if,forexample,breakevenis3.7%andtheschemeexpectedinflationof2.8%,hedginglosesvalue(figure1).
What’sthesolution? Coverinflationriskbycreatinganinflationcollar –PayLPI –ReceiveRPI
Experthistoricalperspective MarkusHeider,responsibleforEuropeaninflationresearchatDBGlobalMarketsResearch,providesausefullongtermperspective:thisgraphshowshowthevolatilitywehaveseen in the last three years is nothing compared to the last 200 years. In the longrun,inflationisaveryvolatileentity,whichmeansriskandtherefore,opportunity.
Therelativestabilitywe’veseeninthelast20yearscanveryquicklychange.
Significantriskfactorscurrentlyincludegovernmentswithunsustainabledeficitsandglobalisation;theneedtohedgeinflationriskisbecomingincreasingly relevant.
Fig.1: Assumed Constant Year on Year InflationReturn Source:DeutscheBank
RPIZCSwap 100%LPICollar
Fig.2: Consumerpriceinflation,y/y%,11-yrMA Source:EHNet
UK US
1. USwarofIndependence 2. NapoleonicWarsdeficitmonetised 3. 1stIndustrialRevolution:productivity-leddeflation 4. US Civil War 5. 2ndIndustrialRevolution:productivityrebounds;goldfinds 6. FiscalmonetisationduringWWI 7. GreatDepression 8. FiscalmonetisationduringWWII 9. FiscalmonetisationduringVietnamWar;oilshocks 10.Volckerclampsdownoninflation
6.4 InflationOptions
-2%-3%-4% -1% 0% 1% 2% 3% 4% 5% 6% 7% 8%
-30
40
50
30
20
10
0
-10
-20
Payoff
30y Breakeven3.55%
180017751750 1825 1850 1875 1900 1925 1950 1975 2000
-10
15
10
5
0
-5
2
3
4
5
6
7
8
9
10
1
“The catalyst that makes this trade workisinflationatabove5%–this5%strikeiscurrentlylowerthanspotinflation–achangefromthelastfiveyears” –NicolasTabardel, GlobalHeadofInflationVolatility andExotics

Inflation—Hedgingit&Tradingit Deutsche Bank 37
MarketvsEconomistExpectations UKRPIfutureinflation:themarketin the long term is pricing much moredownsideriskthanupsiderisk.IntheUK,therisksofinflationovershooting are much higher than them undershooting. This is contrary to whatweseeinothermarkets.
InEuropeandtheUS,thereismorebalance; caps are becoming more muchmoreexpensivethanfloors.
Consensus economist predictions indicate that market implied volatility istoohigh;tailsaretoofatandtheskewistoodeep.CapshavenonaturalsupplyinEuropeortheUSsothetailriskisalwaysexpensive(figure1).
InEurope,volatilityistoohigh,tailsaretoofat,andtheskewistoosteep.
Whatdoesthismean? Sellingvolatilitynowisagoodidea.
Theskewwaspricingfloorshigherthancaps;theskewisnowsymmetric(figure2).
Fig.1: Skewpricesfloorshigherthancaps Source:DeutscheBank
SPFprobdistributionfor5yinflforecast MarketImpliedProbabilityfromEURYoYcaps/floors 1. Deflationriskisoverpriced 2. Consensus economist predictions imply market implied volatility is too high 3. ‘FatTails’
Fig.2: Ratioofmarketimpliedprobabilityvs.EconomistExpectations Source:DeutscheBank
6.4 InflationOptions
0
25
30
35
20
15
10
5
<0 0 - 0.5 1.0 - 1.5 2.0 - 2.5 3.0 - 3.5 >4
%
0
25
20
15
10
5
<0 0 - 0.5 0.5 - 1 1 - 1.5 1.5 - 2
Inflation Print (%)
Value in selling ‘wings’distribution i.e. far out ofthe money caps and floor
2 - 2.5 2.5 - 3 3 - 3.5 3.5 - 4 >4
30
“Tail risk continues to remain overpricedwithbothtailsalmostequallyflat,reflectingthehighuncertaintyovertheinflation/deflationdebate” –NicolasTabardel, GlobalHeadofInflationVolatility&Exotics
Inflation—Hedgingit&Tradingit Deutsche Bank 38
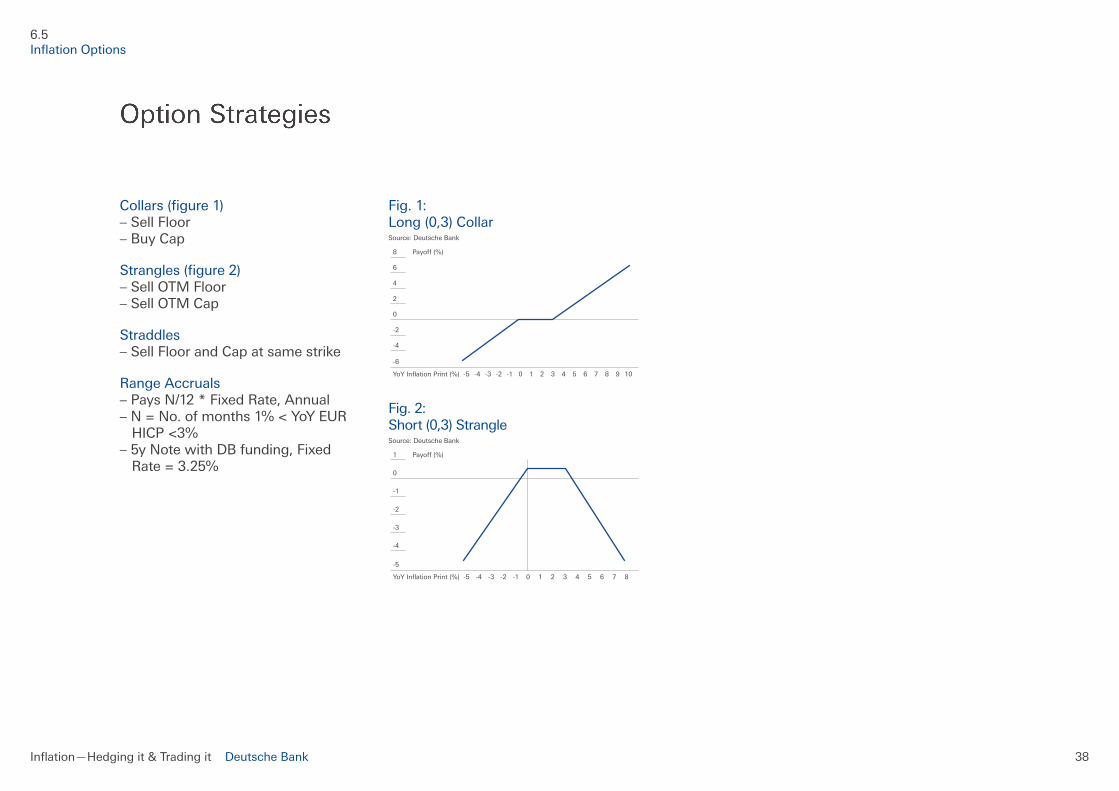
Collars(figure1) –SellFloor –BuyCap
Strangles(figure2) –SellOTMFloor –SellOTMCap
Straddles –SellFloorandCapatsamestrike
Range Accruals –PaysN/12*FixedRate,Annual –N=No.ofmonths1%<YoYEUR HICP<3% –5yNotewithDBfunding,Fixed Rate=3.25%
Fig.1: Long(0,3)Collar Source:DeutscheBank
Fig.2: Short(0,3)Strangle Source:DeutscheBank
6.5 InflationOptions
-6
8
6
4
2
0
-2
-4
-5 -3 -2-4 -1 1 20 3 654 7 8 9 10
Payoff (%)
YoY Inflation Print (%)
-5
1
0
-1
-2
-3
-4
-5 -3 -2-4 -1 1 20 3 654 7 8
Payoff (%)
YoY Inflation Print (%)
Inflation—Hedgingit&Tradingit Deutsche Bank 39
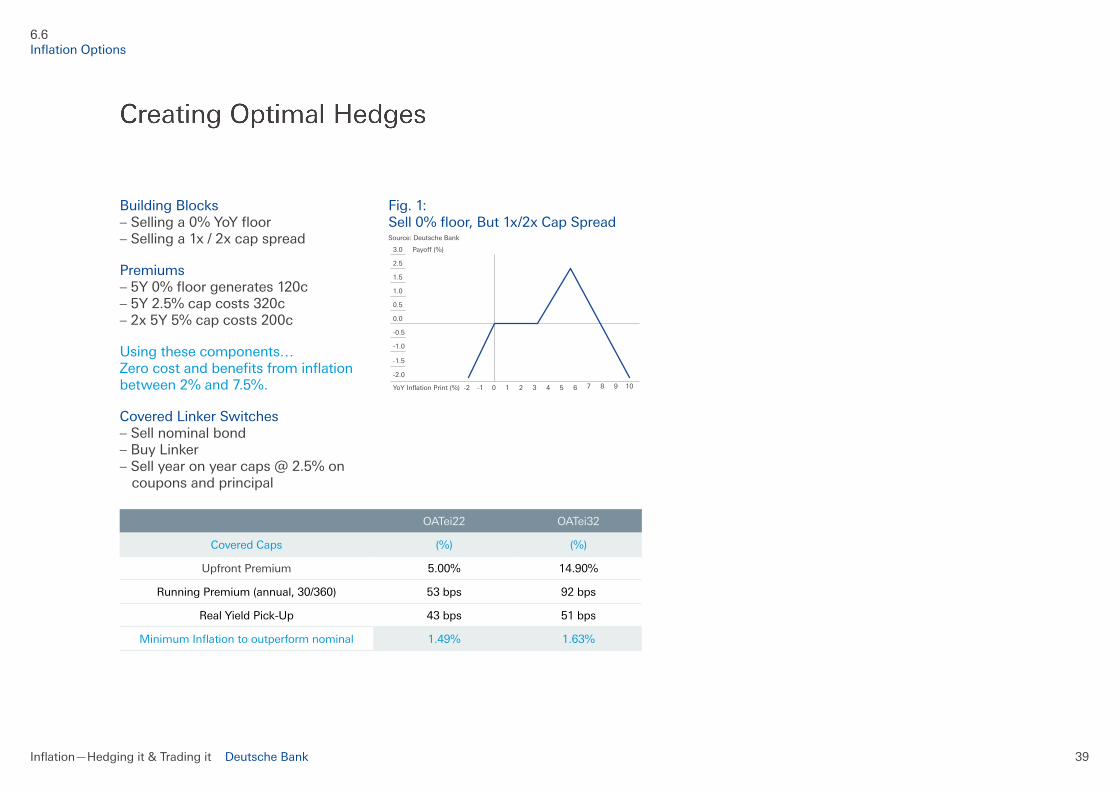
Building Blocks –Sellinga0%YoYfloor –Sellinga1x/2xcapspread
Premiums –5Y0%floorgenerates120c –5Y2.5%capcosts320c –2x5Y5%capcosts200c
Usingthesecomponents… Zerocostandbenefitsfrominflationbetween2%and7.5%.
CoveredLinkerSwitches –Sellnominalbond –BuyLinker –Sellyearonyearcaps@2.5%on coupons and principal
OATei22 OATei32
Covered Caps (%) (%)
UpfrontPremium 5.00% 14.90%
RunningPremium(annual,30/360) 53 bps 92 bps
RealYieldPick-Up 43 bps 51 bps
MinimumInflationtooutperformnominal 1.49% 1.63%
Fig.1: Sell0%floor,But1x/2xCapSpread Source:DeutscheBank
6.6 InflationOptions
-1.5
3.0
1.5
2.5
1.0
-2.0
0.5
0.0
-0.5
-1.0
-2 -1 1 20 3 654 7 8 9 10
Payoff (%)
YoY Inflation Print (%)

7DeflationTailRisk
DeflationTailRisk:DB5YearNote
Inflation—Hedgingit&Tradingit Deutsche Bank 41
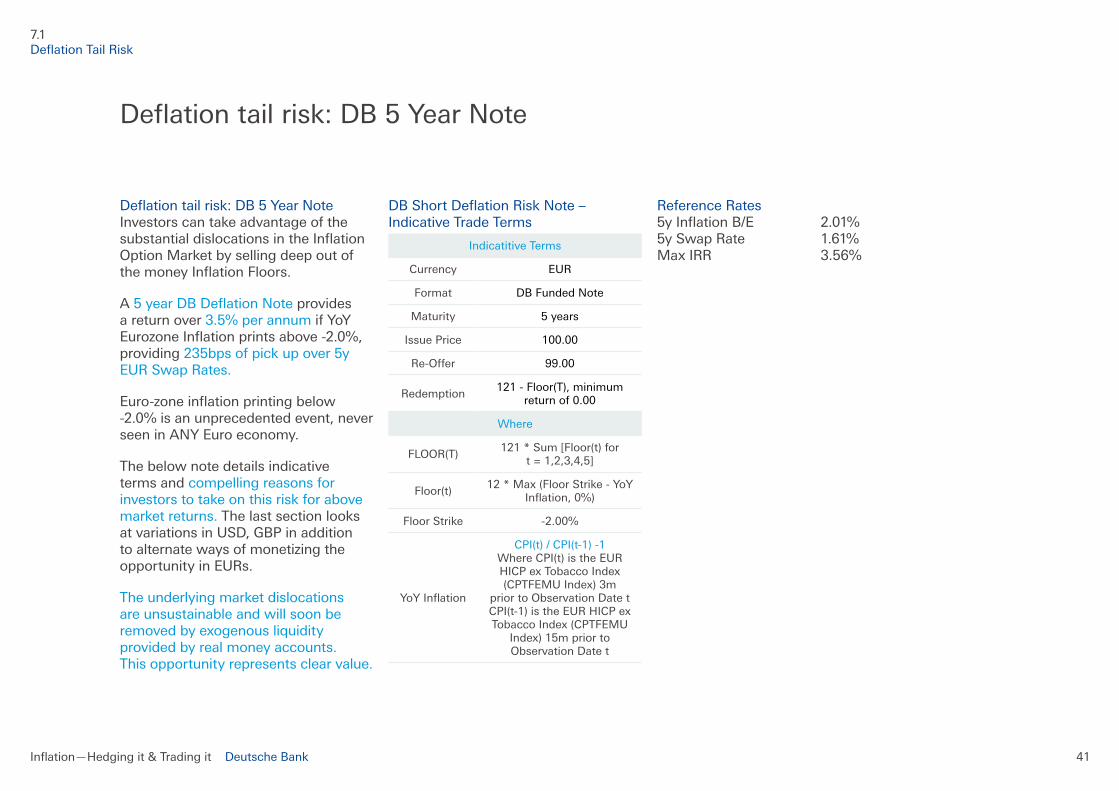
Deflationtailrisk:DB5YearNote InvestorscantakeadvantageofthesubstantialdislocationsintheInflationOptionMarketbysellingdeepoutofthemoneyInflationFloors.
A 5yearDBDeflationNote provides a return over 3.5%perannumifYoYEurozoneInflationprintsabove-2.0%,providing 235bpsofpickupover5yEURSwapRates.
Euro-zoneinflationprintingbelow-2.0%isanunprecedentedevent,neverseeninANYEuroeconomy.
Thebelownotedetailsindicativeterms and compellingreasonsforinvestorstotakeonthisriskforabovemarket returns. The last section looks atvariationsinUSD,GBPinadditiontoalternatewaysofmonetizingtheopportunityinEURs.
The underlying market dislocations areunsustainableandwillsoonberemovedbyexogenousliquidityprovided by real money accounts. This opportunity represents clear value.
DBShortDeflationRiskNote–Indicative Trade Terms
Indicatitive Terms
Currency EUR
Format DBFundedNote
Maturity 5 years
IssuePrice 100.00
Re-Offer 99.00
Redemption121-Floor(T),minimum
returnof0.00
Where
FLOOR(T)121*Sum[Floor(t)for
t=1,2,3,4,5]
Floor(t)12*Max(FloorStrike-YoY
Inflation,0%)
FloorStrike -2.00%
YoYInflation
CPI(t)/CPI(t-1)-1 WhereCPI(t)istheEURHICPexTobaccoIndex(CPTFEMUIndex)3m
prior to Observation Date t CPI(t-1)istheEURHICPexTobaccoIndex(CPTFEMU
Index)15mpriortoObservation Date t
ReferenceRates 5yInflationB/E 2.01% 5ySwapRate 1.61% MaxIRR 3.56%
7.1 DeflationTailRisk
Deflationtailrisk:DB5YearNote

8CaseStudy:Zero-CouponOptionTrade
Inflation—Hedgingit&Tradingit Deutsche Bank 43
Duringthefirstsixmonthsof2010,aToronto-basedinsurerpurchaseddeflationprotectionworth$21.539billioninnotional,paying$173.7millioninpremium.The10-yearzero-coupon0%optionsweredenominatedindollars,eurosandsterling,andwereexecuted by Deutsche Bank and Citi.
TheothersideofthetradewaslargelytakenbyCalifornia-basedfixed-incomemanagerPimco,whichreportedithadsoldmorethan$8billionof10-yearzero-coupon0%inflationfloorsinafilingdatedAugust27.Thefloorsweresoldinreturnformorethan$70millioninpremium,withDeutscheandCitiascounterparties.
Thetransactionmadeperfectsenseforbothparticipants.Fortheinsurer,the0%floorsactedasahedgeagainstdeflationandtheimpactthatwouldhaveonitsequityportfolio.Atthesametime,Pimcowasabletocashinon0%inflationfloorsembeddedinitssizableportfolioofTreasuryinflation-protectedsecurities(Tips).Dealerssaythe headlines generated by the trade hadapositiveimpactonthemarket,encouraging other clients to express
theirviewsonthedirectionofinflationbybuyingorsellingzero-couponoptions.
DaraghMcDevitt,DBGlobalHeadofInflationStructuringsaid,“Itsparkedinterest because you have very intelligentinvestorsonbothsideswhoaretakingoppositesidesofthetrade.”
SinceQ2,2010,quantitativeeasinghas encouraged more clients to sell impliedinflationvolatilityatlevelsthatlookexpensive.Inparticular,manymarket players have looked to play inflationvolatilityversusinterestratevolatility–forexample,bybuyinginterestratecapsandsellinginflationcaps at similar strikes. “We’ve seen a lotofclientscominginonthesamesideasPimco,viewingtheprobabilityofdeflationpricedinbytheseoptionstobeinflated.Theyareeithersellingthe options embedded in their bond portfolios,sellingtheoptionsoutrightorenteringintosomekindofinterestrateoptionsstrategy,”saysMcDevitt.
Thetransactionmadeperfectsenseforbothparticipants.Fortheinsurer,the0%floorsactedasahedgeagainstdeflationandtheimpactthatwouldhaveonitsequityportfolio.Atthesametime,Pimcowasabletocashinon0%inflationfloorsembeddedinitssizableportfolioofTreasuryinflation-protected securities.
8.1 Case Study
CaseStudy:Zero-CouponOptionTrade

Inflation—Hedgingit&Tradingit Deutsche Bank 44
9FurtherReading
Inflation—Hedgingit&Tradingit Deutsche Bank 45
InflationHedgingforInstitutionalInvestors Examiningdynamicassetallocationstrategiesforhighinflationscenariosandtheeffectoffinancialmarketchangesoninflationhedginginstruments.
WeeklyInflationResearchupdate
ResearchInflationMarketsGuide
InflationBigPictureStudy
Pleasegotogm.db.com/inflationformoreinformation.
9.1 FurtherReading
FurtherReading
Examining dynamic asset allocation
strategies for high inflation scenarios and
the effect of financial market changes on
inflation hedging instruments
INFLATION HEDGING FOR
INSTITUTIONAL INVESTORS
PU
BL
ISH
ED
BY
ALSO SPONSORED BY
MEDIA PARTNERS
JUNE | 2011
CLEAR PATH ANALYSIS IN PARTNERSHIP WITH
Global
7 October 2011
DB Inflation Report
Weekly Inflation Update
Deutsche Bank AG/London
All prices are those current at the end of the previous trading session unless otherwise indicated. Prices are sourced from local exchanges via Reuters, Bloomberg and other vendors. Data is sourced from Deutsche Bank and subject companies. Deutsche Bank does and seeks to do business with companies covered in its research reports. Thus, investors should be aware that the firm may have a conflict of interest that could affect the objectivity of this report. Investors should consider this report as only a single factor in making their investment decision. DISCLOSURES AND ANALYST CERTIFICATIONS ARE LOCATED IN APPENDIX 1. MICA(P) 146/04/2011.
Strategy Update
Change in breakevens, US & UK
-10
-5
0
5
10
15
20
25
30
2y 5y 10y 30y 2y 5y 10y 30y
1W change in BEI
carry adjusted
GBP USD
Change in breakevens, EUR & FRF
-10
-5
0
5
10
15
20
2y 5y 10y 30y 2y 5y 10y 20y
1W change in BEI
carry adjusted
EUR FRF
ILB rich/cheap vs nominals
-20
0
20
40
60
80
100
120
2012 2017 2023 2028 2034 2039 2045
GBP DEM
USD FRF
ITL
Rich (-) / cheap (+) vs nominal curve
Source: Deutsche Bank
Upcoming data
Mkt Indicator Date, GMT
FRF CPI Sep 12 Oct, 05:30
DEM CPI Sep 13 Oct, 06:00
EUR HICP Sep 14 Oct, 09:00
Research Team
Markus Heider (+44) 20 754-52167 [email protected]
Alex Li (1) 212 250-5483 [email protected]
Vanshree Verma (+44) 20 754-77583 [email protected]
Mac
ro
Glo
bal
Mar
kets
Res
earc
h
Economics: This week’s PPI data point to further upward pressure on UK and euro area consumer core inflation in the coming months. Business survey price balances have continued to fall in September however, which is consistent with the view that CPI inflation will slow in 2012.
Global: 10y EUR real rates look too high relative to USD against the recent data divergence. We prefer long-end TIPS and UKTi B/Es over OATei.
EUR: The ongoing deterioration in economic data remains challenging for B/Es. In RV, we prefer the 10y sector and the DBRei-20 in particular.
GBP: While real yield valuations are challenging, the scheduled new 50y linker issue should look attractive relative to nominal gilts (in B/E and ASW), RPI swaps and B/Es in other markets.
USD: Forward TIPS B/Es have diverged from survey-based measures of inflation expectations, although declines may be exaggerated by liquidity factors.
AUD: In our view, the market is underpricing inflation risk over the short term, with the gap between RBA inflation expectations and breakevens extremely wide. Our preferred trade is long the belly in 2y/5y/10y ZCS B/E butterfly.
Asia: Inflation in Thailand & South Korea fell more than expected in September, supporting our expectations of no policy rate change at the next CB meeting.
Inflation Markets Bond Yld BEI 1M fwd ASW ASW
discnt ZC Rate Sprd
ZC-BEICPI/RPI
fcst
US CPI
TII Apr-16 -0.65 1.53 1.51 -18 14 5y 1.87 34 spot 3.8
TII Jan-21 0.05 1.83 1.82 13 31 10y 2.30 48 Dec-11 2.9
TII Feb-41 0.90 2.02 2.02 76 54 30y 2.54 52 Jun-12 1.7
EA HICPxt
DBRei 16 -0.22 1.24 1.16 -65 20 5y 1.69 45 spot 2.5
DBRei 20 0.31 1.40 1.36 -48 26 10y 1.84 44 Dec-11 2.7
OATei 40 1.44 2.07 2.06 109 39 30y 2.11 4 Jun-12 1.8
FR CPIxt
BTANi-16 0.23 1.52 1.47 21 39 5y 1.88 36 spot 2.2
OATi-19 0.68 1.68 1.65 37 35 10y 2.07 39 Dec-11 2.1
OATi-29 1.29 2.10 2.09 98 37 20y 2.18 7 Jun-12 1.5
UK RPI
UKTi-16 -1.52 2.86 2.76 -31 15 5y 3.11 26 spot 5.2
UKTi-22 -0.37 2.80 2.76 9 32 10y 3.21 41 Dec-11 5.0
UKTi-40 0.18 3.15 3.14 44 33 30y 3.50 35 Jun-12 3.7Source: Deutsche Bank
Global
1 March 2011
Global Macro Issues Issues in Inflation
Deutsche Bank AG/London
All prices are those current at the end of the previous trading session unless otherwise indicated. Prices are sourced from local exchanges via Reuters, Bloomberg and other vendors. Data is sourced from Deutsche Bank and subject companies. Deutsche Bank does and seeks to do business with companies covered in its research reports. Thus, investors should be aware that the firm may have a conflict of interest that could affect the objectivity of this report. Investors should consider this report as only a single factor in making their investment decision. DISCLOSURES AND ANALYST CERTIFICATIONS ARE LOCATED IN APPENDIX 1. MICA(P) 007/05/2010
Economics
Research Team
Markus Heider (+44) 20 754-52167 [email protected]
Mac
ro
Glo
bal
Mar
kets
Res
earc
h
Eco
no
mic
s
Abstract
The uncertainty about the longer-term inflation outlook has risen substantially since the onset of the financial crisis in 2008. After 15 years or more of low and stable inflation, professional forecasters, investors and indeed central banks themselves now consider below and above target outcomes as possible, even probable. The non-standard reaction of economic policy during the crisis, the discussion about potential changes to monetary policy objectives, the run-up in public debt, but also apparent changes to the inflation process itself during the Great Moderation as well as the open inflation implications of structural trends like globalisation all have contributed to the rise in uncertainty. In this note we look at some of the main issues surrounding the inflation outlook and conclude that inflation risks for the coming years seem to be skewed to the upside of central bank targets.
March 2011
Global Inflation Markets
A guideMarkus [email protected]
All prices are those current at the end of the previous trading session unless otherwise indicated. Prices are sourced from local exchanges i R t Bl b d th d D t i d f D t h B k d bj t i D t h B k d d kvia Reuters, Bloomberg and other vendors. Data is sourced from Deutsche Bank and subject companies. Deutsche Bank does and seeks
to do business with companies covered in its research reports. Thus, investors should be aware that the firm may have a conflict of interest that could affect the objectivity of this report. Investors should consider this report as only a single factor in making their investment decision. DISCLOSURES AND ANALYST CERTIFICATIONS ARE LOCATED IN APPENDIX 1. MICA(P) 007/05/2010

10Contacts
Inflation—Hedgingit&Tradingit Deutsche Bank 47
Sales
Haroon Sana [email protected] +442075473671
MatthewYencken [email protected] +31282582010
Michael Durr [email protected] +442075473671
MatthewBlackwell [email protected] +6568831620
EdRubin [email protected] +12122500551
Tai-ZhongJiang(Tai-Chu) [email protected] +81351566186
Structuring
Daragh McDevitt [email protected] +442075452750
XavierAvila [email protected] +442075472731
Research
Markus Heider [email protected] +44207542167
AlexLi [email protected] +12122505483
Trading
Stephane Salas [email protected] +442075478809
AllanLevin [email protected] +12122507105
Katsuya Miyoshi [email protected] +81351566205
LionelArbey [email protected] +442075454941
Vaughan Harvey [email protected] +61282581848
Integratedsales,trading,structuring and research Unlikesomeofourcompetitors,DeutscheBank’sinflationsales,trading,structuringandresearchprofessionalsworkcloselytogether,combiningstrategicandtechnicalexpertisewiththemacro-economicinsightssoimportantwiththisoffering.
10.1 Contacts
Contacts–DeutscheBankGlobalInflationTeam

ThisdocumentisintendedfordiscussionpurposesonlyanddoesnotcreateanylegallybindingobligationsonthepartofDeutscheBankAGand/oritsaffiliates(“DB”).Withoutlimitation,thisdocumentdoesnotconstituteanoffer,aninvitationtoofferorarecommendationtoenterintoanytransaction.Whenmakinganinvestmentdecision,youshouldrelysolelyonthefinaldocumentationrelatingtothetransactionandnotthesummarycontainedherein.DBisnotactingasyourfinancialadviserorinanyotherfiduciarycapacitywithrespecttothisproposedtransaction.Thetransaction(s)orproducts(s)mentionedhereinmaynotbeappropriateforallinvestorsandbeforeenteringintoanytransactionyoushouldtakestepstoensurethatyoufullyunderstandthetransactionandhavemadeanindependentassessmentoftheappropriatenessofthetransactioninthelightofyourownobjectivesandcircumstances,includingthepossiblerisksandbenefitsofenteringintosuchtransaction.Forgeneralinformationregardingthenatureandrisksoftheproposedtransactionandtypesoffinancialinstrumentspleasegotohttp://www.globalmarkets.db.com/riskdisclosureswww.globalmarkets.db.com/riskdisclosures.Youshouldalsoconsiderseekingadvicefromyourownadvisersinmakingthisassessment.IfyoudecidetoenterintoatransactionwithDB,youdosoinrelianceonyourownjudgment.Theinformationcontainedinthisdocumentisbasedonmaterialwebelievetobereliable;however,wedonotrepresentthatitisaccurate,current,complete,orerrorfree.Assumptions,estimatesandopinionscontainedinthisdocumentconstituteourjudgmentasofthedateofthedocumentandaresubjecttochangewithoutnotice.Anyprojectionsarebasedonanumberofassumptionsastomarketconditionsandtherecanbenoguaranteethatanyprojectedresultswillbeachieved.Pastperformanceisnotaguaranteeoffutureresults.ThismaterialwaspreparedbyaSalesorTradingfunctionwithinDB,andwasnotproduced,reviewedoreditedbytheResearchDepartment.AnyopinionsexpressedhereinmaydifferfromtheopinionsexpressedbyotherDBdepartmentsincludingtheResearchDepartment.SalesandTradingfunctionsaresubjecttoadditionalpotentialconflictsofinterestwhichtheResearchDepartmentdoesnotface.DBmayengageintransactionsinamannerinconsistentwiththeviewsdiscussedherein.DBtradesormaytradeasprincipalintheinstruments(orrelatedderivatives),andmayhaveproprietarypositionsintheinstruments(orrelatedderivatives)discussedherein.DBmaymakeamarketintheinstruments(orrelatedderivatives)discussedherein.SalesandTradingpersonnelarecompensatedinpartbasedonthevolumeoftransactionseffectedbythem.Thedistributionofthisdocumentandavailabilityoftheseproductsandservicesincertainjurisdictionsmayberestrictedbylaw.Youmaynotdistributethisdocument,inwholeorinpart,withoutourexpresswrittenpermission.DBSPECIFICALLYDISCLAIMSALLLIABILITYFORANYDIRECT,INDIRECT,CONSEQUENTIALOROTHERLOSSESORDAMAGESINCLUDINGLOSSOFPROFITSINCURREDBYYOUORANYTHIRDPARTYTHATMAYARISEFROMANYRELIANCEONTHISDOCUMENTORFORTHERELIABILITY,ACCURACY,COMPLETENESSORTIMELINESSTHEREOF.DBisauthorisedunderGermanBankingLaw(competentauthority:BaFin-FederalFinancialSupervisingAuthority)andregulatedbytheFinancialServicesAuthorityfortheconductofUKbusiness.Thisdocumentisintendedfordiscussionpurposesonly.Youmaynotdistributethisdocument,inwholeorinpart,withoutexpresswrittenpermission.Withoutlimitation,thisdocumentdoesnotconstituteanoffer,aninvitationtoofferorarecommendationtoenterintoanytransaction.Theinformationcontainedinthisdocumentisbasedonmaterialwebelievetobereliable;however,wedonotrepresentthatitisaccurate,current,complete,orerrorfree.Assumptions,estimatesandopinionscontainedinthisdocumentconstituteourjudgmentasofthedateofthedocumentandaresubjecttochangewithoutnotice.Anyprojectionsarebasedonanumberofassumptionsastomarketconditionsandtherecanbenoguaranteethatanyprojectedresultswillbeachieved.Pastperformanceisnotaguaranteeoffutureresults.TheservicesdescribedinthisdocumentareprovidedbyDeutscheBankAGorbyitssubsidiariesand/oraffiliatesinaccordancewithappropriatelocallegislationandregulation.DeutscheBankSecuritiesInc.,asubsidiaryofDeutscheBankAG,conductsinvestmentbankingandsecuritiesactivitiesintheUnitedStates.DeutscheBankSecuritiesInc.isamemberofNYSE,FINRAandSIPC.Investmentsaresubjecttoinvestmentrisk,includingmarketfluctuations,regulatorychange,counterpartyrisk,possibledelaysinrepaymentandlossofincomeandprincipalinvested.Thevalueofinvestmentcanfallaswellasriseandyoumightnotgetbacktheamountoriginallyinvestedatanypointintime.©CopyrightDeutscheBankAG2012