inflation report - sama.gov.sa en... · of the wholesale price index went up by 0.4 percent,...
TRANSCRIPT

8102
Inflation Report First Quarter of 8102
Research and International Affairs Deputyship
Economic Research Department

2
Table of Contents
Section Page No.
Cost of Living Index 3
Developments in Q1 2018 3
Influence of Major Sections on the General Cost of Living Index 3
Wholesale Price Indices 5
Wholesale Price Indices by Section 6
GDP Deflator 6
Foreign Trade with Major Trading Partners 9
Inflation Projections for Q2 2018 9
Conclusion 10

3
In contrast, clothing and footwear
recorded a y/y decline of 7.8 percent, fol-
lowed by recreation and culture with a y/y
decline of 0.5 percent (Table 1 and Charts 2
and 3).
Influence of Major Sections on the Gen-
eral Cost of Living Index
Inflation rates are affected by the
changes in the index’s various sections.
Classified by their influence rates on the
general cost of living index, food and bev-
erages ranked first with 30.1 percent during
Q1 2018 against 40.5 percent in Q1 2017.
Transport came second with 25.6 percent
compared to 19.9 percent in the corre-
sponding quarter of the previous year, fol-
lowed by clothing and footwear with 12.2
percent compared to 10.9 percent, and then
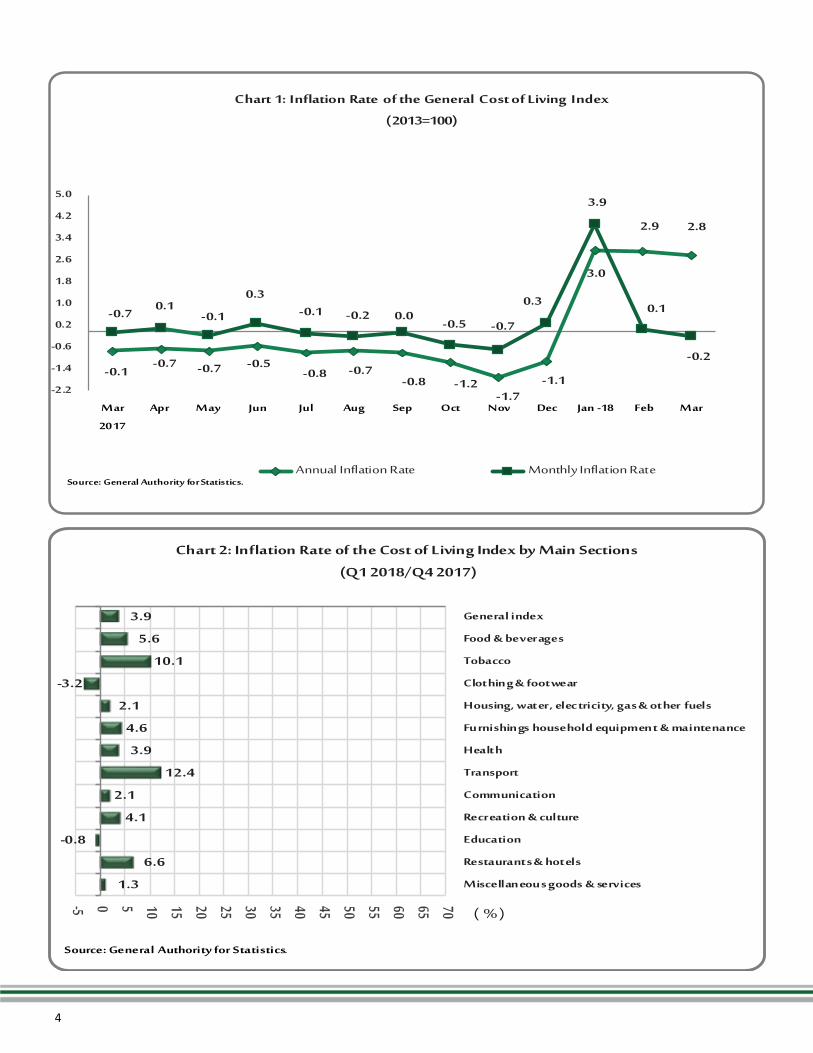
Cost of Living Index
The general level of cost of living
index registered a y/y increase of 2.9 per-
cent in Q1 2018 and a q/q rise of 3.9 per-
cent (Table 1 and Chart 1).
Developments in Q1 2018
During Q1 2018, tobacco registered
the highest y/y inflation rate of 54.4 per-
cent. Transport came next with 10.3 per-
cent, followed by food and beverages as
well as restaurants and hotels with 6.4 per-
cent each; health with 3.7 percent; housing,
water, electricity, gas and other fuels with
1.2 percent; communication with 1.0 per-
cent; furnishings, household equipment and
maintenance with 0.3 percent; and both ed-
ucation and miscellaneous goods and ser-
vices with 0.2 percent each.
Q1 2018/
Q1 2017
Q1 2018/
Q4 2017
Q1
2018
Q4
2017
Q3
2017
Q2
2017
Q1
2017Weights
———————————————————
2.93.9108.0104.0105.0105.0105.0100.0General index
6.45.6105.599.9100.3100.099.118.7Food & beverages
54.410.1192.0174.4174.7141.3124.40.6Tobacco
-7.8-3.293.596.6100.7101.4101.46.2Clothing & footwear
1.22.1113.6111.2111.6112.1112.225.3Housing, water, electricity, gas
& other fuels
0.34.6102.898.3101.6102.3102.58.5Furnishings, household
equipment & maintenance
3.73.9110.3106.1106.2106.2106.32.3Health
10.312.4119.7106.5107.9108.2108.59.9Transport
1.02.1100.898.798.999.299.88.4Communication
-0.54.196.792.995.796.697.13.4Recreation & culture
0.2-0.8109.7110.5109.8109.5109.54.2Education
6.46.6110.2103.4103.7103.6103.66.5Restaurants & hotels
0.21.3103.0101.7102.6102.8102.85.7Miscellaneous goods &
services
TABLE 1: COST OF LIVING INDEX
(2013=100)
Source: General Authority for Statistics.
(%) change
4
-0.7
-0.7 -0.7 -0.5-0.8 -0.7
-0.8 -1.2-1.7
-1.1
3.0
2.9 2.8
-0.1
0.1-0.1
0.3-0.1 -0.2 0.0
-0.5 -0.7
0.3
3.9
0.1
-0.2
-2.2
-1.4
-0.6
0.2
1.0
1.8
2.6
3.4
4.2
5.0
Mar
2017
Apr May Jun Jul Aug Sep Oct Nov Dec Jan -18 Feb Mar
Source: General Authority for Statistics
Chart 1: Inflation Rate of the General Cost of Living Index
(810 =100)
Annual Inflation Rate Monthly Inflation Rate
3.9
5.6
10.1
-3.2
2.1
4.6
3.9
12.4
2.1
4.1
-0.8
6.6
1.3
-5 0 5 10 15 20 25 30 35 40 45 50 55 60 65 70
General index
Food & beverages
Tobacco
Clothing & footwear
Housing, water, electricity, gas & other fuels
Furnishings household equipment & maintenance
Health
Transport
Communication
Recreation & culture
Education
Restaurants & hotels
Miscellaneous goods & services
Source: General Authority for Statistics
%
Chart 2: Inflation Rate of the Cost of Living Index by Main Sections
(Q0 2012/Q 201 )

5
tobacco with 8.2 percent compared to 6.2
percent. Housing, water, electricity, gas,
and other fuels came next with 7.7 percent
against 1.4 percent in Q1 2017.
The total influence rate of the three
major sections (housing, water, electricity,
gas and other fuels; food and beverages;
and transport) stood at 63.4 percent in Q1
2018 against 61.8 percent in Q1 2017
(Charts 4 and 5).
Wholesale Price Index
The wholesale price index in Q1
2018 recorded a y/y rise of 16.5 percent
and a q/q increase of 16.3 percent (Chart 6).
-4.0
-2.0
0.0
2.0
4.0
6.0
8.0
10.0
12.0
-10
-7
-4
-1
2
5
8
11
14
Q1 2017 Q2 2017 Q3 2017 Q4 2017 Q1 2018
(%)
Source: General Authority for Statistics
Chart 3: Quarterly Inflation Rate of the General Cost of Living Index and the
Most Major Sections Affecting It
General index Housing, water, electricity, gas & other fuels
Food & beverages Miscellaneous goods & services
Clothing & footwear Transport
Food & beverages,
40.5
Tobacco, 6.2
Clothing & footwear,
10.9
Housing, water,
electricity, gas & other
fuels, 1.4
Furnishings,
household equipment
& maintenance, 5.3Health, 2.0Transport, 19.9
Communication, 2.2
Recreation & culture,
3.9
Education, 0.6
Restaurants & hotels,
5.6
Miscellaneous goods
& services, 1.5
Chart 5: Percentage Impact Of Major Sections On The General
Inflation Rate (Q1 2017) (%)
Food &
beverages, 30.1
Tobacco, 8.2 Clothing &
footwear, 12.2
Housing, water,
electricity, gas &
other fuels, 7.7
Furnishings,
household
equipment &
maintenance, 0.7
Health, 2.1
Transport, 25.6
Communication,
2.1Recreation &
culture, 0.4Education, 0.2
Restaurants &
hotels, 10.4
Miscellaneous
goods &
services, 0.3
Chart 4: Percentage Impact Of Major Sections On The General
Inflation Rate (Q 12018) (%)

6
Wholesale Price Indices by Sections
During Q1 2018, other goods regis-
tered the highest y/y increase of 33.3 per-
cent. Food products, beverages and tobacco
and textiles came second with a y/y rise of
10.3 percent, followed by metal products,
machinery and equipment with a y/y rise of
6.7 percent. Ores and minerals came next
with a y/y increase of 2.8 percent, followed
by agriculture and fishery with a y/y rise of
0.5 percent (Table 2 and Chart 7).
GDP Deflator
According to the latest data issued by
the GaStat, the GDP deflator recorded a y/y
increase of 6.5 percent in Q4 2017 and a q/
q rise of 1.2 percent.
Unlike the cost of living index which
only measures the final consumption, GDP
deflator measures inflation rate at the mac-
roeconomic level—it targets all consump-
tion, investment and government sectors
Q1 2018/
Q1 2017
Q1 2018/
Q4 2017Q1 2018Q4 2017Q3 2017Q2 2017Q1 2017Weights
16.516.3117.1100.7100.9100.8100.5100.0General Index
0.53.9101.397.5101.6104.3100.88.7Agricuture and fishery products
2.86.598.292.291.392.795.60.6Ores and Minerals
10.35.8108.2102.2103.199.198.117.3Food products,beverages and
tobacco and textiles33.335.8143.9106.0105.9106.7107.933.7Other goods
6.75.8101.896.295.695.795.439.7Metal products, machinery and
TABLE 2: WHOLESALE PRICE INDEX (WPI)(2014=100)
(%) change
Source:General Authority for Statistics.
0.20.3
0.1-0.2
16.3
-0.70.0
0.2 0.4
16.5
-8.0-6.0-4.0-2.00.02.04.06.08.0
10.012.014.016.018.0
Q1 2017 Q2 2017 Q3 2017 Q4 2017 Q1 2018
Chart 6: Inflation of the Wholesale Price
Index (810 =100)
Quarterly Inflation Rate Annual Inflation Rate
Source: General Authority for Statistics

7
based on their respective contributions to
the GDP. Therefore, the deflator is consid-
ered an indirect measure of the change in
the general level of prices. The non-oil
GDP deflator is commonly used to exclude
the impact of change in oil prices on the
domestic economy. It registered a q/q de-
cline of 1.1 percent in Q4 2017, while it
registered a y/y rise of 4.9 percent (Table 3
and chart 8).
4Q* 2017Q3 2017Q2 20171Q 20174Q 2016
——————
GDP (Million Rls):
670,119639,982621,496632,754636,573 At Current Prices
659,754637,335629,309642,329667,661 At Constant Prices
101.6100.498.898.595.3GDP Deflator
1.21.70.33.30.9Quarterly Change (%)
6.56.24.310.49.2Annual Change (%)
Non-oil GDP (Million Rls):
482,391457,497443,369448,891454,132 At Current Prices
375,362352,060348,593367,057370,692 At Constant Prices
128.5129.9127.2122.3122.5Non-oil GDP Deflator
-1.102.174.00-0.18-4.21Quarterly Change (%)
4.91.60.2-3.06.7Annual Change (%)
* Latest Available Data Source: General Authority for Statistics.
TABLE 3: GDP Deflator
(2010=100)
Annual & Monthly Inflation of the WPI% Change (Q1 2018/ Q1 2017)
Source: General Authority for Statistics.
Chart 7: Inflation of the Wholesale Price Index by Main Sections
(2014=100)
16.5
0.5
2.8
10.3
33.3
6.7
General Index
Agricuture and fishery products
Ores and Minerals
Food products,beverages and
tobacco and textiles
Other goods
Metal products, machinery and
equipment
-5.0
0.0
5.0
10.0
15.0
20.0
Jan 2018 Feb 2018 Mar 2018
Monthly Inf lation Rate Annual Inflation Rate

8
An analysis of GDP deflator’s data
(at constant prices for base year 2010) by
economic activity shows that mining and
quarrying registered the highest y/y rise of
6.4 percent in Q4 2017. Manufacturing
came next with 4.0 percent, followed by
electricity, gas and water with 3.7 percent.
However, wholesale and retail trade
and restaurants and hotels recorded a y/y
decline of 0.7 percent in Q4 2017 (Chart 9).
A comparison of the annual inflation
measures in the domestic market indicates
that the annual inflation rate of non-oil
GDP deflator registered a y/y rise of 4.9
percent in Q4 2017. The annual change rate
of the wholesale price index went up by 0.4
percent, whereas the annual inflation rate of
the cost of living index registered a decline
of 1.3 percent during the same period
(Chart 10).
-1.3
0.4
4.9
-2
0
2
4
6
Cost of Living
Index
Wholesale Price
Index
Non-oil GDP
Deflator
SourceGeneral Authority for Statistics
Chart 10: Inflation Measurements in
Q4, 201 Change(% )
0.06.4
6.5
1.14.0
18.5
0.03.7
0.1-0.7
1.50.20.10.50.50.3
3.616.5
6.60.0
6.5
Agriculture , Forestry & Fishing
Mining & Quarrying
a) Crude Oil & Natural Gas
b) Other Mining & Quarrying Activites
Manufacturing
a) Oil Refining
b) Other Industries
Electricity , Gas and Water
Construction
Wholesale & Retail Trade, Restaurants & hotels
Transport , Storage & Communication
Finance , Insurance , Real Estate & Business Services
a) Hausing Ownership
b) Others
Community , Social & Personal Services
Minus Imputed Bank Services Charge
Sub - Total
B. Producers of Government Services
Total Excluding Import Duties
Import Duties
Gross Domestic Product
*Latest Available Data Source: General Authority for Statistics
Chart 9: GDP Deflator by Type of Economic Activity at 8101 Constant Prices
Q 201 */ Q 201 (%) Change
6.7
2.2
0.2
1.6
4.9
-4.2
1.6
4.0
2.2
-1.1
-15
-10
-5
0
5
10
4Q 2016 1Q 2017 Q2 2017 Q3 2017 4Q* 2017
(%)
* Latest Available Data Source: General Authority for Statistics
Chart 8: Quarterly & Annual Changes of the Non-oil GDP
(2010=100)
Annual Change (%) Quarterly Change (%)

9
Foreign Trade with Major Trading Part-
ners
According to data of February 2018
the total value of Saudi Arabia’s imports
stood at SAR 38.8 billion, with a y/y de-
crease of 1.1 percent. Moreover, Saudi Ara-
bia’s imports recorded a monthly decrease
of 0.8 percent compared to the preceding
month.
China came at the top of Saudi Ara-
bia’s major trading partners according to
data of February 2018. Saudi Arabia’s im-
ports from China amounted to SAR 5.80
billion (15.0 percent of the total value of
Saudi Arabia's imports), increasing by 4.1
percent y/y. The UAE came second with
SAR 5.78 billion (14.9 percent of the total),
increasing by 145.3 percent y/y. The United
States came third with SAR 4.58 billion
(11.8 percent of the total), falling by 31.8
percent y/y. Germany came fourth with
SAR 2.0 billion (5.2 percent of the total),
declining by 27.3 percent y/y, followed in
fifth place by Japan with SAR 1.75 billion
(4.5 percent of the total), up by 25.6 per-
cent y/y (Table 4 A and 4 B).
Inflation Projections for Q2 2018
Actual data in Q1 2018 show that in-
flation rate recorded a y/y increase of 2.9
percent. Inflation is projected to rise in Q2
2018 due to the forthcoming month of
Ramadan, Eid al-Fitr and Eid al-Adha,
which would boost consumer demand.
On the other hand, IMF projections
for the primary commodity price index
show a decrease in inflationary pressures
on most of its main sections for 2018. Its
projections show a decline in prices of raw
agricultural materials by 2.7 percent, metal
Change (%)20172016Countries
-0.77479775309China
-14.76629277728U.S.A
11.43186528616U.A.E
-16.52867534331Germany
-28.31993627821Japan
-9.1221564243805Total
-2.145.4146.38Ratio to Total
TABLE 4 A: Top Five Trading Partners by value of Imports
(SAR Million)
Source: General Authority for Statistics.
Change (%)Feb 2018Feb 2017Countries
4.157975571China
145.257822358U.A.E
-31.845826723U.S.A
-27.320012751Germany
25.617451389Japan
5.91990718792Total
7.351.4047.90Ratio to Total
Source: General Authority for Statistics.
TABLE 4 B: Top Five Trading Partners by value of Imports
(SAR Million)

10
prices by 2.0 percent, and energy prices by
1.6 percent. However, IMF projections
show a rise of 2.6 percent in food prices
and 1.0 percent in beverages prices (Table 5).
Conclusion
The most significant results of the
analysis of inflation rates in Q1 2018 in
Saudi Arabia can be concluded as follows:
1. The general cost of living index regis-
tered a y/y increase of 2.9 percent in Q1
2018 and a q/q rise of 3.9 percent.
2. During Q1 2018, tobacco, having the
highest influence on the index, regis-
tered the highest y/y inflation rate of
54.4 percent due to levying excise tax.
In contrast, clothing and footwear rec-
orded the highest y/y deflation of 7.8
percent.
3. The wholesale price index recorded a y/
y rise of 16.5 percent and a q/q rise of
16.3 percent in Q1 2018.
4. Other goods recorded the highest y/y
increase of 33.3 percent in the wholesale
price index.
5. The GDP deflator recorded a y/y in-
crease of 6.5 percent in Q4 2017. In ad-
dition, the non-oil GDP deflator regis-
tered a y/y rise of 4.9 percent in Q4
2017.
6. Inflation is projected to rise in Q2 2018
due to the forthcoming month of Rama-
dan and Eid al-Fitr, which would boost
consumer demand.
2020201920182017201620152014Weights
0.51.2-0.710.8-10.0-35.3-6.2100.0All Primary Commodities
-2.7-0.72.66.12.1-17.2-4.116.7Food
1.03.51.0-9.0-5.0-3.120.71.8Beverages
0.00.2-2.72.3-5.7-13.52.07.7Agricultural Raw Materials
-0.6-0.8-2.016.8-5.4-23.0-10.110.7Metals
2.22.5-1.614.1-16.5-44.8-7.463.1Energy
TABLE 5: IMF Commodity Price Index
Source: IMF
(2005=100)
(Percentage changes)
Projections
—————————————
Actual
——————————
