influence of alkali and alkaline earth metallic species on ... · pdf fileinfluence of alkali...
TRANSCRIPT
PEER-REVIEWED ARTICLE bioresources.com
Liu et al. (2017). “Earth metals in pyrolysis oil,” BioResources 12(1), 1611-1623. 1611
Influence of Alkali and Alkaline Earth Metallic Species on the Phenolic Species of Pyrolysis Oil
Ziyun Liu,a,b Lihong Wang a,b,* Bryan M. Jenkins,c,* Yongjun Li,a,b Weiming Yi,a,b and
Zhihe Li,a,b
Bio-oil as an important renewable energy product has been successfully made from corn stalks and lignin via a fast pyrolysis process. This study investigated the effects of alkali and alkaline earth metallic species (AAEMs) on phenolic products in corn stalk and lignin pyrolysis oil. Corn stalks were demineralized with 0.5 M HCl, and lignin was doped with 0.2wt%, 2wt%, and 20wt% KCl and CaCl2, respectively. The pyrolysis experiments were conducted in a fixed bed tubular furnace ranging from 450 °C to 600 °C. It was found that AAEMs exert positive effects on the formation of char and gas and inhibit the production of bio-oil. The effect of KCl on the product distribution from lignin is somewhat stronger than CaCl2. Moreover, the content of P, HP, GP, and SP decreases after removal of AAEMs. KCl can promote the polymerization of light molecular aromatic hydrocarbons to increase the SP yield at 600 °C, whereas the effect on increase in P and HP content is relatively weaker than CaCl2. KCl and CaCl2 play notable roles in demethxylation and demethoxylation in increasing phenol content and removing the R group from the ring.
Keywords: Phenolic species; AAEMs; Corn stalk; Lignin; Fast pyrolysis; Biomass
Contact information: a: School of Agricultural Engineering and Food Science, Shandong University of
Technology, Zibo, Box 255049, China; b: Shandong Research Center of Engineering and Technology for
Clean Energy, Zibo, Box 255049, China; c: Department of Biological and Agricultural Engineering,
University of California, Davis. *Corresponding authors: [email protected]; [email protected].
INTRODUCTION
With the increasing depletion of fossil fuel resources and the serious threat of
global warming, interest in using environmentally friendly, renewable energy has grown
in recent years. As one of the mostly carbon-neutral, low in sulfur, and low in nitrogen
renewable energy resources, biomass has great prospects of helping to overcome the
challenges mentioned above. Pyrolysis oil (bio-oil), which is obtained by liquefaction of
biomass, has advantages in storage, transport, and increased energy density compared to
more traditional forms of biomass energy. Therefore, significant research has been done
on transformation and utilization technologies for bio-oil (Kawser and Ani 2000; Balat et
al. 2009; Bridgwater 2012; Jeong et al. 2016; Rashid et al. 2016). Bio-oil, which is
abundant in organic compounds such as phenols, can be used in the production of higher
value chemicals. For example, phenolic-rich pyrolysis oil can be used as alternative to
phenol to synthesize phenolic resin (Gao et al. 2012), used in cosmetics as a photo
stabilizer (Andersen et al. 2010; Soltani et al. 2016), and used to synthesize dyes
(Kristanti et al. 2016).
The phenolic compounds in bio-oil are produced primarily by pyrolysis
liquefaction from the lignin component of biomass; phenolics comprise about 20% of the
bio-oil from biomass pyrolysis, while the content is above 55% in lignin pyrolysis oil (Lv
PEER-REVIEWED ARTICLE bioresources.com
Liu et al. (2017). “Earth metals in pyrolysis oil,” BioResources 12(1), 1611-1623. 1612
et al. 2013; Shen et al. 2015; Liu et al. 2016). In addition, it was also reported that the
phenolic compounds are mainly phenol, 4-vinyl phenol, 2-methoxy-4-vinyl phenol, and
2,6-dimethoxy phenol (Ohra-aho et al. 2005; Patwardhan et al. 2011; Zhou et al. 2013).
The high yield of phenolic compounds is attributed to the special structure of lignin—the
three primary monomers (p-coumaryl, coniferyl, and sinapylalcohol) are linked by
carbon–carbon bonds and ether bonds (e.g. β–5 and 5–5), wherein the unsaturated
carbon–carbon bonds are important functional groups that can serve as links in the
polymerization of lignin to produce aromatic hydrocarbon compounds (Saiz-Jimenez and
De Leeuw 1986; Ralph et al. 2004; Zakzeski et al. 2010). As one of the most abundant
terrestrial polymers, lignin accounts for about 20wt% of lignocellulose depending on
feedstock type.
In addition to the three primary structural components of biomass, the presence of
metals (potassium, calcium, sodium, magnesium, etc.) plays significant roles in thermal
conversion of biomass including lignin (Wang et al. 2006; Fahmi et al. 2007; Patwardhan
et al. 2010). To study the catalytic effects of alkali and alkaline earth metals (AAEM)
during pyrolysis, three different methods were used in prior research: (i) based on
different inherent AAEMs contained in different biomass; agricultural residues that
contain higher amount of AAEMs than wood residues produced the lowest liquid yields
and highest water and gas yields (Oasmaa et al. 2010), (ii) removal of AAEMs in
biomass by acid leaching; light oxygenates and non-condensable gas yields were
promoted while char production was inhibited after removing the inherent AAEMs in red
oak and switchgrass using sulphuric acid (Dalluge et al. 2014) and large increases in the
yields of organic pyrolysis oil and pyrolytic sugar were observed for all acetic acid
leached biomasses (pine wood, wheat straw, hay, bagasse, and cellulose) (Oudenhoven et
al. 2015), and (iii) other AAEMs are involved in biomass pyrolysis; TG analysis showed
the char formation increased with increased potassium concentration, and analytical Py-
GC/MS also revealed that potassium catalyzed the formation of C6 and C2C6 lignin
derivatives that result from impregnated HF-demineralized samples with different
concentrations of KCl (Eom et al. 2012). Wood samples that were soaked in sodium and
potassium hydroxides yielded more phenolic compounds upon their pyrolysis; NaOH is
slightly more effective for the production of guaiacol, cresols, and 4-ethylguaicol,
whereas KOH is slightly better for the production of phenol, cis-isoeugenol and
transisoeugenol (Di Blasi et al. 2009). Similar results have been found from Kleen and
Gellerstedt (1995) that sodium, both as an exchanged counter-ion and as added inorganic
salt, does not change the absolute amount of lignin products to any noticeable degree but
has a clear catalytic effect on the distribution pattern of lignin pyrolysis products.
AAEMs exerts effects on the distribution of pyrolysis products and phenolic compounds
of biomass. However, fewer research investigations have been carried out on pyrolysis of
lignin doped with AAEMs. The effect of minerals on the primary pyrolysis product
distribution of lignin (doped with NaCl, KCl, MgCl2, and CaCl2) was investigated, and
no significant differences were observed in the speciation resulting from these samples,
apart from an approximately 1 wt % increase in the char yield (Patwardhan et al. 2011).
The cited authors also found that the yield of alkylated phenols increased with
temperature, whereas the yield of methoxylated phenols reached a maximum at 600 °C
Therefore, temperature is also generally considered to be an important factor in
biomass pyrolysis. Many papers on the fast pyrolysis of biomass are available in the
literature (Patwardhan et al. 2011; Zhou et al. 2013; Song et al. 2015). The trend in
distribution of pyrolysis products is similar when comparing untreated and water (or
PEER-REVIEWED ARTICLE bioresources.com
Liu et al. (2017). “Earth metals in pyrolysis oil,” BioResources 12(1), 1611-1623. 1613
organic acid) washed biomass with increasing temperature. For example at 500 °C to 900
°C, the yield of solid and liquid products decreased while the yield of gaseous products
increased (Song et al. 2015).
The phenolic-form compounds in pyrolysis oil can be used to produce high value-
added chemicals. To investigate how the inherent AAEMs catalyze the generation of
phenolic products, corn stalk was demineralized by HCl and compared with raw
untreated corn stalk. The influence of potassium and calcium in untreated and KCl and
CaCl2 doped lignin pyrolysis was studied, and the distribution of pyrolysis and phenolic
products was compared. Enhanced knowledge of the influence of AAEMs in biomass and
lignin pyrolysis could lead to new process insights for enhanced production of phenolic
products for fuels and chemicals.
EXPERIMENTAL
Materials Representative agricultural residue corn stalks were obtained from Zibo,
Shandong Province, China. The dried corn stalks were milled and pulverized to a particle
size of 300 μm and heated at 105 °C for 24 h to remove moisture.
The lignin component (alkali processed) was purchased from Sigma Corporation
(St. Louis, USA) and used as a commercial sample in the study. Potassium chloride
(powder) and calcium chloride (sheet) were used as substitutes for the inherent potassium
(K) and calcium (Ca) elements in biomass. The chloride salts were ground to 300 μm
before being doped with lignin.
Methods The powdered maize stalk was washed in distilled deionized water at 25 °C with
stirring for 2 h, adding 0.5 M HCl solution to reduce the mineral content. In the
treatment, 1 g of sample was impregnated in 20 mL acid solution. After 2 h, the
demineralized sample was filtered with deionized water until it reached a stable
conductivity, and then it was dried in an oven at 105 °C for 24 h. The treated sample was
sealed in desiccators prior to analysis and investigation. To investigate the effects of
potassium and calcium on lignin pyrolysis, the lignin component was prepared by doping
with alkaline chloride salts. The lignin was doped with 0.2wt%, 2wt%, and 20wt% KCl
(AR 98%) and CaCl2 (AR 95%), respectively. These mixtures were stirred in mechanical
agitation before experiments.
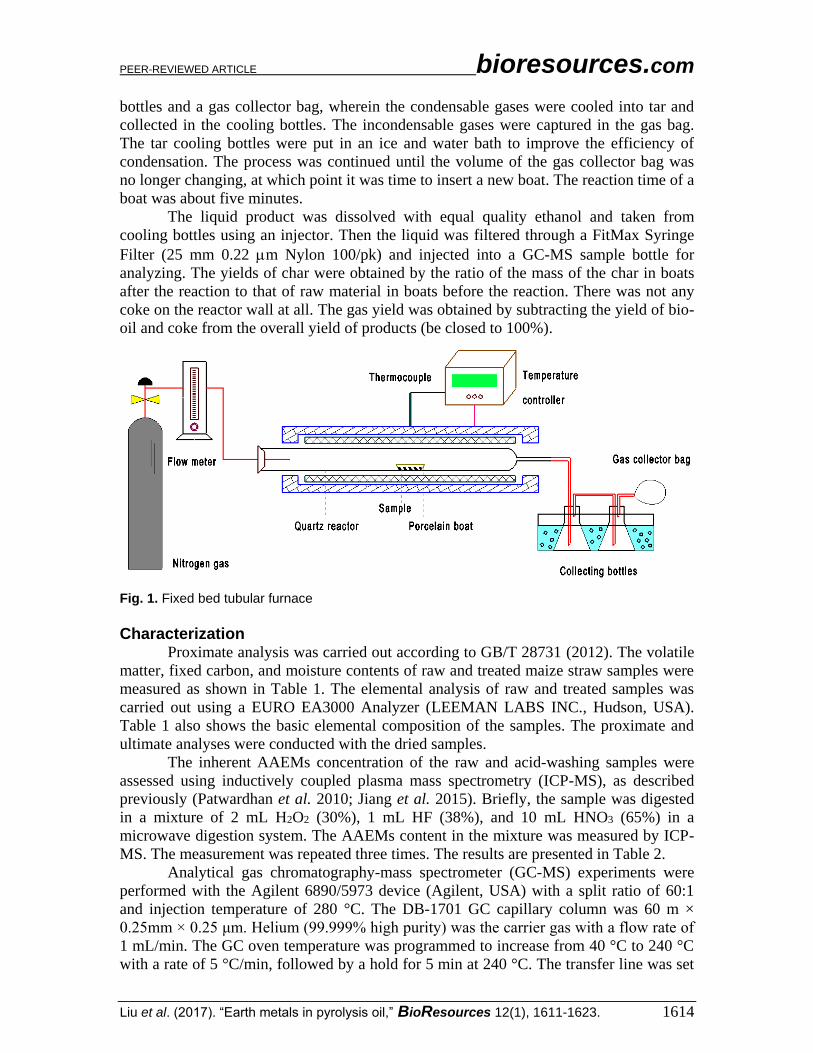
The pyrolysis experiments were conducted in a fixed bed tubular furnace (Fig. 1).
The experimental unit mainly consisted of a tubular reactor (with an inner diameter and
length of 55 mm and 680 mm), a temperature controller, two steps collector bottles, and a
gas collector bag. Nitrogen (purity > 99.999%) was used as a carrier gas and to provide
an oxygen-free atmosphere.
Accurately weighed 2.00 g of samples were put into porcelain boats with
dimensions of 50 mm × 20 mm × 10 mm. Each of the porcelain boats was filled half way.
The furnace was turned on and heated to the desired temperature controlled by the
electrical controller. After the tubular reactor had been filled with nitrogen gas (the flow
rate of 300 mL/min), the feeding side of the tube was opened, and then the sample boat
was rapidly pushed into the heat zone for pyrolysis. The sample was quickly heated in the
furnace with a heating rate of 1000 °C/s. The gas product passed through two cooling
PEER-REVIEWED ARTICLE bioresources.com
Liu et al. (2017). “Earth metals in pyrolysis oil,” BioResources 12(1), 1611-1623. 1614
bottles and a gas collector bag, wherein the condensable gases were cooled into tar and
collected in the cooling bottles. The incondensable gases were captured in the gas bag.
The tar cooling bottles were put in an ice and water bath to improve the efficiency of
condensation. The process was continued until the volume of the gas collector bag was
no longer changing, at which point it was time to insert a new boat. The reaction time of a
boat was about five minutes.
The liquid product was dissolved with equal quality ethanol and taken from
cooling bottles using an injector. Then the liquid was filtered through a FitMax Syringe
Filter (25 mm 0.22 m Nylon 100/pk) and injected into a GC-MS sample bottle for
analyzing. The yields of char were obtained by the ratio of the mass of the char in boats
after the reaction to that of raw material in boats before the reaction. There was not any
coke on the reactor wall at all. The gas yield was obtained by subtracting the yield of bio-
oil and coke from the overall yield of products (be closed to 100%).
Fig. 1. Fixed bed tubular furnace
Characterization Proximate analysis was carried out according to GB/T 28731 (2012). The volatile
matter, fixed carbon, and moisture contents of raw and treated maize straw samples were
measured as shown in Table 1. The elemental analysis of raw and treated samples was
carried out using a EURO EA3000 Analyzer (LEEMAN LABS INC., Hudson, USA).
Table 1 also shows the basic elemental composition of the samples. The proximate and
ultimate analyses were conducted with the dried samples.
The inherent AAEMs concentration of the raw and acid-washing samples were
assessed using inductively coupled plasma mass spectrometry (ICP-MS), as described
previously (Patwardhan et al. 2010; Jiang et al. 2015). Briefly, the sample was digested
in a mixture of 2 mL H2O2 (30%), 1 mL HF (38%), and 10 mL HNO3 (65%) in a
microwave digestion system. The AAEMs content in the mixture was measured by ICP-
MS. The measurement was repeated three times. The results are presented in Table 2.
Analytical gas chromatography-mass spectrometer (GC-MS) experiments were
performed with the Agilent 6890/5973 device (Agilent, USA) with a split ratio of 60:1
and injection temperature of 280 °C. The DB-1701 GC capillary column was 60 m ×
0.25mm × 0.25 μm. Helium (99.999% high purity) was the carrier gas with a flow rate of
1 mL/min. The GC oven temperature was programmed to increase from 40 °C to 240 °C
with a rate of 5 °C/min, followed by a hold for 5 min at 240 °C. The transfer line was set
PEER-REVIEWED ARTICLE bioresources.com
Liu et al. (2017). “Earth metals in pyrolysis oil,” BioResources 12(1), 1611-1623. 1615
at 280 °C, and the MS ion source (Aux) was set at 250 °C with 70 eV electron energy.
Data analysis was performed by comparing the spectra of the components with the
database of known components stored in the GC-MS Nist-05 library. The run time was
45 min.
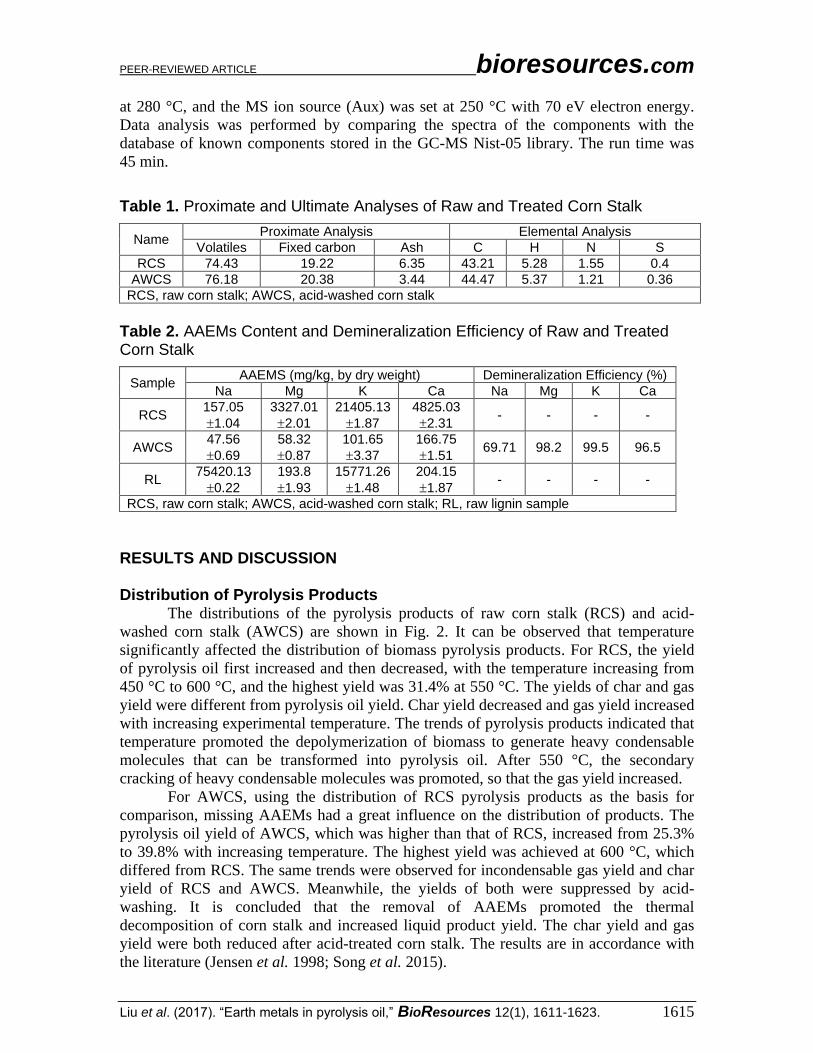
Table 1. Proximate and Ultimate Analyses of Raw and Treated Corn Stalk
Name Proximate Analysis Elemental Analysis
Volatiles Fixed carbon Ash C H N S
RCS 74.43 19.22 6.35 43.21 5.28 1.55 0.4
AWCS 76.18 20.38 3.44 44.47 5.37 1.21 0.36
RCS, raw corn stalk; AWCS, acid-washed corn stalk
Table 2. AAEMs Content and Demineralization Efficiency of Raw and Treated Corn Stalk
Sample AAEMS (mg/kg, by dry weight) Demineralization Efficiency (%)
Na Mg K Ca Na Mg K Ca
RCS 157.05
1.04
3327.01
2.01
21405.13
1.87
4825.03
2.31 - - - -
AWCS 47.56
0.69
58.32
0.87
101.65
3.37
166.75
1.51 69.71 98.2 99.5 96.5
RL 75420.13
0.22
193.8
1.93
15771.26
1.48
204.15
1.87 - - - -
RCS, raw corn stalk; AWCS, acid-washed corn stalk; RL, raw lignin sample
RESULTS AND DISCUSSION
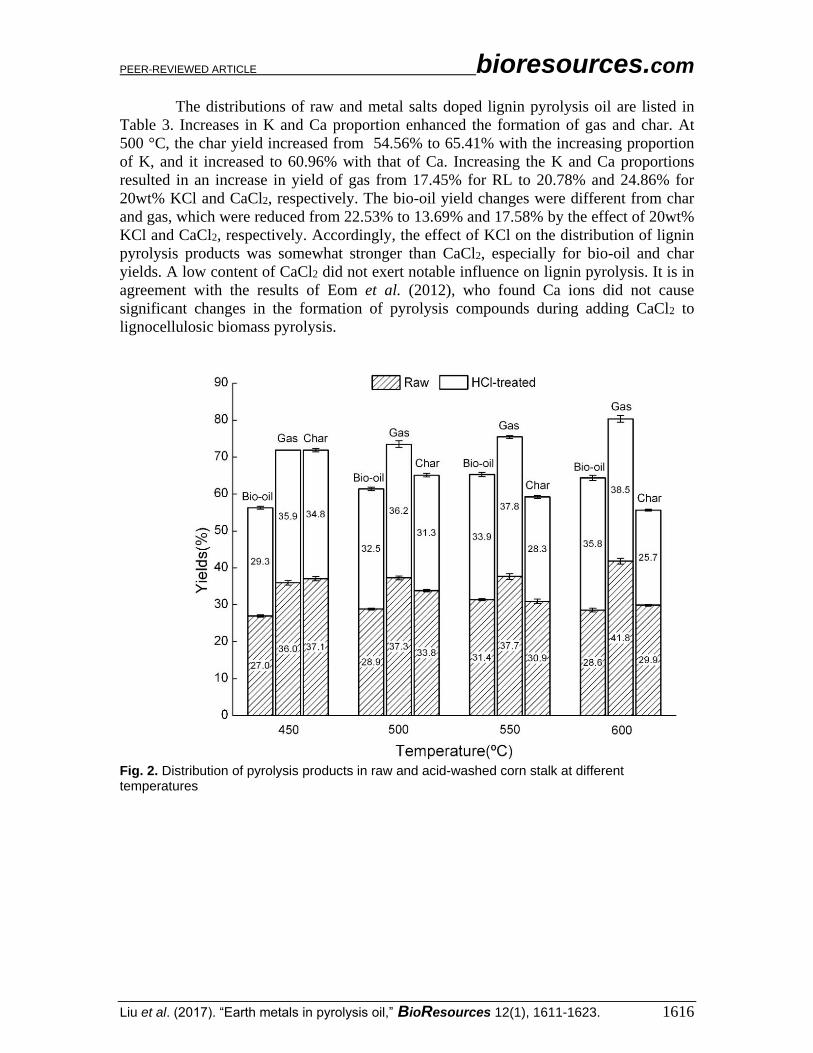
Distribution of Pyrolysis Products The distributions of the pyrolysis products of raw corn stalk (RCS) and acid-
washed corn stalk (AWCS) are shown in Fig. 2. It can be observed that temperature
significantly affected the distribution of biomass pyrolysis products. For RCS, the yield
of pyrolysis oil first increased and then decreased, with the temperature increasing from
450 °C to 600 °C, and the highest yield was 31.4% at 550 °C. The yields of char and gas
yield were different from pyrolysis oil yield. Char yield decreased and gas yield increased
with increasing experimental temperature. The trends of pyrolysis products indicated that
temperature promoted the depolymerization of biomass to generate heavy condensable
molecules that can be transformed into pyrolysis oil. After 550 °C, the secondary
cracking of heavy condensable molecules was promoted, so that the gas yield increased.
For AWCS, using the distribution of RCS pyrolysis products as the basis for
comparison, missing AAEMs had a great influence on the distribution of products. The
pyrolysis oil yield of AWCS, which was higher than that of RCS, increased from 25.3%
to 39.8% with increasing temperature. The highest yield was achieved at 600 °C, which
differed from RCS. The same trends were observed for incondensable gas yield and char
yield of RCS and AWCS. Meanwhile, the yields of both were suppressed by acid-
washing. It is concluded that the removal of AAEMs promoted the thermal
decomposition of corn stalk and increased liquid product yield. The char yield and gas
yield were both reduced after acid-treated corn stalk. The results are in accordance with
the literature (Jensen et al. 1998; Song et al. 2015).
PEER-REVIEWED ARTICLE bioresources.com
Liu et al. (2017). “Earth metals in pyrolysis oil,” BioResources 12(1), 1611-1623. 1616
The distributions of raw and metal salts doped lignin pyrolysis oil are listed in
Table 3. Increases in K and Ca proportion enhanced the formation of gas and char. At
500 °C, the char yield increased from 54.56% to 65.41% with the increasing proportion
of K, and it increased to 60.96% with that of Ca. Increasing the K and Ca proportions
resulted in an increase in yield of gas from 17.45% for RL to 20.78% and 24.86% for
20wt% KCl and CaCl2, respectively. The bio-oil yield changes were different from char
and gas, which were reduced from 22.53% to 13.69% and 17.58% by the effect of 20wt%
KCl and CaCl2, respectively. Accordingly, the effect of KCl on the distribution of lignin
pyrolysis products was somewhat stronger than CaCl2, especially for bio-oil and char
yields. A low content of CaCl2 did not exert notable influence on lignin pyrolysis. It is in
agreement with the results of Eom et al. (2012), who found Ca ions did not cause
significant changes in the formation of pyrolysis compounds during adding CaCl2 to
lignocellulosic biomass pyrolysis.
Fig. 2. Distribution of pyrolysis products in raw and acid-washed corn stalk at different temperatures

PEER-REVIEWED ARTICLE bioresources.com
Liu et al. (2017). “Earth metals in pyrolysis oil,” BioResources 12(1), 1611-1623. 1617
Table 3. Distribution of Raw and Treated Lignin Pyrolysis Products
Temperature Production Yields (%)
Raw 0.2wt%KCl 2wt%KCl 20wt%KCl 0.2wt%CaCl2 2wt%CaCl2 20wt%CaCl2
450 °С
Bio-oil 19.03 16.32 13.67 13.41 18.03 17.32 16.59
Gas 14.42 16.43 18.45 19.14 15.21 15.68 16.64
Char 63.19 65.10 66.04 67.93 63.27 64.24 66.1
Closure 96.64 97.85 98.16 100.48 96.51 97.24 99.33
500 °С
Bio-oil 22.53 19.05 14.22 13.69 19.78 19.22 17.58
Gas 17.45 19.08 21.33 20.78 21.33 22.24 24.86
Char 57.56 61.51 62.65 65.41 57.95 58.01 59.96
Closure 97.54 99.64 98.20 99.88 99.06 99.47 102.4
550 °С
Bio-oil 21.58 19.25 15.41 13.88 19.31 18.49 16.11
Gas 19.34 20.78 22.72 25.12 22.2 23.6 25.14
Char 57.08 58.65 61.43 62.2 57.14 57.22 58.07
Closure 98.00 98.68 99.56 101.2 98.65 99.31 99.32
600 °С
Bio-oil 20.09 17.65 14.93 12.1 17.45 17.05 15.77
Gas 24.46 26.50 29.31 30.33 23.1 24.49 24.68
Char 55.38 56.11 56.97 60.09 56.15 56.44 57.90
Closure 99.93 100.26 101.21 102.52 96.7 97.98 98.35
Catalytic Effects of AAEMs on Yields of Phenolic Products
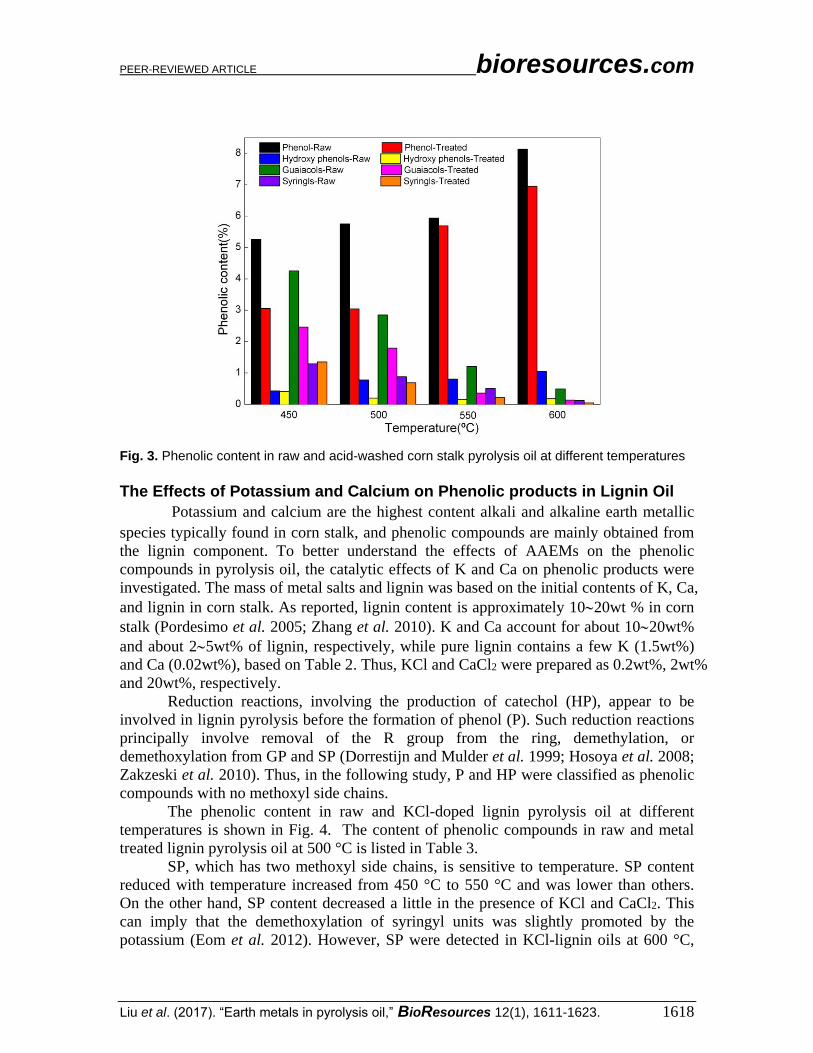
The phenolic compounds obtained from pyrolysis oil can be divided into four
classes of species: P (phenols), HP (hydroxy phenols), GP (guaiacols), and SP (syringls).
Figure 3 presents the catalytic effects of AAEMs on the phenolic content at different
temperatures. As can be seen, the phenolic compounds rich in the bio-oil were mainly P
and GP, whereas the content of HP and SP were relatively low within the range 450 °C to
600 °C.
As shown in Fig. 3, AAEMs had catalytic effects on the phenolic content. The
content of P, HP, and GP was noticeably restrained after the removal of AAEMs, but the
change of SP content was not remarkable. In particular, the effect of AAEMs on the
distribution of phenolic compounds was somewhat stronger when the experimental
temperature was below 550 °C. The possible reason is that AAEMs in comparison to
temperature has the most predominate effect on thermal conversion of phenolic
compounds below 550 °C. Moreover, phenolic production was sensitive to temperature.
The content of P increased with an increase in temperature, while that of GP and SP was
decreased. These interesting phenomena suggested that AAEMs have positive effects on
breaking the intermolecular hydrogen bridges and promoting the transformation of
macromolecules into small aromatic ring phenols in pyrolysis process, as previously
noted (Wang et al. 2006). On the other hand, the increase of phenolic compounds may
have been because inorganic constituents increased at the expense of the lignin content
(Eom et al. 2012).
PEER-REVIEWED ARTICLE bioresources.com
Liu et al. (2017). “Earth metals in pyrolysis oil,” BioResources 12(1), 1611-1623. 1618
Fig. 3. Phenolic content in raw and acid-washed corn stalk pyrolysis oil at different temperatures
The Effects of Potassium and Calcium on Phenolic products in Lignin Oil
Potassium and calcium are the highest content alkali and alkaline earth metallic
species typically found in corn stalk, and phenolic compounds are mainly obtained from
the lignin component. To better understand the effects of AAEMs on the phenolic
compounds in pyrolysis oil, the catalytic effects of K and Ca on phenolic products were
investigated. The mass of metal salts and lignin was based on the initial contents of K, Ca,
and lignin in corn stalk. As reported, lignin content is approximately 1020wt % in corn
stalk (Pordesimo et al. 2005; Zhang et al. 2010). K and Ca account for about 1020wt%
and about 25wt% of lignin, respectively, while pure lignin contains a few K (1.5wt%)
and Ca (0.02wt%), based on Table 2. Thus, KCl and CaCl2 were prepared as 0.2wt%, 2wt%
and 20wt%, respectively.
Reduction reactions, involving the production of catechol (HP), appear to be
involved in lignin pyrolysis before the formation of phenol (P). Such reduction reactions
principally involve removal of the R group from the ring, demethylation, or
demethoxylation from GP and SP (Dorrestijn and Mulder et al. 1999; Hosoya et al. 2008;
Zakzeski et al. 2010). Thus, in the following study, P and HP were classified as phenolic
compounds with no methoxyl side chains.
The phenolic content in raw and KCl-doped lignin pyrolysis oil at different
temperatures is shown in Fig. 4. The content of phenolic compounds in raw and metal
treated lignin pyrolysis oil at 500 °C is listed in Table 3.
SP, which has two methoxyl side chains, is sensitive to temperature. SP content
reduced with temperature increased from 450 °C to 550 °C and was lower than others.
On the other hand, SP content decreased a little in the presence of KCl and CaCl2. This
can imply that the demethoxylation of syringyl units was slightly promoted by the
potassium (Eom et al. 2012). However, SP were detected in KCl-lignin oils at 600 °C,
PEER-REVIEWED ARTICLE bioresources.com
Liu et al. (2017). “Earth metals in pyrolysis oil,” BioResources 12(1), 1611-1623. 1619
which may be due to the fact that KCl promoted polymerization of light molecular
aromatic hydrocarbon in bio-oil.
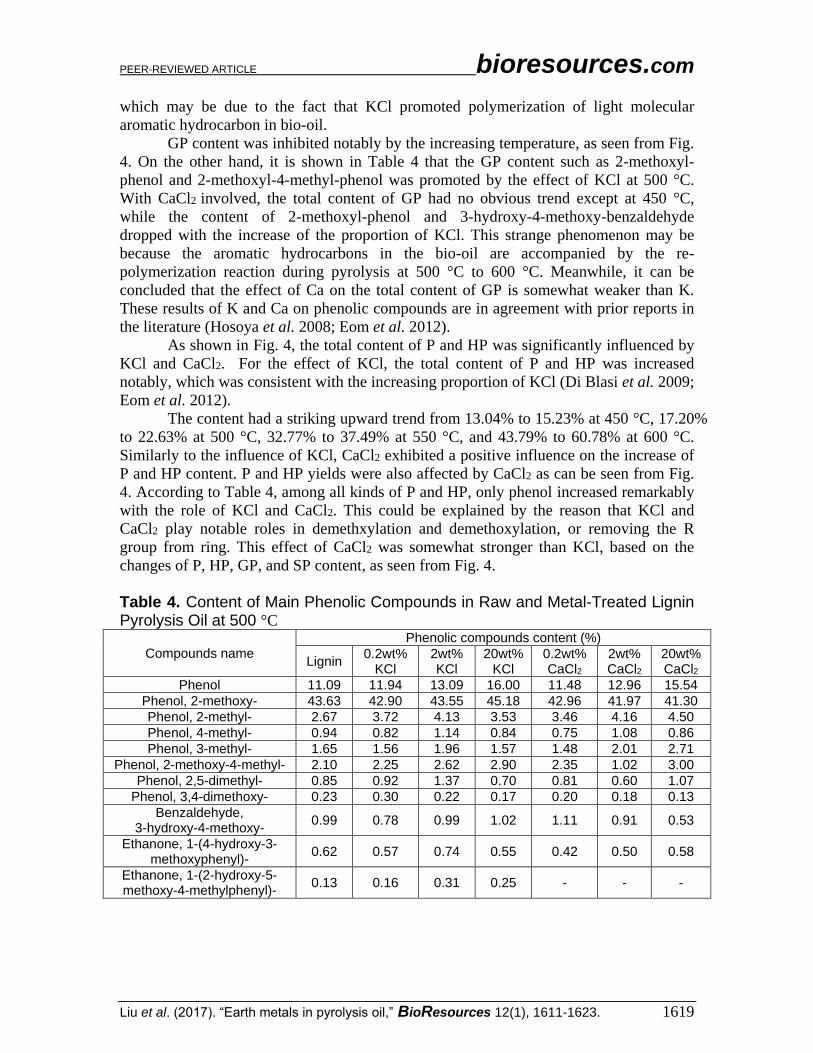
GP content was inhibited notably by the increasing temperature, as seen from Fig.
4. On the other hand, it is shown in Table 4 that the GP content such as 2-methoxyl-
phenol and 2-methoxyl-4-methyl-phenol was promoted by the effect of KCl at 500 °C.
With CaCl2 involved, the total content of GP had no obvious trend except at 450 °C,
while the content of 2-methoxyl-phenol and 3-hydroxy-4-methoxy-benzaldehyde
dropped with the increase of the proportion of KCl. This strange phenomenon may be
because the aromatic hydrocarbons in the bio-oil are accompanied by the re-
polymerization reaction during pyrolysis at 500 °C to 600 °C. Meanwhile, it can be
concluded that the effect of Ca on the total content of GP is somewhat weaker than K.
These results of K and Ca on phenolic compounds are in agreement with prior reports in
the literature (Hosoya et al. 2008; Eom et al. 2012).
As shown in Fig. 4, the total content of P and HP was significantly influenced by
KCl and CaCl2. For the effect of KCl, the total content of P and HP was increased
notably, which was consistent with the increasing proportion of KCl (Di Blasi et al. 2009;
Eom et al. 2012).
The content had a striking upward trend from 13.04% to 15.23% at 450 °C, 17.20%
to 22.63% at 500 °C, 32.77% to 37.49% at 550 °C, and 43.79% to 60.78% at 600 °C.
Similarly to the influence of KCl, CaCl2 exhibited a positive influence on the increase of
P and HP content. P and HP yields were also affected by CaCl2 as can be seen from Fig.
4. According to Table 4, among all kinds of P and HP, only phenol increased remarkably
with the role of KCl and CaCl2. This could be explained by the reason that KCl and
CaCl2 play notable roles in demethxylation and demethoxylation, or removing the R
group from ring. This effect of CaCl2 was somewhat stronger than KCl, based on the
changes of P, HP, GP, and SP content, as seen from Fig. 4.
Table 4. Content of Main Phenolic Compounds in Raw and Metal-Treated Lignin Pyrolysis Oil at 500 °C
Compounds name
Phenolic compounds content (%)
Lignin 0.2wt%
KCl 2wt% KCl
20wt% KCl
0.2wt% CaCl2
2wt% CaCl2
20wt% CaCl2
Phenol 11.09 11.94 13.09 16.00 11.48 12.96 15.54
Phenol, 2-methoxy- 43.63 42.90 43.55 45.18 42.96 41.97 41.30
Phenol, 2-methyl- 2.67 3.72 4.13 3.53 3.46 4.16 4.50
Phenol, 4-methyl- 0.94 0.82 1.14 0.84 0.75 1.08 0.86
Phenol, 3-methyl- 1.65 1.56 1.96 1.57 1.48 2.01 2.71
Phenol, 2-methoxy-4-methyl- 2.10 2.25 2.62 2.90 2.35 1.02 3.00
Phenol, 2,5-dimethyl- 0.85 0.92 1.37 0.70 0.81 0.60 1.07
Phenol, 3,4-dimethoxy- 0.23 0.30 0.22 0.17 0.20 0.18 0.13
Benzaldehyde, 3-hydroxy-4-methoxy-
0.99 0.78 0.99 1.02 1.11 0.91 0.53
Ethanone, 1-(4-hydroxy-3-methoxyphenyl)-
0.62 0.57 0.74 0.55 0.42 0.50 0.58
Ethanone, 1-(2-hydroxy-5-methoxy-4-methylphenyl)-
0.13 0.16 0.31 0.25 - - -

PEER-REVIEWED ARTICLE bioresources.com
Liu et al. (2017). “Earth metals in pyrolysis oil,” BioResources 12(1), 1611-1623. 1620
Fig. 4. Phenolic content in raw and KCl-doped lignin pyrolysis oil at different temperatures
CONCLUSIONS
1. Alkali and alkaline earth metallic species exerted effects on the distribution of corn
stalk pyrolysis products and phenolic products. AAEMs showed positive effects on
the formation of char and gas, while they had a passive effect on yielding bio-oil.
The effect of KCl on the production distribution was somewhat stronger than that of
CaCl2.
2. Comparing the phenolic content in raw and salts doped corn stalk pyrolysis oil, the
phenolic content was promoted by the effect of AAEMs, especially for phenols and
guaiacols. The positive influence of AAEMs was relative dominate when the
experiment temperature below 550 °C.
3. The influence of potassium and calcium on phenolic products in lignin oil was
investigated. The content of P and HP increased and that of GP decreased. Such
effects were ascribed to the influence of KCl and CaCl2, whereas CaCl2 exhibited
more positive effects on the formation of P and HP. The effect of KCl can promote
the polymerization of light molecular aromatic hydrocarbon, which can explain why
KCl promoted the production of SP at 600 °C. The increase in phenol content can be
concluded that KCl and CaCl2 play notable roles in demethxylation and
demethoxylation, or removing the R group from a ring.
PEER-REVIEWED ARTICLE bioresources.com
Liu et al. (2017). “Earth metals in pyrolysis oil,” BioResources 12(1), 1611-1623. 1621
ACKNOWLEDGMENTS
This work was financially supported by The National Natural Science Foundation
of China (51406109, 51276103, and 51406108), Key Projects of NSFC (51536009), and
Distinguished Expert of Taishan Scholars Shandong Province, Higher Education Superior
Discipline Team Training Program of the Shandong Province.
REFERENCES CITED
Andersen, F. A., Bergfeld, W. F., Belsito, D. V., Hill, R. A., Klaassen, C. D., Liebler, D.
C., Marks, J. G., Jr., Shank, R. C., Slaga, T. J., and Snyder, P. W. (2010). “Final
amended safety assessment of hydroquinone as used in cosmetics,” International
Journal of Toxicology 29(6 suppl.), 274S-287S. DOI: 10.1177/1091581810385957
Balat, M., Balat, M., Kırtay, E., and Balat, H. (2009). “Main routes for the thermo-
conversion of biomass into fuels and chemicals. Part 1: Pyrolysis systems,” Energy
Conversion and Management 50(12), 3147-3157. DOI:
10.1016/j.enconman.2009.08.014
Bridgwater, A. V. (2012). “Review of fast pyrolysis of biomass and product upgrading,”
Biomass and Bioenergy 38(2), 68-94. DOI: 10.1016/j.biombioe.2011.01.048
Di Blasi, C., Galgano, A., and Branca, C. (2009). “Influences of the chemical state of
alkaline compounds and the nature of alkali metal on wood pyrolysis,” Industrial and
Engineering Chemistry Research 48(7), 3359-3369. DOI: 10.1021/ie801468y
Dalluge, D. L., Daugaard, T., Johnston, P., Kuzhiyil, N., Wright, M. M., and Brown, R. C.
(2014). “Continuous production of sugars from pyrolysis of acid-infused
lignocellulosic biomass,” Green Chemistry 16(9), 4144-4155. DOI:
10.1039/C4GC00602J
Dorrestijn, E., and Mulder, P. (1999). “The radical-induced decomposition of 2-
methoxyphenol,” Journal of the Chemical Society Perkin Transactions 4(4), 777-780.
DOI: 10.1039/A809619H
Eom, I. Y., Kim, J. Y., Kim, T. S., Lee, S. M., Choi, D., Choi, I. G., and Choi, J. W.
(2012). “Effect of essential inorganic metals on primary thermal degradation of
lignocellulosic biomass,” Bioresource Technology 104, 687-694. DOI:
10.1016/j.biortech.2011.10.035
Fahmi, R., Bridgwater, A. V., Darvell, L. I., Jones, J. M., Yates, N., Thain, S., and
Donnison, I. S. (2007). “The effect of alkali metals on combustion and pyrolysis of
Lolium and Festuca grasses,” Fuel 86(10-11), 1560-1569. DOI:
10.1016/j.fuel.2006.11.030
Gao X., Chang J., Xu, S., and Ren, X. (2012). “Testing and analysis of reactivity of bio-
oil for phenolic resin,” China Adhesives 5, 1034-1037.
Hosoya, T., Kawamoto, H., and Saka, S. (2008). “Secondary reactions of lignin-derived
primary tar components,” Journal of Analytical & Applied Pyrolysis 83(1), 78-87.
DOI: 10.1016/j.jaap.2008.06.003
Jensen, A., Damjohansen, K., Wojtowicz, M. A., and Serio, M. A. (1998). “TG-FTIR
study of the influence of potassium chloride on wheat straw pyrolysis,” Energy Fuels
12(5), 929-938. DOI: 10.1021/ef980008i
PEER-REVIEWED ARTICLE bioresources.com
Liu et al. (2017). “Earth metals in pyrolysis oil,” BioResources 12(1), 1611-1623. 1622
Jeong, J. Y., Lee, U. D., Chang, W. S., and Jeong, S. H. (2016). “Production of bio-oil
rich in acetic acid and phenol from fast pyrolysis of palm residues using a fluidized
bed reactor: Influence of activated carbons,” Bioresource Technology 219, 357-364.
DOI: 10.1016/j.biortech.2016.07.107
Jiang, L., Hu, S., Wang, Y., Su, S., Sun, L., Xu, B., He, L., and Xiang, J. (2015).
“Catalytic effects of inherent alkali and alkaline earth metallic species on steam
gasification of biomass,” International Journal of Hydrogen Energy 40(45), 15460-
15469. DOI: 10.1016/j.ijhydene.2015.08.111
Kawser, M. D. J., and Ani, F. N. (2000). “Oil palm shell as a source of phenol,” Journal
of Oil Palm Research 12(1), 86-94.
Kleen, M., and Gellerstedt, G. (1995). “Influence of inorganic species on the formation of
polysaccharide and lignin degradation products in the analytical pyrolysis of pulps,”
Journal of Analytical and Applied Pyrolysis 35(1), 15-41. DOI: 10.1016/0165-
2370(95)00893-J
Kristanti, R. A., Zubir, M. M. F. A., and Hadibarata, T. (2016). “Biotransformation
studies of cresol red by Absidia spinosa M15,” Journal of Environmental
Management 172, 107-111. DOI: 10.1016/j.jenvman.2015.11.017
Liu, C., Hu, J., Zhang, H., and Xiao, R. (2016). “Thermal conversion of lignin to phenols:
Relevance between chemical structure and pyrolysis behaviors,” Fuel 182, 864-870.
DOI: 10.1016/j.fuel.2016.05.104
Lv, G., Wu, S., Yang, G., Yang, G., Chen, J., Liu, Y., and Kong, F. (2013). “Comparative
study of pyrolysis behaviors of corn stalk and its three components,” Journal of
Analytical and Applied Pyrolysis 104, 185-193. DOI: 10.1016/j.jaap.2013.08.005
Oasmaa, A., Solantausta, Y., Arpiainen, V., Kuoppala, E., and Kai, S. (2010). “Fast
pyrolysis bio-oils from wood and agricultural residues,” Energy & Fuels 24(2), 1380-
1388. DOI: 10.1021/ef901107f
Ohra-Aho, T., Tenkanen, M., and Tamminen, T. (2005). “Direct analysis of lignin and
lignin-like components from softwood kraft pulp by py-gc/ms techniques,” Journal of
Analytical & Applied Pyrolysis 74(1–2), 123-128. DOI: 10.1016/j.jaap.2004.11.010
Oudenhoven, S. R. G., Westerhof, R. J. M., and Kersten, S. R. A. (2015). “Fast pyrolysis
of organic acid leached wood, straw, hay and bagasse: Improved oil and sugar yields,”
Journal of Analytical and Applied Pyrolysis 116, 253-262. DOI:
10.1016/j.jaap.2015.09.003
Patwardhan, P. R., Satrio, J. A., Brown, R. C., and Shanks, B. H. (2010). “Influence of
inorganic salts on the primary pyrolysis products of cellulose,” Bioresource
Technology 101(12), 4646-4655. DOI: 10.1016/j.biortech.2010.01.112
Patwardhan, P. R., Brown, R. C., and Shanks, B. H. (2011). “Understanding the fast
pyrolysis of lignin,” ChemSusChem 4(11), 1629-1636. DOI: 10.1002/cssc.201100133
Pordesimo, L. O., Hames, B. R., Sokhansanj, S., and Edens, W. C. (2005). “Variation in
corn stover composition and energy content with crop maturity,” Biomass &
Bioenergy 28(4), 366-374. DOI: 10.1016/j.biombioe.2004.09.003
Ralph, J., Lundquist, K., Brunow, G., Lu, F., Kim, H., Schatz, P. F., Marita, J. M.,
Hatfield, R. D., Ralph, S. A., Christensen, J. H., and Boerjan, W. (2004). “Lignins:
Natural polymers from oxidative coupling of 4-hydroxyphenyl- propanoids,”
Phytochemistry Reviews 3(1), 29-60. DOI: 10.1023/B:PHYT.0000047809.65444.a4
Rashid, T., Kait, C. F., Regupathi, I., and Murugesan, T. (2016). “Dissolution of kraft
lignin using protic ionic liquids and characterization,” Industrial Crops and Products
84, 284-293. DOI: 10.1016/j.indcrop.2016.02.017
PEER-REVIEWED ARTICLE bioresources.com
Liu et al. (2017). “Earth metals in pyrolysis oil,” BioResources 12(1), 1611-1623. 1623
Saiz-Jimenez, C., and De Leeuw, J. W. (1986). “Lignin pyrolysis products: Their
structures and their significance as biomarkers,” Organic Geochemistry 10(4-6), 869-
876. DOI: 10.1016/S0146-6380(86)80024-9
Shen, D., Liu, G., Zhao, J., Xue, J., Guan, S., and Xiao, R. (2015). “Thermo-chemical
conversion of lignin to aromatic compounds: Effect of lignin source and reaction
temperature,” Journal of Analytical & Applied Pyrolysis 112, 56-65. DOI:
10.1016/j.jaap.2015.02.022
Soltani, H., Pardakhty, A., and Ahmadzadeh, S. (2016). “Determination of hydroquinone
in food and pharmaceutical samples using a voltammetric based sensor employing
NiO nanoparticle and ionic liquids,” Journal of Molecular Liquids 219, 63-67. DOI:
10.1016/j.molliq.2016.03.014
Song, H., Jiang, L., Wang, Y., Sheng, S., Sun, L., Xu, B., He, L., and Xiang, J. (2015).
“Effects of inherent alkali and alkaline earth metallic species on biomass pyrolysis at
different temperatures,” Bioresource Technology 192, 23-30. DOI:
10.1016/j.biortech.2015.05.042
Wang, J., Zhang, M., Chen, M., Min, F., Zhang, S., Ren, Z., and Yan, Y. (2006).
“Catalytic effects of six inorganic compounds on pyrolysis of three kinds of
biomass,” Thermochimica Acta 444(1), 110-114. DOI: 10.1016/j.tca.2006.02.007
Zakzeski, J., Bruijnincx, P. C., Jongerius, A. L., and Weckhuysen, B. M. (2010). “The
catalytic valorization of lignin for the production of renewable chemicals,” Chemical
Reviews 110(6), 3552-3599. DOI: 10.1021/cr900354u
Zhang, H. M., Zheng, R. P., Chen, J. W., and Huang, H. (2010). “Investigation on the
determination of lignocellulosics components by NREL method,” Chinese Journal of
Analysis Laboratory 29(11), 15-18.
Zhou, S., Garciaperez, M., Pecha, B., Kersten, S. R. A., McDonald, A. G., and Westerhof,
R. J. M. (2013). “Effect of the fast pyrolysis temperature on the primary and
secondary products of lignin,” Energy & Fuels 27(10), 5867-5877. DOI:
10.1021/ef4001677
Article submitted: July 28, 2016; Peer review completed: October 2, 2016; Revised
version received and accepted: January 4, 2017; Published: January 17, 2017.
DOI: 10.15376/biores.12.1.1611-1623