influence of conduit flow mechanics on magma …elsworth/publications/journals/2018_j_gji... ·...
TRANSCRIPT
Influence of conduit flow mechanics on magma rheology and the
growth style of lava domes
Taha Husain, Derek Elsworth
Energy and Mineral Engineering, G3 Center and EMS Energy Institute, The Pennsylvania State
University, University Park, PA 16802
Barry Voight
Geosciences, The Pennsylvania State University, University Park, PA 16802
Glen Mattioli, Pamela Jansma
Department of Earth and Environmental Sciences, University of Texas at Arlington, Arlington,
TX 76019
ABSTRACT
We develop a two-dimensional particle-mechanics model to explore different lava-dome growth
styles. These range from endogenous lava dome growth comprising expansion of a ductile dome core to
the exogenous extrusion of a degassed lava plug resulting in generation of a lava spine. We couple
conduit flow dynamics with surface growth of the evolving lava dome, fueled by an open-system magma
chamber undergoing continuous replenishment. The conduit flow model accounts for the variation in
rheology of ascending magma that results from degassing-induced crystallization. A period of reduced
effusive flow rates promote enhanced degassing-induced crystallization. A degassed lava plug extrudes
exogenously for magmas with crystal contents (ϕ) of 78%, yield strength >1.62 MPa, and at flow rates of
< 0.5 m3/s, while endogenous dome growth is predicted at higher flow rates (Qout > 3 m
3/s) for magma
with lower relative yield strengths (< 1 MPa). At moderately high flow rates (Qout = 4 m3/s), the extrusion
of magma with lower crystal content (62%) and low interparticulate yield strength (0.6 MPa) results in
the development of endogenous shear lobes. Our simulations model the periodic extrusion history at
Mount St. Helens (1980 – 1983). Endogenous growth initiates in the simulated lava dome with the
extrusion of low yield strength magma (ϕ = 0.63 and τp = 0.76 MPa) after the crystallized viscous plug (ϕ
= 0.87 and τp = 3 MPa) at the conduit exit is forced out by the high discharge rate pulse (2 < Qout < 12
m3/s). The size of the endogenous viscous plug and the occurrence of exogenous growth depend on
magma yield strength and the magma chamber volume, which control the periodicity of the effusion. Our
simulations generate dome morphologies similar to those observed at Mount St Helens, and demonstrate
the degree to which domes can sag and spread during and following extrusion pulses. This process, which
has been observed at Mount St. Helens and other locations, largely reflects gravitational loading of dome
with a viscous core, with retardation by yield strength and talus friction.
1. INTRODUCTION
Fluctuation in extrusion rates at Soufriere Hills Volcano, Montserrat and at Mount St. Helens, USA
is semi-periodic, with periods of high discharge rate alternating with periods of low extrusion rate
Downloaded from https://academic.oup.com/gji/advance-article-abstract/doi/10.1093/gji/ggy073/4904177by Serial Record useron 21 March 2018
(Melnik and Sparks, 2005). The fluctuation in extrusion rate influences the rate of volatile exsolution,
which subsequently controls degassing-induced crystallization that is promoted by decompression during
magma ascent (Sparks et al., 2000).This results in rheological stiffening due to an increase in the total
magma crystal content and gas-loss from melt (Lejeune and Richet, 1995; Hess and Dingwell, 1996;
Sparks, 1997; Hort, 1998; Melnik and Sparks, 1999; Cashman and Blundy, 2000; Hammer and
Rutherford, 2002; Costa, 2005; Cashman et al., 2008). The extent of rheological stiffening, controlled by
the gain in mechanical strength, influences the observed flow patterns in the lava dome (Lavallée et al.,
2007). Magma emplacement at SHV transitions between crystalline material with higher strength
extruded as spines at low ascent rates (~0.5 to 2 m3/s) to that of endogenous growth of a viscous
Newtonian fluid at higher flow rates (between 2 to 8 m3/s) (Sparks et al., 2000; Watts et al., 2002; Hale
and Wadge, 2008).
Observations of dome growth provide an invaluable source of information to define the evolution
of magma rheology during emplacement (Murase, McBirney and Melson, 1985; Anderson and Fink,
1990; Swanson and Holcomb, 1990). Extrusion of Newtonian magma generates relatively low, smooth-
surfaced domes (Huppert et al., 1982; Buisson and Merle, 2002). Domes formed by highly-crystalline
magma with yield strength exhibit shear lobes and spine growth, which indicates the significance of
internal yield strength on behavior (Blake, 1990; Griffiths and Fink, 1997; Griffiths, 2000; Hale,
Bourgouin and Mühlhaus, 2007; Hale, 2008; Hale and Wadge, 2008). Numerical models of a crystal rich
magma can represent the observed transition in flow regime from endogenous to exogenous growth
(Hale, 2008; Husain et al., 2014). However a remaining question is whether such transitions are linked to
deeper parts of the magma system. Conduit flow models have been capable of monitoring inputs of
magma to the chamber and the subsequent discharge of volatile and crystal rich magma from a conduit,
but thus far have not been linked to the surface morphology of an evolving lava dome (Melnik and
Sparks, 1999, 2002, 2005; Barmin et al., 2002; Huppert and Woods, 2002).
Other useful observations concern cyclic extrusion behavior, which occurs at some volcanoes on a
wide range of timescales (sub-daily to multi-decadal), accompanied by cycles of repetitive ground
deformation, degassing and explosions (Voight et al., 1998, 1999; Young, Voight and Duffell, 2003;
Odbert et al., 2014). Here we consider sub-daily to sub-annual cycles of activity, that can reflect the
magma chamber, conduit, and dome-feedback conditions, which can influence lava dome morphology.
In this paper we evaluate the variation in magma rheology and dome morphology for the range of
extrusion rates observed at Soufriere Hills Volcano (SHV), Montserrat and Mount St. Helens (MSH),
USA (Sparks et al., 1998; Barmin et al., 2002; Mastin, 2002; Watts et al., 2002; Cashman et al., 2008;
Wadge et al., 2010). Rheological stiffening during ascent changes magma from Newtonian fluid to a
crystalline solid and results in the transition in flow behavior from an endogenously evolving dome to the
exogenous extrusion of lava (Husain et al., 2014). Here our objective is to represent the effect of
extrusion rate on magma rheology and explain the mechanism behind the observed evolution of lava
dome morphology during cycles of magma extrusion. We use a 2-D discrete element modeling technique
(DEM) (Cundall and Strack, 1979), as developed in our previous work (Husain et al., 2014),where a
synthetic lava dome grows by extrusion from below a horizontal plane. In this case we couple our
particle-mechanics model with a conduit flow model to investigate the effect of different magma
plumbing conditions on the dynamics of the emplacement and the morphology of the lava dome. We
consider the effect of crystal growth rate on enhancement of strength of the extruding magma and internal
Downloaded from https://academic.oup.com/gji/advance-article-abstract/doi/10.1093/gji/ggy073/4904177by Serial Record useron 21 March 2018
flow within a synthetic lava dome, and investigate the effect of fluctuating discharge rate on dome
morphology. Parameters from analog models of conduit flow inferred from the observations of periodic
magma extrusion at Mount St. Helens (1980 – 1986) (Barmin et al., 2002).
In the subsequent section (2), we describe the development of the model with its relevant concepts
in detail and list the model assumptions. Section 3 discusses model results, with the first part (section 3.1)
considering the different intra-dome flow patterns with varying extrusion rate and magma yield strength,
with parameters inferred from experimental studies and numerical conduit models for Soufriere Hills
Volcano (Couch et al., 2003; Melnik and Sparks, 2005). Section 4.2 then develops a model to investigate
the variation in lava dome morphology during periodic magma extrusion, with input parameters inferred
from data at Mount St. Helens during a period of cyclic extrusion (1980 – 1983) (Swanson and Holcomb,
1990; Barmin et al., 2002).
2. MODEL CONCEPTS
Volcanic eruptions involve complex interacting processes, which are necessarily governed by non-
linear equations and many variables. Available modeling strategies vary between complex numerical
models that incorporate many parameters, to simple models, which attempt capture the critical physical
features of the process with simplifying assumptions (Barmin et al., 2002). Here we simplify analysis
using the assumption that the conduit is separated into two zones, containing low and high viscosity
fluids. The magma chamber is assumed surrounded by elastic wall rock and experiences periodic cycles
of pressurization and de-pressurization due to the replenishment of magma from a deeper source and at a
constant rate (Elsworth et al., 2008; Foroozan et al., 2010). The pressurization promotes magma ascent
and related decompression that in turn causes the exsolution of volatile sand results in degassing-induced
crystallization (Cashman and Blundy, 2000; Sparks et al., 2000). An increase in total crystal content
results in a rheological transition at depth xT (distance from the magma chamber) from a lower initial
magma viscosity (µ1) to the higher viscosity (µ2) (Lejeune and Richet, 1995). Figure 1 represents this
process schematically.
The rate of crystallization during magma ascent controls the rheological state of the magma in the
conduit. Magma in the conduit can flow under either of two different regimes: 1) rapid ascent of lower
viscosity magma, which inhibits crystal growth and decreases transition depth, or 2) slower ascent which
aids volatile loss and enhances crystal growth. The second case promotes crystallinity and results in
rheological stiffening within the conduit. This approach (Barmin et al., 2002) is capable of simulating
cycles of periodic discharge of magma that vary in amplitude and frequency, and which are governed by
the input parameters assigned.
The growth of a lava dome initiates at the point of extrusion of high-viscosity magma at the conduit vent.
The dome growth style (endogenous or exogenous) during the evolution of a synthetic lava dome is
largely a function of the yield strength of the extruding magma, which in turn is governed by the magma
crystal volume fraction (Voight et al., 1999; Saar et al., 2001; Watts et al., 2002). An increase in crystal
content ultimately results in the formation of a continuous crystal phase in the magma, accompanied by
significant enhancement in magma yield strength. At the critical volume fraction ϕc (dependent on crystal
shape and size distributions) a continuous crystal network first forms to provide some minimum yield
strength (τp 0). For ϕ > ϕc, yield strength rapidly increases with increasing ϕ. The fluid-to-solid
transition occurs at the maximum crystal packing fraction, ϕm, a value also dependent on crystal shape and
size distributions (Saar et al., 2001). Note that this “maximum” volume fraction defines the packing
Downloaded from https://academic.oup.com/gji/advance-article-abstract/doi/10.1093/gji/ggy073/4904177by Serial Record useron 21 March 2018

crystal content only at the fluid-solid transition, and that crystallization can continue within the pores of
the packing structure. Thus the total crystal volume fraction in a volcanic rock can approach 100 %.
The model we present here couples conduit flow processes with the mechanics of lava dome flow
emplacement. The model asserts simplifying assumptions for flow mechanics and phase behavior, while
providing information on the rheological behavior of an evolving lava dome driven by a magma chamber
experiencing periodic cycles of pressurization.
3. MODEL DEVELOPMENT
We develop a 2-D particle-mechanics model capable of mapping stress distribution and the
evolution of flow morphology in a deforming aggregate. The magma is represented as an aggregate of
discrete particles (3 m diameter (D) in this study) (Cundall and Strack, 1979) where elastic deformation
uses soft particle dynamics, which govern particle-particle interactions (Morgan and McGovern, 2005a,
2005b; Husain et al., 2014). In our model, a synthetic 2-D lava dome grows on a rigid horizontal base fed
by a vertical conduit with a specified flow velocity. The width of the central vent in the 2-D model is
specified as equal to the presumed radius of the conduit at SHV, Montserrat for section 3.1 and equal to
the conduit radius of Mount St. Helens, USA for section 3.2. Figure 2 (a,c) represents the basic 2-D
model in PFC2D
for the simulation runs with the dimensions given in Table 1.
The flow of high viscosity fluid through a conduit with a very small width to length ratio is
assumed to be fully developed (Stasiuk and Jaupart, 1997). Magma flow through the conduit during the
eruptive cycle is in the laminar regime (Reynolds number of 5 x 10-11
in nature) for non-explosive
eruptions (Jaupart and Tait, 1990; Buisson and Merle, 2002). The flow velocity of the magma (composed
of a mixture of melt and crystals) in the conduit is calculated as shown by Barmin et al. (2002). Flow is
controlled by a viscosity (µ) that is dependent on the volume concentration of crystals, represented as a
step function. The system of equations to calculate flow velocity (u) for the unsteady case for a constant
cross-sectional area is given as,
(1)
(2)
(3)
(4)
where the magma density (ρ) in Eq. 1 is considered constant during an increase in crystal content (ϕ) for
instantaneous nucleation of crystals at a specified linear crystal growth rate (χ). The number density of
crystals per unit volume (n) in Eq. 2 in the conduit is fixed and is equal to that in the magma chamber
(nch). The flow velocity is calculated (Eq. 3) for a given gradient in vertical (z) pressure (𝛛P/𝛛z) and for a
specified conduit radius (rc), where the viscosity changes from µ1 to µ2 for a volume concentration (ϕ)
higher than the threshold transitional value (ϕT). The total crystal content (ϕ) at a given depth (z) is
( ) 0
ut z
( ) 0
nunt z
1
2
2
, 8 ;
,
T
c T
uP gz r
1 23 3 (36 )u n
t z
Downloaded from https://academic.oup.com/gji/advance-article-abstract/doi/10.1093/gji/ggy073/4904177by Serial Record useron 21 March 2018
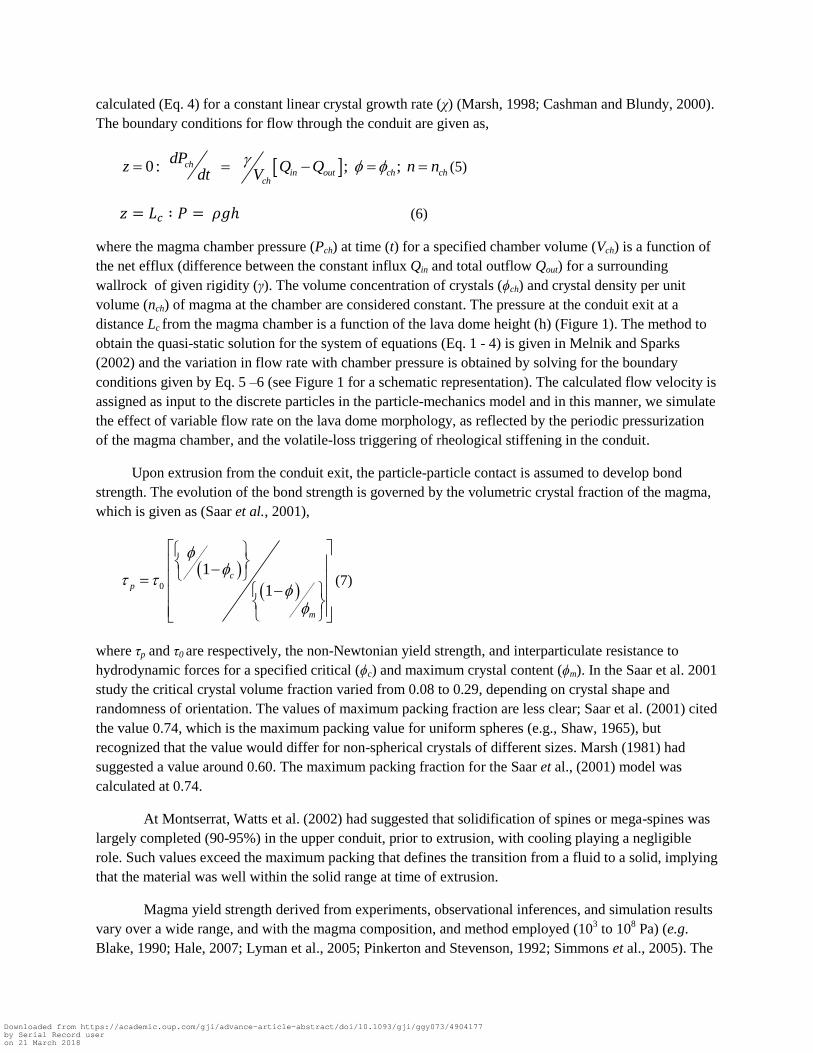
calculated (Eq. 4) for a constant linear crystal growth rate (χ) (Marsh, 1998; Cashman and Blundy, 2000).
The boundary conditions for flow through the conduit are given as,
(5)
(6)
where the magma chamber pressure (Pch) at time (t) for a specified chamber volume (Vch) is a function of
the net efflux (difference between the constant influx Qin and total outflow Qout) for a surrounding
wallrock of given rigidity (γ). The volume concentration of crystals (ϕch) and crystal density per unit
volume (nch) of magma at the chamber are considered constant. The pressure at the conduit exit at a
distance Lc from the magma chamber is a function of the lava dome height (h) (Figure 1). The method to
obtain the quasi-static solution for the system of equations (Eq. 1 - 4) is given in Melnik and Sparks
(2002) and the variation in flow rate with chamber pressure is obtained by solving for the boundary
conditions given by Eq. 5 –6 (see Figure 1 for a schematic representation). The calculated flow velocity is
assigned as input to the discrete particles in the particle-mechanics model and in this manner, we simulate
the effect of variable flow rate on the lava dome morphology, as reflected by the periodic pressurization
of the magma chamber, and the volatile-loss triggering of rheological stiffening in the conduit.
Upon extrusion from the conduit exit, the particle-particle contact is assumed to develop bond
strength. The evolution of the bond strength is governed by the volumetric crystal fraction of the magma,
which is given as (Saar et al., 2001),
(7)
where τp and τ0 are respectively, the non-Newtonian yield strength, and interparticulate resistance to
hydrodynamic forces for a specified critical (ϕc) and maximum crystal content (ϕm). In the Saar et al. 2001
study the critical crystal volume fraction varied from 0.08 to 0.29, depending on crystal shape and
randomness of orientation. The values of maximum packing fraction are less clear; Saar et al. (2001) cited
the value 0.74, which is the maximum packing value for uniform spheres (e.g., Shaw, 1965), but
recognized that the value would differ for non-spherical crystals of different sizes. Marsh (1981) had
suggested a value around 0.60. The maximum packing fraction for the Saar et al., (2001) model was
calculated at 0.74.
At Montserrat, Watts et al. (2002) had suggested that solidification of spines or mega-spines was
largely completed (90-95%) in the upper conduit, prior to extrusion, with cooling playing a negligible
role. Such values exceed the maximum packing that defines the transition from a fluid to a solid, implying
that the material was well within the solid range at time of extrusion.
Magma yield strength derived from experiments, observational inferences, and simulation results
vary over a wide range, and with the magma composition, and method employed (103 to 10
8 Pa) (e.g.
Blake, 1990; Hale, 2007; Lyman et al., 2005; Pinkerton and Stevenson, 1992; Simmons et al., 2005). The
0 : ; ; chin out ch ch
ch
dPz Q Q n n
dt V
0
1
1c
p
m
Downloaded from https://academic.oup.com/gji/advance-article-abstract/doi/10.1093/gji/ggy073/4904177by Serial Record useron 21 March 2018
yield strength calculated from Eq. 7 is applied to the parallel bond that controls the failure behavior of the
particle-particle contact.
An approximation used to describe the non-Newtonian behavior of magma flow is the Bingham flow law
where shear stress (τ) is given by,
(8)
where τp is the yield strength and ɳ is the plastic viscosity for a strain rate of . Flow initiates upon the
application of a stress greater than the yield strength (τp) as represented by Eq. 8. The apparent viscosity
(ɳapp) can be used to define flow of the bulk fluid and is given as (Blake, 1990; Griffiths, 2000),
(9)
where apparent viscosities calculated for the dacite magma at Mount St. Helens are observed to vary from
1012
to 109 Pa.s for strain rates between 10
-10 to 10
-2 sec
-1 (Pinkerton and Stevenson, 1992). The total shear
force (Fts) is associated with the parallel contact bond in PFC
2D at time t after time step ∆t and is given by,
(10)
where is the incremental shear force generated over the timestep ∆t. Upon the application of a shear
force ( ) that exceeds the maximum shear stress (τp) the parallel bond fails (Eq.10). The maximum
shear stress (τp) when the parallel bond breaks in the model is given by,
(11)
(12)
where is the shear loading for an area A as represented in Eq. 11. When maximum shear stress is
exceeded at (t - ∆t), the incremental shear stress (∆τ) in Eq. (12) is calculated for a time-step ∆t and shear
displacement .The relationship of the plastic viscosity (ɳ) to parallel bond shear stiffness (ks)
is,
(13)
where L0 is the original sample size (Figure 2b) and Vi is the shear velocity. The parallel bond is
regenerated for a viscous fluid as represented by the red particles in Figure 2c.
The magma is comprised of silicate melt, crystals and volatiles. The relative proportions of the
fractions and their respective compositions exert a significant influence on the magma‟s bulk composition
and its material stiffness. The effect can be parameterized as a function of dissolved water in the melt,
crystal content and pressure (Melnik and Sparks, 2005). The empirical correlation between
p
papp
s s s
t t t tF F F
s
t t
p
F
A
s
s stFk U
A
0
sktL
Downloaded from https://academic.oup.com/gji/advance-article-abstract/doi/10.1093/gji/ggy073/4904177by Serial Record useron 21 March 2018

liquidus/solidus temperature (Tliq,sol) with pressure, obtained from experiments on crystallization of
plagioclase feldspar on decompression test for the andesitic magma samples (1996) is given as (Couch et
al., 2003; Melnik and Sparks, 2005),
(14)
where the value of the empirical constants aT, bT, cT and dT are obtained from the least-squares best fit to
the experimental data defined by Eq. 14 and listed in Table 2. Lava solidification is related to pressure
using the solidus temperature (Tsol), which and calculated by Eq. 14. Identification of the ductile core-
solidified lava interface within the model domain allows material properties to be updated. The failure
criterion changes to a Mohr-Coulomb law when the magma transitions from a viscous fluid to a brittle-
solid. The Mohr-Coulomb failure criterion in the model is defined as,
(15)
where is the maximum shear force for a specified cohesion (C) and friction coefficient (µFriction) for a
given normal force (Fn). A detailed discussed of the constitutive contact laws that govern particle-
particle/wall-particle interaction, parallel bond implementation, factors that control phase change (viscous
fluid to brittle solid) and the correlation of contact stiffness with material properties (Young‟s modulus E
and Shear modulus G) are described elsewhere (Husain et al., 2014).
4. RESULTS AND DISCUSSION
We now evaluate the variation in magma rheology and dome morphology for the range of extrusion rates
observed at Soufriere Hills Volcano and Mount St. Helens. In the following we discuss for SHV the
different dome morphologies that may evolve at variable extrusion rates for specified crystal growth rate
and magma yield strength. This study is then extended to explore the effects of periodic flow behavior
observed at Mount St. Helens, USA (1980 – 1983), with the results discussed in section 4.2.
4.1. Analysis of dome evolution and the effect of extrusion rate on dome morphology
In this section we develop a model to represent and study the response at SHV, incorporating the
effect of crystallization kinetics and list the variation in crystal content of the magma at the conduit vent
for nominal values of flow rates ranging between 0.5 – 8 m3/s. The study considers andesitic magma
(bulk composition) with initial crystal content of 0.6 for a magma chamber depth of 5000 m and conduit
radius of 15 m (Melnik and Sparks, 2005).
The total crystal content in the ascending magma is taken as the sum of the phenocrysts formed in
the chamber prior to the eruption, and phenocrysts and microlites that crystallize during magma ascent. In
our model we assume that crystal nucleation is instantaneous, which implies that the increment in total
crystal content depends solely on the crystal growth rate of the phenocrysts in the magma - a reasonable
first order approximation (Marsh, 1998; Cashman and Blundy, 2000). Eq. 4 illustrates that ascent rate and
crystal growth rate influence the magma crystal content during ascent. At lower flow rates (< 1 m3/s) the
magma is highly crystallized in the upper conduit, and at SHV The crystal volume fraction of the
extruded lava, from the shear surfaces of the lava structure, is approximately 0.9 (Sparks et al., 2000).
2 3
, ln( ) c ln( ) ln( )liq sol T T T TT a b P P d P
max s Friction nF C F
Downloaded from https://academic.oup.com/gji/advance-article-abstract/doi/10.1093/gji/ggy073/4904177by Serial Record useron 21 March 2018
Based on conduit flow modeling, the calculated maximum crystal volume fraction for a magma
flow rate of 0.32 m3/s at the conduit exit is ~ 0.9 (Melnik and Sparks, 2005). A linear crystal growth rate
of 1.475 x 10⁻¹³
m/s is calculated using Eq. 16 for our simulations based on the conditions given in the
study – with Eq. 16 as derived from Eq. 4 for a given flow rate. The total crystal content of magma (ϕ) at
any given depth is given by,
(16)
where we assume total crystal content is calculated at the vent (z = Lc) for a linear crystal growth rate (χ)
of 1.475 x 10⁻¹³
m/s and magma crystal content at chamber (ϕch) of 0.6 at different ascent velocities (u).
The volume fraction of crystals in the magma increases with a decrease in discharge rate for a specified
linear crystal growth rate, magma chamber crystal content and crystal density at a given depth.
Table 3 lists the idealized values considered for magma packets in the simulation runs in the section.
Figure 3 represents the variation in magma crystal volume fraction with flow rate, for the values in Table
3. The increase in crystal volume fraction at low flow rates enhances the yield strength of the extruded
magma (which is maintained uniform throughout the lava dome (Eq. 7)).
The magma yield strength calculated by Blake (1990) from the reported height and radius of the dacitic
Mount St. Helens (June, 1980) is 0.13 MPa. The stable heights of the extruded spines at SHV suggest that
the minimum shear strength of the highly crystalline magma (5 – 10% melt) was about 1 MPa (Voight et
al., 1999). In our model, magma yield strength ranges between 0.1 to 6 MPa (Figure 3), showing the
effect of different extrusion rates on yield strength.
The simulations in this section are focused on investigating the effect of crystallization on the flow
behavior of the magma, where the lava dome grows on the rigid horizontal base that is fed through the
vent at a constant flow rate. We monitor the variation in morphology of the simulated lava dome at
different flow rate intervals (Qout = 0.5, 2, 4, 6 and 8 m3/s). Simulation runs are performed for the same set
of flow rates for magma with different interparticulate resistances, which governs the non-Newtonian
yield strength (τp) based on the value of ϕc and ϕm considered (see Equation 7) (τ0 = 0.10, 0.25, 0.40 and
0.60 MPa).
In Figures 4 and 5 we compare lava dome morphology of two sets of models with assumed values
of τ0 = 0.10 and 0.25 MPa (ϕc = 0.2 and ϕm = 0.9). Each set is compared for five values of flow rates - 0.5,
2, 4, 6 and 8 m3/s, for two simulated eruption times ~4.2 hours (Figure 4) and 27.8 hours (Figure 5). The
two run times involve 30000 and 200000 simulation steps, respectively. The lava dome evolves
endogenously for the entire range of assumed flow rates (0.5 – 8 m3/s for constant value of τ0 = 0.1 MPa),
where the magma yield stress (τ) varies for different flow rates (e.g. at 0.5 m3/s, the value of ϕ = 0.8 with τ
= 0.4 MPa represented by Point A in Figure 4). In the case of constant τ0 = 0.25 MPa, endogenous growth
occurs for flow rates higher than 3 m3/s where τp is greater than 0.44 MPa (Eq. 7) (at a crystal content of
0.63). For magma with higher yield strength (e.g., with constant interparticle resistance τ0 of 0.25 MPa) at
lower flow rates (τp = 0.55 MPa for ϕ = 0.643 at Qout = 2 m3/s), the unobstructed extrusion of a lava lobe
is observed (Point G in Figure 4).
1
31 1
3 3
36 +
3
ch
ch
n z
u
Downloaded from https://academic.oup.com/gji/advance-article-abstract/doi/10.1093/gji/ggy073/4904177by Serial Record useron 21 March 2018
In Figure 5, at 27.8 h, a clear distinction occurs between the flow patterns of the two lava domes
with different τ0 values. With τ0 = 0.1 MPa, the modeled domes remain endogenous for all flow rates
(Points A – E in Figure 5); for these runs the magma yield strength (τp) varied from 0.4 MPa (ϕ = 0.782)
at Qout = 0.5 m3/s (Point A) to 0.176 MPa (ϕ = 0.61) at Qout = 8 m
3/s (Point E). In contrast the simulated
lava dome with magma of τ0 = 0.25 MPa grows endogenously for flow rates greater than about 5 m3/s
(Points I and J).The magma yield strength (τp) varies from 0.44 MPa (ϕ = 0.61) at Qout = 8 m3/s (Point I)
to 0.45 MPa (ϕ = 0.617) at Qout = 5 m3/s. For slightly higher yield strength (τp = 0.461 MPa for ϕ = 0.621)
at Qout = 4 m3/s (Point H in Figure 5), the dome structure evolves with the development of shear
structures, while there appears to be intermittent exogenous growth (possibly shear lobes) at Qout = 2 m3/s
(τ = 0.51 MPa for ϕ = 0.643 given by Point G in Figure 5). Lower flow rates (< 1m3/s) promote greater
degassing, which causes stiffer (high yield strength) degassed lava above the conduit vent as observed at
Qout = 0.5 m3/s (τp = 1 MPa for ϕ = 0.782) (Point F in Figure 5).
Figure 6 and 7 are similar to Figure 4 and 5 and involve the same range of Qout. The outputs test the
influence of different τ0 values (0.4 and 0.6 MPa) for the same simulation times. In Figure 6 (t = 4.2 h) the
magma extrudes from the vent as a largely-degassed short lava plug for τ0 = 0.4 and 0.6 MPa (τp = 1.62
and 2.43 MPa and ϕ = 0.782) at Qout = 0.5 m3/s (Points A and F in Figure 6), as observed similarly in
Figure 4 and 5. For Qout = 2, a spine emerges and rises to greater height commensurate with the Qout
increase, but the intact spine is weak and shears (τ0 = 0.4 MPa) (Point B) or warps τ0 = 0.6 MPa) (Point G)
under the influence of gravity. A domal-shape and endogenous growth occurs for Qout > 3 m3/s for magma
with τ0 = 0.4 MPa (τp = 0.76 MPa with ϕ = 0.628), while for the case τ0 = 0.6 MPa (τp = 1.09 MPa with ϕ
= 0.6168) and the same Qout, the spine maintains coherence and although it has partly collapsed or
deforms under gravity load, no dome-like form is yet generated. Such a morphology requires Qout > 5
m3/s. The yield strength of the lava lobe extruded at Qout = 4 m
3/s (τ0 = 0.6 MPa) (Point H) is somewhat
weaker than the magma extruded at Qout = 2 m3/s (Point G), but in addition twice as much mass has
extruded, increasing the spine height and promoting collapse.
In Figure 7 the simulation times are extended to 27.8 h, and illustrate the further evolution of the
dome structures of Figure 6. For Qout < 5 m3/s, the increase in magma yield strength leads to intermittent
exogenous growth, with spines pushing out of the dome, or, for τ0 = 0.6 MPa, shear lobes for Qout = 2-4
m3/s (Points G and H). At higher flow rates (Qout> 5 m
3/s) and for τ0 = 0.6 and 0.4 MPa, growth appears
endogenous with development of a ductile core and approximately parabolic external form (Points D, E, I
and J in Figure 7).
Magma rheology can change from (approximately) Newtonian to Bingham upon the formation of a
continuous crystal network and the development of a finite yield strength that increases rapidly with
increase in crystal volume fraction (Saar et al., 2001). Such a change in the magma rheology can result in
the transition from endogenous growth of low-yield strength magma to exogenous high- yield strength
spine extrusion. The transition is principally controlled by the extrusion rate as this affects magma
crystallization and defines the enhancement in yield strength.
The lava dome will grow endogenously and without the development of shear lobes, for magma
yield strengths lower than 1 MPa (represented by Points A and B in Figure 3, for τ0 = 0.25 and 0.4 MPa
and for flow rates greater than ~5 m3/s). In the case of higher yield strength (τp > 1 MPa) returned at lower
flow rates (Qout < 1 m3/s), an exogenous extrusion of a degassed lava plug results (Points A and F in
Downloaded from https://academic.oup.com/gji/advance-article-abstract/doi/10.1093/gji/ggy073/4904177by Serial Record useron 21 March 2018
Figure 7). Intermediate behavior such as evolution of an endogenous shear lobe depends on the
combination of magma yield strength and extrusion rate, which can vary between τp = 0.46 MPa (for τ0 =
0.25 MPa), Point H in Figure 5, to τp = 1.11 MPa (for τ0 = 0.6 MPa), Point H in Figure 7, at 4 m3/s.
The effect of extrusion rate on magma rheology is significant, and includes its effect on periodic
extrusion (Barmin et al., 2002; Denlinger and Hoblitt, 1999; Huppert and Woods, 2002; Melnik and
Sparks, 2005, 2002b, 1999; Voight et al., 1999). The amplitude of the extrusion rate and the periodicity of
the eruption cycles are affected by magma chamber and conduit system constraints, including size, depth,
conduit dimensions and shape (Costa et al., 2007), rigidity of the wall rock and rate of replenishment in
chamber and back pressure of growing dome (Watts et al., 2002; Hale, 2008). In the subsequent section
we discuss the effects of these parameters on the lava dome morphology by coupling conduit flow
mechanics with the particle-mechanics model which represents surface deformation.
4.2. Controls on flow transition from endogenous growth to exogenous spine evolution
In this section we investigate the periodic behavior observed during the lava dome eruptions at
Mount St. Helens (1980 – 1983). In the eruption of Mount St. Helens (MSH) in 1980-1986 more than 20
short episodes of dacite dome growth, lasting 2-7 days, alternated with longer periods of no growth
(Swanson and Holcomb, 1990). There were two sequences of periodic dome growth, with an intervening
episode of near-continuous dome growth lasting 368 days (Swanson and Holcomb, 1990).
Barmin et al.(2002) had developed a generic model of magma discharge through a conduit from an
open-system magma chamber with continuous replenishment, considering the principal controls on flow,
namely the replenishment rate, magma chamber size, elastic deformation of the chamber walls, conduit
resistance, and variations of magma viscosity controlled by degassing during ascent and kinetics of
crystallization. Their analysis included MSH and indicated a rich diversity of behavior with periodic
patterns similar to those observed at several other volcanoes. They noted that magma chamber size might
be estimated from the period, with longer periods implying larger chambers.
In our analysis we adopt, with a few exceptions, the parameters adopted for the calculation of
magma ascent by Barmin et al.(2002). The values inferred by Barmin et al.(2002) are based on the match
obtained with the lava dome eruption data for Mount St. Helens presented by Swanson and Holcomb
(1990). We use the parameters in Table 4. The viscosity ratio (µ2/µ1), which controls the period of
oscillation and magnitude of flow rate (section between Y1 and Y2), is taken as 52.7, instead of 80
(Barmin et al., 2002). The replenishment rate (Qin) inferred in the study by Barmin et al.(2002) is 0.67
m3/s, and is set at 0.75 m
3/s in our simulation. The magma chamber volume (Vch) is set at 0.1 km
3 in most
our simulations, smaller than the Barmin et al.(2002) best-fit value of 0.56 km3. We choose this lower
volume to reduce the execution time for the model. For a closed system, the duration of the eruption
should scale with the volume of the chamber. Reducing the volume by a factor of ~6 should decrease the
duration of the eruption by that order. In this particular case the observed period of oscillation of the
discharge pulse thus reduces from ~70 days (as observed at MSH) to 1.5 days (this model) representing a
change in duration slightly larger than this factor of ~6 (at ~50). This is likely due to the impact of the
nonlinear response of the system. The intentional reduction in the viscosity ratio, replenishment rate and
magma chamber volume from the values considered by Barmin et al.(2002) aids in reducing the duration
of eruption, while maintaining the peak flow rate (~12 m3/s), which assists in decreasing the simulation
Downloaded from https://academic.oup.com/gji/advance-article-abstract/doi/10.1093/gji/ggy073/4904177by Serial Record useron 21 March 2018
time significantly. These model choices have been made to accelerate the computation with the results
demonstrating the style of cyclicity and its control on the resulting dome morphology. Our principal
objective is to establish that our model can generate a style of periodic behavior similar to that observed at
MSH, but it is not our intent to attempt to reproduce the periodicity exactly. Regarding chamber volume,
the best-fit value determined by Barmin et al.(2002) was unrealistically small. The total DRE volume
erupted in 1980-86 is about 0.6 km3, and the corresponding chamber volume is likely an order of
magnitude greater - e.g. Mastin et al. (2008) suggested at least several to a few tens km3. Thus their result
is incorrect by an order of magnitude, which probably reflects simplifications introduced in their generic
models, and parameter choices.
The peak discharge rate at MSH during the eruption period from 1981–1982 is ~12 m3/s. The
magma chamber depth (Lc) is estimated at ~7200 m (Pallister et al., 1992).The crystal density per unit
volume (nch) at chamber conditions is set as 1014
m-3
, consistent with the observations of
microphenocrysts in the lava samples from the dome eruptions of 1980–1986 (Cashman and Blundy,
2000). The crystal content in the magma chamber (ϕch) is taken at 30% , and assuming a rhyolitic melt at
9000C with 5 wt% H2O (Cashman and Blundy, 2000), the estimated chamber viscosity is 6.4 x 10
4Pa.s
(Barmin et al., 2002). Following Barmin et al.(2002), the average lower conduit magma viscosity is taken
as 10 times higher than chamber viscosity, which is µ1 = 6.4 x 10⁵ Pa.s. Above the transition depth, we
use µ2 = 3.38 x 10⁷ Pa.s, using Barmin et al.(2002) initial estimate of viscosity ratio of 52.7 instead of
their best-fit value of 80. The conduit radius (rc) is estimated at 10 ± 2.5 m from observation of the
October 1980 dome, and also from ascent velocities based on amphibole reaction rims (Anderson and
Fink, 1990; Swanson and Holcomb, 1990; Rutherford and Hill, 1993). The conduit radius (rc) is set at 9
m. The crystal content at which the transition in the viscosity occurs, is assumed at ϕT = 0.7 for a crystal
growth rate (χ) of 1.475 x 10⁻¹²
m/s. The remaining parameters in the simulation are maintained constant
as listed in Table 4.
Figure 8 shows the variations in periodic behavior for two different assumed chamber volumes 0.1
and 0.56 km3. Note that the periodicity is about 1.5 days for a chamber volume of 0.1 km
3, and about 9
days for a volume of 0.56 km3, demonstrating the sensitivity of period on assumed chamber volume. For
each case we also demonstrate that the analytical solution results can be matched by the particle-
mechanics modeling. Thus the style of periodicity in our models successfully matches the general style of
periodicity observed at MSH (see e.g. Barmin et al.(2002), Fig. 5a). However the lengths of period
observed in our models are shorter than at MSH, due to our need to adjust parameters to shorten the
calculation run times. Multiple runs are made for the pair of different values of viscosity ratio,
replenishment rate and magma chamber volume to obtain the optimum possible simulation run time and
minimum deviation from the values obtained in the study by Barmin et al., (2002).
For the particle-mechanics model, the evolution of yield strength (τp) with flow rate due to the
change in magma crystal content is shown in Figure 9. Magma yield strength increases with an increase in
crystal content and is larger at lower flow rates due to greater loss of volatiles. The effect of
crystallization on bulk viscosity, coupled with magma replenishment to the chamber, creates a cyclic
pattern between chamber pressure and flow rate. Figure 10 shows the cyclic behavior for the assumed
chamber volume of 0.1 km3.
Downloaded from https://academic.oup.com/gji/advance-article-abstract/doi/10.1093/gji/ggy073/4904177by Serial Record useron 21 March 2018

The steady state solution in Figure 10 is divided into 3 parts, comprising the flow regime above X2,
the section between X2 - X1 and the region below X1. Flow rates greater than X2 (Figure 10) are
characterized by the extrusion of magma with lower crystal content, which results in lower magma bulk
viscosity. The conduit resistance for flow rates smaller than X1 is larger due to the relatively high
viscosity for magma with higher crystal content. The nature of the periodic behavior (duration of the
pulse and time difference between successive pulses) is governed by the value of Qin. For values of Qin
greater than X2 and smaller than X1, Qout stabilizes with time. If Qin is between X1 and X2, then a periodic
behavior as represented by Figure 8 is observed (Barmin et al., 2002; Melnik and Sparks, 2005). The drop
in flow rate labelled as Point Y1 in Figure 8 is influenced by the values of X1 and X2, which govern the
nature of the flow regime from Qin = 0 to Qin = X2.
Figure 11 illustrates the variation in magma crystal content at the conduit exit and the resulting
evolution of yield strength for the flow history shown in Figure 8. Particle-mechanics simulations using
parameters in Table 3 were performed for magma with different assumed interparticulate resistance (τ0 =
0.1 and 0.4 MPa). The variations in magma yield strength for the flow rates specified in Figure 8 are
linked to the snapshots (labelled A – J) in Figures 12 and 13. These figures show the simulated dome
morphologies at selected times during the first four flow pulses, with the left and right panels using
different assumed values of interparticulate resistance (τ0).
The magma rheologies are manifest in the dome morphology of the simulated lava domes. In
principle, comparisons could be made to field observations linked to observed extrusion rates (Figure 8,
10, 12 and 13).
In Figure 12, the initial flow rate is low due to resistance of the high-viscosity, degassed and highly
crystalline magma in the upper section of the conduit. Following extrusion, the flow rate peaks at ~12
m3/s. Point A in Figure 11 represents post-extrusion of the plug and low yield strength magma at high
flow rate, which generates endogenous dome growth (Point A in Figure 12, for τ0 = 0.1 MPa). The
extrusion rate drops (Figure 8) as ascending magma crystallizes (Figure 11), increasing bulk viscosity.
The erupting pulse of relatively low-crystal fraction magma ends at 1.75 days (pulse duration 0.25 days)
initiating regeneration of a viscous plug in the upper conduit. The viscous plug is extruded at a low flow
rate (Qout ~ 0.34 m3/s) leading generation of an internal shear lobe, Point B in Figure 12.
With each pulse of extruded magma, the chamber pressure decreases and reaches the value
represented by X2, subsequently ramping up to X1 with replenishment of the magma chamber (Figure 10).
The extrusion rates drop with development of a conduit plug (Figure 10). Following plug extrusion,
lower-viscosity magma is infused into the lava dome resulting in endogenous dome growth, Point C (t =
3.3 days, Qout ~ 3.15 m3/s). The dome evolves in a similar repetitive manner for the recurring cycles of
eruption, with the right-hand panels showing more mound-like protrusions in dome morphology,
reflecting locally stiffer magma and perhaps the surface expression of more-coherent shear lobes.
Following the third pulse, an exogenous spine has developed in the higher-strength magma,
punching through the dome surface with a push from underlying low-viscosity magma (Point E, Figure
13). The next pulse follows the same pattern, with a stiff spine developing endogenously at low flow rates
(Point G, Figure 13), which topples to the dome surface (Point H, Figure 13).The extrusion of the toppled
spine is aided by a push by low-viscosity conduit magma (Points I, J in Figure 13).
Downloaded from https://academic.oup.com/gji/advance-article-abstract/doi/10.1093/gji/ggy073/4904177by Serial Record useron 21 March 2018
The magma rheologies are manifest in the dome morphology of the simulated lava domes. In
principle, comparisons could be made to field observations linked to observed extrusion rates (Figure 8,
10, 12 and 13), being mindful of the difference between our simulation periodicity of 1.5 days and the 70-
day periods typically observed at MSH (Swanson and Holcomb, 1990).The typical dome configurations
bear many similarities to MSH observations, where surface textures changed with time and degree of
movement, becoming rougher and exhibiting mounds and occasional short-lived spines Moore et al.,
1981; Anderson and Fink, 1990).
One measure of average dome shape is the height-depth (h/d) aspect ratio, and for the MSH
composite domes between December 1980 and late 1986, the range of h/d ratios was 0.23 to 0.29, with
the mean about 0.27 (Swanson et al., 1990). The earlier data between December 1980 and April 1981
suggested the range 0.23-0.25.
In comparison, the post-pulse simulations (snapshots B, E, G, J; Figures 12,13) give h/d ratios of
0.21, 0.20, 0.18, 0.19 for the four low-strength pulses, and 0.25, 0.23, 0.24 (0.18 without spine), 0.23 for
the high-strength pulses. Two values are given for the G high-strength snapshot, the first equating dome
height with the height of spine, and the second on overall dome height discounting the spine. Overall the
latter group matching best with the MSH field data.
An interesting result from our simulations is that the dome aspect ratio changes with time,
indicating sagging and spreading. This is shown for h/d between post-pulse 2 snapshots D and E (0.22
0.20, and 0.26 0.23, respectively for low-strength and high-strength cases. Similarly, for post-pulse 3,
snapshots F and G show 0.23 0.18 for the low-strength case, and 0.27 0.24 (with spine) and 0.21
0.18 (discounting spine) for the high-strength case. The sagging actually starts while the pulse is in
progress, as shown for pulse 4, where Point I gives geometry near the peak of pulse, and Point J
represents pulse termination (Figures 10, 13); the ratio changes are 0.22 0.19, 0.23 0.22 for the two
strength cases, with further adjustments aborted by run termination. These changes are observed visually
in Figures 12 and 13, indicated by reduced dome heights and broadened diameters, and by flattening or
depressing of the dome top (e.g., a depression is shown in low-strength J in Figure 13).
Field observations at MSH confirm the occurrence of such phenomena. Particularly good
documentation is given by Moore et al. (1981) for the dome which began growth on the afternoon of
October 18. The dome was first observed an hour after the last of a series of explosions that occurred
between October 16 and 1428 October 18 (Moore, J. G., Lipman, P. W., Swanson, D. A., & Alpha,
1981). At 1520 a new dome was observed, about 5 m high and 25 m across. An hour later it was 10 m
high and 40 m wide, and by 0925 on October 19 the dome was sub-circularin plan with a radius of 92.5 m
and a height of 50 m. The surface was convex-upward, cut by deep cracks with incandescent walls.
Theodolite measurements were initiated at 1030 on 19 October and documented changes in shape and
dimensions over the next several days (Moore et al., 1981): “The dome subsided more than 18 m and
widened more than 15 m (in some places more than 19 m) between October 19 and 27. These changes
took place at a rate of ~2.1 m/hr on October 19 which nearly stopped by October 27. During this period,
the shape of the dome changed markedly and finally acquired a nearly flat top with a small depression
near its center. Large cracks, as deep as 5-7 m, radiated from this depression similar to spokes on a
wheel. A single spire rose 3-4 m above the general surface.”
Downloaded from https://academic.oup.com/gji/advance-article-abstract/doi/10.1093/gji/ggy073/4904177by Serial Record useron 21 March 2018
The final diameter (27 October) of the sub-circular dome was about 225 m, with its height above
the crater floor about 37 m. From these data the h/d ratio is about 0.16, reduced in 8 days from
approximately 0.27 on October 19. This ratio change is similar to our simulation results, making
allowance for the additional time over which subsidence occurred at MSH.
The change can be attributed to gravitational spreading facilitated by a viscous dome interior with
movements limited by magma yield strength and talus friction resistance, and degassing of the dome core
and magma column. Similar morphologic changes with dome-top subsidence have been reported
elsewhere such as at Merapi in Java (Voight et al., 2000).
Moore et al. (1981) proposed that the initiation of subsidence probably reflects the cessation of
extrusion and the stagnation of the magma column, and while these factors are important to sagging and
spreading, our simulations show that the process can start even before extrusion shuts down (snapshots I,
J; Figure 13).
The low aspect ratio (h/d) for the MSH lava dome of October 1980, may suggest a thin crust
overlying a hot interior (Swanson and Holcomb, 1990) and strength even less than for our low-strength
model. The main explanation may be that this extrusion followed on the heels of an explosive eruption,
without time for a conduit plug to develop. An alternative explanation is that this magma was slightly
more mafic and thus of lower viscosity (Lipman et al., 1981), but this difference in chemistry is not
confirmed by Cashman et al., (1983).
4.3. Flow rate controls on growth styles
Observations at volcanoes such as SHV and MSH indicate that specific dome growth styles occur for
specific ranges of flow rates (Blake, 1990; Griffiths and Fink, 1997; Stasiuk and Jaupart, 1997; Griffiths,
2000; Sparks et al., 2000; Watts et al., 2002; Cashman et al., 2008; Hale and Wadge, 2008; Mastin et al.,
2008; Anderson and Segall, 2011). New magma is supplied to the dome periodically from the magma
chamber as pulses, and push out conduit plugs that developed from rheological stiffening at low flow
rates, due to degassing induced crystallization. The plug develops at low flow rates (values below X1,
Figure 10) and slowly extrudes, Points B, E in Figure 12; Point G, Figure 13.
The extent of rise of the viscous plug within the dome structure is governed by the rate at which
flow rate increases in the region below X1 in Figure 10. The rate of change of flow rate with chamber
pressure is governed by the viscosity ratio µ2/µ1, the volume of the magma chamber and the magma yield
strength for specified values of ϕ and ϕT representing a magma chamber at a given depth. The ratio µ2/µ1
defines the magnitude of the increase of flow rate with time, while the volume of the magma chamber
controls the duration for which the flow rate remains below X1. For a smaller magma chamber volume
and lower ratio of µ2/µ1 the value of X1 is greater and is reached at a faster rate, which results in a smaller
magma plug with lower viscosity. A stiffer, more degassed plug is extruded for a longer time, for a larger
magma chamber with a higher µ2/µ1 ratio.
The viscous plug can extrude exogenously as a spine of solidified magma, but for lower yield
strength it is more prone to remain within the dome as an endogenous element. Point F in Figure 13
illustrates that magma with τ0 = 0.4 MPa exhibits exogenous spine growth and endogenous for τ0 = 0.1
Downloaded from https://academic.oup.com/gji/advance-article-abstract/doi/10.1093/gji/ggy073/4904177by Serial Record useron 21 March 2018

MPa. Exogenous growth is observed at flow rates (Qout) < 2 m3/s for τ0 > 3 x 10
5 Pa, while for higher flow
rates (2 < Qout < 12 m3/s), endogenous growth of a ductile core occurs, e.g. Point C, Figure 12 and Point I,
Figure 13.
Point Y1 in Figure 8 plays a crucial role in determining the growth of a viscous plug. A lower value
(Qout < 2 m3/s for τ0 = 0.4MPa) of X2 in Figure 10, represented by Point Y1 in Figure 8, results in the
transition in growth style from endogenous with ductile core, to shear lobe generation with higher crystal
content and yield strength. Endogenous dome growth is observed in the simulation runs for higher flow
rates (Qout > 2 m3/s) for both values of τ0, whereas exogenous spine extrusion occurs at low flow rates
(Qout < 1 m3/s) for τ0 > 0.3 MPa.
5. CONCLUSIONS
We have developed a 2-D particle-mechanics model coupled to equations representing transient
conduit flow dynamics. The model accounts for degassing-induced crystallization and variation in crystal
content (ϕ) of ascending magma, which influences the magma rheology. The model provides an
understanding of the underlying effect of periodic eruptive activity on the evolving morphology of a
synthetic lava dome. Dome growth styles are observed to be sensitive to magma yield strength, which is a
function of the interparticulate resistance and crystal content of the magma (ϕ), where ϕ is controlled by
the magma ascent rate. The transition in magma flow patterns is governed by the interplay of flow rate
and magma yield strength, which in turn govern the morphology and spatially-varying material properties
of the resulting composite lava dome.
Degassing-induced crystallization is promoted at low flow rates, which leads to the development of
degassed lava plugs and shear lobes. Our results demonstrate the effect of magma yield strength and
varying flow rates on magma rheology. Intermittent spine generation is observed during the evolution of a
synthetic lava dome with the properties representing SHV for Qout < 2 m3/s and τ0 > 0.2 MPa, as shown in
Figure 5 and 7. Endogenous shear lobes are developed at higher flow rates (6 m3/s > Qout > 2 m
3/s), where
the magma crystal content (ϕ) is relatively lower, as shown in Figures 5 and 7 for magma with τ0 = 0.25
and 0.6 MPa respectively. Evolution of a synthetic lava dome with a ductile core occurs over a range of
flow rates (Qout = 2 to 8 m3/s) that depend on the yield strength of the magma. The lava dome grows
endogenously with a soft core for the entire range of flow rates (Qout = 0.5 to 8 m3/s) for τ0 = 0.1 MPa and
a ductile core is observed to evolve at Qout ≥ 2 m3/s for τ0 ≥ 0.25 MPa.
Our results are able to reproduce periodicity of eruptive activity, and to define its effect on the
morphologic evolution of the dome structure. The style of periodicity in our models successfully match
the general style of periodicity observed at MSH (see e.g. Barmin et al., 2002, Fig. 5a; Swanson et al.,
1990). However the lengths of period observed in our models are shorter than at MSH, due to our need to
adjust parameters to shorten the calculation run times. The model is capable of reproducing generic
sequences showing repeated pulsation with associated rheological changes. We show that the magma
chamber volume, interparticulate resistance and ratio of magma viscosity (µ2/µ1) significantly affect the
evolving structure of the lava dome. Magma is simulated to erupt in pulses, as observed in the periodic
dome growth activity at SHV and MSH. The erupted magma experiences cycles of rheological stiffening
due to degassing-induced crystallization during the reduced flow rates between distinct pulses of high
extrusive activity (Figure 8). For a smaller magma chamber with larger value of X1 (smaller µ2/µ1 ratio) a
Downloaded from https://academic.oup.com/gji/advance-article-abstract/doi/10.1093/gji/ggy073/4904177by Serial Record useron 21 March 2018
shear lobe develops endogenously for an erupting magma with lower value of τ0 (> 0.4 MPa). The extent
of the growth is defined by the duration between successive pulses (time between Points Y1 and Y2 in
Figure 8). Spine growth is observed for larger magma chambers with lower values of X1 (< 1 m3/s) and
magma with greater values of τ0 (> 0.4 MPa) where the time difference between points Y1 and Y2 (Figure
8) is longer. It is observed that pressure builds up in the magma chamber at lower flow rates (Qout), with
these low flow rates causing rheological stiffening of the extruding magma. The result is the development
of a viscous plug in the upper conduit that is pushed out by a new pulse of fresh magma.
An important result is that our simulated domes tend to sag and spread following extrusion pulses,
with the process actually initiating during the extrusion. The process, which reflects a viscous dome core
with retardation by yield strength and talus friction, can be detected visually as reduced dome heights and
broadened diameters, represented by dome h/d aspect ratios that reduce with time. For example such
changes are shown for post-pulse 2 snapshots D and E (h/d ratios 0.22 0.20 and 0.26 0.23,
respectively for low-strength and high-strength cases). For post-pulse 3, snapshots F and G (h/d 0.23
0.18 for the low-strength case, while 0.27 0.24 (with spine) and 0.21 0.18 (discounting spine) for
the high-strength case). Field observations at MSH and elsewhere document the occurrence of such
phenomena (Moore et al., 1981; Voight et al., 2000).
Acknowledgements: This work is a partial result of support from NASA under grant NASA-
NNX11AC03G. This support is gratefully acknowledged. The work would not have happened without
additional research support given to Barry Voight, Glen Mattioli and Derek Elsworth by the NSF and
UAVCO in the USA and in the UK. Barry Voight also appreciates support from the US Geological
Survey for his work at Mount St. Helens, and the British Geological Survey and UK Foreign and
Commonwealth Office for work on Montserrat. Thoughtful reviews by Oleg Melnik and Benoît Taisne
contributed to the final manuscript.
REFERENCES
Anderson, K. and Segall, P. (2011) „Physics-based models of ground deformation and extrusion rate at
effusively erupting volcanoes‟, Journal of Geophysical Research: Solid Earth, 116(B7), p. B07204. doi:
10.1029/2010JB007939.
Anderson, S. W. and Fink, J. H. (1990) „The development and distribution of surface textures at the
Mount St. Helens dome‟, in Fink, J. (ed.) Lava Flows and Domes SE - 2. Springer Berlin Heidelberg
(IAVCEI Proceedings in Volcanology), pp. 25–46. doi: 10.1007/978-3-642-74379-5_2.
Barmin, A., Melnik, O. and Sparks, R. S. J. (2002) „Periodic behavior in lava dome eruptions‟, Earth and
Planetary Science Letters, 199(1–2), pp. 173–184. doi: 10.1016/S0012-821X(02)00557-5.
Blake, S. (1990) „Viscoplastic Models of lava domes‟, in Fink, J. (ed.) Lava Flows and Domes SE - 5.
Springer Berlin Heidelberg (IAVCEI Proceedings in Volcanology), pp. 88–126. doi: 10.1007/978-3-642-
74379-5_5.
Buisson, C. and Merle, O. (2002) „Experiments on internal strain in lava dome cross sections‟, Bulletin of
Volcanology. Springer-Verlag, 64(6), pp. 363–371. doi: 10.1007/s00445-002-0213-6.
Cashman, K. and Blundy, J. (2000) „Degassing and crystallization of ascending andesite and dacite‟,
Downloaded from https://academic.oup.com/gji/advance-article-abstract/doi/10.1093/gji/ggy073/4904177by Serial Record useron 21 March 2018

Philosophical Transactions of the Royal Society of London. Series A:
Mathematical, Physical and Engineering Sciences , 358(1770), pp. 1487–1513. doi:
10.1098/rsta.2000.0600.
Cashman, K. V., Thornber, C. R. and Pallister, J. S. (2008) „From dome to dust: Shallow crystallization
and fragmentation of conduit magma during the 2004–2006 Dome Extrusion of Mount St. Helens,
Washington‟, in Sherrod, D. R., Scott, W. E., and Stauffer, P. H. . (eds) A Volcano Rekindled : The
Reneed Eruption of Mount St. Helens, 2004 - 2006. U. S. Geological Survey, pp. 387–413.
Costa, A. (2005) „Viscosity of high crystal content melts: Dependence on solid fraction‟, Geophysical
Research Letters, 32(22), p. L22308. doi: 10.1029/2005GL024303.
Costa, A., Melnik, O. and Sparks, R. S. J. (2007) „Controls of conduit geometry and wallrock elasticity on
lava dome eruptions‟, Earth and Planetary Science Letters, 260(1–2), pp. 137–151. doi:
10.1016/j.epsl.2007.05.024.
Couch, S. et al. (2003) „Experimental constraints on the conditions of formation of highly calcic
plagioclase microlites at the Soufrire Hills Volcano, Montserrat‟, Journal of Petrology, 44(8), pp. 1455–
1475. doi: 10.1093/petrology/44.8.1455.
Cundall, P. A. and Strack, O. D. L. (1979) „A discrete numerical model for granular assemblies‟,
Geotechnique, 29(1), pp. 47–65.
Denlinger, R. P. and Hoblitt, R. P. (1999) „Cyclic eruptive behavior of silicic volcanoes‟, Geology , 27(5),
pp. 459–462. doi: 10.1130/0091-7613(1999)027<0459:CEBOSV>2.3.CO;2.
Elsworth, D. et al. (2008) „Implications of magma transfer between multiple reservoirs on eruption
cycling‟, Science , 322(5899), pp. 246–248. doi: 10.1126/science.1161297.
Foroozan, R. et al. (2010) „Dual reservoir structure at Soufrière Hills Volcano inferred from continuous
GPS observations and heterogeneous elastic modeling‟, Geophysical Research Letters, 37(19), p.
L00E12. doi: 10.1029/2010GL042511.
Griffiths, R. W. (2000) „The dynamics of lava flows‟, Annual Review of Fluid Mechanics. Annual
Reviews, 32(1), pp. 477–518. doi: 10.1146/annurev.fluid.32.1.477.
Griffiths, R. W. and Fink, J. H. (1997) „Solidifying Bingham extrusions: a model for the growth of silicic
lava domes‟, Journal of Fluid Mechanics, 347, pp. 13–36.
Hale, A. J. (2007) „Magma flow instabilities in a volcanic conduit: Implications for long-period
seismicity‟, Physics of the Earth and Planetary Interiors, 163(1–4), pp. 163–178. doi:
10.1016/j.pepi.2007.05.001.
Hale, A. J. (2008) „Lava dome growth and evolution with an independently deformable talus‟,
Geophysical Journal International , 174(1), pp. 391–417. doi: 10.1111/j.1365-246X.2008.03806.x.
Hale, A. J., Bourgouin, L. and Mühlhaus, H. B. (2007) „Using the level set method to model endogenous
lava dome growth‟, Journal of Geophysical Research: Solid Earth, 112(B3), p. B03213. doi:
10.1029/2006JB004445.
Hale, A. J. and Wadge, G. (2008) „The transition from endogenous to exogenous growth of lava domes
with the development of shear bands‟, Journal of Volcanology and Geothermal Research, 171(3–4), pp.
237–257. doi: 10.1016/j.jvolgeores.2007.12.016.
Hammer, J. E. and Rutherford, M. J. (2002) „An experimental study of the kinetics of decompression-
induced crystallization in silicic melt‟, Journal of Geophysical Research: Solid Earth, 107(B1), p. ECV
8-1-ECV 8-24. doi: 10.1029/2001JB000281.
Hess, K. U. and Dingwell, D. B. (1996) „Viscosities of hydrous leucogranitic melts: A non-Arrhenian
model‟, American Mineralogist, 81(9–10), pp. 1297–1300.
Downloaded from https://academic.oup.com/gji/advance-article-abstract/doi/10.1093/gji/ggy073/4904177by Serial Record useron 21 March 2018

Hort, M. (1998) „Abrupt Change in magma liquidus temperature because of volatile loss or magma
mixing: Effects on nucleation, crystal growth and thermal history of the magma‟, Journal of Petrology ,
39(5), pp. 1063–1076. doi: 10.1093/petroj/39.5.1063.
Huppert, H. E. et al. (1982) „On lava dome growth, with application to the 1979 lava extrusion of the
soufrière of St. Vincent‟, Journal of Volcanology and Geothermal Research, 14(3–4), pp. 199–222. doi:
10.1016/0377-0273(82)90062-2.
Huppert, H. E. and Woods, A. W. (2002) „The role of volatiles in magma chamber dynamics‟, Nature.
Macmillian Magazines Ltd., 420(6915), pp. 493–495. Available at:
http://dx.doi.org/10.1038/nature01211.
Husain, T. et al. (2014) „Influence of extrusion rate and magma rheology on the growth of lava domes:
Insights from particle-dynamics modeling‟, Journal of Volcanology and Geothermal Research, 285, pp.
100–117. doi: 10.1016/j.jvolgeores.2014.08.013.
Jaupart, C. and Tait, S. (1990) „Dynamics of eruptive phenomena‟, Reviews in Mineralogy and
Geochemistry , 24(1), pp. 213–238. Available at:
http://rimg.geoscienceworld.org/content/24/1/213.abstract.
Lavallée, Y. et al. (2007) „Non-Newtonian rheological law for highly crystalline dome lavas‟, Geology ,
35(9), pp. 843–846. doi: 10.1130/G23594A.1.
Lejeune, A.-M. and Richet, P. (1995) „Rheology of crystal-bearing silicate melts: An experimental study
at high viscosities‟, Journal of Geophysical Research: Solid Earth, 100(B3), pp. 4215–4229. doi:
10.1029/94JB02985.
Lipman, P.W.; Norton, D. R.; Taggart, J. E.; Brandt, E. L.; Engleman, E. E. . (1981) „Compositional
variation in 1980 magmatic deposits‟, in The 1980 Eruption of Mount St. Helens, Washington. 1250th
edn. United States Geological Survey Professional Paper, pp. 631–640.
Lyman, A. W., Kerr, R. C. and Griffiths, R. W. (2005) „Effects of internal rheology and surface cooling
on the emplacement of lava flows‟, Journal of Geophysical Research: Solid Earth, 110(B8), p. B08207.
doi: 10.1029/2005JB003643.
Marsh, B. D. (1998) „On the interpretation of crystal size distributions in magmatic systems‟, Journal of
Petrology , 39(4), pp. 553–599. doi: 10.1093/petroj/39.4.553.
Mastin, L. G. (2002) „Insights into volcanic conduit flow from an open-source numerical model‟,
Geochemistry, Geophysics, Geosystems, 3(7), pp. 1–18. doi: 10.1029/2001GC000192.
Mastin, L. G. et al. (2008) „Constraints on the size, overpressure, and volatile content of the Mount St.
Helens magma system from geodetic and dome-growth measurements during the 2004–2006 Eruption‟,
in Sherrod, D. R., Sherrod, W. E., and Sherrod, P. H. (eds) A Volcano Rekindled: The Renewed Eruption
of Mount St. Helens, 2004–2006. U. S. Geological Survey, pp. 461–488.
Melnik, O. and Sparks, R. S. J. (1999) „Nonlinear dynamics of lava dome extrusion‟, Nature. Macmillian
Magazines Ltd., 402(6757), pp. 37–41. Available at: http://dx.doi.org/10.1038/46950.
Melnik, O. and Sparks, R. S. J. (2002) „Dynamics of magma ascent and lava extrusion at Soufrière Hills
Volcano, Montserrat‟, Geological Society, London, Memoirs , 21(1), pp. 153–171. doi:
10.1144/GSL.MEM.2002.021.01.07.
Melnik, O. and Sparks, R. S. J. (2005) „Controls on conduit magma flow dynamics during lava dome
building eruptions‟, Journal of Geophysical Research: Solid Earth, 110(B2), p. B02209. doi:
10.1029/2004JB003183.
Moore, J. G., Lipman, P. W., Swanson, D. A., & Alpha, T. R. (1981) „Growth of lava domes in the crater,
June 1980-January 1981‟, in The 1980 Eruptions of Mount St. Helens, Washington. 1250th edn. United
States Geological Survey Professional Paper, pp. 541–547.
Downloaded from https://academic.oup.com/gji/advance-article-abstract/doi/10.1093/gji/ggy073/4904177by Serial Record useron 21 March 2018
Morgan, J. K. and McGovern, P. J. (2005a) „Discrete element simulations of gravitational volcanic
deformation: 1. Deformation structures and geometries‟, Journal of Geophysical Research: Solid Earth,
110(B5), p. B05402. doi: 10.1029/2004JB003252.
Morgan, J. K. and McGovern, P. J. (2005b) „Discrete element simulations of gravitational volcanic
deformation: 2. Mechanical analysis‟, Journal of Geophysical Research: Solid Earth, 110(B5), p.
B05403. doi: 10.1029/2004JB003253.
Murase, T., McBirney, A. R. and Melson, W. G. (1985) „Viscosity of the dome of mount St. Helens‟,
Journal of Volcanology and Geothermal Research, 24(1–2), pp. 193–204. doi: 10.1016/0377-
0273(85)90033-2.
Odbert, H. M., Stewart, R. C. and Wadge, G. (2014) „Cyclic phenomena at the Soufrière Hills Volcano,
Montserrat‟, Geological Society, London, Memoirs , 39(1), pp. 41–60. doi: 10.1144/M39.2.
Pallister, J. et al. (1992) „Mount St. Helens a decade after the 1980 eruptions: magmatic models, chemical
cycles, and a revised hazards assessment‟, Bulletin of Volcanology. Springer-Verlag, 54(2), pp. 126–146.
doi: 10.1007/BF00278003.
Pinkerton, H. and Stevenson, R. J. (1992) „Methods of determining the rheological properties of magmas
at sub-liquidus temperatures‟, Journal of Volcanology and Geothermal Research, 53(1–4), pp. 47–66.
doi: 10.1016/0377-0273(92)90073-M.
Rutherford, M. J. and Hill, P. M. (1993) „Magma ascent rates from amphibole breakdown: An
experimental study applied to the 1980–1986 Mount St. Helens eruptions‟, Journal of Geophysical
Research: Solid Earth, 98(B11), pp. 19667–19685. doi: 10.1029/93JB01613.
Saar, M. O. et al. (2001) „Numerical models of the onset of yield strength in crystal–melt suspensions‟,
Earth and Planetary Science Letters, 187(3–4), pp. 367–379. doi: 10.1016/S0012-821X(01)00289-8.
Shaw, H. R. (1965) „Comments on viscosity, crystal settling, and convection in granitic magmas‟,
American Journal of Science , 263(2), pp. 120–152. doi: 10.2475/ajs.263.2.120.
Simmons, J., Elsworth, D. and Voight, B. (2005) „Classification and idealized limit-equilibrium analyses
of dome collapses at Soufrière Hills volcano, Montserrat, during growth of the first lava dome: November
1995–March 1998‟, Journal of Volcanology and Geothermal Research, 139(3–4), pp. 241–258. doi:
10.1016/j.jvolgeores.2004.08.009.
Sparks et al. (2000) „Control on the emplacement of the andesite lava dome of the Soufriere Hills
volcano, Montserrat by degassing-induced crystallization‟, Terra Nova. Blackwell Science Ltd, 12(1), pp.
14–20. doi: 10.1046/j.1365-3121.2000.00267.x.
Sparks, R. S. J. (1997) „Causes and consequences of pressurisation in lava dome eruptions‟, Earth and
Planetary Science Letters, 150(3–4), pp. 177–189. doi: 10.1016/S0012-821X(97)00109-X.
Sparks, R. S. J. et al. (1998) „Magma production and growth of the lava dome of the Soufriere Hills
Volcano, Montserrat, West Indies: November 1995 to December 1997‟, Geophysical Research Letters,
25(18), pp. 3421–3424. doi: 10.1029/98GL00639.
Stasiuk, M. V. and Jaupart, C. (1997) „Lava flow shapes and dimensions as reflections of magma system
conditions‟, Journal of Volcanology and Geothermal Research, 78(1–2), pp. 31–50. doi: 10.1016/S0377-
0273(97)00002-4.
Swanson, D. A. and Holcomb, R. T. (1990) „Regularities in growth of the Mount St. Helens dacite dome,
1980–1986‟, in Fink, J. (ed.) Lava Flows and Domes SE - 1. Springer Berlin Heidelberg (IAVCEI
Proceedings in Volcanology), pp. 3–24. doi: 10.1007/978-3-642-74379-5_1.
Voight, B. et al. (1998) „Remarkable cyclic ground deformation monitored in real-time on Montserrat,
and its use in eruption forecasting‟, Geophysical Research Letters, 25, pp. 3405–3408. doi:
10.1029/98GL01160.
Downloaded from https://academic.oup.com/gji/advance-article-abstract/doi/10.1093/gji/ggy073/4904177by Serial Record useron 21 March 2018

Voight, B. et al. (1999) „Magma flow instability and cyclic activity at Soufriere Hills Volcano,
Montserrat, British West Indies‟, Science , 283(5405), pp. 1138–1142. doi:
10.1126/science.283.5405.1138.
Voight, B. et al. (2000) „Deformation and seismic precursors to dome-collapse and fountain-collapse
nuées ardentes at Merapi Volcano, Java, Indonesia, 1994–1998‟, Journal of Volcanology and Geothermal
Research, 100(1–4), pp. 261–287. doi: http://dx.doi.org/10.1016/S0377-0273(00)00140-2.
Wadge, G. et al. (2010) „Lava production at Soufrière Hills Volcano, Montserrat: 1995–2009‟,
Geophysical Research Letters, 37(19), p. L00E03. doi: 10.1029/2009GL041466.
Watts, R. B. et al. (2002) „Growth patterns and emplacement of the andesitic lava dome at Soufrière Hills
Volcano, Montserrat‟, Journal of Volcanology and Geothermal Research, 283(1), pp. 115–152. doi:
10.1126/science.283.5405.1138.
Young, S. R., Voight, B. and Duffell, H. J. (2003) „Magma extrusion dynamics revealed by high-
frequency gas monitoring at Soufrière Hills volcano, Montserrat‟, Geological Society, London, Special
Publications , 213(1), pp. 219–230. doi: 10.1144/GSL.SP.2003.213.01.13.
Downloaded from https://academic.oup.com/gji/advance-article-abstract/doi/10.1093/gji/ggy073/4904177by Serial Record useron 21 March 2018
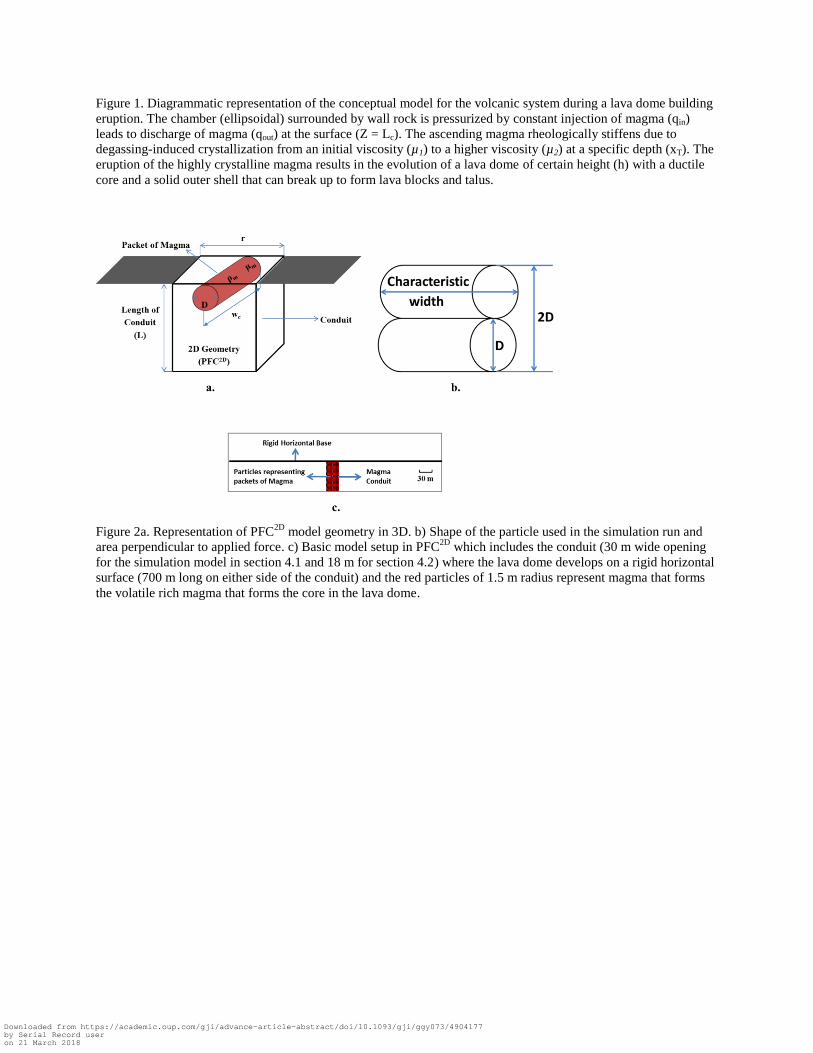
Figure 1. Diagrammatic representation of the conceptual model for the volcanic system during a lava dome building
eruption. The chamber (ellipsoidal) surrounded by wall rock is pressurized by constant injection of magma (qin)
leads to discharge of magma (qout) at the surface (Z = Lc). The ascending magma rheologically stiffens due to
degassing-induced crystallization from an initial viscosity (µ1) to a higher viscosity (µ2) at a specific depth (xT). The
eruption of the highly crystalline magma results in the evolution of a lava dome of certain height (h) with a ductile
core and a solid outer shell that can break up to form lava blocks and talus.
Figure 2a. Representation of PFC
2D model geometry in 3D. b) Shape of the particle used in the simulation run and
area perpendicular to applied force. c) Basic model setup in PFC2D
which includes the conduit (30 m wide opening
for the simulation model in section 4.1 and 18 m for section 4.2) where the lava dome develops on a rigid horizontal
surface (700 m long on either side of the conduit) and the red particles of 1.5 m radius represent magma that forms
the volatile rich magma that forms the core in the lava dome.
Downloaded from https://academic.oup.com/gji/advance-article-abstract/doi/10.1093/gji/ggy073/4904177by Serial Record useron 21 March 2018
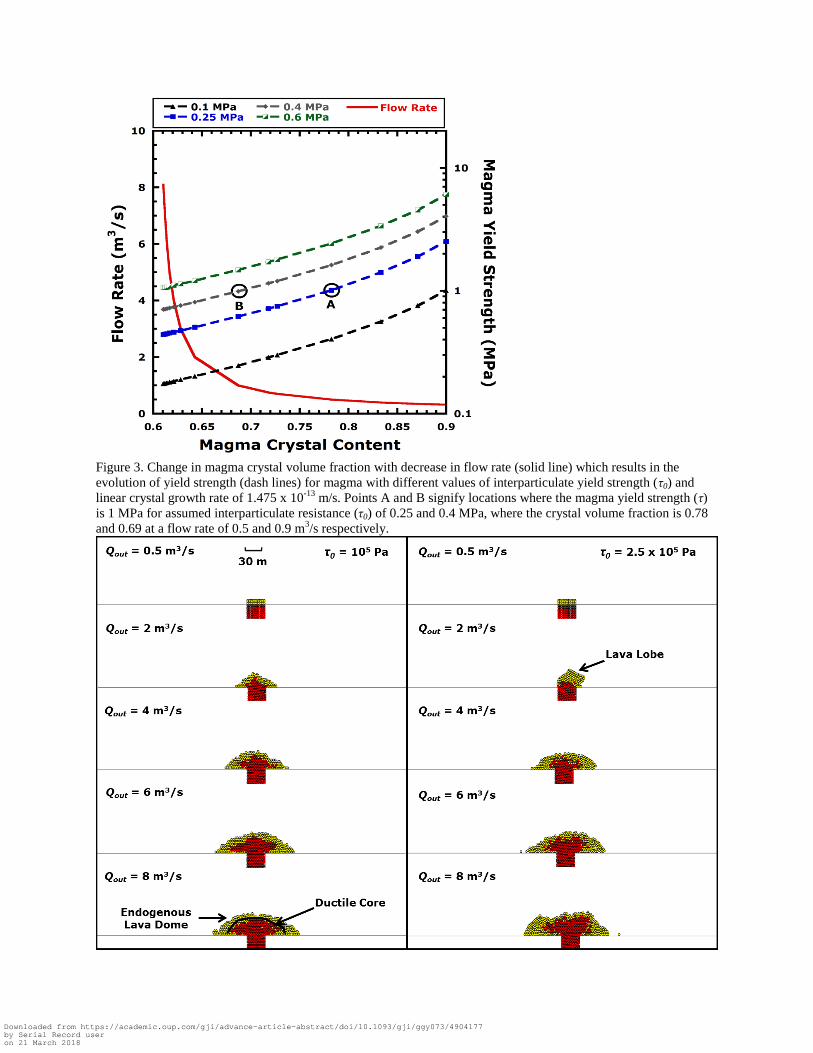
Figure 3. Change in magma crystal volume fraction with decrease in flow rate (solid line) which results in the
evolution of yield strength (dash lines) for magma with different values of interparticulate yield strength (τ0) and
linear crystal growth rate of 1.475 x 10⁻¹³
m/s. Points A and B signify locations where the magma yield strength (τ)
is 1 MPa for assumed interparticulate resistance (τ0) of 0.25 and 0.4 MPa, where the crystal volume fraction is 0.78
and 0.69 at a flow rate of 0.5 and 0.9 m3/s respectively.
Downloaded from https://academic.oup.com/gji/advance-article-abstract/doi/10.1093/gji/ggy073/4904177by Serial Record useron 21 March 2018
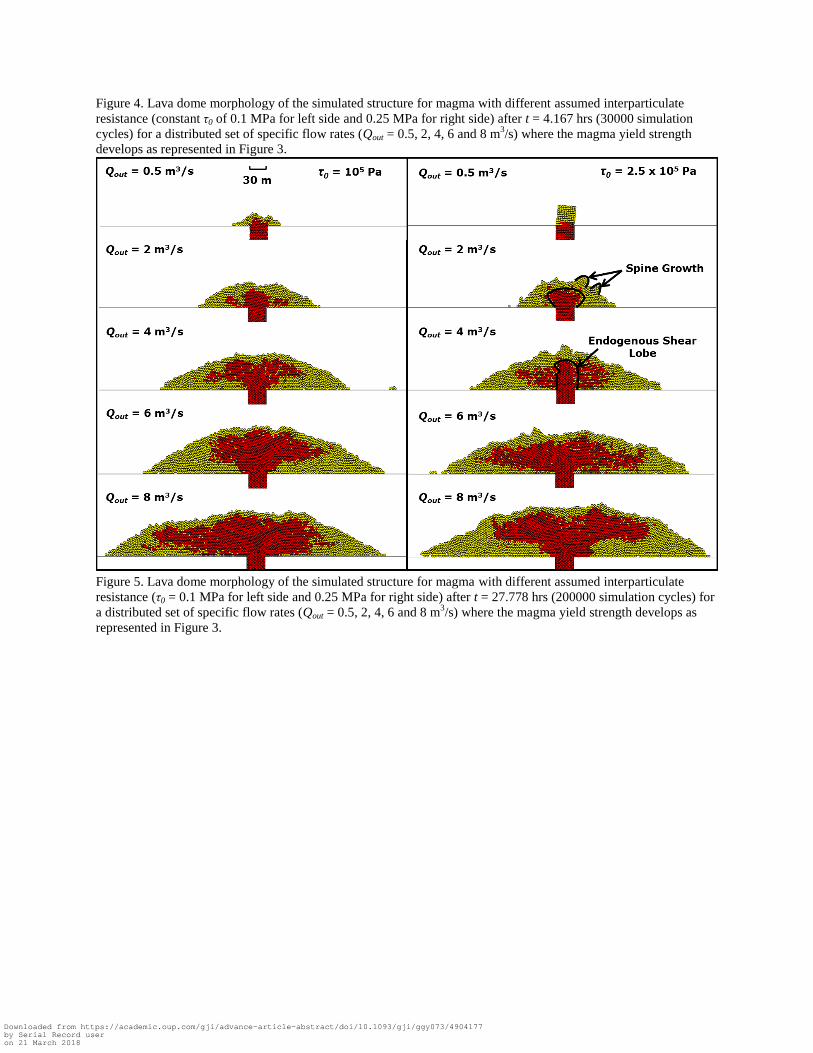
Figure 4. Lava dome morphology of the simulated structure for magma with different assumed interparticulate
resistance (constant τ0 of 0.1 MPa for left side and 0.25 MPa for right side) after t = 4.167 hrs (30000 simulation
cycles) for a distributed set of specific flow rates (Qout = 0.5, 2, 4, 6 and 8 m3/s) where the magma yield strength
develops as represented in Figure 3.
Figure 5. Lava dome morphology of the simulated structure for magma with different assumed interparticulate
resistance (τ0 = 0.1 MPa for left side and 0.25 MPa for right side) after t = 27.778 hrs (200000 simulation cycles) for
a distributed set of specific flow rates (Qout = 0.5, 2, 4, 6 and 8 m3/s) where the magma yield strength develops as
represented in Figure 3.
Downloaded from https://academic.oup.com/gji/advance-article-abstract/doi/10.1093/gji/ggy073/4904177by Serial Record useron 21 March 2018

Figure 6. Lava dome morphology of the simulated structure for magma with different assumed interparticulate
resistance (τ0 = 0.4 MPa for left side and 0.6 MPa for right side) after t = 4.167 hrs (30000 simulation cycles) for a
distributed set of specific flow rates (Qout = 0.5, 2, 4, 6 and 8 m3/s) where the magma yield strength develops as
represented in Figure 3.
Downloaded from https://academic.oup.com/gji/advance-article-abstract/doi/10.1093/gji/ggy073/4904177by Serial Record useron 21 March 2018
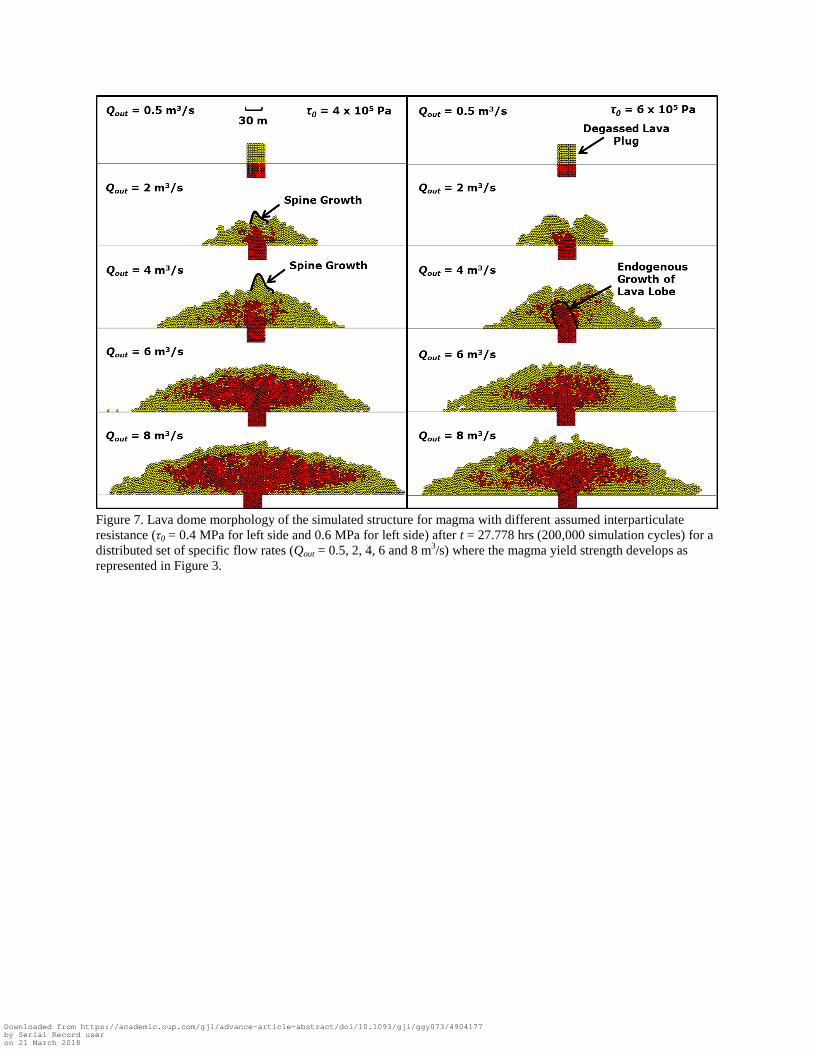
Figure 7. Lava dome morphology of the simulated structure for magma with different assumed interparticulate
resistance (τ0 = 0.4 MPa for left side and 0.6 MPa for left side) after t = 27.778 hrs (200,000 simulation cycles) for a
distributed set of specific flow rates (Qout = 0.5, 2, 4, 6 and 8 m3/s) where the magma yield strength develops as
represented in Figure 3.
Downloaded from https://academic.oup.com/gji/advance-article-abstract/doi/10.1093/gji/ggy073/4904177by Serial Record useron 21 March 2018
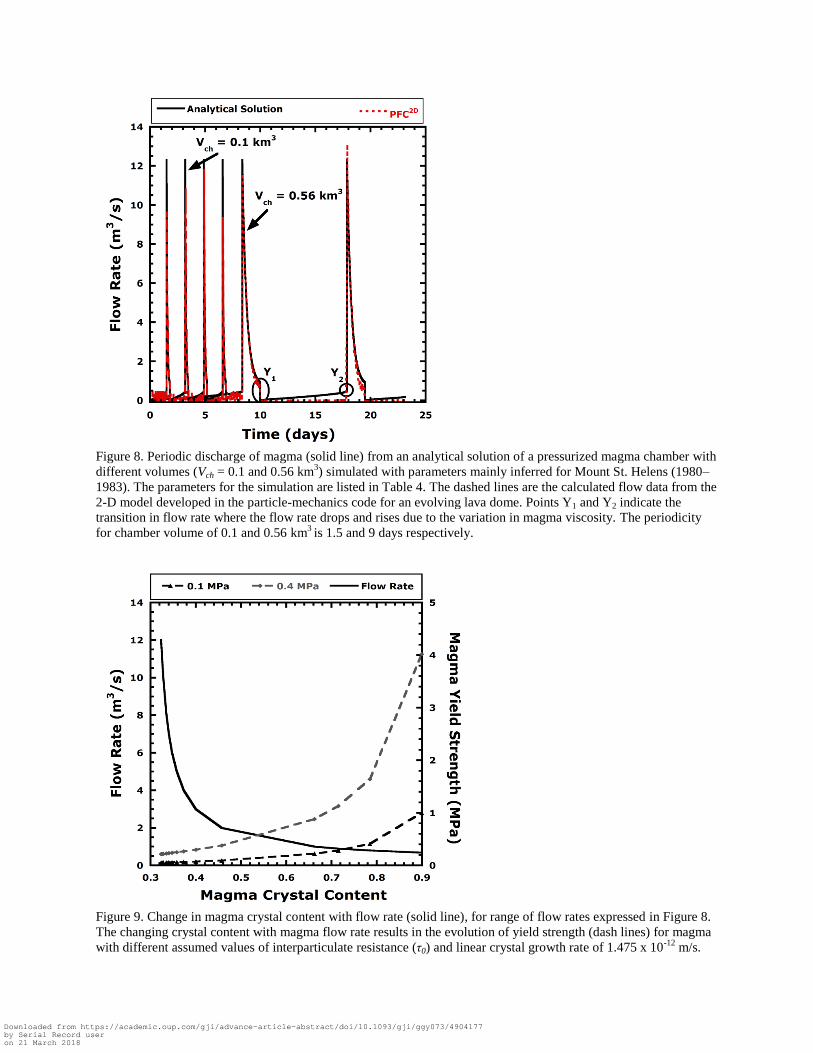
Figure 8. Periodic discharge of magma (solid line) from an analytical solution of a pressurized magma chamber with
different volumes (Vch = 0.1 and 0.56 km3) simulated with parameters mainly inferred for Mount St. Helens (1980–
1983). The parameters for the simulation are listed in Table 4. The dashed lines are the calculated flow data from the
2-D model developed in the particle-mechanics code for an evolving lava dome. Points Y1 and Y2 indicate the
transition in flow rate where the flow rate drops and rises due to the variation in magma viscosity. The periodicity
for chamber volume of 0.1 and 0.56 km3 is 1.5 and 9 days respectively.
Figure 9. Change in magma crystal content with flow rate (solid line), for range of flow rates expressed in Figure 8.
The changing crystal content with magma flow rate results in the evolution of yield strength (dash lines) for magma
with different assumed values of interparticulate resistance (τ0) and linear crystal growth rate of 1.475 x 10⁻¹²
m/s.
Downloaded from https://academic.oup.com/gji/advance-article-abstract/doi/10.1093/gji/ggy073/4904177by Serial Record useron 21 March 2018
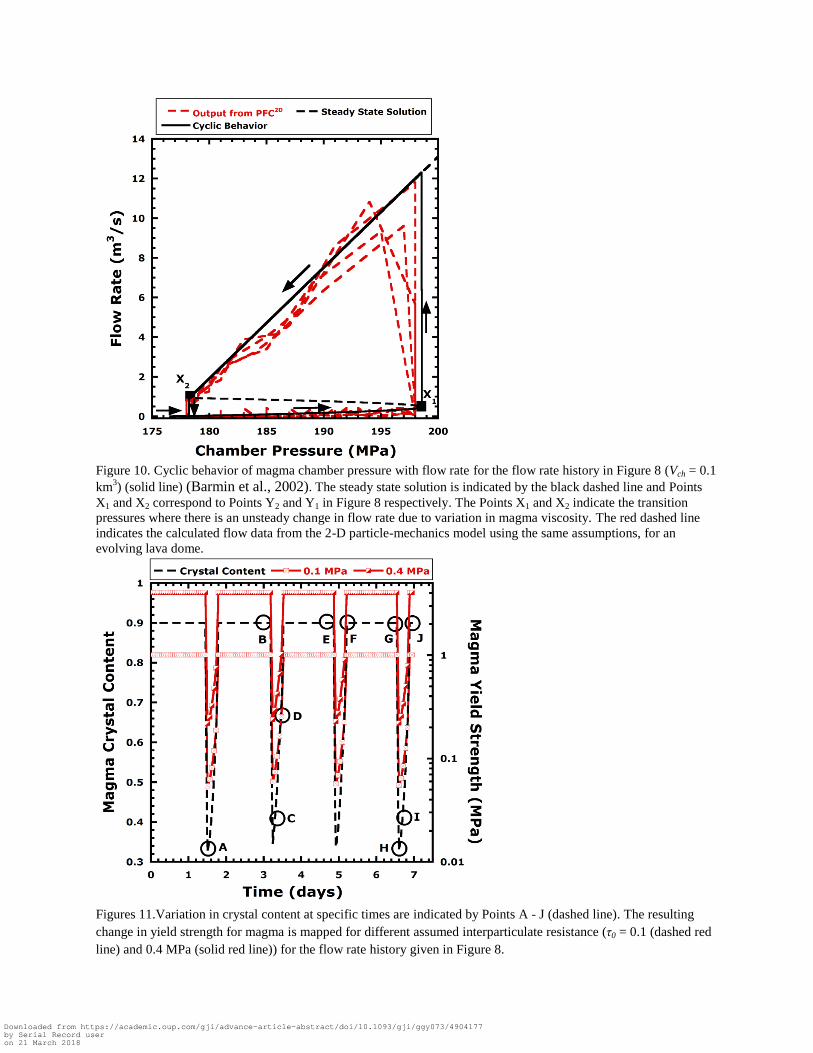
Figure 10. Cyclic behavior of magma chamber pressure with flow rate for the flow rate history in Figure 8 (Vch = 0.1
km3) (solid line) (Barmin et al., 2002). The steady state solution is indicated by the black dashed line and Points
X1 and X2 correspond to Points Y2 and Y1 in Figure 8 respectively. The Points X1 and X2 indicate the transition
pressures where there is an unsteady change in flow rate due to variation in magma viscosity. The red dashed line
indicates the calculated flow data from the 2-D particle-mechanics model using the same assumptions, for an
evolving lava dome.
Figures 11.Variation in crystal content at specific times are indicated by Points A - J (dashed line). The resulting
change in yield strength for magma is mapped for different assumed interparticulate resistance (τ0 = 0.1 (dashed red
line) and 0.4 MPa (solid red line)) for the flow rate history given in Figure 8.
Downloaded from https://academic.oup.com/gji/advance-article-abstract/doi/10.1093/gji/ggy073/4904177by Serial Record useron 21 March 2018
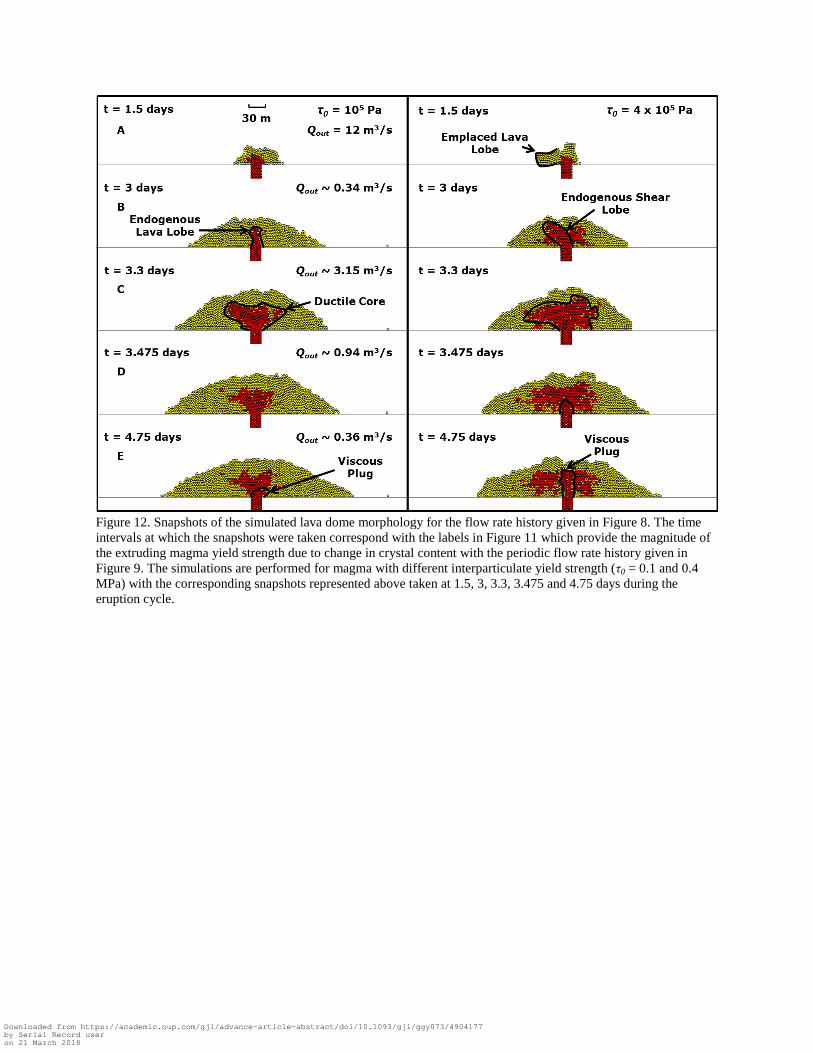
Figure 12. Snapshots of the simulated lava dome morphology for the flow rate history given in Figure 8. The time
intervals at which the snapshots were taken correspond with the labels in Figure 11 which provide the magnitude of
the extruding magma yield strength due to change in crystal content with the periodic flow rate history given in
Figure 9. The simulations are performed for magma with different interparticulate yield strength (τ0 = 0.1 and 0.4
MPa) with the corresponding snapshots represented above taken at 1.5, 3, 3.3, 3.475 and 4.75 days during the
eruption cycle.
Downloaded from https://academic.oup.com/gji/advance-article-abstract/doi/10.1093/gji/ggy073/4904177by Serial Record useron 21 March 2018
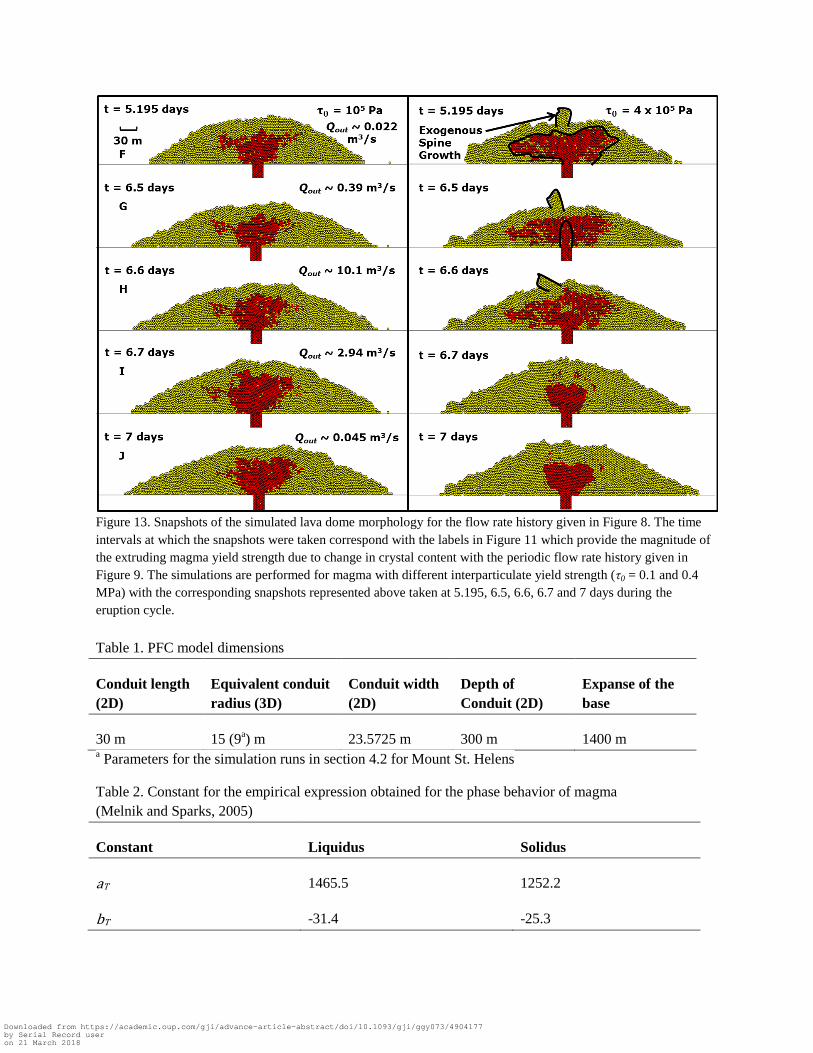
Figure 13. Snapshots of the simulated lava dome morphology for the flow rate history given in Figure 8. The time
intervals at which the snapshots were taken correspond with the labels in Figure 11 which provide the magnitude of
the extruding magma yield strength due to change in crystal content with the periodic flow rate history given in
Figure 9. The simulations are performed for magma with different interparticulate yield strength (τ0 = 0.1 and 0.4
MPa) with the corresponding snapshots represented above taken at 5.195, 6.5, 6.6, 6.7 and 7 days during the
eruption cycle.
Table 1. PFC model dimensions
Conduit length
(2D)
Equivalent conduit
radius (3D)
Conduit width
(2D)
Depth of
Conduit (2D)
Expanse of the
base
30 m 15 (9a) m 23.5725 m 300 m 1400 m
a Parameters for the simulation runs in section 4.2 for Mount St. Helens
Table 2. Constant for the empirical expression obtained for the phase behavior of magma
(Melnik and Sparks, 2005)
Constant Liquidus Solidus
aT 1465.5 1252.2
bT -31.4 -25.3
Downloaded from https://academic.oup.com/gji/advance-article-abstract/doi/10.1093/gji/ggy073/4904177by Serial Record useron 21 March 2018
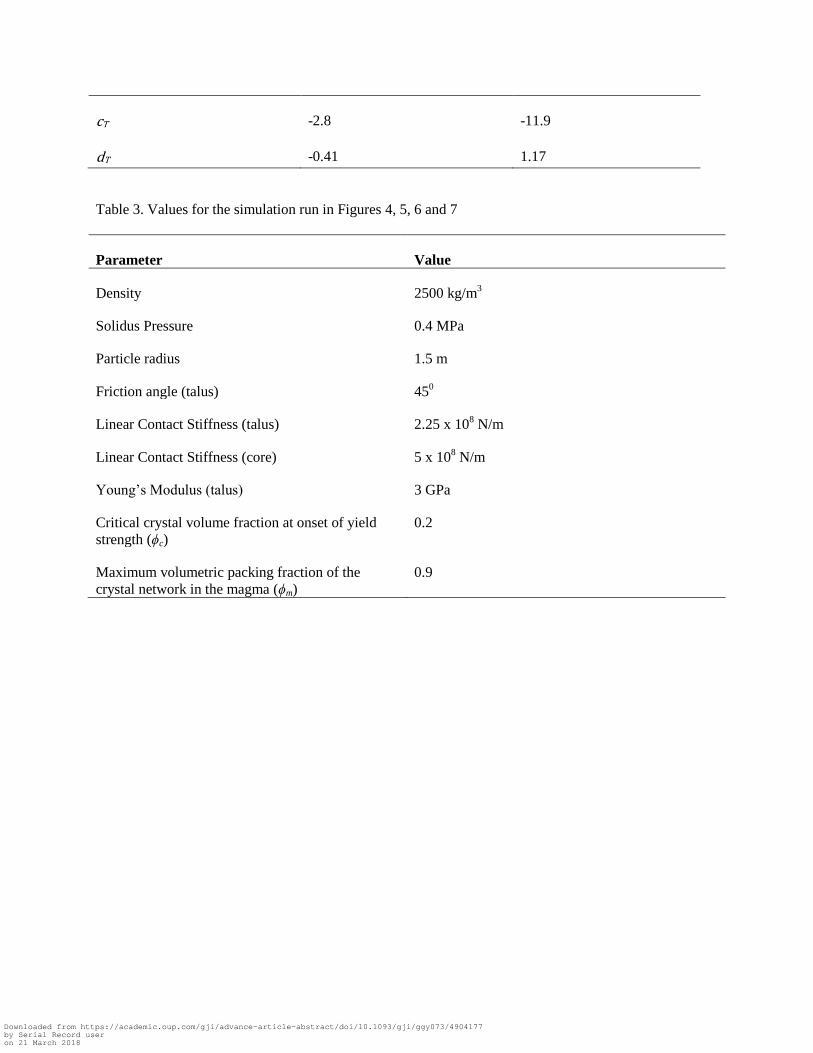
cT -2.8 -11.9
dT -0.41 1.17
Table 3. Values for the simulation run in Figures 4, 5, 6 and 7
Parameter Value
Density 2500 kg/m3
Solidus Pressure 0.4 MPa
Particle radius 1.5 m
Friction angle (talus) 450
Linear Contact Stiffness (talus) 2.25 x 10⁸ N/m
Linear Contact Stiffness (core) 5 x 10⁸ N/m
Young‟s Modulus (talus) 3 GPa
Critical crystal volume fraction at onset of yield
strength (ϕc)
0.2
Maximum volumetric packing fraction of the
crystal network in the magma (ϕm)
0.9
Downloaded from https://academic.oup.com/gji/advance-article-abstract/doi/10.1093/gji/ggy073/4904177by Serial Record useron 21 March 2018
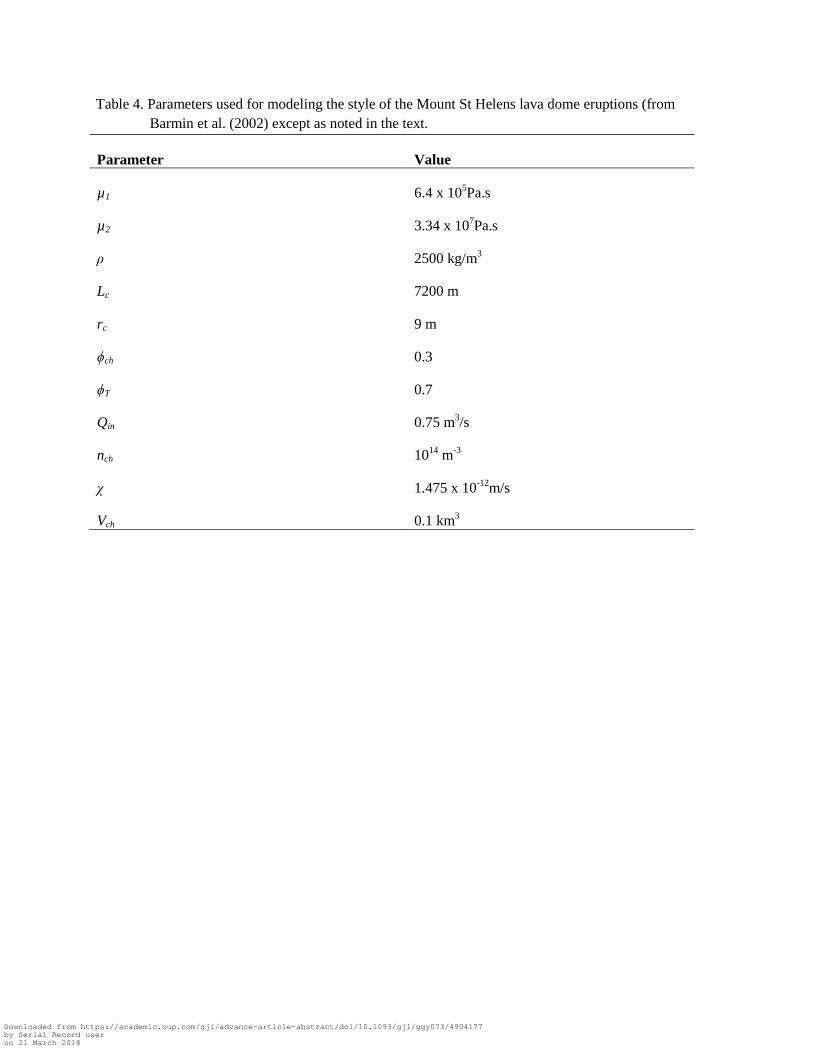
Table 4. Parameters used for modeling the style of the Mount St Helens lava dome eruptions (from
Barmin et al. (2002) except as noted in the text.
Parameter Value
µ1 6.4 x 10⁵Pa.s
µ2 3.34 x 10⁷Pa.s
ρ 2500 kg/m3
Lc 7200 m
rc 9 m
ϕch 0.3
ϕT 0.7
Qin 0.75 m3/s
nch 1014
m-3
χ 1.475 x 10⁻¹²
m/s
Vch 0.1 km3
Downloaded from https://academic.oup.com/gji/advance-article-abstract/doi/10.1093/gji/ggy073/4904177by Serial Record useron 21 March 2018
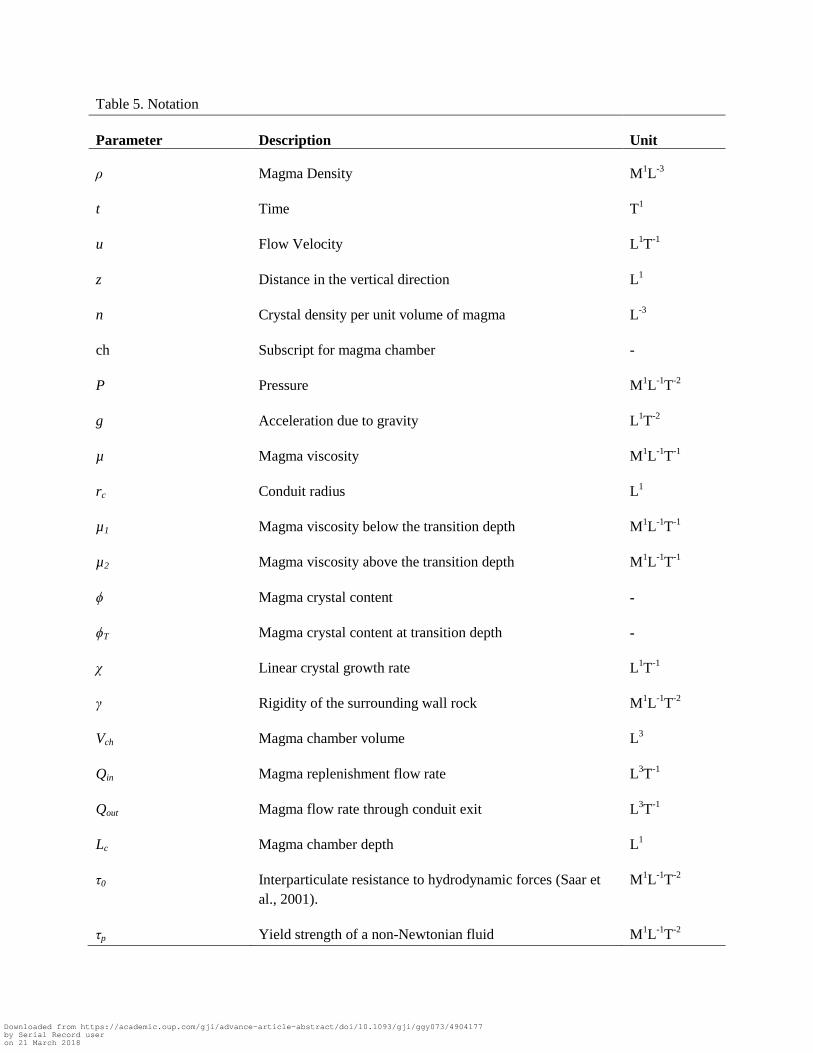
Table 5. Notation
Parameter Description Unit
ρ Magma Density M1L
-3
t Time T1
u Flow Velocity L1T
-1
z Distance in the vertical direction L1
n Crystal density per unit volume of magma L-3
ch Subscript for magma chamber -
P Pressure M1L
-1T
-2
g Acceleration due to gravity L1T
-2
µ Magma viscosity M1L
-1T
-1
rc Conduit radius L1
µ1 Magma viscosity below the transition depth M1L
-1T
-1
µ2 Magma viscosity above the transition depth M1L
-1T
-1
ϕ Magma crystal content -
ϕT Magma crystal content at transition depth -
χ Linear crystal growth rate L1T
-1
γ Rigidity of the surrounding wall rock M1L
-1T
-2
Vch Magma chamber volume L3
Qin Magma replenishment flow rate L3T
-1
Qout Magma flow rate through conduit exit L3T
-1
Lc Magma chamber depth L1
τ0 Interparticulate resistance to hydrodynamic forces (Saar et
al., 2001).
M1L
-1T
-2
τp Yield strength of a non-Newtonian fluid M1L
-1T
-2
Downloaded from https://academic.oup.com/gji/advance-article-abstract/doi/10.1093/gji/ggy073/4904177by Serial Record useron 21 March 2018
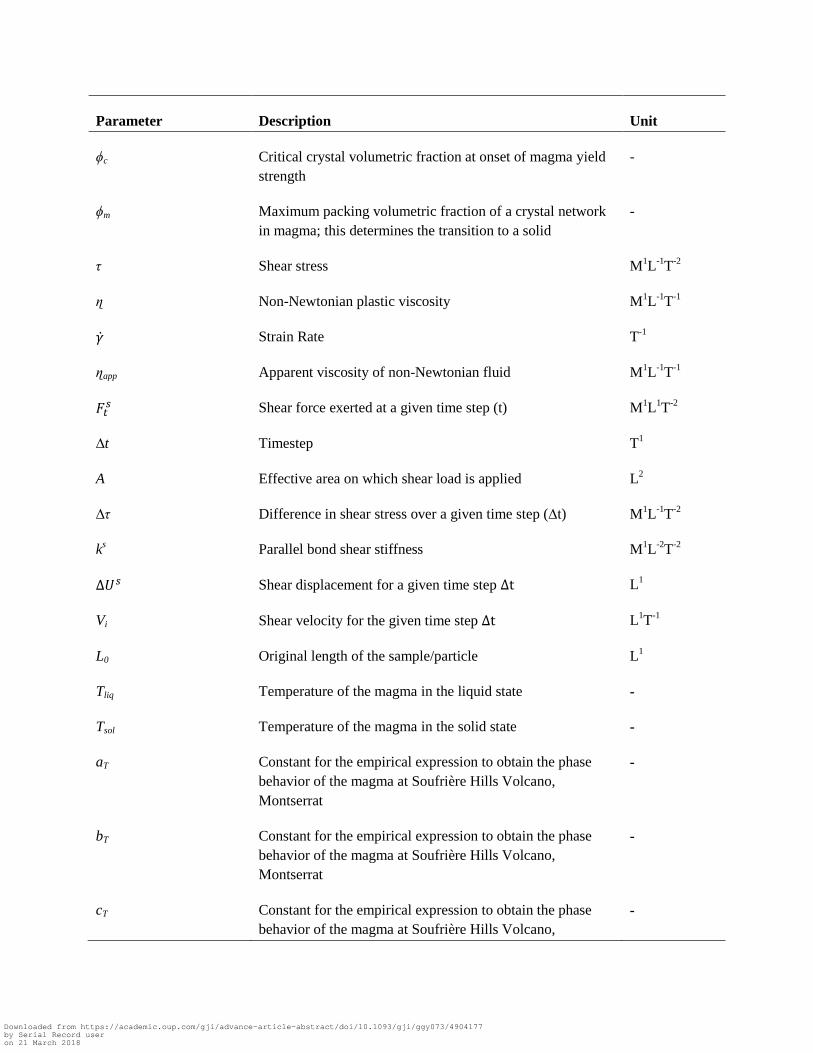
Parameter Description Unit
ϕc Critical crystal volumetric fraction at onset of magma yield
strength
-
ϕm Maximum packing volumetric fraction of a crystal network
in magma; this determines the transition to a solid
-
τ Shear stress M1L
-1T
-2
ɳ Non-Newtonian plastic viscosity M1L
-1T
-1
Strain Rate T-1
ɳapp Apparent viscosity of non-Newtonian fluid M1L
-1T
-1
Shear force exerted at a given time step (t) M1L
1T
-2
∆t Timestep T1
A Effective area on which shear load is applied L2
∆τ Difference in shear stress over a given time step (∆t) M1L
-1T
-2
ks Parallel bond shear stiffness M
1L
-2T
-2
Shear displacement for a given time step L1
Vi Shear velocity for the given time step L1T
-1
L0 Original length of the sample/particle L1
Tliq Temperature of the magma in the liquid state -
Tsol Temperature of the magma in the solid state -
aT Constant for the empirical expression to obtain the phase
behavior of the magma at Soufrière Hills Volcano,
Montserrat
-
bT Constant for the empirical expression to obtain the phase
behavior of the magma at Soufrière Hills Volcano,
Montserrat
-
cT Constant for the empirical expression to obtain the phase
behavior of the magma at Soufrière Hills Volcano,
-
Downloaded from https://academic.oup.com/gji/advance-article-abstract/doi/10.1093/gji/ggy073/4904177by Serial Record useron 21 March 2018
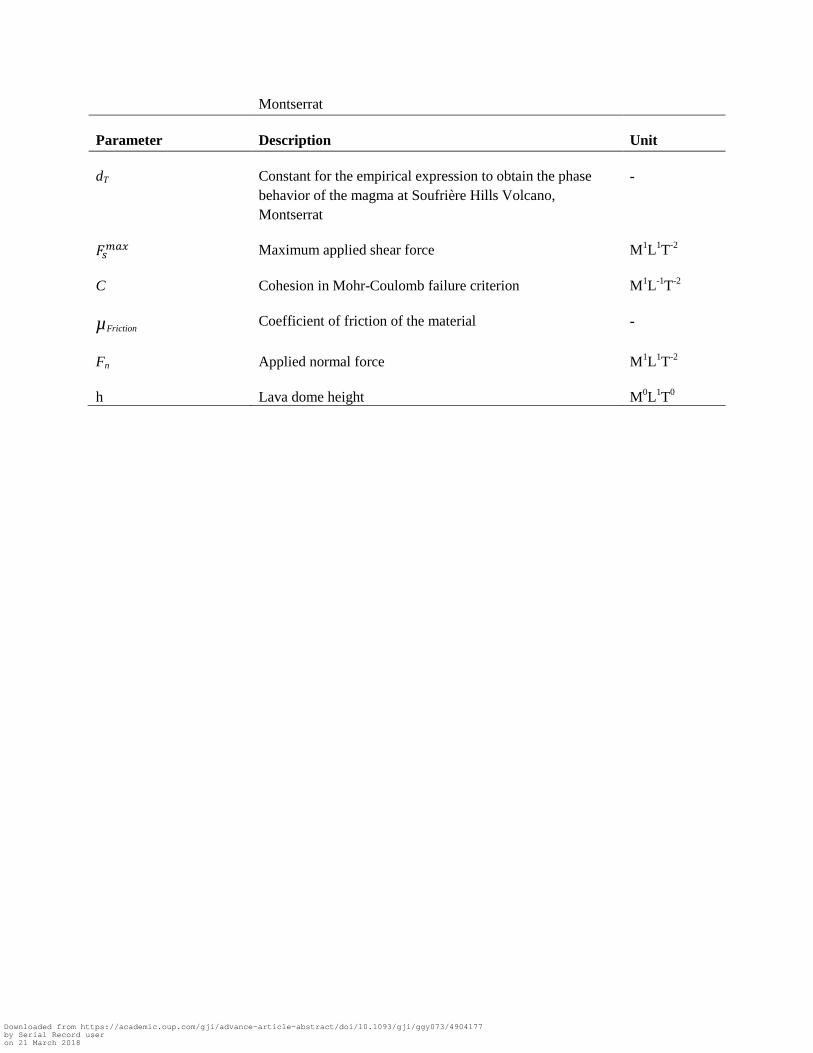
Montserrat
Parameter Description Unit
dT Constant for the empirical expression to obtain the phase
behavior of the magma at Soufrière Hills Volcano,
Montserrat
-
Maximum applied shear force M
1L
1T
-2
C Cohesion in Mohr-Coulomb failure criterion M1L
-1T
-2
µFriction Coefficient of friction of the material -
Fn Applied normal force M1L
1T
-2
h Lava dome height M0L
1T
0
Downloaded from https://academic.oup.com/gji/advance-article-abstract/doi/10.1093/gji/ggy073/4904177by Serial Record useron 21 March 2018